
|
|
|
|
|
|
|
|
|
|
Previous: PROVIDENT BANKSHARES CORP, 8-K, EX-99.1, 2000-10-19 |
Next: COVA SERIES TRUST, 497, 2000-10-19 |
Funds
Semiannual Report
August 31, 2000
(2_fidelity_logos) (Registered_Trademark)
|
President's Message |
Ned Johnson on investing strategies. |
|
|
|
||
|
Spartan Total Market Index Fund |
Performance |
|
|
|
Fund Talk: The Manager's Overview |
|
|
|
Investment Changes |
|
|
|
Investments |
|
|
|
Financial Statements |
|
|
|
||
|
Spartan Extended Market Index Fund |
Performance |
|
|
|
Fund Talk: The Manager's Overview |
|
|
|
Investment Changes |
|
|
|
Investments |
|
|
|
Financial Statements |
|
|
|
||
|
Spartan International Index Fund |
Performance |
|
|
|
Fund Talk: The Manager's Overview |
|
|
|
Investment Changes |
|
|
|
Investments |
|
|
|
Financial Statements |
|
|
|
||
|
Notes |
Notes to the Financial Statements. |
|
|
|
||
Standard & Poor's 500, S&P, and S&P 500 are registered service marks of The McGraw-Hill Companies, Inc. and have been licensed for use by
Fidelity Distributors Corporation.
Other third party marks appearing herein are the property of their respective owners.
All other marks appearing herein are registered or unregistered trademarks or service marks of FMR Corp. or an affiliated company.
(Recycle graphic) This report is printed on recycled paper using soy-based inks.
The views expressed in this report reflect those of Bankers Trust only through the end of the period of the report as stated on the cover and do not necessarily represent the views of Fidelity or any other person in the Fidelity organization. Any such views are subject to change at any time based upon market or other conditions and Fidelity disclaims any responsibility to update such views. These views may not be relied on as investment advice and, because investment decisions for a Fidelity fund are based on numerous factors, may not be relied on as an indication of trading intent on behalf of any Fidelity fund.
This report and the financial statements contained herein are submitted for the general information of the shareholders of the funds. This report is not authorized for distribution to prospective investors in the funds unless preceded or accompanied by an effective prospectus.
Mutual fund shares are not deposits or obligations of, or guaranteed by, any depository institution. Shares are not insured by the FDIC, Federal Reserve Board or any other agency, and are subject to investment risks, including possible loss of principal amount invested.
Neither the funds nor Fidelity Distributors Corporation is a bank.
For more information on any Fidelity fund, including charges and expenses, call 1-800-544-6666 for a free prospectus. Read it carefully before you invest or send money.
Semiannual Report
(Photograph of Edward C. Johnson 3d.)
Dear Shareholder:
A slowing U.S. economy triggered an equity market rally during the later stages of summer, boosting most major stock indexes back into positive territory for calendar year 2000. One notable exception, however, was the Dow Jones Industrial Average, which posted a negative return during that timeframe. Fixed-income markets - particularly Treasuries - continued their yearlong trend of strong performance, as nearly every bond sector outperformed the stock market on a year-to-date basis.
While it's impossible to predict the future direction of the markets with any degree of certainty, there are certain basic principles that can help investors plan for their future needs.
First, investors are encouraged to take a long-term view of their portfolios. If you can afford to leave your money invested through the inevitable up and down cycles of the financial markets, you will greatly reduce your vulnerability to any single decline. We know from experience, for example, that stock prices have gone up over longer periods of time, have significantly outperformed other types of investments and have stayed ahead of inflation.
Second, you can further manage your investing risk through diversification. A stock mutual fund, for instance, is already diversified, because it invests in many different companies. You can increase your diversification further by investing in a number of different stock funds, or in such other investment categories as bonds. If you have a short investment time horizon, you might want to consider moving some of your investment into a money market fund, which seeks income and a stable share price by investing in high-quality, short-term investments. Of course, it's important to remember that an investment in a money market fund is not insured or guaranteed by the Federal Deposit Insurance Corporation or any other government agency. Although money market funds seek to preserve the value of your investment at $1.00 per share, it is possible to lose money by investing in these types of funds.
Finally, no matter what your time horizon or portfolio diversity, it makes good sense to follow a regular investment plan, investing a certain amount of money in a fund at the same time each month or quarter and periodically reviewing your overall portfolio. By doing so, you won't get caught up in the excitement of a rapidly rising market, nor will you buy all your shares at market highs. While this strategy - known as dollar cost averaging - won't assure a profit or protect you from a loss in a declining market, it should help you lower the average cost of your purchases. Of course, you should consider your financial ability to continue your purchases through periods of low price levels before undertaking such a strategy.
If you have questions, please call us at 1-800-544-6666, or visit our web site at www.fidelity.com. We are available 24 hours a day, seven days a week to provide you the information you need to make the investments that are right for you.
Best regards,
/s/Edward C. Johnson 3d
Edward C. Johnson 3d
Semiannual Report
There are several ways to evaluate a fund's historical performance. You can look at the total percentage change in value, the average annual percentage change or the growth of a hypothetical $10,000 investment. Total return reflects the change in the value of an investment, assuming reinvestment of the fund's dividend income and capital gains (the profits earned upon the sale of securities that have grown in value). If Fidelity had not reimbursed certain fund expenses, the total returns would have been lower.
Cumulative Total Returns
|
Periods ended August 31, 2000 |
Past 6 |
Past 1 |
Life of |
|
Spartan Total Market Index |
6.12% |
19.70% |
64.24% |
|
Wilshire 5000 Total Market |
6.32% |
20.00% |
62.33% |
|
Growth & Income Funds Average |
12.83% |
13.70% |
n/a* |
Cumulative total returns show the fund's performance in percentage terms over a set period - in this case, six months, one year or since the fund started on November 5, 1997. For example, if you had invested $1,000 in a fund that had a 5% return over the past year, the value of your investment would be $1,050. You can compare the fund's return to the performance of the Wilshire 5000 Total Market Index (Wilshire 5000) - a market capitalization-weighted index of approximately 7,000 U.S. equity securities. The index contains all actively traded common stocks with readily available price data traded on the New York Stock Exchange, American Stock Exchange, and NASDAQ. To measure how the fund's performance stacked up against its peers, you can compare it to the growth & income funds average, which reflects the performance of mutual funds with similar objectives tracked by Lipper Inc. The past six months average represents a peer group of 1,025 mutual funds. These benchmarks include reinvested dividends and capital gains, if any, and exclude the effect of sales charges. Lipper has created new comparison categories that group funds according to portfolio characteristics and capitalization, as well as by capitalization only. These averages are listed on the bottom of this page.(dagger)
Average Annual Total Returns
|
Periods ended August 31, 2000 |
Past 1 |
Life of |
|
Spartan Total Market Index |
19.70% |
19.22% |
|
Wilshire 5000 Total Market |
20.00% |
18.73% |
|
Growth & Income Funds Average |
13.70% |
n/a* |
Average annual total returns take the fund's cumulative return and show you what would have happened if the fund had performed at a constant rate each year.
* Not available
(dagger) The Lipper multi-cap core funds average reflects the performance (excluding sales charges) of mutual funds with similar portfolio characteristics and capitalization. The Lipper multi-cap supergroup average reflects the performance (excluding sales charges) of mutual funds with similar capitalization. As of August 31, 2000, the six month and one year cumulative total returns for the multi-cap core funds average were 9.71% and 23.95%, respectively. The one year average annual return was 23.95%. The six month and one year cumulative total returns for the Lipper multi-cap supergroup was 8.95% and 30.43%, respectively. The one year average annual return was 30.43%.
$10,000 Over Life of Fund
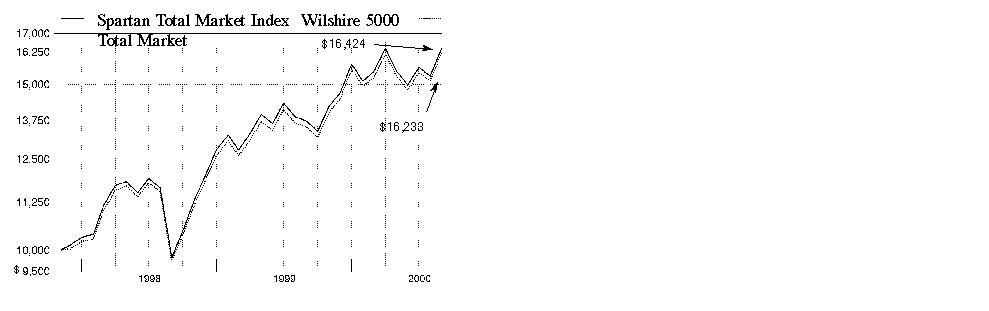
$10,000 Over Life of Fund: Let's say hypothetically that $10,000 was invested in Spartan Total Market Index Fund on November 5, 1997, when the fund started. As the chart shows, by August 31, 2000, the value of the investment would have been $16,424 - a 64.24% increase on the initial investment. For comparison, look at how the Wilshire 5000 did over the same period. With dividends and capital gains, if any, reinvested, the same $10,000 investment would have been $16,233 - a 62.33% increase.
Understanding Performance
How a fund did yesterday is no guarantee of how it will do tomorrow. The stock market, for example, has a history of long-term growth and short-term volatility. In turn, the share price and return of a fund that invests in stocks will vary. That means if you sell your shares during a market downturn, you might lose money. But if you can ride out the market's ups and downs, you may have a gain.
3Semiannual Report
(Portfolio Manager photograph)
An interview with
Dean Barr, who oversees the Spartan Total Market Index Fund's investment management personnel as
Managing Director for Bankers Trust, sub-adviser of the fund
Q. How did the fund perform, Dean?
A. For the six months that ended August 31, 2000, the fund returned 6.12%, while the Wilshire 5000 Total Market Index returned 6.32%. In comparison, the growth & income funds average tracked by Lipper Inc. returned 12.83%. For the 12 months that ended August 31, 2000, the fund returned 19.70%, while the Wilshire 5000 index and Lipper average returned 20.00% and 13.70%, respectively.
Q. How would you describe the market environment during the six-month period?
A. It was one marked by historically high levels of volatility and rapid sector rotations. Concerns about seemingly overstretched valuations and further tightening by the Federal Reserve Board sent jittery investors fleeing smaller-sized tech stocks in droves for the perceived predictability of large, well-established companies elsewhere in the market. This group of big-cap stocks rose sharply in response, helping to offset the losses incurred by smaller-cap stocks. Midway through the period, investors - sensing a slowing economy and an end to the Fed's yearlong tightening cycle - eased their way back into tech stocks, this time focusing on seasoned growth companies with demonstrated revenues and earnings. However, earnings worries related to a decelerating economy tempered optimism surrounding rates and spawned confusion and persistent volatility during the summer months, with few industries enjoying market leadership for long. With the Fed choosing not to raise rates in August, stocks staged a "relief rally," with tech shares reclaiming the lead for the first time since early March.
Q. Which segments of the market scored the highest gains during the period?
A. The finance sector laid claim to some of the period's best performers, many of which emerged from the brokerage and investment management spaces. Strong capital markets activity, combined with industry consolidation, painted a healthy backdrop for key players such as Citigroup and Morgan Stanley Dean Witter. Not to be left out, insurance stocks also performed well, posting gains on signs of margin improvement. American International Group was the standout here. Not too far behind were pharmaceuticals, the lifeblood of the health sector. Drug stocks such as Pfizer - which traditionally outperform in a slowing economy - rallied behind exciting new product pipelines and industry consolidation. Rising oil and gas prices resulting from supply shortages sparked the energy sector, led by top contributors Anadarko Petroleum and Exxon Mobil. Offsetting these gains were lagging retailers, such as Home Depot, and traditional telecommunications providers, such as AT&T.
Q. What determined the fate of tech stocks during the period?
A. Following the spring swoon, blue-chip tech names - such as Intel and Oracle - received the bulk of the support from valuation-conscious investors seeking quality of earnings and industry leadership. With corporate America spending hand over fist for new technology, firms engaged in the build-out of Internet infrastructure gained widespread appeal with investors. Attempting to satisfy the growing need for communications bandwidth, networking and telecommunications equipment providers Juniper and Corning enjoyed strong advances. Overall, it was a mixed bag for semiconductor companies, with many stocks struggling to shake off their Y2K hangovers. Communications chip manufacturers benefited as a play on Internet infrastructure, led by the impressive run-up in stocks including Altera and Advanced Micro Devices. Similarly, database and e-commerce software providers Oracle and Siebel Systems also were big winners, as were leaders in the data storage space, such as EMC and Network Appliance. Additionally, computer hardware heavyweights Sun Microsystems and IBM performed well, recovering nicely in August. Conversely, those stocks that fought a losing battle throughout the period included Microsoft, Qualcomm, Lucent, Motorola and CMGI.
Q. What's your outlook?
A. It appears as if the economy is poised for a soft landing, though it's still too early to know for sure. Inaction on the rate front of late by the Fed tells me that growth is slowing enough right now to keep rates steady for at least the time being. Technology-enabled productivity gains, coupled with slower economic growth, should help neutralize spiking energy prices and keep inflation under wraps. Combine that with the presidential election, and I think we may see a Fed that's on hold for the remainder of 2000. Robust tech spending should further dampen inflationary pressures and keep corporate profits rising. If so, I expect growth stocks to prosper and continue to outperform in the coming months.
The views expressed in this report reflect those of Bankers Trust only through the end of the period of the report as stated on the cover. Any such views are subject to change at any time based on market or other conditions. For more information, see page 2.
Fund Facts
Goal: seeks to provide investment results that correspond to the total return of a broad range of United States stocks
Fund number: 397
Trading symbol: FSTMX
Start date: November 5, 1997
Size: as of August 31, 2000, more than $1.1 billion
Sub-adviser: Bankers Trust, since inception
3Semiannual Report
Spartan Total Market Index Fund
|
Top Ten Stocks as of August 31, 2000 |
||
|
|
% of fund's |
% of fund's net assets |
|
General Electric Co. |
3.5 |
2.7 |
|
Intel Corp. |
3.0 |
2.4 |
|
Cisco Systems, Inc. |
2.8 |
2.7 |
|
Microsoft Corp. |
2.2 |
2.9 |
|
Exxon Mobil Corp. |
1.7 |
1.7 |
|
Pfizer, Inc. |
1.6 |
0.8 |
|
Citigroup, Inc. |
1.6 |
1.1 |
|
Oracle Corp. |
1.5 |
1.3 |
|
International Business |
1.4 |
1.2 |
|
EMC Corp. |
1.3 |
0.8 |
|
|
20.6 |
17.6 |
|
Top Ten Market Sectors as of August 31, 2000 |
||
|
|
% of fund's |
% of fund's net assets |
|
Technology |
34.2 |
35.8 |
|
Finance |
14.3 |
11.5 |
|
Health |
10.2 |
9.4 |
|
Utilities |
8.9 |
10.5 |
|
Industrial Machinery |
5.0 |
4.2 |
|
Media & Leisure |
4.8 |
5.5 |
|
Energy |
4.4 |
4.1 |
|
Retail & Wholesale |
4.3 |
4.9 |
|
Nondurables |
4.0 |
4.1 |
|
Basic Industries |
2.6 |
2.8 |
Semiannual Report
Spartan Total Market Index Fund
(Unaudited)
Showing Percentage of Net Assets
|
Common Stocks - 99.3% |
|||
|
Shares |
Value (Note 1) |
||
|
AEROSPACE & DEFENSE - 1.1% |
|||
|
Aerospace & Defense - 0.9% |
|||
|
AAR Corp. |
850 |
$ 9,563 |
|
|
Advanced Aerodynamics & |
600 |
1,500 |
|
|
Alliant Techsystems, Inc. (a) |
2,108 |
162,448 |
|
|
Aviall, Inc. (a) |
2,800 |
16,800 |
|
|
BE Aerospace, Inc. (a) |
6,100 |
98,744 |
|
|
BFGoodrich Co. |
6,862 |
280,055 |
|
|
Blount International, Inc. (a) |
800 |
6,700 |
|
|
Boeing Co. |
63,500 |
3,405,188 |
|
|
Datron Systems, Inc. (a) |
3,400 |
49,088 |
|
|
Harsco Corp. |
2,400 |
66,750 |
|
|
Honeywell International, Inc. |
52,675 |
2,031,280 |
|
|
ITT Industries, Inc. |
5,800 |
195,025 |
|
|
Kellstrom Industries, Inc. (a) |
800 |
4,100 |
|
|
Lockheed Martin Corp. |
27,077 |
768,310 |
|
|
Northrop Grumman Corp. |
4,900 |
381,281 |
|
|
Orbital Sciences Corp. (a) |
1,700 |
15,194 |
|
|
Precision Castparts Corp. |
2,200 |
167,200 |
|
|
Rockwell International Corp. |
13,200 |
533,775 |
|
|
Standex International Corp. |
100 |
1,856 |
|
|
Sturm Ruger & Co., Inc. |
300 |
2,494 |
|
|
Textron, Inc. |
11,600 |
650,325 |
|
|
United Technologies Corp. |
32,671 |
2,039,896 |
|
|
Woodward Governor Co. |
1,600 |
63,400 |
|
|
|
10,950,972 |
||
|
Defense Electronics - 0.1% |
|||
|
Alpha Industries, Inc. (a) |
5,000 |
252,188 |
|
|
Anaren Microwave, Inc. (a) |
1,450 |
171,191 |
|
|
Ashton Technology Group, Inc. (a) |
4,800 |
17,250 |
|
|
Comarco, Inc. (a) |
300 |
9,450 |
|
|
Giga-Tronics, Inc. (a) |
2,400 |
19,800 |
|
|
Herley Industries, Inc. (a) |
3,600 |
66,375 |
|
|
Raytheon Co. Class B |
22,900 |
636,906 |
|
|
REMEC, Inc. (a) |
4,200 |
119,700 |
|
|
|
1,292,860 |
||
|
Ship Building & Repair - 0.1% |
|||
|
Dril-Quip, Inc. (a) |
1,000 |
45,438 |
|
|
General Dynamics Corp. |
12,900 |
811,894 |
|
|
Newport News Shipbuilding, Inc. |
3,100 |
131,750 |
|
|
|
989,082 |
||
|
TOTAL AEROSPACE & DEFENSE |
13,232,914 |
||
|
BASIC INDUSTRIES - 2.6% |
|||
|
Chemicals & Plastics - 1.5% |
|||
|
A. Schulman, Inc. |
2,300 |
27,744 |
|
|
Aceto Corp. |
600 |
5,925 |
|
|
AEP Industries, Inc. (a) |
600 |
17,738 |
|
|
Air Products & Chemicals, Inc. |
16,100 |
584,631 |
|
|
Airgas, Inc. (a) |
5,200 |
34,450 |
|
|
|
|||
|
Shares |
Value (Note 1) |
||
|
Albemarle Corp. |
3,240 |
$ 80,393 |
|
|
American Pacific Corp. (a) |
800 |
4,300 |
|
|
American Vanguard Corp. |
400 |
2,975 |
|
|
Arch Chemicals, Inc. |
1,600 |
29,100 |
|
|
Armstrong Holdings, Inc. |
6,900 |
109,969 |
|
|
Ashland, Inc. |
7,800 |
274,950 |
|
|
Associated Materials, Inc. |
600 |
9,600 |
|
|
Atlantis Plastics, Inc. Class A (a) |
600 |
3,300 |
|
|
ATMI, Inc. (a) |
3,100 |
83,070 |
|
|
Avery Dennison Corp. |
7,900 |
427,094 |
|
|
Balchem Corp. |
500 |
5,594 |
|
|
Bush Boake Allen, Inc. (a) |
1,400 |
61,425 |
|
|
Cabot Corp. |
4,700 |
173,900 |
|
|
Cabot Microelectronics Corp. |
700 |
40,863 |
|
|
Carbide/Graphite Group, Inc. (a) |
5,100 |
22,950 |
|
|
CFC International, Inc. (a) |
600 |
4,200 |
|
|
Channell Commercial Corp. (a) |
800 |
10,700 |
|
|
ChemFirst, Inc. |
1,200 |
27,675 |
|
|
ChinaB2BSourcing.com, Inc. (a) |
500 |
2,938 |
|
|
Crompton Corp. |
8,171 |
73,539 |
|
|
Cytec Industries, Inc. (a) |
2,900 |
96,788 |
|
|
Diversa Corp. |
400 |
11,400 |
|
|
Dow Chemical Co. |
47,300 |
1,238,669 |
|
|
E.I. du Pont de Nemours and Co. |
73,185 |
3,284,177 |
|
|
Eastman Chemical Co. |
5,400 |
232,875 |
|
|
Engelhard Corp. |
9,000 |
168,750 |
|
|
Environmental Technologies Corp. (a) |
700 |
10,413 |
|
|
Ethyl Corp. |
400 |
825 |
|
|
First Years, Inc. |
800 |
8,800 |
|
|
Flamemaster Corp. |
400 |
2,550 |
|
|
FMC Corp. (a) |
3,600 |
244,125 |
|
|
Foamex International, Inc. (a) |
2,000 |
11,625 |
|
|
Geon Co. |
1,900 |
33,131 |
|
|
Georgia Gulf Corp. |
2,300 |
29,900 |
|
|
Great Lakes Chemical Corp. |
3,900 |
131,625 |
|
|
H.B. Fuller Co. |
3,200 |
109,800 |
|
|
Hawkins Chemicals, Inc. |
1,000 |
7,750 |
|
|
Hercules, Inc. |
7,600 |
100,700 |
|
|
IMC Global, Inc. |
8,100 |
118,969 |
|
|
International Specialty Products, Inc. (a) |
5,100 |
29,325 |
|
|
Ivex Packaging Corp. (a) |
1,600 |
17,600 |
|
|
Lamson & Sessions Co. (a) |
2,300 |
45,425 |
|
|
LESCO, Inc. |
3,100 |
54,444 |
|
|
Lubrizol Corp. |
3,800 |
82,413 |
|
|
Lyondell Chemical Co. |
8,300 |
108,419 |
|
|
M.A. Hanna Co. |
3,700 |
30,756 |
|
|
MacDermid, Inc. |
2,200 |
55,000 |
|
|
Medical Manager Corp. (a) |
2,937 |
128,494 |
|
|
Millennium Chemicals, Inc. |
4,800 |
79,200 |
|
|
Minerals Technologies, Inc. |
1,500 |
77,813 |
|
|
Myers Industries, Inc. |
1,650 |
23,100 |
|
|
Newell Rubbermaid, Inc. |
18,501 |
479,870 |
|
|
NL Industries, Inc. |
3,600 |
83,925 |
|
|
North American Scientific, Inc. (a) |
3,400 |
82,025 |
|
|
Common Stocks - continued |
|||
|
Shares |
Value (Note 1) |
||
|
BASIC INDUSTRIES - continued |
|||
|
Chemicals & Plastics - continued |
|||
|
NuCo2, Inc. (a) |
700 |
$ 5,163 |
|
|
Oil-Dri Corp. of America |
600 |
5,663 |
|
|
Olin Corp. |
3,300 |
54,450 |
|
|
OM Group, Inc. |
1,700 |
80,538 |
|
|
Pharmacia Corp. |
88,100 |
5,159,356 |
|
|
PPG Industries, Inc. |
12,400 |
502,200 |
|
|
Praxair, Inc. |
11,000 |
486,750 |
|
|
PW Eagle, Inc. (a) |
700 |
11,988 |
|
|
Quaker Chemical Corp. |
700 |
11,288 |
|
|
Rohm & Haas Co. |
15,296 |
442,628 |
|
|
Scotts Co. Class A (a) |
2,000 |
62,000 |
|
|
Sealed Air Corp. (a) |
5,860 |
300,691 |
|
|
Solutia, Inc. |
11,600 |
174,725 |
|
|
Southwall Technologies, Inc. (a) |
800 |
4,900 |
|
|
Spartech Corp. |
2,000 |
49,500 |
|
|
Stepan Co. |
700 |
14,613 |
|
|
Summa Industries, Inc. (a) |
500 |
6,094 |
|
|
Sybron Chemical Industry Corp. (a) |
500 |
17,219 |
|
|
Synalloy Corp. |
700 |
4,638 |
|
|
Terra Industries, Inc. (a) |
400 |
625 |
|
|
Tredegar Industries, Inc. |
2,700 |
52,650 |
|
|
Triple S Plastics, Inc. (a) |
300 |
9,600 |
|
|
Tuscarora Plastics, Inc. |
800 |
11,400 |
|
|
Union Carbide Corp. |
9,500 |
380,594 |
|
|
Uniroyal Technology Corp. (a) |
1,900 |
32,063 |
|
|
USEC, Inc. |
15,300 |
66,938 |
|
|
Valhi, Inc. |
8,200 |
105,063 |
|
|
Valspar Corp. |
3,000 |
88,500 |
|
|
W.R. Grace & Co. (a) |
4,900 |
38,894 |
|
|
Wellman, Inc. |
1,300 |
15,681 |
|
|
|
17,536,116 |
||
|
Iron & Steel - 0.1% |
|||
|
AK Steel Holding Corp. |
8,263 |
89,860 |
|
|
Allegheny Technologies, Inc. |
9,614 |
209,105 |
|
|
APW Ltd. (a) |
3,000 |
132,000 |
|
|
Barnes Group, Inc. |
700 |
13,606 |
|
|
Bethlehem Steel Corp. (a) |
24,204 |
84,714 |
|
|
Birmingham Steel Corp. |
1,100 |
3,094 |
|
|
Carpenter Technology Corp. |
1,200 |
39,000 |
|
|
Cleveland-Cliffs, Inc. |
3,000 |
75,375 |
|
|
Commercial Metals Co. |
600 |
16,763 |
|
|
Crane Co. |
2,200 |
55,275 |
|
|
Gibraltar Steel Corp. |
100 |
1,750 |
|
|
LTV Corp. |
1,500 |
2,719 |
|
|
Material Sciences Corp. (a) |
1,300 |
13,650 |
|
|
Mueller Industries, Inc. |
2,000 |
63,125 |
|
|
National Steel Corp. Class B |
1,800 |
7,313 |
|
|
NS Group, Inc. (a) |
800 |
14,100 |
|
|
Nucor Corp. |
5,900 |
216,825 |
|
|
Oregon Steel Mills, Inc. |
700 |
1,794 |
|
|
SPS Technologies, Inc. (a) |
600 |
28,238 |
|
|
|
|||
|
Shares |
Value (Note 1) |
||
|
Steel Dynamics, Inc. (a) |
2,300 |
$ 27,888 |
|
|
Titan International, Inc. |
600 |
3,038 |
|
|
USX - U.S. Steel Group |
9,600 |
166,800 |
|
|
Watts Industries, Inc. Class A |
900 |
10,125 |
|
|
WHX Corp. (a) |
500 |
1,906 |
|
|
Worthington Industries, Inc. |
11,900 |
124,206 |
|
|
|
1,402,269 |
||
|
Metals & Mining - 0.3% |
|||
|
Alcoa, Inc. |
60,532 |
2,012,689 |
|
|
Amcol International Corp. |
400 |
1,325 |
|
|
Belden, Inc. |
2,700 |
70,538 |
|
|
Brush Engineered Materials, Inc. |
100 |
2,338 |
|
|
Century Aluminum Co. |
500 |
6,531 |
|
|
Commonwealth Industries, Inc. |
500 |
2,531 |
|
|
CommScope, Inc. (a) |
4,300 |
107,231 |
|
|
Encore Wire Corp. (a) |
4,700 |
36,131 |
|
|
Freeport-McMoRan Copper & Gold, Inc. Class B (a) |
14,700 |
144,244 |
|
|
General Cable Corp. |
1,100 |
9,213 |
|
|
Hecla Mining Co. (a) |
18,600 |
16,275 |
|
|
Kaiser Aluminum Corp. (a) |
1,400 |
7,963 |
|
|
Martin Marietta Materials, Inc. |
5,400 |
216,000 |
|
|
Matthews International Corp. Class A |
400 |
11,600 |
|
|
Optical Cable Corp. (a) |
3,500 |
137,813 |
|
|
Phelps Dodge Corp. |
5,172 |
230,154 |
|
|
Quanex Corp. |
400 |
7,475 |
|
|
Reliance Steel & Aluminum Co. |
1,400 |
28,875 |
|
|
RTI International Metals, Inc. (a) |
600 |
8,438 |
|
|
Ryerson Tull, Inc. |
711 |
6,710 |
|
|
Super Vision International, Inc. |
3,300 |
23,100 |
|
|
Superior Telecom, Inc. |
515 |
4,345 |
|
|
Titanium Metals Corp. |
4,200 |
36,750 |
|
|
Tremont Corp. |
200 |
6,450 |
|
|
U.S. Aggregates, Inc. |
400 |
6,900 |
|
|
Wolverine Tube, Inc. (a) |
200 |
3,325 |
|
|
|
3,144,944 |
||
|
Packaging & Containers - 0.1% |
|||
|
Alltrista Corp. (a) |
500 |
10,906 |
|
|
Ball Corp. |
2,200 |
76,175 |
|
|
Bemis Co., Inc. |
3,200 |
107,200 |
|
|
Crown Cork & Seal Co., Inc. |
12,100 |
156,544 |
|
|
Greif Brothers Corp. Class A |
900 |
25,988 |
|
|
Liqui-Box Corp. |
400 |
17,100 |
|
|
Longview Fibre Co. |
2,200 |
25,025 |
|
|
Owens-Illinois, Inc. (a) |
9,900 |
129,319 |
|
|
Packaging Corp. of America |
9,300 |
108,694 |
|
|
Sonoco Products Co. |
6,150 |
118,772 |
|
|
Tupperware Corp. |
3,800 |
76,713 |
|
|
U.S. Can Corp. (a) |
300 |
5,738 |
|
|
|
858,174 |
||
|
Paper & Forest Products - 0.6% |
|||
|
Albany International Corp. Class A |
1,000 |
13,938 |
|
|
Common Stocks - continued |
|||
|
Shares |
Value (Note 1) |
||
|
BASIC INDUSTRIES - continued |
|||
|
Paper & Forest Products - continued |
|||
|
American Biltrite, Inc. |
400 |
$ 5,150 |
|
|
American Pad & Paper Co. (a) |
100 |
5 |
|
|
Boise Cascade Corp. |
5,600 |
167,300 |
|
|
Bowater, Inc. |
5,800 |
297,975 |
|
|
Buckeye Technologies, Inc. (a) |
1,700 |
42,394 |
|
|
Caraustar Industries, Inc. |
900 |
13,894 |
|
|
Chesapeake Corp. |
500 |
11,938 |
|
|
Consolidated Papers, Inc. |
6,000 |
235,875 |
|
|
Fort James Corp. |
13,900 |
439,588 |
|
|
Georgia-Pacific Corp. |
11,200 |
299,600 |
|
|
Georgia-Pacific Corp. - Timber Group |
5,300 |
155,356 |
|
|
International Paper Co. |
33,272 |
1,060,545 |
|
|
Kimberly-Clark Corp. |
38,738 |
2,266,173 |
|
|
Louisiana-Pacific Corp. |
10,800 |
114,075 |
|
|
Mail-Well, Inc. (a) |
1,500 |
10,875 |
|
|
MCSi, Inc. (a) |
1,900 |
65,313 |
|
|
Mead Corp. |
6,500 |
174,281 |
|
|
P.H. Glatfelter Co. |
1,300 |
13,650 |
|
|
Pactiv Corp. (a) |
15,900 |
174,900 |
|
|
Pope & Talbot, Inc. |
200 |
3,975 |
|
|
Potlatch Corp. |
1,500 |
50,438 |
|
|
Rayonier, Inc. |
1,500 |
62,344 |
|
|
Rock-Tenn Co. Class A |
100 |
1,031 |
|
|
Smurfit-Stone Container Corp. (a) |
22,998 |
301,849 |
|
|
Temple-Inland, Inc. |
4,600 |
195,213 |
|
|
The St. Joe Co. |
4,100 |
120,181 |
|
|
Trex Co., Inc. (a) |
1,400 |
43,400 |
|
|
Wausau-Mosinee Paper Corp. |
1,800 |
15,975 |
|
|
Westvaco Corp. |
6,400 |
175,200 |
|
|
Weyerhaeuser Co. |
16,100 |
745,631 |
|
|
Willamette Industries, Inc. |
7,200 |
219,600 |
|
|
Workflow Management, Inc. (a) |
2,300 |
13,513 |
|
|
|
7,511,175 |
||
|
TOTAL BASIC INDUSTRIES |
30,452,678 |
||
|
CONSTRUCTION & REAL ESTATE - 1.4% |
|||
|
Building Materials - 0.3% |
|||
|
American Standard Companies, Inc. (a) |
4,700 |
217,669 |
|
|
American Woodmark Corp. |
100 |
2,319 |
|
|
Ameron International Corp. |
300 |
10,125 |
|
|
Barnett, Inc. (a) |
700 |
8,706 |
|
|
Carlisle Companies, Inc. |
2,200 |
100,788 |
|
|
Centex Construction Products, Inc. |
800 |
20,650 |
|
|
CoorsTek, Inc. (a) |
300 |
14,063 |
|
|
Dal-Tile International, Inc. (a) |
2,800 |
31,500 |
|
|
Elcor Corp. |
900 |
14,794 |
|
|
Fastenal Co. |
3,400 |
217,175 |
|
|
Ferro Corp. |
2,550 |
52,594 |
|
|
Florida Rock Industries, Inc. |
1,000 |
38,438 |
|
|
Flowserve Corp. |
1,900 |
35,150 |
|
|
|
|||
|
Shares |
Value (Note 1) |
||
|
Fortune Brands, Inc. |
10,900 |
$ 277,950 |
|
|
Hexcel Corp. (a) |
1,700 |
23,481 |
|
|
Huttig Building Products, Inc. (a) |
1,077 |
4,914 |
|
|
Industrial Holdings, Inc. (a) |
100 |
238 |
|
|
Johns Manville Corp. |
9,600 |
120,000 |
|
|
Lafarge Corp. |
4,400 |
107,250 |
|
|
Lennox International, Inc. |
3,207 |
44,297 |
|
|
Lilly Industries, Inc. Class A |
1,700 |
52,063 |
|
|
Manitowoc Co., Inc. |
1,250 |
28,672 |
|
|
Masco Corp. |
35,200 |
686,400 |
|
|
Mobile Mini, Inc. (a) |
2,300 |
42,981 |
|
|
Nanophase Technologies Corp. (a) |
4,100 |
57,400 |
|
|
Nortek, Inc. (a) |
200 |
4,088 |
|
|
Omnova Solutions, Inc. |
3,100 |
18,600 |
|
|
Owens Corning |
2,200 |
11,413 |
|
|
Patrick Industries, Inc. |
600 |
4,031 |
|
|
Penn Engineering & Manufacturing Corp. (non-vtg.) |
300 |
9,994 |
|
|
Pitt-Des Moines, Inc. |
100 |
3,206 |
|
|
Plymouth Rubber, Inc. (a) |
500 |
2,625 |
|
|
Puerto Rican Cement Co., Inc. |
100 |
3,025 |
|
|
Quixote Corp. |
700 |
11,200 |
|
|
Robbins & Myers, Inc. |
200 |
4,775 |
|
|
ROHN Industries, Inc. (a) |
2,300 |
9,488 |
|
|
RPM, Inc. |
7,525 |
71,958 |
|
|
Shaw Group (a) |
2,700 |
150,356 |
|
|
Sherwin-Williams Co. |
15,800 |
363,400 |
|
|
Southdown, Inc. |
2,376 |
149,094 |
|
|
Swiss Army Brands, Inc. (a) |
700 |
3,128 |
|
|
Tecumseh Products Co. Class A |
1,800 |
71,550 |
|
|
Texas Industries, Inc. |
1,100 |
37,538 |
|
|
U. S. Concrete, Inc. (a) |
100 |
713 |
|
|
United Dominion Industries Ltd. |
100 |
1,614 |
|
|
USG Corp. |
6,300 |
202,781 |
|
|
Vulcan Materials Co. |
7,100 |
314,619 |
|
|
Watsco, Inc. |
1,050 |
13,388 |
|
|
York International Corp. |
2,700 |
67,163 |
|
|
|
3,739,364 |
||
|
Construction - 0.1% |
|||
|
American Homestar Corp. (a) |
800 |
1,050 |
|
|
Avatar Holdings, Inc. (a) |
300 |
5,775 |
|
|
Beazer Homes USA, Inc. (a) |
400 |
9,900 |
|
|
Butler Manufacturing Co. |
200 |
4,438 |
|
|
California Coastal Communities, Inc. |
6,400 |
35,200 |
|
|
Centex Corp. |
7,100 |
205,013 |
|
|
Clayton Homes, Inc. |
8,575 |
83,606 |
|
|
Crossman Communities, Inc. (a) |
100 |
1,831 |
|
|
D.R. Horton, Inc. |
4,525 |
88,803 |
|
|
Del Webb Corp. (a) |
700 |
15,663 |
|
|
Dominion Homes, Inc. (a) |
300 |
2,063 |
|
|
Emcor Group, Inc. (a) |
2,800 |
67,769 |
|
|
Engle Homes, Inc. |
300 |
4,613 |
|
|
Fleetwood Enterprises, Inc. |
3,300 |
45,169 |
|
|
Common Stocks - continued |
|||
|
Shares |
Value (Note 1) |
||
|
CONSTRUCTION & REAL ESTATE - continued |
|||
|
Construction - continued |
|||
|
Granite Construction, Inc. |
1,500 |
$ 34,125 |
|
|
Jacobs Engineering Group, Inc. (a) |
1,600 |
60,800 |
|
|
Kaufman & Broad Home Corp. |
5,300 |
131,506 |
|
|
Lennar Corp. |
3,000 |
82,875 |
|
|
M. D. C. Holdings, Inc. |
1,000 |
25,063 |
|
|
M/I Schottenstein Homes, Inc. |
100 |
1,969 |
|
|
NCI Building Systems, Inc. (a) |
800 |
14,100 |
|
|
NVR, Inc. (a) |
1,400 |
102,900 |
|
|
Oakwood Homes Corp. |
1,400 |
2,275 |
|
|
Palm Harbor Homes, Inc. (a) |
1,000 |
14,625 |
|
|
Pulte Corp. |
3,500 |
115,281 |
|
|
Ryland Group, Inc. |
500 |
12,281 |
|
|
Skyline Corp. |
100 |
2,213 |
|
|
Standard Pacific Corp. |
1,400 |
23,013 |
|
|
Toll Brothers, Inc. (a) |
3,100 |
101,138 |
|
|
Walter Industries, Inc. |
2,500 |
20,625 |
|
|
|
1,315,682 |
||
|
Engineering - 0.1% |
|||
|
Able Telcom Holding Corp. (a) |
4,700 |
14,688 |
|
|
Apogee Enterprises, Inc. |
800 |
3,550 |
|
|
DSP Group, Inc. (a) |
1,600 |
74,000 |
|
|
DualStar Technologies Corp. (a) |
5,500 |
17,703 |
|
|
Dycom Industries, Inc. (a) |
2,750 |
145,750 |
|
|
Encompass Services Corp. (a) |
1,166 |
6,413 |
|
|
Fluor Corp. |
7,400 |
221,538 |
|
|
Foster Wheeler Corp. |
6,200 |
43,788 |
|
|
Harris Interactive, Inc. |
4,600 |
18,975 |
|
|
Horizon Offshore, Inc. (a) |
700 |
13,038 |
|
|
Jupiter Communications, Inc. |
3,600 |
85,725 |
|
|
MasTec, Inc. (a) |
4,650 |
167,400 |
|
|
Morrison Knudsen Corp. (a) |
2,700 |
32,400 |
|
|
NetRatings, Inc. |
2,200 |
38,088 |
|
|
Quanta Services, Inc. (a) |
4,100 |
191,675 |
|
|
Tetra Tech, Inc. (a) |
5,625 |
152,578 |
|
|
ViaSource Communications, Inc. |
3,100 |
29,450 |
|
|
|
1,256,759 |
||
|
Real Estate - 0.1% |
|||
|
Bluegreen Corp. (a) |
900 |
3,263 |
|
|
Catellus Development Corp. (a) |
6,900 |
123,338 |
|
|
CB Richard Ellis Services, Inc. (a) |
800 |
8,400 |
|
|
Consolidated-Tomoka Land Co. |
3,900 |
47,531 |
|
|
Fairfield Communities, Inc. (a) |
3,200 |
25,600 |
|
|
Forest City Enterprises, Inc. Class A |
1,800 |
63,000 |
|
|
Getty Realty Corp. |
100 |
1,175 |
|
|
Insignia Financial Group, Inc. (a) |
733 |
6,918 |
|
|
Iron Mountain, Inc. (a) |
2,860 |
97,598 |
|
|
Jones Lang LaSalle, Inc. (a) |
2,600 |
37,863 |
|
|
LNR Property Corp. |
1,200 |
25,500 |
|
|
Merry Land Properties, Inc. (a) |
50 |
275 |
|
|
Newhall Land & Farming Co. |
1,600 |
39,400 |
|
|
|
|||
|
Shares |
Value (Note 1) |
||
|
Plains All American Pipeline LP |
1,300 |
$ 24,538 |
|
|
Stewart Enterprises, Inc. Class A |
11,300 |
36,019 |
|
|
Trammell Crow Co. (a) |
2,900 |
40,238 |
|
|
Trendwest Resorts, Inc. (a) |
700 |
13,388 |
|
|
Vornado Operating Co. (a) |
60 |
405 |
|
|
W.P. Carey & Co. LLC |
1,200 |
20,775 |
|
|
|
615,224 |
||
|
Real Estate Investment Trusts - 0.8% |
|||
|
Alexander's, Inc. (a) |
100 |
8,075 |
|
|
Alexandria Real Estate Equities, Inc. |
500 |
17,500 |
|
|
AMB Property Corp. |
5,100 |
123,356 |
|
|
American Industrial Properties |
100 |
1,356 |
|
|
American Real Estate Partners LP (a) |
2,300 |
20,269 |
|
|
AMLI Residential Properties Trust (SBI) |
500 |
12,375 |
|
|
Apartment Investment & Management Co. Class A |
4,331 |
194,354 |
|
|
Archstone Communities Trust |
9,000 |
221,625 |
|
|
Arden Realty Group, Inc. |
3,800 |
96,900 |
|
|
Avalonbay Communities, Inc. |
6,000 |
268,125 |
|
|
Bedford Property Investors, Inc. |
400 |
7,775 |
|
|
Boston Properties, Inc. |
5,900 |
238,581 |
|
|
Boykin Lodging Co. |
500 |
4,969 |
|
|
Bradley Real Estate, Inc. (SBI) |
700 |
15,313 |
|
|
Brandywine Realty Trust |
1,700 |
34,850 |
|
|
BRE Properties, Inc. Class A |
2,600 |
75,888 |
|
|
Cabot Industrial Trust |
2,000 |
39,250 |
|
|
Camden Property Trust (SBI) |
2,075 |
62,120 |
|
|
Capital Automotive |
300 |
4,163 |
|
|
CarrAmerica Realty Corp. |
4,100 |
119,156 |
|
|
CBL & Associates Properties, Inc. |
1,000 |
23,875 |
|
|
CenterPoint Properties Trust |
1,000 |
43,813 |
|
|
Charles E. Smith Residential Realty, Inc. |
1,100 |
45,238 |
|
|
Chateau Communities, Inc. |
1,300 |
33,800 |
|
|
Chelsea GCA Realty, Inc. |
600 |
20,138 |
|
|
Colonial Properties Trust (SBI) |
900 |
24,075 |
|
|
Commercial Net Lease Realty, Inc. |
400 |
4,175 |
|
|
Cornerstone Realty Income Trust, Inc. |
900 |
9,450 |
|
|
Cousins Properties, Inc. |
1,900 |
78,138 |
|
|
Crescent Real Estate Equities Co. |
10,400 |
230,100 |
|
|
Developers Diversified Realty Corp. |
3,200 |
46,400 |
|
|
Duke-Weeks Realty Corp. |
10,300 |
244,625 |
|
|
Eastgroup Properties, Inc. |
300 |
6,563 |
|
|
Equity Inns, Inc. |
1,400 |
8,925 |
|
|
Equity Office Properties Trust |
27,050 |
781,069 |
|
|
Equity Residential Properties Trust (SBI) |
14,230 |
683,040 |
|
|
Essex Property Trust, Inc. |
800 |
39,350 |
|
|
Federal Realty Investment Trust (SBI) |
1,900 |
38,000 |
|
|
FelCor Lodging Trust, Inc. |
7,368 |
163,938 |
|
|
First Industrial Realty Trust, Inc. |
10,000 |
296,875 |
|
|
First Union Real Estate Equity & Mortgage Investments |
1,440 |
3,870 |
|
|
Franchise Finance Corp. of America |
3,200 |
72,000 |
|
|
Gables Residential Trust (SBI) |
1,100 |
30,525 |
|
|
General Growth Properties, Inc. |
3,800 |
122,075 |
|
|
Common Stocks - continued |
|||
|
Shares |
Value (Note 1) |
||
|
CONSTRUCTION & REAL ESTATE - continued |
|||
|
Real Estate Investment Trusts - continued |
|||
|
Glenborough Realty Trust, Inc. |
8,900 |
$ 165,763 |
|
|
Glimcher Realty Trust (SBI) |
700 |
10,763 |
|
|
Great Lakes REIT, Inc. |
100 |
1,919 |
|
|
Health Care Property Investors, Inc. |
2,946 |
77,517 |
|
|
Health Care REIT, Inc. |
200 |
3,613 |
|
|
Healthcare Realty Trust, Inc. |
1,900 |
37,525 |
|
|
Highwoods Properties, Inc. |
3,800 |
91,438 |
|
|
Home Properties of New York, Inc. |
800 |
23,750 |
|
|
Hospitality Properties Trust (SBI) |
3,200 |
74,400 |
|
|
Host Marriott Corp. |
21,400 |
228,713 |
|
|
HRPT Properties Trust |
21,600 |
147,150 |
|
|
Innkeepers USA Trust |
700 |
7,263 |
|
|
IRT Property Co. |
300 |
2,644 |
|
|
iStar Financial, Inc. |
3,432 |
71,858 |
|
|
JDN Realty Corp. |
650 |
6,703 |
|
|
JP Realty, Inc. |
100 |
1,775 |
|
|
Kilroy Realty Corp. |
1,200 |
29,850 |
|
|
Kimco Realty Corp. |
3,800 |
154,375 |
|
|
Koger Equity, Inc. |
800 |
13,700 |
|
|
Liberty Property Trust (SBI) |
4,900 |
128,013 |
|
|
Macerich Co. |
1,600 |
33,500 |
|
|
Mack-Cali Realty Corp. |
4,000 |
104,750 |
|
|
Manufactured Home Communities, Inc. |
800 |
18,900 |
|
|
Meditrust Corp. unit |
18,096 |
41,847 |
|
|
MeriStar Hospitality Corp. |
2,400 |
53,100 |
|
|
Mid-America Apartment |
500 |
12,094 |
|
|
Mills Corp. |
800 |
14,500 |
|
|
National Golf Properties, Inc. |
100 |
2,050 |
|
|
Nationwide Health Properties, Inc. |
2,100 |
30,319 |
|
|
New Plan Excel Realty Trust |
7,400 |
102,213 |
|
|
Pacific Gulf Properties, Inc. |
800 |
22,350 |
|
|
Pan Pacific Retail Properties, Inc. |
600 |
11,438 |
|
|
Parkway Properties, Inc. |
100 |
3,175 |
|
|
Pinnacle Holdings, Inc. (a) |
5,200 |
209,300 |
|
|
Post Properties, Inc. |
2,400 |
101,550 |
|
|
Prentiss Properties Trust (SBI) |
1,800 |
43,763 |
|
|
Prison Realty Corp. |
6,750 |
16,031 |
|
|
ProLogis Trust |
18,400 |
420,900 |
|
|
PS Business Parks, Inc. |
900 |
23,850 |
|
|
Public Storage, Inc. |
8,100 |
197,438 |
|
|
Realty Income Corp. |
1,100 |
25,025 |
|
|
Reckson Associates Realty Corp. |
2,200 |
53,488 |
|
|
Redwood Trust, Inc. |
300 |
4,744 |
|
|
Regency Realty Corp. |
3,200 |
72,400 |
|
|
RFS Hotel Investors, Inc. |
400 |
5,000 |
|
|
Senior Housing Properties Trust (REIT) |
820 |
7,483 |
|
|
Shurgard Storage Centers, Inc. Class A |
1,300 |
30,956 |
|
|
Simon Property Group, Inc. |
11,500 |
262,344 |
|
|
SL Green Realty Corp. |
1,100 |
29,494 |
|
|
Spieker Properties, Inc. |
10,100 |
551,713 |
|
|
|
|||
|
Shares |
Value (Note 1) |
||
|
Storage USA, Inc. |
1,400 |
$ 42,175 |
|
|
Summit Properties, Inc. |
1,100 |
25,575 |
|
|
Sun Communities, Inc. |
700 |
21,656 |
|
|
Taubman Centers, Inc. |
2,100 |
22,969 |
|
|
The Rouse Co. |
4,400 |
106,150 |
|
|
Thornburg Mortgage, Inc. |
400 |
3,275 |
|
|
Town & Country Trust |
100 |
1,769 |
|
|
United Dominion Realty Trust, Inc. |
5,600 |
60,550 |
|
|
Urban Shopping Centers, Inc. |
700 |
24,456 |
|
|
Ventas, Inc. (a) |
1,400 |
6,913 |
|
|
Vornado Realty Trust |
9,400 |
347,800 |
|
|
Washington (SBI) |
1,600 |
30,700 |
|
|
Weingarten Realty Investors (SBI) |
1,400 |
56,700 |
|
|
Westfield America, Inc. |
3,900 |
58,256 |
|
|
Wyndham International, Inc. Class A (a) |
5,312 |
11,288 |
|
|
|
9,220,736 |
||
|
TOTAL CONSTRUCTION & REAL ESTATE |
16,147,765 |
||
|
DURABLES - 2.0% |
|||
|
Autos, Tires, & Accessories - 1.0% |
|||
|
Aftermarket Technology Corp. (a) |
700 |
4,288 |
|
|
American Axle & Manufacturing Holdings, Inc. (a) |
2,100 |
30,188 |
|
|
ArvinMeritor, Inc. |
4,600 |
75,900 |
|
|
AutoNation, Inc. |
32,000 |
208,000 |
|
|
AutoZone, Inc. (a) |
9,100 |
204,750 |
|
|
Aviation Sales Co. (a) |
2,900 |
14,500 |
|
|
Bandag, Inc. |
1,300 |
42,331 |
|
|
Borg-Warner Automotive, Inc. |
1,600 |
55,000 |
|
|
Boyds Wheels, Inc. (a) |
4,800 |
336 |
|
|
Breed Technologies, Inc. (a) |
1,000 |
200 |
|
|
Casey's General Stores, Inc. |
9,800 |
111,475 |
|
|
CLARCOR, Inc. |
1,100 |
22,688 |
|
|
Cooper Tire & Rubber Co. |
3,700 |
44,631 |
|
|
Copart, Inc. (a) |
2,500 |
42,344 |
|
|
CSK Auto Corp. (a) |
1,300 |
7,069 |
|
|
Cummins Engine Co., Inc. |
2,900 |
102,950 |
|
|
Dana Corp. |
9,956 |
245,789 |
|
|
Danaher Corp. |
8,971 |
504,058 |
|
|
Delphi Automotive Systems Corp. |
38,223 |
628,291 |
|
|
Discount Auto Parts, Inc. (a) |
500 |
4,438 |
|
|
Dura Automotive Systems, Inc. |
1,683 |
18,092 |
|
|
Eaton Corp. |
5,300 |
351,788 |
|
|
Federal Signal Corp. |
1,400 |
30,188 |
|
|
Federal-Mogul Corp. |
5,100 |
52,594 |
|
|
Fidelity Holdings, Inc. (a) |
4,350 |
5,845 |
|
|
Ford Motor Co. |
128,397 |
3,105,602 |
|
|
General Motors Corp. |
37,946 |
2,739,227 |
|
|
GenTek, Inc. |
1,600 |
24,400 |
|
|
Gentex Corp. (a) |
6,000 |
155,250 |
|
|
Genuine Parts Co. |
11,800 |
242,638 |
|
|
Getty Petroleum Marketing, Inc. (a) |
100 |
388 |
|
|
Common Stocks - continued |
|||
|
Shares |
Value (Note 1) |
||
|
DURABLES - continued |
|||
|
Autos, Tires, & Accessories - continued |
|||
|
Goodyear Tire & Rubber Co. |
11,000 |
$ 257,125 |
|
|
Group 1 Automotive, Inc. (a) |
200 |
2,200 |
|
|
Hayes Lemmerz International, Inc. (a) |
1,000 |
12,875 |
|
|
IMPCO Technologies, Inc. (a) |
2,100 |
50,531 |
|
|
Intermet Corp. |
400 |
3,100 |
|
|
Johnson Controls, Inc. |
5,900 |
315,281 |
|
|
Lear Corp. (a) |
3,900 |
84,094 |
|
|
Mascotech, Inc. |
1,700 |
28,156 |
|
|
McLaren Automotive Group, Inc. (a) |
500 |
938 |
|
|
Midas, Inc. |
1,400 |
23,800 |
|
|
Miller Industries, Inc. (a) |
1,800 |
2,588 |
|
|
Modine Manufacturing Co. |
1,400 |
39,375 |
|
|
Monaco Coach Corp. (a) |
200 |
3,500 |
|
|
Monro Muffler Brake, Inc. (a) |
1,100 |
11,138 |
|
|
NACCO Industries, Inc. Class A |
300 |
14,063 |
|
|
Navistar International Corp. (a) |
3,900 |
146,250 |
|
|
O'Reilly Automotive, Inc. (a) |
5,000 |
76,250 |
|
|
Oshkosh Truck Co. |
2,100 |
74,550 |
|
|
PACCAR, Inc. |
6,800 |
288,575 |
|
|
Pep Boys-Manny, Moe & Jack |
2,800 |
16,450 |
|
|
Sonic Automotive, Inc. Class A (a) |
3,200 |
33,800 |
|
|
SPX Corp. (a) |
2,772 |
454,608 |
|
|
Strattec Security Corp. (a) |
1,800 |
62,325 |
|
|
Superior Industries International, Inc. |
1,300 |
42,169 |
|
|
The Pantry, Inc. (a) |
900 |
11,700 |
|
|
Tower Automotive, Inc. (a) |
3,400 |
38,675 |
|
|
TRW, Inc. |
8,400 |
383,775 |
|
|
Ugly Duckling Corp. (a) |
100 |
694 |
|
|
United Auto Group, Inc. (a) |
800 |
6,750 |
|
|
Visteon Corp. |
9,056 |
142,066 |
|
|
Wabash National Corp. |
700 |
7,788 |
|
|
|
11,710,427 |
||
|
Consumer Durables - 0.3% |
|||
|
Ballantyne of Omaha, Inc. (a) |
100 |
119 |
|
|
Blyth, Inc. |
2,900 |
67,969 |
|
|
Boyds Collection, Ltd. (a) |
3,600 |
31,950 |
|
|
Department 56, Inc. (a) |
2,200 |
29,838 |
|
|
Dupont Photomasks, Inc. (a) |
2,100 |
159,338 |
|
|
Libbey, Inc. |
900 |
29,531 |
|
|
Lifetime Hoan Corp. |
300 |
1,950 |
|
|
Mikasa, Inc. |
2,300 |
22,281 |
|
|
Minnesota Mining & Manufacturing Co. |
27,700 |
2,576,100 |
|
|
Oneida Ltd. |
400 |
5,500 |
|
|
SAF T LOK, Inc. (a) |
18,900 |
19,491 |
|
|
Simpson Manufacturing Co. Ltd. (a) |
600 |
28,200 |
|
|
Snap-On, Inc. |
5,400 |
166,388 |
|
|
Sola International, Inc. (a) |
700 |
4,900 |
|
|
|
3,143,555 |
||
|
Consumer Electronics - 0.4% |
|||
|
American Technology Corp. (a) |
900 |
4,500 |
|
|
|
|||
|
Shares |
Value (Note 1) |
||
|
Applica, Inc. (a) |
2,700 |
$ 28,013 |
|
|
Audible, Inc. |
4,000 |
7,000 |
|
|
Black & Decker Corp. |
6,200 |
248,388 |
|
|
Boston Acoustics, Inc. |
100 |
1,238 |
|
|
Digital Video Systems, Inc. (a) |
1,800 |
13,388 |
|
|
Fossil, Inc. (a) |
1,400 |
24,413 |
|
|
Gemstar-TV Guide International, Inc. (a) |
28,700 |
2,590,175 |
|
|
General Motors Corp. Class H |
47,526 |
1,574,299 |
|
|
Harman International Industries, Inc. |
1,000 |
76,750 |
|
|
Maytag Corp. |
5,800 |
221,125 |
|
|
Movado Group, Inc. |
400 |
5,600 |
|
|
National Presto Industries, Inc. |
900 |
27,394 |
|
|
Odetics, Inc. Class B |
400 |
5,650 |
|
|
Recoton Corp. (a) |
2,000 |
28,375 |
|
|
Rockford Corp. |
2,500 |
15,938 |
|
|
Salton, Inc. (a) |
1,100 |
41,388 |
|
|
Sunbeam Corp. (a) |
670 |
1,298 |
|
|
Sunbeam Corp. warrants 8/24/03 (a) |
114 |
0 |
|
|
TrueTime, Inc. |
3,100 |
12,788 |
|
|
U.S. Industries, Inc. |
6,600 |
84,150 |
|
|
Universal Electronics, Inc. (a) |
3,400 |
80,591 |
|
|
Whirlpool Corp. |
5,100 |
193,800 |
|
|
|
5,286,261 |
||
|
Home Furnishings - 0.1% |
|||
|
Bassett Furniture Industries, Inc. |
1,600 |
22,000 |
|
|
Bush Industries, Inc. Class A. |
1,500 |
19,500 |
|
|
Chromcraft Revington, Inc. (a) |
1,600 |
17,800 |
|
|
Craftmade International, Inc. |
1,700 |
13,494 |
|
|
Ethan Allen Interiors, Inc. |
3,200 |
86,200 |
|
|
Falcon Products, Inc. |
1,700 |
16,575 |
|
|
Flexsteel Industries, Inc. |
1,300 |
15,925 |
|
|
Furniture Brands International, Inc. (a) |
4,200 |
67,725 |
|
|
Haverty Furniture Companies, Inc. |
1,000 |
11,563 |
|
|
Heilig-Meyers Co. |
1,400 |
266 |
|
|
Herman Miller, Inc. |
5,900 |
188,431 |
|
|
Hillenbrand Industries, Inc. |
3,400 |
118,363 |
|
|
HON Industries, Inc. |
4,600 |
123,913 |
|
|
La-Z-Boy, Inc. |
4,950 |
79,509 |
|
|
Leggett & Platt, Inc. |
14,400 |
254,700 |
|
|
Linens'n Things, Inc. (a) |
2,600 |
70,200 |
|
|
Mity-Lite, Inc. (a) |
1,100 |
11,069 |
|
|
Restoration Hardware, Inc. (a) |
1,000 |
5,750 |
|
|
Rowe Furniture Corp. |
1,000 |
4,438 |
|
|
Stanley Furniture Co., Inc. (a) |
1,000 |
27,125 |
|
|
Steelcase, Inc. Class A |
3,200 |
53,000 |
|
|
Virco Manufacturing Co. |
1,600 |
20,600 |
|
|
|
1,228,146 |
||
|
Textiles & Apparel - 0.2% |
|||
|
Active Apparel Group, Inc. (a) |
1,000 |
4,875 |
|
|
Ashworth, Inc. (a) |
400 |
2,212 |
|
|
BEBE Stores, Inc. (a) |
2,100 |
32,944 |
|
|
Brown Shoe Co., Inc. |
500 |
5,375 |
|
|
Burlington Industries, Inc. (a) |
500 |
875 |
|
|
Common Stocks - continued |
|||
|
Shares |
Value (Note 1) |
||
|
DURABLES - continued |
|||
|
Textiles & Apparel - continued |
|||
|
Collins & Aikman Corp. (a) |
1,300 |
$ 6,744 |
|
|
Columbia Sportswear Co. (a) |
1,400 |
57,225 |
|
|
Dixie Group, Inc. (a) |
2,900 |
11,600 |
|
|
Donna Karan International, Inc. (a) |
700 |
4,244 |
|
|
Interface, Inc. Class A |
9,900 |
68,681 |
|
|
Jones Apparel Group, Inc. (a) |
8,651 |
211,950 |
|
|
K-Swiss, Inc. Class A |
3,300 |
74,250 |
|
|
Kellwood Co. |
1,200 |
19,200 |
|
|
Liz Claiborne, Inc. |
6,400 |
281,200 |
|
|
Madden Steven Ltd. (a) |
4,800 |
59,100 |
|
|
Mohawk Industries, Inc. (a) |
4,200 |
99,750 |
|
|
Nautica Enterprises, Inc. (a) |
2,900 |
34,256 |
|
|
NIKE, Inc. Class B |
19,000 |
751,688 |
|
|
Oshkosh B'Gosh, Inc. Class A |
3,000 |
42,750 |
|
|
Pacific Sunwear of California, Inc. (a) |
6,100 |
81,206 |
|
|
Phillips-Van Heusen Corp. |
400 |
3,650 |
|
|
Polo Ralph Lauren Corp. Class A (a) |
4,000 |
77,500 |
|
|
Polymer Group, Inc. |
400 |
2,800 |
|
|
Quiksilver, Inc. (a) |
600 |
8,925 |
|
|
Reebok International Ltd. (a) |
8,900 |
170,769 |
|
|
Russell Corp. |
1,600 |
30,500 |
|
|
Samsonite Corp. (a) |
1,446 |
6,236 |
|
|
Saucony, Inc. (a) |
2,100 |
20,213 |
|
|
Shaw Industries, Inc. |
9,871 |
122,771 |
|
|
Sport-Haley, Inc. (a) |
100 |
325 |
|
|
Springs Industries, Inc. Class A |
800 |
23,900 |
|
|
Stride Rite Corp. |
1,400 |
8,400 |
|
|
Superior Uniform Group, Inc. |
1,000 |
7,625 |
|
|
Tarrant Apparel Group (a) |
2,700 |
20,756 |
|
|
Timberland Co. Class A (a) |
2,400 |
97,800 |
|
|
Unifi, Inc. (a) |
2,700 |
30,544 |
|
|
Vans, Inc. (a) |
3,600 |
56,250 |
|
|
VF Corp. |
7,400 |
169,275 |
|
|
Warnaco Group, Inc. Class A |
9,500 |
47,500 |
|
|
WestPoint Stevens, Inc. |
2,900 |
40,781 |
|
|
Wolverine World Wide, Inc. |
1,700 |
18,594 |
|
|
|
2,815,239 |
||
|
TOTAL DURABLES |
24,183,628 |
||
|
ENERGY - 4.4% |
|||
|
Coal - 0.0% |
|||
|
Arch Coal, Inc. |
1,919 |
14,393 |
|
|
CONSOL Energy, Inc. |
4,800 |
99,900 |
|
|
|
114,293 |
||
|
Energy Services - 1.1% |
|||
|
Atwood Oceanics, Inc. (a) |
400 |
18,150 |
|
|
Baker Hughes, Inc. |
20,950 |
765,984 |
|
|
BJ Services Co. (a) |
4,600 |
308,200 |
|
|
Cal Dive International, Inc. (a) |
500 |
28,750 |
|
|
Carbo Ceramics, Inc. |
700 |
25,419 |
|
|
|
|||
|
Shares |
Value (Note 1) |
||
|
Diamond Offshore Drilling, Inc. |
12,100 |
$ 542,231 |
|
|
ENSCO International, Inc. |
7,500 |
299,063 |
|
|
Global Industries Ltd. (a) |
13,400 |
166,663 |
|
|
Global Marine, Inc. (a) |
12,300 |
397,444 |
|
|
Halliburton Co. |
33,200 |
1,759,600 |
|
|
Hanover Compressor Co. (a) |
4,200 |
133,350 |
|
|
Helmerich & Payne, Inc. |
7,500 |
277,031 |
|
|
Key Energy Group, Inc. (a) |
9,900 |
102,713 |
|
|
Lone Star Technologies, Inc. (a) |
3,400 |
170,850 |
|
|
Marine Drilling Companies, Inc. (a) |
1,500 |
40,781 |
|
|
Maverick Tube Corp. (a) |
2,600 |
72,963 |
|
|
McDermott International, Inc. |
9,400 |
72,263 |
|
|
Nabors Industries, Inc. (a) |
8,430 |
400,952 |
|
|
Noble Drilling Corp. (a) |
9,500 |
460,750 |
|
|
Oceaneering International, Inc. (a) |
600 |
10,463 |
|
|
Offshore Logistics, Inc. (a) |
700 |
12,163 |
|
|
Parker Drilling Co. (a) |
2,900 |
20,844 |
|
|
Patterson Energy, Inc. (a) |
5,800 |
181,975 |
|
|
Pride International, Inc. (a) |
6,200 |
152,675 |
|
|
R&B Falcon Corp. (a) |
9,980 |
284,430 |
|
|
Rowan Companies, Inc. (a) |
3,800 |
117,800 |
|
|
Santa Fe International Corp. |
14,500 |
570,031 |
|
|
Schlumberger Ltd. (NY Shares) |
41,772 |
3,563,674 |
|
|
SEACOR SMIT, Inc. (a) |
1,350 |
61,509 |
|
|
Smith International, Inc. (a) |
2,500 |
198,750 |
|
|
Superior Energy Services, Inc. (a) |
1,200 |
13,200 |
|
|
TETRA Technologies, Inc. (a) |
1,100 |
14,988 |
|
|
Tidewater, Inc. |
9,200 |
371,450 |
|
|
Transocean Sedco Forex, Inc. |
13,257 |
792,106 |
|
|
Unit Corp. (a) |
700 |
10,938 |
|
|
Varco International, Inc. (a) |
11,446 |
231,066 |
|
|
Weatherford International, Inc. |
6,380 |
299,461 |
|
|
Zapata Corp. |
1,100 |
3,506 |
|
|
|
12,954,186 |
||
|
Oil & Gas - 3.3% |
|||
|
Amerada Hess Corp. |
9,000 |
615,938 |
|
|
American International Petroleum Corp. (a) |
100 |
53 |
|
|
Anadarko Petroleum Corp. |
17,268 |
1,135,716 |
|
|
Apache Corp. |
7,500 |
472,500 |
|
|
Barrett Resources Corp. (a) |
1,500 |
51,938 |
|
|
Basin Exploration, Inc. (a) |
3,600 |
72,000 |
|
|
Belco Oil & Gas Corp. (a) |
1,100 |
10,038 |
|
|
Bellwether Exploration Co. (a) |
5,600 |
44,625 |
|
|
Benton Oil & Gas Co. (a) |
1,200 |
2,550 |
|
|
Berry Petroleum Co. Class A |
200 |
3,800 |
|
|
BP Prudhoe Bay Royalty Trust |
4,900 |
61,556 |
|
|
Buckeye Partners LP |
1,700 |
47,813 |
|
|
Burlington Resources, Inc. |
14,400 |
566,100 |
|
|
Cabot Oil & Gas Corp. Class A |
800 |
16,000 |
|
|
Chesapeake Energy Corp. (a) |
4,400 |
33,550 |
|
|
Chevron Corp. |
46,000 |
3,887,000 |
|
|
Comstock Resources, Inc. (a) |
1,100 |
10,931 |
|
|
Common Stocks - continued |
|||
|
Shares |
Value (Note 1) |
||
|
ENERGY - continued |
|||
|
Oil & Gas - continued |
|||
|
Conoco, Inc. Class B |
43,389 |
$ 1,133,538 |
|
|
Cooper Cameron Corp. (a) |
3,700 |
287,906 |
|
|
Cross Timbers Oil Co. |
1,900 |
50,231 |
|
|
Crown Central Petroleum Corp. |
200 |
1,863 |
|
|
Devon Energy Corp. |
9,049 |
529,932 |
|
|
EEX Corp. (a) |
1,433 |
7,882 |
|
|
Enterprise Products Partners LP |
3,000 |
76,688 |
|
|
EOG Resources, Inc. |
8,200 |
313,650 |
|
|
Evergreen Resources, Inc. (a) |
1,900 |
55,456 |
|
|
Exxon Mobil Corp. |
248,056 |
20,247,571 |
|
|
Forcenergy, Inc. (a) |
600 |
14,513 |
|
|
Forest Oil Corp. (a) |
2,100 |
32,156 |
|
|
Friede Goldman Halter, Inc. (a) |
1,056 |
5,940 |
|
|
Frontier Oil Corp. (a) |
1,200 |
8,550 |
|
|
Gothic Energy Corp. (a) |
200 |
259 |
|
|
Grant Prideco, Inc. (a) |
6,500 |
152,750 |
|
|
Gulf Island Fabrication, Inc. (a) |
300 |
5,550 |
|
|
Harken Energy Corp. (a) |
4,800 |
3,900 |
|
|
Holly Corp. |
200 |
2,575 |
|
|
Houston Exploration Co. (a) |
700 |
18,113 |
|
|
HS Resources, Inc. (a) |
500 |
15,844 |
|
|
Hugoton Royalty Trust |
2,400 |
30,750 |
|
|
Kerr-McGee Corp. |
6,170 |
389,867 |
|
|
Louis Dreyfus Natural Gas Corp. (a) |
3,100 |
107,725 |
|
|
Murphy Oil Corp. |
4,600 |
307,050 |
|
|
National Energy Group, Inc. (a) |
500 |
175 |
|
|
National-Oilwell, Inc. (a) |
2,507 |
86,962 |
|
|
Newfield Exploration Co. (a) |
2,300 |
99,475 |
|
|
Noble Affiliates, Inc. |
3,200 |
124,000 |
|
|
Nuevo Energy Co. (a) |
700 |
13,431 |
|
|
Occidental Petroleum Corp. |
24,600 |
531,975 |
|
|
Ocean Energy, Inc. (a) |
9,828 |
149,263 |
|
|
Patina Oil & Gas Corp. |
100 |
2,125 |
|
|
Pennzoil-Quaker State Co. |
5,092 |
63,332 |
|
|
Phillips Petroleum Co. |
20,900 |
1,293,188 |
|
|
Pioneer Natural Resources Co. (a) |
5,000 |
69,375 |
|
|
Plains Resources, Inc. (a) |
900 |
15,975 |
|
|
Pogo Producing Co. |
1,700 |
45,688 |
|
|
Pure Resources, Inc. (a) |
800 |
15,450 |
|
|
Range Resources Corp. |
1,200 |
6,000 |
|
|
Resource America, Inc. Class A |
2,300 |
19,406 |
|
|
Seven Seas Petroleum, Inc. (a) |
1,700 |
4,888 |
|
|
Spinnaker Exploration Co. |
600 |
21,825 |
|
|
St. Mary Land & Exploration Co. |
300 |
12,413 |
|
|
Stone Energy Corp. (a) |
1,400 |
83,738 |
|
|
Sunoco, Inc. |
6,000 |
163,125 |
|
|
Swift Energy Co. (a) |
600 |
17,363 |
|
|
TEPPCO Partners LP |
1,800 |
42,750 |
|
|
Tesoro Petroleum Corp. (a) |
3,600 |
34,650 |
|
|
Texaco, Inc. |
38,700 |
1,993,050 |
|
|
|
|||
|
Shares |
Value (Note 1) |
||
|
The Coastal Corp. |
14,900 |
$ 1,026,238 |
|
|
Tom Brown, Inc. (a) |
1,300 |
28,275 |
|
|
Tosco Corp. |
10,200 |
311,100 |
|
|
Ultramar Diamond Shamrock Corp. |
5,800 |
135,938 |
|
|
UNIFAB International, Inc. (a) |
100 |
1,113 |
|
|
Unocal Corp. |
16,300 |
544,013 |
|
|
USX - Marathon Group |
21,600 |
592,650 |
|
|
Valero Energy Corp. |
3,700 |
111,463 |
|
|
Vastar Resources, Inc. |
6,600 |
546,150 |
|
|
Veritas DGC, Inc. (a) |
1,600 |
42,700 |
|
|
Vintage Petroleum, Inc. |
3,200 |
67,200 |
|
|
WD-4O Co. |
900 |
17,438 |
|
|
Western Gas Resources, Inc. |
2,000 |
43,875 |
|
|
Williams Clayton Energy, Inc. (a) |
2,400 |
96,900 |
|
|
|
39,307,042 |
||
|
TOTAL ENERGY |
52,375,521 |
||
|
FINANCE - 14.3% |
|||
|
Banks - 4.6% |
|||
|
1st Source Corp. |
420 |
7,823 |
|
|
Abigail Adams National Bancorp, Inc. |
200 |
1,775 |
|
|
Advanta Corp. |
2,600 |
33,800 |
|
|
Allegiant Bancorp, Inc. |
100 |
863 |
|
|
Amcore Financial, Inc. |
3,900 |
70,444 |
|
|
American Pacific Bank of Oregon |
800 |
2,750 |
|
|
AmSouth Bancorp. |
26,519 |
483,972 |
|
|
Area Bankshares Corp. |
400 |
9,000 |
|
|
Associated Banc-Corp. |
4,197 |
105,384 |
|
|
BancFirst Corp. |
100 |
3,181 |
|
|
BancorpSouth, Inc. |
2,900 |
42,413 |
|
|
BancWest Corp. |
4,032 |
71,316 |
|
|
Bank of America Corp. |
122,572 |
6,565,263 |
|
|
Bank of Granite Corp. |
100 |
2,288 |
|
|
Bank of New York Co., Inc. |
51,200 |
2,684,800 |
|
|
Bank One Corp. |
80,167 |
2,825,887 |
|
|
Banknorth Group, Inc. |
18,059 |
295,716 |
|
|
BB&T Corp. |
26,756 |
724,084 |
|
|
BOK Financial Corp. |
2,600 |
46,475 |
|
|
Borel Bank & Trust Co., San Mateo |
300 |
5,963 |
|
|
Brenton Banks, Inc. |
100 |
1,223 |
|
|
BT Financial Corp. |
315 |
5,670 |
|
|
Capital Corp. of the West (a) |
800 |
9,300 |
|
|
Capital Crossing Bank (a) |
1,000 |
8,750 |
|
|
Capital One Financial Corp. |
12,800 |
772,000 |
|
|
Cathay Bancorp, Inc. |
300 |
14,963 |
|
|
Centura Banks, Inc. |
2,300 |
81,219 |
|
|
Century South Banks, Inc. |
100 |
2,188 |
|
|
Chase Manhattan Corp. |
86,100 |
4,810,838 |
|
|
Chemical Financial Corp. |
300 |
6,450 |
|
|
Chittenden Corp. |
1,300 |
35,588 |
|
|
Citizens Banking Corp. |
2,500 |
57,500 |
|
|
City National Corp. |
4,005 |
156,445 |
|
|
Common Stocks - continued |
|||
|
Shares |
Value (Note 1) |
||
|
FINANCE - continued |
|||
|
Banks - continued |
|||
|
Colonial Bancgroup, Inc. |
6,200 |
$ 60,450 |
|
|
Comerica, Inc. |
11,600 |
653,225 |
|
|
Commerce Bancorp, Inc. |
1,800 |
93,038 |
|
|
Commerce Bancshares, Inc. |
3,792 |
136,512 |
|
|
Community Capital Corp. |
400 |
2,450 |
|
|
Community First Bankshares, Inc. |
4,100 |
73,800 |
|
|
Compass Bancshares, Inc. |
7,550 |
137,788 |
|
|
Corus Bankshares, Inc. |
500 |
16,500 |
|
|
Cullen Frost Bankers, Inc. |
5,200 |
161,200 |
|
|
CVB Financial Corp. |
700 |
11,200 |
|
|
East West Bancorp, Inc. |
5,100 |
87,019 |
|
|
Eastern Virgina Bankshares, Inc. |
700 |
10,413 |
|
|
F&M National Corp. |
1,100 |
26,813 |
|
|
Fifth Third Bancorp |
35,253 |
1,628,248 |
|
|
First BanCorp P R |
1,100 |
21,450 |
|
|
First Busey Corp. |
100 |
1,850 |
|
|
First Citizen Bancshares, Inc. |
500 |
32,906 |
|
|
First Commonwealth Financial Corp. |
2,300 |
21,994 |
|
|
First Financial Bancorp Ohio |
2,400 |
40,500 |
|
|
First Financial Bankshares, Inc. |
200 |
6,400 |
|
|
First Financial Corp., Rhode Island |
600 |
6,600 |
|
|
First International Bancorp, Inc. |
700 |
5,600 |
|
|
First Midwest Bancorp, Inc. |
2,300 |
59,369 |
|
|
First Security Corp. |
20,800 |
317,200 |
|
|
First Tennessee National Corp. |
8,200 |
180,400 |
|
|
First Union Corp. |
80,162 |
2,319,688 |
|
|
First United Bancshares, Inc. |
800 |
13,000 |
|
|
First Virginia Banks, Inc. |
2,900 |
123,975 |
|
|
Firstar Corp. |
76,292 |
1,821,471 |
|
|
Firstmerit Corp. |
5,400 |
125,888 |
|
|
FleetBoston Financial Corp. |
63,713 |
2,719,749 |
|
|
FNB Corp. Pennsylvania |
800 |
17,600 |
|
|
Frontier Financial Corp. |
300 |
5,775 |
|
|
Fulton Financial Corp. |
3,953 |
83,013 |
|
|
GBC Bancorp |
300 |
11,363 |
|
|
Gold Banc Corp., Inc. |
5,288 |
28,340 |
|
|
Greater Bay Bancorp |
900 |
55,800 |
|
|
Gulf West Banks, Inc. |
600 |
5,025 |
|
|
Hamilton Bancorp, Inc. (a) |
3,000 |
44,625 |
|
|
Hancock Holding Co. |
300 |
9,638 |
|
|
Harleysville National Corp. |
100 |
3,013 |
|
|
Heritage Commerce Corp. (a) |
600 |
6,188 |
|
|
Hibernia Corp. Class A |
9,800 |
123,113 |
|
|
Hudson United Bancorp |
4,001 |
100,775 |
|
|
Huntington Bancshares, Inc. |
16,102 |
271,721 |
|
|
Imperial Bancorp |
2,216 |
48,198 |
|
|
Integra Bank Corp. |
300 |
5,775 |
|
|
International Bancshares Corp. |
1,675 |
51,402 |
|
|
Irwin Financial Corp. |
400 |
5,925 |
|
|
J.P. Morgan & Co., Inc. |
11,200 |
1,872,500 |
|
|
KeyCorp |
32,100 |
648,019 |
|
|
|
|||
|
Shares |
Value (Note 1) |
||
|
Keystone Financial, Inc. |
2,700 |
$ 62,100 |
|
|
Lamar Capital Corp. |
1,100 |
8,800 |
|
|
M&T Bank Corp. |
512 |
248,160 |
|
|
Marshall & Ilsley Corp. |
6,900 |
336,375 |
|
|
Mellon Financial Corp. |
37,100 |
1,678,775 |
|
|
Mercantile Bankshares Corp. |
4,300 |
148,283 |
|
|
Merchants New York Bancorp, Inc. |
400 |
7,175 |
|
|
Mid-State Bancshares |
200 |
5,950 |
|
|
MidAmerica Bancorp |
100 |
2,600 |
|
|
Nara Bank NA |
400 |
5,000 |
|
|
National City Corp. |
41,420 |
867,231 |
|
|
National Commmerce Bancorp |
18,920 |
365,393 |
|
|
National Penn Bancshares, Inc. |
500 |
10,125 |
|
|
North Fork Bancorp, Inc. |
11,178 |
199,807 |
|
|
Northern Trust Corp. |
16,200 |
1,365,863 |
|
|
Northway Financial, Inc. |
400 |
9,200 |
|
|
Old National Bancorp |
3,300 |
92,606 |
|
|
Omega Financial Corp. |
100 |
2,775 |
|
|
Pacific Capital Bancorp |
1,100 |
29,494 |
|
|
Pacific Century Financial Corp. |
4,400 |
61,600 |
|
|
Park National Corp. |
500 |
45,188 |
|
|
PNC Financial Services Group, Inc. |
24,200 |
1,426,288 |
|
|
Popular, Inc. |
8,800 |
181,500 |
|
|
Premier National Bancorp, Inc. |
300 |
6,075 |
|
|
Provident Financial Group, Inc. |
2,800 |
73,675 |
|
|
R&G Financial Corp. Class B |
1,400 |
14,525 |
|
|
Regions Financial Corp. |
18,258 |
397,112 |
|
|
Republic Bancorp, Inc. |
7,480 |
66,385 |
|
|
Riggs National Corp. |
800 |
9,550 |
|
|
S&T Bancorp, Inc. |
1,000 |
19,734 |
|
|
Santander Bancorp |
1,700 |
19,975 |
|
|
Seacoast Financial Services Corp. |
838 |
8,485 |
|
|
Silicon Valley Bancshares (a) |
5,800 |
334,225 |
|
|
Sky Financial Group, Inc. |
4,500 |
78,750 |
|
|
South Financial Group, Inc. |
1,900 |
24,700 |
|
|
SouthTrust Corp. |
15,700 |
442,544 |
|
|
Southwest Bancorp Texas, Inc. (a) |
1,400 |
40,688 |
|
|
State Street Corp. |
11,100 |
1,307,025 |
|
|
Sterling Bancshares, Inc. |
600 |
8,503 |
|
|
Summit Bancorp |
11,700 |
323,944 |
|
|
Sun Bancorp, Inc. |
4,095 |
30,713 |
|
|
SunTrust Banks, Inc. |
21,528 |
1,062,945 |
|
|
Susquehanna Bancshares, Inc. |
1,600 |
22,900 |
|
|
SVB Financial Services, Inc. |
300 |
2,588 |
|
|
Synovus Finanical Corp. |
18,900 |
372,094 |
|
|
Texas Regional Bancshares, Inc. Class A |
400 |
10,200 |
|
|
TIB Financial Corp. |
900 |
9,169 |
|
|
Trust Co. of New Jersey |
400 |
6,600 |
|
|
Trustco Bank Corp. |
2,400 |
30,900 |
|
|
Trustmark Corp. |
4,000 |
74,000 |
|
|
U.S. Bancorp |
51,721 |
1,124,932 |
|
|
UAB Financial Corp. |
1,100 |
39,669 |
|
|
UCBH Holdings, Inc. |
100 |
3,025 |
|
|
Union Planters Corp. |
8,887 |
269,387 |
|
|
Common Stocks - continued |
|||
|
Shares |
Value (Note 1) |
||
|
FINANCE - continued |
|||
|
Banks - continued |
|||
|
UnionBanCal Corp. |
10,500 |
$ 260,531 |
|
|
United Bankshares, Inc. |
2,100 |
41,738 |
|
|
United National Bancorp |
100 |
1,750 |
|
|
Valley National Bancorp |
3,353 |
88,016 |
|
|
Virginia Commonwealth Financial Corp. |
500 |
10,344 |
|
|
Wachovia Corp. |
15,963 |
914,879 |
|
|
Wells Fargo & Co. |
119,406 |
5,156,847 |
|
|
WesBanco, Inc. |
700 |
16,363 |
|
|
West Coast Bancorp |
220 |
2,173 |
|
|
Westamerica Bancorp. |
3,700 |
112,156 |
|
|
Whitney Holding Corp. |
1,100 |
39,119 |
|
|
Wilmington Trust Corp. |
1,900 |
95,713 |
|
|
Zions Bancorp |
8,768 |
392,368 |
|
|
|
54,787,137 |
||
|
Credit & Other Finance - 2.7% |
|||
|
Aames Financial Corp. (a) |
700 |
481 |
|
|
Actrade Financial Technologies Ltd. (a) |
2,900 |
99,688 |
|
|
Allied Capital Corp. |
6,500 |
131,625 |
|
|
Allstate Financial Corp. (a) |
700 |
700 |
|
|
American Express Co. |
93,600 |
5,534,100 |
|
|
AmeriCredit Corp. (a) |
3,500 |
96,688 |
|
|
AMRESCO, Inc. (a) |
2,480 |
2,790 |
|
|
Associates First Capital Corp. (a) |
1,100 |
34 |
|
|
Associates First Capital Corp. Class A |
48,810 |
1,372,781 |
|
|
Cash America International, Inc. |
400 |
3,000 |
|
|
CIT Group, Inc. Class A |
15,500 |
271,250 |
|
|
Citigroup, Inc. |
314,070 |
18,333,836 |
|
|
Coast Federal Litigation Contingent Payment Rights Trust rights 12/31/00 (a) |
200 |
269 |
|
|
CompuCredit Corp. (a) |
1,500 |
59,438 |
|
|
Concord EFS, Inc. (a) |
12,825 |
412,003 |
|
|
Consumer Portfolio Services, Inc. (a) |
2,400 |
4,200 |
|
|
ContiFinancial Corp. (a) |
1,800 |
36 |
|
|
Countrywide Credit Industries, Inc. |
10,300 |
390,113 |
|
|
Credit Acceptance Corp. (a) |
1,300 |
7,800 |
|
|
Doral Financial Corp. |
1,200 |
17,850 |
|
|
E-Loan, Inc. |
4,000 |
13,875 |
|
|
ePlus, Inc. (a) |
1,200 |
23,475 |
|
|
Equitex, Inc. (a) |
3,100 |
20,150 |
|
|
Finet.Com, Inc. (a) |
4,400 |
2,475 |
|
|
Finova Group, Inc. |
3,400 |
23,588 |
|
|
First Charter Corp. |
3,200 |
51,400 |
|
|
Greenpoint Financial Corp. |
6,520 |
170,335 |
|
|
Heller Financial, Inc. Class A |
7,664 |
190,642 |
|
|
Household International, Inc. |
33,119 |
1,589,712 |
|
|
IMC Mortgage Co. (a) |
400 |
10 |
|
|
Imperial Credit Industries (a) |
1,200 |
2,400 |
|
|
Indymac Bancorp, Inc. |
7,600 |
128,250 |
|
|
Investors Financial Services Corp. |
1,700 |
104,656 |
|
|
LendingTree, Inc. |
5,050 |
24,934 |
|
|
|
|||
|
Shares |
Value (Note 1) |
||
|
MBNA Corp. |
62,600 |
$ 2,210,563 |
|
|
Metris Companies, Inc. |
2,335 |
83,914 |
|
|
MFN Financial Corp.: |
|
|
|
|
warrants 3/23/02 (a) |
10 |
4 |
|
|
warrants 3/23/03 (a) |
10 |
3 |
|
|
warrants 3/23/04 (a) |
10 |
1 |
|
|
New Century Financial Corp. (a) |
3,100 |
35,456 |
|
|
NextCard, Inc. (a) |
2,000 |
16,438 |
|
|
Old Kent Financial Corp. |
8,996 |
263,695 |
|
|
Point West Capital Corp. (a) |
2,800 |
7,525 |
|
|
Providian Financial Corp. |
9,450 |
1,086,159 |
|
|
Resource Bancshares Mortgage |
905 |
4,695 |
|
|
SierraCities.com, Inc. (a) |
1,700 |
5,100 |
|
|
Student Loan Corp. |
200 |
9,538 |
|
|
The Midland Co. |
700 |
18,025 |
|
|
Triad Guaranty, Inc. (a) |
900 |
22,106 |
|
|
Willis Lease Finance Corp. (a) |
1,200 |
9,000 |
|
|
|
32,856,806 |
||
|
Federal Sponsored Credit - 0.6% |
|||
|
Fannie Mae |
75,400 |
4,052,750 |
|
|
Freddie Mac |
51,200 |
2,156,800 |
|
|
USA Education, Inc. |
11,350 |
444,778 |
|
|
|
6,654,328 |
||
|
Insurance - 3.6% |
|||
|
21st Century Holding Co. (a) |
5,100 |
24,225 |
|
|
21st Century Insurance Group |
5,900 |
93,294 |
|
|
Acceptance Insurance Co., Inc. |
900 |
5,288 |
|
|
ACMAT Corp. Class A (a) |
5,200 |
38,025 |
|
|
Aetna, Inc. |
9,900 |
553,781 |
|
|
AFLAC, Inc. |
18,600 |
1,004,400 |
|
|
Alfa Corp. |
2,700 |
51,131 |
|
|
Allcity Insurance Co. (a) |
4,300 |
43,000 |
|
|
Allmerica Financial Corp. |
3,700 |
225,238 |
|
|
Allstate Corp. |
52,249 |
1,518,487 |
|
|
AMBAC Financial Group, Inc. |
4,900 |
316,663 |
|
|
American Financial Group, Inc. |
4,100 |
101,731 |
|
|
American General Corp. |
17,429 |
1,269,049 |
|
|
American International Group, Inc. |
158,373 |
14,114,994 |
|
|
American National Insurance Co. |
1,800 |
110,700 |
|
|
Amerus Life Holdings, Inc. |
1,767 |
43,623 |
|
|
Amwest Insurance Group, Inc. |
4,800 |
22,200 |
|
|
Aon Corp. |
16,350 |
610,059 |
|
|
Arch Capital Group Ltd. (a) |
900 |
13,669 |
|
|
Argonaut Group, Inc. |
1,500 |
24,750 |
|
|
Arthur J. Gallagher & Co. |
1,500 |
73,500 |
|
|
Atlantic American Corp. (a) |
100 |
225 |
|
|
Baldwin & Lyons, Inc. Class B |
900 |
17,494 |
|
|
Berkshire Hathaway, Inc. Class A (a) |
107 |
6,173,900 |
|
|
Capitol Transamerica Corp. |
800 |
9,450 |
|
|
Ceres Group, Inc. (a) |
1,100 |
7,288 |
|
|
ChoicePoint, Inc. (a) |
1,500 |
70,313 |
|
|
CIGNA Corp. |
11,400 |
1,108,650 |
|
|
Common Stocks - continued |
|||
|
Shares |
Value (Note 1) |
||
|
FINANCE - continued |
|||
|
Insurance - continued |
|||
|
Cincinnati Financial Corp. |
11,300 |
$ 439,288 |
|
|
Citizens Financial Corp. (a) |
200 |
2,700 |
|
|
Citizens, Inc. Class A |
1,800 |
11,588 |
|
|
Claimsnet.com, Inc. (a) |
3,100 |
12,884 |
|
|
CNA Financial Corp. (a) |
12,800 |
508,000 |
|
|
CNA Surety Corp. |
3,000 |
34,688 |
|
|
Commerce Group, Inc. |
2,400 |
62,400 |
|
|
Conseco, Inc. |
22,840 |
192,713 |
|
|
Cotton State Life & Health Insurance Co. |
500 |
4,688 |
|
|
Crawford & Co. Class B |
100 |
1,244 |
|
|
Danielson Holding Corp. (a) |
1,300 |
5,525 |
|
|
Delphi Financial Group, Inc. Class A |
1,460 |
60,408 |
|
|
Donegal Group, Inc. |
600 |
4,275 |
|
|
E.W. Blanch Holdings, Inc. |
800 |
17,550 |
|
|
EMC Insurance Group |
800 |
7,700 |
|
|
Enhance Financial Services Group, Inc. |
2,700 |
42,525 |
|
|
Erie Indemnity Co. Class A |
2,900 |
89,719 |
|
|
Farm Family Holdings, Inc. (a) |
400 |
12,050 |
|
|
FBL Financial Group, Inc. Class A |
2,100 |
30,975 |
|
|
Fidelity National Financial, Inc. |
4,751 |
94,723 |
|
|
Financial Industries Corp. |
500 |
4,563 |
|
|
First American Corp. Calif |
4,500 |
74,250 |
|
|
First Health Group Corp. (a) |
4,300 |
133,569 |
|
|
FPIC Insurance Group, Inc. (a) |
700 |
10,631 |
|
|
Fremont General Corp. |
4,300 |
13,706 |
|
|
Frontier Insurance Group, Inc. |
13,330 |
4,166 |
|
|
Gainsco, Inc. |
1,500 |
5,813 |
|
|
Great American Financial Resources, Inc. |
3,000 |
53,813 |
|
|
Harleysville Group, Inc. |
2,000 |
38,500 |
|
|
Hartford Financial Services Group, Inc. |
15,100 |
1,006,038 |
|
|
HCC Insurance Holdings, Inc. |
3,500 |
73,938 |
|
|
Healthcare Recoveries, Inc. (a) |
400 |
1,675 |
|
|
HealthExtras, Inc. |
1,400 |
5,775 |
|
|
Healthplan Services Corp. |
500 |
1,813 |
|
|
Highlands Insurance Group, Inc. (a) |
1,000 |
8,938 |
|
|
Horace Mann Educators Corp. |
2,900 |
44,225 |
|
|
HSB Group, Inc. |
2,000 |
79,875 |
|
|
Independence Holding Co. |
660 |
8,415 |
|
|
INSpire Insurance Solutions, Inc. (a) |
4,600 |
11,500 |
|
|
Intercontinental Life Corp. (a) |
700 |
6,388 |
|
|
Investors Title Co. |
200 |
2,150 |
|
|
Jefferson-Pilot Corp. |
7,200 |
476,550 |
|
|
John Hancock Financial Services, Inc. |
22,300 |
563,075 |
|
|
Kansas City Life Insurance Co. |
900 |
30,038 |
|
|
LandAmerica Financial Group, Inc. |
900 |
22,894 |
|
|
Liberty Corp. (The) |
900 |
34,650 |
|
|
Liberty Financial Companies, Inc. |
3,400 |
80,325 |
|
|
Lincoln National Corp. |
13,400 |
723,600 |
|
|
Loews Corp. |
6,900 |
558,469 |
|
|
Markel Corp. (a) |
500 |
72,938 |
|
|
|
|||
|
Shares |
Value (Note 1) |
||
|
Marsh & McLennan Companies, Inc. |
20,750 |
$ 2,464,063 |
|
|
MBIA, Inc. |
6,893 |
453,215 |
|
|
Medical Assurance, Inc. |
1,615 |
18,774 |
|
|
MEEMIC Holdings, Inc. (a) |
500 |
9,906 |
|
|
Mercury General Corp. |
3,800 |
104,263 |
|
|
Meridian Insurance Group, Inc. |
3,300 |
57,544 |
|
|
MetLife, Inc. |
14,200 |
345,238 |
|
|
MGIC Investment Corp. |
7,400 |
435,213 |
|
|
MIIX Group, Inc. |
1,100 |
8,869 |
|
|
MONY Group, Inc. |
3,300 |
124,781 |
|
|
Motor Club of America (a) |
4,400 |
35,750 |
|
|
National Security Group, Inc. |
2,900 |
43,138 |
|
|
National Western Life Insurance Co. Class A (a) |
200 |
13,963 |
|
|
Nationwide Financial Services, Inc. |
5,800 |
231,275 |
|
|
Navigators Group, Inc. (a) |
600 |
6,900 |
|
|
Nymagic, Inc. |
700 |
9,931 |
|
|
Ohio Casualty Corp. |
4,200 |
30,975 |
|
|
Old Guard Group, Inc. |
300 |
3,525 |
|
|
Old Republic International Corp. |
8,350 |
199,878 |
|
|
Penn Treaty American Corp. (a) |
600 |
10,725 |
|
|
Penn-America Group, Inc. |
500 |
3,688 |
|
|
Philadelphia Consolidated Holding Corp. (a) |
800 |
13,200 |
|
|
PICO Holdings, Inc. (a) |
1,200 |
16,575 |
|
|
PMA Capital Corp. |
1,500 |
25,313 |
|
|
PMI Group, Inc. |
3,050 |
189,100 |
|
|
Presidential Life Corp. |
2,200 |
33,275 |
|
|
Professionals Group, Inc. (a) |
600 |
13,725 |
|
|
Progressive Corp. |
5,100 |
386,644 |
|
|
Protective Life Corp. |
4,586 |
131,848 |
|
|
Radian Group, Inc. |
2,666 |
165,625 |
|
|
Reinsurance Group of America, Inc. |
3,500 |
99,750 |
|
|
Reliance Group Holdings, Inc. |
7,100 |
1,553 |
|
|
Reliastar Financial Corp. |
6,400 |
344,400 |
|
|
RLI Corp. |
700 |
26,950 |
|
|
SAFECO Corp. |
8,900 |
234,181 |
|
|
SCPIE Holding, Inc. |
700 |
15,225 |
|
|
Selective Insurance Group, Inc. |
1,800 |
32,288 |
|
|
StanCorp Financial Group, Inc. |
2,200 |
88,000 |
|
|
State Auto Financial Corp. |
2,700 |
33,919 |
|
|
Stewart Information Services Corp. |
1,000 |
13,438 |
|
|
The Chubb Corp. |
12,264 |
938,963 |
|
|
The St. Paul Companies, Inc. |
14,906 |
709,898 |
|
|
Torchmark Corp. |
9,000 |
252,563 |
|
|
Transatlantic Holdings, Inc. |
2,400 |
209,250 |
|
|
Trenwick Group, Inc. |
1,300 |
24,619 |
|
|
UICI (a) |
1,400 |
9,275 |
|
|
Unico American Corp. |
500 |
3,438 |
|
|
United Fire & Casualty Co. |
700 |
13,038 |
|
|
United Trust Group, Inc. (a) |
300 |
1,875 |
|
|
Unitrin, Inc. |
4,900 |
149,144 |
|
|
UnumProvident Corp. |
16,793 |
364,198 |
|
|
Common Stocks - continued |
|||
|
Shares |
Value (Note 1) |
||
|
FINANCE - continued |
|||
|
Insurance - continued |
|||
|
Vesta Insurance Group Corp. |
1,300 |
$ 6,581 |
|
|
W.R. Berkley Corp. |
1,800 |
47,700 |
|
|
Wesco Financial Corp. |
500 |
120,000 |
|
|
White Mountains Insurance Group Ltd. |
100 |
16,300 |
|
|
Zenith National Insurance Corp. |
1,200 |
27,825 |
|
|
|
42,804,340 |
||
|
Investment Companies - 0.0% |
|||
|
Harris & Harris Group, Inc. (a) |
6,600 |
47,850 |
|
|
THCG, Inc. (a) |
1,400 |
5,644 |
|
|
Waterside Capital Corp. |
1,100 |
6,497 |
|
|
Winfield Capital Corp. (a) |
1,500 |
18,563 |
|
|
|
78,554 |
||
|
Savings & Loans - 0.5% |
|||
|
Ambanc Holding Co., Inc. |
300 |
4,538 |
|
|
Anchor Bancorp Wisconsin, Inc. |
800 |
13,050 |
|
|
Astoria Financial Corp. |
11,275 |
396,034 |
|
|
Bank Plus Corp. (a) |
1,100 |
3,713 |
|
|
Bank United Corp. Class A |
6,900 |
310,500 |
|
|
BankUnited Financial Corp. Class A (a) |
500 |
3,750 |
|
|
Bay View Capital Corp. |
4,712 |
45,942 |
|
|
Bedford Bancshares, Inc. |
300 |
2,588 |
|
|
Big Foot Financial Corp. |
700 |
8,138 |
|
|
Brookline Bancorp, Inc. |
600 |
7,088 |
|
|
BSB Bancorp, Inc. |
100 |
2,200 |
|
|
Capitol Federal Financial |
4,900 |
71,050 |
|
|
CFS Bancorp, Inc. |
800 |
8,100 |
|
|
Charter One Financial, Inc. |
18,096 |
429,780 |
|
|
Citizens First Financial Corp. |
600 |
7,950 |
|
|
Columbia Financial of Kentucky, Inc. |
800 |
7,000 |
|
|
Commercial Federal Corp. |
3,750 |
67,734 |
|
|
Dime Bancorp, Inc. |
14,900 |
273,788 |
|
|
Downey Financial Corp. |
1,500 |
50,250 |
|
|
First Indiana Corp. |
100 |
2,094 |
|
|
First Niagara Financial Group, Inc. |
100 |
966 |
|
|
First Securityfed Financial, Inc. |
800 |
11,100 |
|
|
First Sentinel Bancorp, Inc. |
800 |
7,300 |
|
|
FirstFed Financial Corp. (a) |
200 |
3,600 |
|
|
FirstSpartan Financial Corp. |
600 |
12,000 |
|
|
Golden State Bancorp, Inc. |
7,836 |
157,700 |
|
|
Golden West Financial Corp. |
13,800 |
657,225 |
|
|
GS Financial Corp. |
600 |
7,800 |
|
|
Guaranty Federal Bancshares, Inc. |
800 |
9,550 |
|
|
Harbor Florida Bancshares, Inc. |
500 |
5,969 |
|
|
Harrington Financial Group, Inc. |
1,200 |
8,250 |
|
|
Harris Financial, Inc. |
200 |
1,525 |
|
|
Heritage Financial Corp. |
1,300 |
12,350 |
|
|
Home City Financial Corp. |
600 |
5,775 |
|
|
HomeFed Corp. (a) |
79 |
56 |
|
|
Hudson City Bancorp, Inc. |
7,100 |
122,919 |
|
|
Independence Community Bank Corp. |
3,600 |
48,825 |
|
|
|
|||
|
Shares |
Value (Note 1) |
||
|
ITLA Capital Corp. (a) |
900 |
$ 12,600 |
|
|
Life Financial Corp. (a) |
200 |
625 |
|
|
MAF Bancorp., Inc. |
900 |
19,350 |
|
|
Montgomery Financial Corp. |
700 |
6,825 |
|
|
Mystic Financial, Inc. |
600 |
7,988 |
|
|
Net.B@nk, Inc. (a) |
3,300 |
37,538 |
|
|
Northwest Bancorp, Inc. |
1,200 |
10,200 |
|
|
Ocwen Financial Corp. (a) |
5,197 |
29,558 |
|
|
Oregon Trail Financial Corp. |
800 |
8,900 |
|
|
People's Bank |
3,700 |
78,163 |
|
|
Peoples Financial Corp. |
1,100 |
6,188 |
|
|
Provident Bankshares Corp. |
771 |
10,987 |
|
|
Provident Financial Holdings, Inc. (a) |
600 |
10,800 |
|
|
PS Financial, Inc. |
600 |
6,638 |
|
|
Queens County Bancorp, Inc. |
900 |
23,738 |
|
|
Republic Security Financial Corp. |
1,800 |
7,763 |
|
|
Richmond County Financial Corp. |
1,200 |
24,150 |
|
|
Roslyn Bancorp, Inc. |
11,360 |
225,070 |
|
|
Sovereign Bancorp, Inc. |
35,494 |
301,699 |
|
|
Staten Island Bancorp, Inc. |
1,700 |
31,344 |
|
|
Sterling Financial Corp. (a) |
100 |
1,138 |
|
|
TCF Financial Corp. |
5,100 |
167,344 |
|
|
United Community Financial Corp. |
7,200 |
45,450 |
|
|
USABancShares, Inc. (a) |
3,900 |
13,650 |
|
|
W Holding Co., Inc. |
1,400 |
13,213 |
|
|
Washington Federal, Inc. |
3,921 |
81,361 |
|
|
Washington Mutual, Inc. |
39,610 |
1,386,350 |
|
|
Webster Financial Corp. |
8,668 |
213,720 |
|
|
Westcorp, Inc. |
700 |
9,144 |
|
|
|
5,579,691 |
||
|
Securities Industry - 2.3% |
|||
|
A.B. Watley Group, Inc. (a) |
900 |
14,738 |
|
|
A.G. Edwards, Inc. |
6,300 |
327,600 |
|
|
Acacia Research Corp. (a) |
1,400 |
38,413 |
|
|
Advest Group, Inc. |
900 |
27,506 |
|
|
Affiliated Managers Group, Inc. (a) |
1,700 |
94,775 |
|
|
Alleghany Corp. |
510 |
88,963 |
|
|
Alliance Capital Management Holding LP |
12,200 |
631,350 |
|
|
American Capital Strategies Ltd. |
1,900 |
45,363 |
|
|
Ameritrade Holding Corp. Class A (a) |
11,200 |
210,700 |
|
|
AXA Financial, Inc. |
30,300 |
1,568,025 |
|
|
Bear Stearns Companies, Inc. |
7,814 |
524,026 |
|
|
BlackRock, Inc. Class A |
800 |
32,800 |
|
|
Charles Schwab Corp. |
95,302 |
3,639,345 |
|
|
Dain Rauscher Corp. |
1,000 |
80,438 |
|
|
DLJ, Inc. |
9,000 |
796,500 |
|
|
E*Trade Group, Inc. (a) |
19,495 |
346,036 |
|
|
Eaton Vance Corp. (non-vtg.) |
2,600 |
125,938 |
|
|
eSpeed, Inc. Class A |
2,500 |
76,875 |
|
|
Federated Investors, Inc. Class B (non-vtg.) |
8,549 |
200,367 |
|
|
First Albany Companies, Inc. |
800 |
14,000 |
|
|
Franklin Resources, Inc. |
17,200 |
653,600 |
|
|
Common Stocks - continued |
|||
|
Shares |
Value (Note 1) |
||
|
FINANCE - continued |
|||
|
Securities Industry - continued |
|||
|
Friedman, Billings, Ramsey Group, Inc. Class A (a) |
2,500 |
$ 18,594 |
|
|
Gabelli Asset Management, Inc. |
600 |
18,075 |
|
|
Global Capital Partners, Inc. (a) |
1,400 |
9,625 |
|
|
GlobalNet Financial.com, Inc. (a) |
1,400 |
13,825 |
|
|
Goldman Sachs Group, Inc. |
5,100 |
653,119 |
|
|
H.D. Vest, Inc. (a) |
1,300 |
7,963 |
|
|
Hoenig Group, Inc. (a) |
1,100 |
11,275 |
|
|
Investment Technology Group, Inc. (a) |
2,276 |
109,248 |
|
|
JB Oxford Holdings, Inc. (a) |
13,300 |
60,266 |
|
|
Jefferies Group, Inc. |
1,900 |
57,831 |
|
|
John Nuveen Co. (The) Class A |
2,300 |
104,363 |
|
|
JWGenesis Financial Corp. (a) |
1,300 |
19,338 |
|
|
Kinnard Investments, Inc. (a) |
1,000 |
8,750 |
|
|
Knight Trading Group, Inc. (a) |
8,800 |
276,100 |
|
|
LaBranche & Co., Inc. |
3,700 |
111,463 |
|
|
Legg Mason, Inc. |
1,600 |
84,400 |
|
|
Lehman Brothers Holdings, Inc. |
8,500 |
1,232,500 |
|
|
Merrill Lynch & Co., Inc. |
27,100 |
3,929,500 |
|
|
Meyerson & Co., Inc. (a) |
1,900 |
10,094 |
|
|
Morgan Keegan, Inc. |
2,300 |
46,144 |
|
|
Morgan Stanley Dean Witter & Co. |
79,100 |
8,508,194 |
|
|
National Discount Brokers Group, Inc. (a) |
1,400 |
50,663 |
|
|
Neuberger Berman, Inc. |
3,500 |
207,156 |
|
|
Nvest LP |
3,200 |
125,000 |
|
|
Olympic Cascade Financial Corp. (a) |
1,200 |
8,700 |
|
|
PaineWebber Group, Inc. |
10,250 |
732,875 |
|
|
Paulson Capital Corp. (a) |
1,000 |
7,438 |
|
|
Phoenix Investment Partners Ltd. |
3,500 |
52,063 |
|
|
Pioneer Group, Inc. (a) |
4,100 |
178,863 |
|
|
Raymond James Financial, Inc. |
3,450 |
98,325 |
|
|
Security Capital Group, Inc. Class B (a) |
2,000 |
34,000 |
|
|
Siebert Financial Corp. |
2,400 |
21,750 |
|
|
Southwest Securities Group, Inc. |
2,188 |
72,614 |
|
|
SRS Labs, Inc. (a) |
2,700 |
23,963 |
|
|
Stifel Financial Corp. |
1,000 |
13,000 |
|
|
Stilwell Financial, Inc. (a) |
11,400 |
551,475 |
|
|
SurModics, Inc. (a) |
600 |
27,300 |
|
|
T. Rowe Price Associates, Inc. |
8,600 |
389,150 |
|
|
TC Pipelines LP |
700 |
12,775 |
|
|
TD Waterhouse Group, Inc. (a) |
3,200 |
64,800 |
|
|
Tucker Anthony Sutro Corp. |
1,900 |
44,769 |
|
|
United Asset Management Corp. |
4,200 |
102,900 |
|
|
Value Line, Inc. |
200 |
7,175 |
|
|
Waddell & Reed Financial, Inc. Class A |
5,868 |
204,646 |
|
|
Web Street, Inc. |
4,500 |
11,250 |
|
|
|
|||
|
Shares |
Value (Note 1) |
||
|
Wit Soundview Group, Inc. (a) |
5,600 |
$ 51,800 |
|
|
Ziegler Companies, Inc. |
500 |
8,063 |
|
|
|
27,930,538 |
||
|
TOTAL FINANCE |
170,691,394 |
||
|
HEALTH - 10.2% |
|||
|
Drugs & Pharmaceuticals - 7.0% |
|||
|
Aastrom Biosciences, Inc. (a) |
1,900 |
6,353 |
|
|
Abgenix, Inc. (a) |
5,000 |
375,859 |
|
|
Accredo Health, Inc. (a) |
100 |
4,331 |
|
|
Advanced Photonix, Inc. Class A (a) |
15,300 |
51,638 |
|
|
Advanced Tissue Sciences, Inc. |
1,500 |
10,688 |
|
|
Albany Molecular Research, Inc. (a) |
1,200 |
42,900 |
|
|
Alexion Pharmaceuticals, Inc. (a) |
1,400 |
147,000 |
|
|
Alkermes, Inc. (a) |
2,900 |
134,125 |
|
|
Allergan Specialty Therapeutics, Inc. Class A (a) |
15 |
276 |
|
|
Allergan, Inc. |
8,600 |
628,875 |
|
|
Alliance Pharmaceutical Corp. (a) |
300 |
4,575 |
|
|
Alpharma, Inc. Class A |
2,500 |
141,563 |
|
|
ALZA Corp. (a) |
6,720 |
508,200 |
|
|
American Biogenetic Sciences Class A (a) |
7,500 |
12,656 |
|
|
American Home Products Corp. |
90,500 |
4,903,969 |
|
|
Amgen, Inc. (a) |
71,200 |
5,397,850 |
|
|
Amylin Pharmaceuticals, Inc. (a) |
2,100 |
28,481 |
|
|
Andrx Corp. (a) |
5,400 |
469,800 |
|
|
Anesta Corp. (a) |
4,100 |
97,631 |
|
|
Antigenics, Inc. |
1,300 |
21,938 |
|
|
Aquila Biopharmaceuticals, Inc. (a) |
4,200 |
19,425 |
|
|
ARIAD Pharmaceuticals, Inc. (a) |
6,500 |
82,063 |
|
|
ArQule, Inc. (a) |
3,400 |
69,913 |
|
|
AutoImmune, Inc. (a) |
11,700 |
27,422 |
|
|
AVI BioPharma, Inc. (a) |
2,700 |
24,806 |
|
|
Avigen, Inc. (a) |
1,600 |
58,300 |
|
|
Aviron (a) |
3,100 |
139,500 |
|
|
AXYS Pharmaceuticals, Inc. (a) |
5,135 |
39,796 |
|
|
Barr Laboratories, Inc. (a) |
1,800 |
127,800 |
|
|
Bausch & Lomb, Inc. |
3,200 |
114,400 |
|
|
Bio-Technology General Corp. (a) |
6,300 |
87,806 |
|
|
BioCryst Pharmaceuticals, Inc. (a) |
1,700 |
54,294 |
|
|
Biogen, Inc. (a) |
9,800 |
677,425 |
|
|
BioMarin Pharmaceutical, Inc. |
700 |
11,813 |
|
|
Biomatrix, Inc. (a) |
1,800 |
38,250 |
|
|
Biosite Diagnostics, Inc. (a) |
2,300 |
159,994 |
|
|
BioSource International, Inc. (a) |
3,700 |
80,938 |
|
|
BioTime, Inc. (a) |
400 |
3,025 |
|
|
Boston Life Sciences, Inc. (a) |
5,500 |
42,625 |
|
|
Bristol-Myers Squibb Co. |
137,200 |
7,271,600 |
|
|
Cambrex Corp. |
1,000 |
46,938 |
|
|
Carter-Wallace, Inc. |
3,000 |
79,875 |
|
|
Catalytica, Inc. (a) |
2,500 |
33,281 |
|
|
Celgene Corp. (a) |
3,800 |
281,200 |
|
|
Common Stocks - continued |
|||
|
Shares |
Value (Note 1) |
||
|
HEALTH - continued |
|||
|
Drugs & Pharmaceuticals - continued |
|||
|
Cell Genesys, Inc. (a) |
4,600 |
$ 141,738 |
|
|
Cell Pathways, Inc. (a) |
3,100 |
103,656 |
|
|
Cell Therapeutics, Inc. (a) |
3,400 |
158,100 |
|
|
Cephalon, Inc. (a) |
1,900 |
95,594 |
|
|
Cerus Corp. (a) |
300 |
15,919 |
|
|
Chattem, Inc. (a) |
400 |
4,875 |
|
|
Chirex, Inc. (a) |
3,500 |
108,938 |
|
|
Chiron Corp. (a) |
11,800 |
637,938 |
|
|
Collagenex Pharmaceuticals, Inc. (a) |
2,200 |
21,450 |
|
|
Columbia Laboratories, Inc. (a) |
1,300 |
7,150 |
|
|
COR Therapeutics, Inc. (a) |
3,000 |
168,750 |
|
|
Corixa Corp. (a) |
400 |
20,475 |
|
|
Coulter Pharmaceutical, Inc. (a) |
500 |
15,656 |
|
|
Cubist Pharmaceuticals, Inc. (a) |
2,400 |
146,700 |
|
|
CuraGen Corp. (a) |
2,100 |
93,188 |
|
|
Curative Health Services, Inc. (a) |
1,000 |
5,125 |
|
|
CV Therapeutics, Inc. (a) |
2,400 |
180,000 |
|
|
Cytoclonal Pharmaceuticals, Inc. (a) |
3,400 |
32,513 |
|
|
CYTOGEN Corp. (a) |
3,800 |
33,725 |
|
|
Cytyc Corp. (a) |
1,900 |
88,588 |
|
|
Dexter Corp. |
1,600 |
94,600 |
|
|
Diagnostic Products Corp. |
100 |
4,238 |
|
|
Discovery Laboratories, Inc. (a) |
3,900 |
22,425 |
|
|
Dura Pharmaceuticals, Inc. (a) |
3,100 |
85,444 |
|
|
Duramed Pharmaceuticals, Inc. (a) |
2,000 |
13,500 |
|
|
Elan Corp. PLC rights 1/15/03 (a) |
4,300 |
4,031 |
|
|
Eli Lilly & Co. |
80,200 |
5,854,600 |
|
|
Emisphere Technologies, Inc. (a) |
600 |
19,800 |
|
|
Enchira Biotechnology Corp. (a) |
1,700 |
10,413 |
|
|
Endo Pharmaceuticals Holdings, Inc. (a) |
500 |
2,563 |
|
|
Endo Pharmaceuticals Holdings, Inc. warrants 12/31/02 (a) |
500 |
1,188 |
|
|
EntreMed, Inc. (a) |
500 |
14,875 |
|
|
Enzo Biochem, Inc. (a) |
1,305 |
78,300 |
|
|
Enzon, Inc. (a) |
2,400 |
146,100 |
|
|
Epimmune, Inc. (a) |
3,100 |
16,663 |
|
|
Exelixis, Inc. |
2,600 |
117,000 |
|
|
Forest Laboratories, Inc. (a) |
5,600 |
548,100 |
|
|
GelTex Pharmaceuticals, Inc. (a) |
3,900 |
158,011 |
|
|
Gene Logic, Inc. (a) |
3,000 |
73,688 |
|
|
Genelabs Technologies, Inc. (a) |
7,300 |
29,656 |
|
|
Genencor International, Inc. |
4,100 |
127,613 |
|
|
Genentech, Inc. |
5,700 |
1,085,850 |
|
|
Genome Therapeutics Corp. (a) |
3,300 |
82,913 |
|
|
Genta, Inc. (a) |
8,400 |
74,550 |
|
|
Genzyme Corp.: |
|
|
|
|
General Division (a) |
5,400 |
405,338 |
|
|
Molecular Oncology (a) |
3,918 |
54,852 |
|
|
Genzyme Transgenics Corp. (a) |
4,200 |
156,188 |
|
|
Geron Corp. (a) |
1,300 |
42,006 |
|
|
Gilead Sciences, Inc. (a) |
2,700 |
291,600 |
|
|
|
|||
|
Shares |
Value (Note 1) |
||
|
Gliatech, Inc. (a) |
4,000 |
$ 32,000 |
|
|
Guilford Pharmaceuticals, Inc. (a) |
300 |
8,025 |
|
|
Hemispherx Biopharma, Inc. (a) |
800 |
4,850 |
|
|
Herbalife International, Inc. Class A |
433 |
4,195 |
|
|
Hollis-Eden Pharmaceutcals, Inc. (a) |
1,300 |
12,838 |
|
|
Human Genome Sciences, Inc. (a) |
3,600 |
600,975 |
|
|
Hyseq, Inc. (a) |
800 |
33,550 |
|
|
ICN Pharmaceuticals, Inc. |
4,200 |
118,913 |
|
|
ICOS Corp. (a) |
3,100 |
181,931 |
|
|
IDEC Pharmaceuticals Corp. (a) |
2,800 |
390,950 |
|
|
IDEXX Laboratories, Inc. (a) |
1,200 |
31,350 |
|
|
IGEN International, Inc. (a) |
1,900 |
36,100 |
|
|
Ilex Oncology, Inc. (a) |
2,500 |
82,500 |
|
|
ImClone Systems, Inc. (a) |
1,700 |
163,838 |
|
|
Immtech International, Inc. (a) |
1,200 |
25,500 |
|
|
Immune Response Corp. (a) |
6,200 |
55,800 |
|
|
Immunex Corp. (a) |
36,900 |
1,854,225 |
|
|
Immunomedics, Inc. (a) |
2,200 |
55,000 |
|
|
Incyte Genomics, Inc. (a) |
1,800 |
149,288 |
|
|
Inhale Therapeutic Systems, Inc. (a) |
2,800 |
141,400 |
|
|
InKine Pharmaceutical, Inc. (a) |
5,200 |
49,400 |
|
|
Intermune Pharmaceuticals, Inc. |
3,300 |
125,606 |
|
|
International Isotopes, Inc. (a) |
100 |
363 |
|
|
Interneuron Pharmaceuticals, Inc. (a) |
10,700 |
24,409 |
|
|
IntraBiotics Pharmaceuticals, Inc. |
1,000 |
21,000 |
|
|
Invitrogen Corp. (a) |
1,600 |
101,000 |
|
|
Isis Pharmaceuticals Co. (a) |
3,700 |
48,331 |
|
|
IVAX Corp. (a) |
10,200 |
353,175 |
|
|
Jones Pharma, Inc. |
4,575 |
163,556 |
|
|
King Pharmaceuticals, Inc. (a) |
6,425 |
206,403 |
|
|
Kos Pharmaceuticals, Inc. (a) |
900 |
12,600 |
|
|
KV Pharmaceutical Co. Class A (a) |
200 |
7,950 |
|
|
Lexicon Genetics, Inc. |
2,800 |
93,100 |
|
|
LifeCell Corp. (a) |
5,100 |
25,022 |
|
|
Ligand Pharmaceuticals, Inc. Class B (a) |
1,900 |
24,700 |
|
|
Lynx Therapeutics, Inc. (a) |
700 |
24,325 |
|
|
Matrix Pharmaceutical, Inc. (a) |
4,500 |
65,813 |
|
|
Maxim Pharmaceuticals, Inc. (a) |
1,500 |
91,781 |
|
|
Maxygen, Inc. |
1,700 |
91,375 |
|
|
Medarex, Inc. (a) |
2,000 |
221,000 |
|
|
Medicis Pharmaceutical Corp. Class A (a) |
1,450 |
93,434 |
|
|
Medimmune, Inc. (a) |
14,000 |
1,177,750 |
|
|
Merck & Co., Inc. |
164,900 |
11,522,388 |
|
|
Microvision, Inc. (a) |
1,800 |
73,575 |
|
|
Millennium Pharmaceuticals, Inc. (a) |
6,100 |
873,063 |
|
|
Mylan Laboratories, Inc. |
7,500 |
199,219 |
|
|
Myriad Genetics, Inc. (a) |
800 |
111,900 |
|
|
Nanogen, Inc. (a) |
1,100 |
26,538 |
|
|
Nature's Sunshine Products, Inc. |
700 |
5,513 |
|
|
NBTY, Inc. (a) |
21,100 |
149,019 |
|
|
NeoRX Corp. (a) |
5,500 |
104,500 |
|
|
Neose Technologies, Inc. (a) |
100 |
4,100 |
|
|
NeoTherapeutics, Inc. (a) |
4,900 |
38,281 |
|
|
Noven Pharmaceuticals, Inc. (a) |
4,300 |
180,600 |
|
|
Common Stocks - continued |
|||
|
Shares |
Value (Note 1) |
||
|
HEALTH - continued |
|||
|
Drugs & Pharmaceuticals - continued |
|||
|
NPS Pharmaceuticals, Inc. (a) |
4,100 |
$ 181,425 |
|
|
ONYX Pharmaceuticals, Inc. (a) |
3,900 |
103,350 |
|
|
Orchid BioSciences, Inc. |
2,300 |
103,356 |
|
|
Organogenesis, Inc. (a) |
950 |
15,438 |
|
|
OSI Pharmaceuticals, Inc. (a) |
3,400 |
169,947 |
|
|
Paradigm Genetics, Inc. |
4,900 |
80,850 |
|
|
PAREXEL International Corp. (a) |
1,800 |
17,944 |
|
|
PathoGenesis Corp. (a) |
900 |
34,425 |
|
|
PE Corp. - Celera Genomics Group (a) |
3,518 |
381,483 |
|
|
Pfizer, Inc. |
441,025 |
19,074,331 |
|
|
Pharmaceutical Product Development, Inc. (a) |
5,200 |
114,075 |
|
|
Pharmacyclics, Inc. (a) |
1,600 |
80,200 |
|
|
PharmaPrint, Inc. (a) |
15,400 |
4,928 |
|
|
Pharmos Corp. (a) |
12,700 |
52,784 |
|
|
PRAECIS Pharmaceuticals, Inc. |
1,700 |
74,481 |
|
|
Progenics Pharmaceuticals, Inc. (a) |
3,300 |
97,350 |
|
|
Protein Design Labs, Inc. (a) |
2,400 |
182,400 |
|
|
Pure World, Inc. (a) |
330 |
763 |
|
|
Quintiles Transnational Corp. (a) |
6,866 |
95,695 |
|
|
Regeneron Pharmaceuticals, Inc. (a) |
1,100 |
38,981 |
|
|
Repligen Corp. (a) |
8,100 |
61,256 |
|
|
Ribozyme Pharmaceuticals, Inc. (a) |
3,600 |
103,950 |
|
|
Rosetta Inpharmatics, Inc. |
2,100 |
74,288 |
|
|
Sangamo Biosciences, Inc. |
1,000 |
49,250 |
|
|
Sangstat Medical Corp. (a) |
900 |
18,225 |
|
|
Schering-Plough Corp. |
101,500 |
4,072,688 |
|
|
SciClone Pharmaceuticals, Inc. (a) |
7,400 |
87,413 |
|
|
Scios, Inc. (a) |
2,400 |
24,300 |
|
|
Sepracor, Inc. (a) |
4,800 |
528,000 |
|
|
Serologicals Corp. (a) |
3,450 |
27,384 |
|
|
SICOR, Inc. (a) |
2,300 |
22,281 |
|
|
Sigma-Aldrich Corp. |
10,700 |
310,969 |
|
|
SonoSight, Inc. (a) |
333 |
11,135 |
|
|
SpeechWorks International, Inc. |
2,000 |
153,250 |
|
|
StemCells, Inc. (a) |
16,000 |
144,000 |
|
|
SuperGen, Inc. (a) |
2,600 |
51,188 |
|
|
Symyx Technologies, Inc. |
1,700 |
63,113 |
|
|
Syntroleum Corp. (a) |
1,600 |
27,200 |
|
|
Tanox, Inc. |
2,200 |
102,300 |
|
|
Targeted Genetics Corp. (a) |
2,100 |
28,350 |
|
|
TCPI, Inc. (a) |
12,800 |
7,600 |
|
|
Techniclone Corp. (a) |
5,500 |
15,297 |
|
|
Texas Biotechnology Corp. (a) |
700 |
12,338 |
|
|
Theragenics Corp. (a) |
1,300 |
9,263 |
|
|
Titan Pharmaceuticals, Inc. (a) |
800 |
37,550 |
|
|
Transkaryotic Therapies, Inc. (a) |
2,500 |
108,438 |
|
|
Trimeris, Inc. (a) |
1,200 |
82,800 |
|
|
Tularik, Inc. |
2,200 |
73,425 |
|
|
Twinlab Corp. (a) |
1,200 |
5,925 |
|
|
United Therapeutics Corp. (a) |
2,000 |
172,719 |
|
|
|
|||
|
Shares |
Value (Note 1) |
||
|
VaxGen, Inc. |
2,900 |
$ 71,775 |
|
|
Ventana Medical Systems, Inc. (a) |
700 |
19,556 |
|
|
Vertex Pharmaceuticals, Inc. (a) |
3,200 |
272,000 |
|
|
Vical, Inc. (a) |
1,900 |
46,550 |
|
|
Vion Pharmaceuticals, Inc. (a) |
4,600 |
81,938 |
|
|
Viragen, Inc. (a) |
14,300 |
21,450 |
|
|
ViroLogic, Inc. |
1,600 |
32,600 |
|
|
ViroPharma, Inc. (a) |
1,200 |
33,600 |
|
|
Vivus, Inc. (a) |
12,300 |
63,806 |
|
|
Watson Pharmaceuticals, Inc. (a) |
6,618 |
408,248 |
|
|
XOMA Ltd. (a) |
12,200 |
147,925 |
|
|
Zila, Inc. (a) |
4,300 |
16,125 |
|
|
Zonagen, Inc. (a) |
600 |
2,550 |
|
|
|
83,159,621 |
||
|
Medical Equipment & Supplies - 2.6% |
|||
|
Abbott Laboratories |
108,585 |
4,750,594 |
|
|
Acuson Corp. (a) |
900 |
12,938 |
|
|
ADAC Laboratories (a) |
4,900 |
109,638 |
|
|
ALARIS Medical, Inc. (a) |
2,200 |
3,300 |
|
|
Allscripts, Inc. |
2,200 |
64,213 |
|
|
AmeriSource Health Corp. Class A (a) |
3,500 |
121,625 |
|
|
Arrow International, Inc. |
600 |
21,375 |
|
|
Arthrocare Corp. (a) |
3,200 |
142,400 |
|
|
Bacou USA, Inc. (a) |
600 |
15,075 |
|
|
Baxter International, Inc. |
19,900 |
1,656,675 |
|
|
Becton, Dickinson & Co. |
16,300 |
491,038 |
|
|
Bergen Brunswig Corp. Class A |
5,727 |
53,691 |
|
|
Bindley Western Industries, Inc. |
1,188 |
34,229 |
|
|
Bio-Rad Laboratories, Inc. Class A (a) |
100 |
2,463 |
|
|
Bio-Vascular, Inc. (a) |
1,000 |
4,438 |
|
|
Biomet, Inc. |
11,250 |
380,391 |
|
|
Boston Biomedica, Inc. (a) |
3,800 |
15,200 |
|
|
Boston Scientific Corp. (a) |
26,600 |
503,738 |
|
|
BriteSmile, Inc. (a) |
2,800 |
19,600 |
|
|
C.R. Bard, Inc. |
3,400 |
165,963 |
|
|
Candela Corp. (a) |
3,750 |
49,219 |
|
|
Cardinal Health, Inc. |
19,268 |
1,576,363 |
|
|
Closure Medical Corp. (a) |
1,400 |
29,991 |
|
|
Coherent, Inc. (a) |
2,300 |
185,150 |
|
|
Colorado Medtech, Inc. (a) |
3,200 |
28,400 |
|
|
CONMED Corp. (a) |
3,600 |
48,600 |
|
|
Cooper Companies, Inc. |
100 |
3,288 |
|
|
Cyberonics, Inc. (a) |
5,700 |
93,694 |
|
|
Cygnus, Inc. (a) |
3,700 |
45,094 |
|
|
Cypress Bioscience, Inc. (a) |
22,200 |
40,931 |
|
|
Datascope Corp. |
2,100 |
74,025 |
|
|
DENTSPLY International, Inc. |
5,400 |
180,225 |
|
|
Digene Corp. (a) |
200 |
7,963 |
|
|
Eclipse Surgical Technologies (a) |
300 |
1,181 |
|
|
Edwards Lifesciences Corp. (a) |
6,460 |
169,575 |
|
|
First Horizon Pharmaceutical Corp. |
5,500 |
100,375 |
|
|
Fusion Medical Technologies, Inc. (a) |
1,100 |
12,375 |
|
|
Gentiva Health Services, Inc. (a) |
2,000 |
22,250 |
|
|
Common Stocks - continued |
|||
|
Shares |
Value (Note 1) |
||
|
HEALTH - continued |
|||
|
Medical Equipment & Supplies - continued |
|||
|
Genzyme Corp. - Surgical Products (a) |
483 |
$ 4,951 |
|
|
Guidant Corp. (a) |
20,900 |
1,406,831 |
|
|
Haemonetics Corp. (a) |
800 |
20,150 |
|
|
Heartport, Inc. (a) |
1,300 |
4,591 |
|
|
Henry Schein, Inc. (a) |
1,300 |
23,888 |
|
|
Hologic, Inc. (a) |
5,800 |
48,938 |
|
|
I-Stat Corp. (a) |
100 |
1,856 |
|
|
Imatron, Inc. (a) |
15,500 |
38,750 |
|
|
Implant Sciences Corp. (a) |
200 |
1,775 |
|
|
INAMED Corp. (a) |
2,300 |
75,181 |
|
|
Innerdyne, Inc. (a) |
14,000 |
89,250 |
|
|
Intermagnetics General Corp. |
4,532 |
82,426 |
|
|
Interpore International, Inc. (a) |
5,700 |
46,669 |
|
|
Invacare Corp. |
2,800 |
75,425 |
|
|
JMAR Industries, Inc. (a) |
6,000 |
60,750 |
|
|
Johnson & Johnson |
99,744 |
9,170,214 |
|
|
KeraVision, Inc. (a) |
5,500 |
20,625 |
|
|
LaserSight, Inc. (a) |
1,700 |
5,950 |
|
|
LightPath Technologies, Inc. (a) |
2,500 |
131,875 |
|
|
Mallinckrodt, Inc. |
4,000 |
180,250 |
|
|
McKesson HBOC, Inc. |
18,357 |
457,778 |
|
|
Medtronic, Inc. |
83,026 |
4,255,083 |
|
|
Mentor Corp. |
3,000 |
63,563 |
|
|
Micro Therapeutics, Inc. (a) |
5,800 |
39,875 |
|
|
Millipore Corp. |
2,600 |
158,275 |
|
|
MiniMed, Inc. (a) |
4,000 |
287,188 |
|
|
NCS HealthCare, Inc. (a) |
1,000 |
313 |
|
|
Neoprobe Corp. (a) |
100 |
72 |
|
|
Nexell Therapeutics, Inc. (a) |
4,800 |
61,200 |
|
|
Novoste Corp. (a) |
2,500 |
135,000 |
|
|
Oakley, Inc. (a) |
3,800 |
64,363 |
|
|
Ocular Sciences, Inc. (a) |
6,500 |
69,875 |
|
|
Omnicare, Inc. |
7,200 |
98,550 |
|
|
ORATEC Interventions, Inc. |
1,200 |
42,675 |
|
|
Osteotech, Inc. (a) |
3,150 |
37,406 |
|
|
Owens & Minor, Inc. |
200 |
3,063 |
|
|
Patterson Dental Co. (a) |
5,600 |
133,000 |
|
|
Perrigo Co. (a) |
3,000 |
22,219 |
|
|
Physiometrix, Inc. (a) |
2,800 |
64,750 |
|
|
PLC Systems, Inc. (a) |
400 |
475 |
|
|
Priority Healthcare Corp. (a) |
1,897 |
109,552 |
|
|
PSS World Medical, Inc. (a) |
12,700 |
79,375 |
|
|
Resmed, Inc. (a) |
2,200 |
80,988 |
|
|
Respironics, Inc. (a) |
500 |
9,469 |
|
|
Sabratek Corp. (a) |
1,500 |
30 |
|
|
Sonus Pharmaceuticals, Inc. (a) |
200 |
750 |
|
|
Spacelabs Medical, Inc. (a) |
500 |
4,531 |
|
|
St. Jude Medical, Inc. (a) |
5,072 |
200,978 |
|
|
Steris Corp. (a) |
2,000 |
20,500 |
|
|
Stryker Corp. |
12,900 |
578,081 |
|
|
Sunrise Technologies, Inc. (a) |
4,400 |
28,875 |
|
|
|
|||
|
Shares |
Value (Note 1) |
||
|
Sybron International, Inc. (a) |
7,400 |
$ 168,350 |
|
|
Techne Corp. (a) |
1,500 |
143,250 |
|
|
Thermo Cardiosystems, Inc. (a) |
1,200 |
11,175 |
|
|
Uromed Corp. (a) |
4,920 |
9,533 |
|
|
Varian Medical Systems, Inc. (a) |
1,400 |
64,313 |
|
|
Vasomedical, Inc. (a) |
15,100 |
67,950 |
|
|
Ventiv Health, Inc. (a) |
4,833 |
64,641 |
|
|
VISX, Inc. (a) |
2,800 |
77,175 |
|
|
Wesley Jessen Visioncare, Inc. (a) |
3,600 |
135,450 |
|
|
Zoll Medical Corp. (a) |
2,100 |
91,875 |
|
|
|
30,669,192 |
||
|
Medical Facilities Management - 0.6% |
|||
|
Advance Paradigm, Inc. (a) |
4,800 |
127,800 |
|
|
American Healthways, Inc. (a) |
100 |
600 |
|
|
American HomePatient, Inc. (a) |
1,300 |
406 |
|
|
AmeriPath, Inc. (a) |
900 |
12,263 |
|
|
Amsurg Corp. Class A (a) |
9 |
65 |
|
|
Apria Healthcare Group, Inc. (a) |
1,500 |
22,313 |
|
|
ARV Assisted Living, Inc. (a) |
100 |
100 |
|
|
Beverly Enterprises, Inc. (a) |
1,000 |
5,188 |
|
|
Carematrix Corp. (a) |
2,800 |
1,050 |
|
|
Chronimed, Inc. |
200 |
1,463 |
|
|
Covance, Inc. (a) |
3,800 |
39,425 |
|
|
Coventry Health Care, Inc. (a) |
2,000 |
32,000 |
|
|
Express Scripts, Inc. Class A (a) |
2,900 |
206,444 |
|
|
Foundation Health Systems, Inc. |
6,400 |
112,400 |
|
|
Genesis Health Ventures, Inc. (a) |
1,700 |
531 |
|
|
HCA - The Healthcare Co. |
38,000 |
1,311,000 |
|
|
Health Management Associates, Inc. Class A (a) |
15,450 |
252,028 |
|
|
HEALTHSOUTH Corp. (a) |
21,719 |
133,029 |
|
|
Hooper Holmes, Inc. |
2,100 |
24,544 |
|
|
Humana, Inc. (a) |
7,400 |
63,363 |
|
|
IMPATH, Inc. (a) |
4,000 |
143,750 |
|
|
Innovative Clinical Solutions Ltd. (a) |
200 |
20 |
|
|
Integrated Health Services, Inc. (a) |
2,200 |
264 |
|
|
Laboratory Corp. of America Holdings (a) |
600 |
70,988 |
|
|
LCA-Vision, Inc. (a) |
6,500 |
19,906 |
|
|
Lifepoint Hospitals, Inc. (a) |
4,163 |
125,410 |
|
|
Lincare Holdings, Inc. (a) |
3,800 |
96,900 |
|
|
Manor Care, Inc. (a) |
4,000 |
53,500 |
|
|
Meadowbrook Insurance Group, Inc. |
600 |
2,363 |
|
|
Medical Resources, Inc. (a) |
66 |
10 |
|
|
Medquist, Inc. (a) |
2,535 |
49,116 |
|
|
Mid-Atlantic Medical Services, Inc. (a) |
1,600 |
25,800 |
|
|
MIM Corp. (a) |
6,400 |
12,200 |
|
|
Neurocrine Biosciences, Inc. (a) |
2,500 |
103,438 |
|
|
Orthodontic Centers of America, Inc. (a) |
3,900 |
127,725 |
|
|
Oxford Health Plans, Inc. (a) |
5,000 |
152,500 |
|
|
PacifiCare Health Systems, Inc. |
2,500 |
134,844 |
|
|
Pediatrix Medical Group (a) |
1,300 |
17,306 |
|
|
Common Stocks - continued |
|||
|
Shares |
Value (Note 1) |
||
|
HEALTH - continued |
|||
|
Medical Facilities Management - continued |
|||
|
Phycor, Inc. (a) |
1,800 |
$ 234 |
|
|
Province Healthcare Co. (a) |
3,000 |
134,625 |
|
|
Quest Diagnostics, Inc. (a) |
2,800 |
346,500 |
|
|
Quorum Health Group, Inc. (a) |
8,100 |
104,288 |
|
|
RehabCare Group, Inc. (a) |
100 |
3,738 |
|
|
Renal Care Group, Inc. (a) |
5,650 |
114,413 |
|
|
Res-Care, Inc. (a) |
2,400 |
11,625 |
|
|
Sunrise Assisted Living, Inc. (a) |
7,500 |
149,063 |
|
|
Syncor International Corp. (a) |
800 |
32,000 |
|
|
Tenet Healthcare Corp. |
20,900 |
647,900 |
|
|
Total Renal Care Holdings, Inc. (a) |
2,267 |
15,869 |
|
|
Triad Hospitals, Inc. (a) |
4,763 |
137,532 |
|
|
Trigon Healthcare, Inc. (a) |
4,000 |
206,500 |
|
|
UnitedHealth Group, Inc. |
11,000 |
1,039,500 |
|
|
Universal Health Services, Inc. Class B (a) |
2,300 |
162,725 |
|
|
Urologix, Inc. (a) |
1,000 |
8,500 |
|
|
US Oncology, Inc. (a) |
482 |
2,696 |
|
|
Wellpoint Health Networks, Inc. (a) |
4,000 |
345,250 |
|
|
|
6,945,010 |
||
|
TOTAL HEALTH |
120,773,823 |
||
|
HOLDING COMPANIES - 0.0% |
|||
|
Leucadia National Corp. |
3,900 |
101,888 |
|
|
Triarc Companies, Inc. Class A (a) |
1,475 |
33,556 |
|
|
TOTAL HOLDING COMPANIES |
135,444 |
||
|
INDUSTRIAL MACHINERY & EQUIPMENT - 5.0% |
|||
|
Electrical Equipment - 4.2% |
|||
|
A.O. Smith Corp. Class B |
3,150 |
49,613 |
|
|
Adaptive Broadband Corp. (a) |
2,700 |
84,375 |
|
|
Adtran, Inc. (a) |
3,600 |
192,825 |
|
|
Advanced Lighting Technologies, Inc. (a) |
4,700 |
75,200 |
|
|
Airnet Communications Corp. |
2,600 |
86,288 |
|
|
Allen Telecom, Inc. (a) |
900 |
17,944 |
|
|
American Power Conversion Corp. (a) |
13,600 |
323,850 |
|
|
American Superconductor Corp. (a) |
1,600 |
67,900 |
|
|
AMETEK, Inc. |
1,700 |
36,338 |
|
|
Amplidyne, Inc. (a) |
3,300 |
10,003 |
|
|
Andersen Group, Inc. (a) |
2,700 |
31,725 |
|
|
Andrea Electronics Corp. (a) |
500 |
3,906 |
|
|
Anicom, Inc. (a) |
600 |
2,306 |
|
|
Anixter International, Inc. (a) |
3,400 |
119,000 |
|
|
ANTEC Corp. (a) |
2,300 |
82,944 |
|
|
Avid Technology, Inc. (a) |
7,900 |
111,094 |
|
|
AZZ, Inc. |
1,900 |
31,113 |
|
|
Bairnco Corp. |
800 |
6,350 |
|
|
Baldor Electric Co. |
3,700 |
72,613 |
|
|
BMC Industries, Inc. |
900 |
5,063 |
|
|
C&D Technologies, Inc. |
1,800 |
99,450 |
|
|
|
|||
|
Shares |
Value (Note 1) |
||
|
C-COR.net Corp. (a) |
2,800 |
$ 54,600 |
|
|
C-Cube Microsystems, Inc. |
800 |
18,600 |
|
|
California Amplifier, Inc. (a) |
3,100 |
129,425 |
|
|
Chase Corp. |
500 |
4,938 |
|
|
Chyron Corp. (a) |
1,500 |
2,813 |
|
|
Communications Systems, Inc. |
2,500 |
42,813 |
|
|
Comtech Telecommunications Corp. (a) |
2,300 |
40,825 |
|
|
Cymer, Inc. (a) |
3,300 |
151,594 |
|
|
Data Critical Corp. |
1,700 |
15,300 |
|
|
Electric Fuel Corp. (a) |
6,800 |
65,450 |
|
|
Electro Rent Corp. (a) |
2,100 |
25,725 |
|
|
Emerson Electric Co. |
29,943 |
1,981,852 |
|
|
Energizer Holdings, Inc. (a) |
6,901 |
136,295 |
|
|
Energy Conversion Devices, Inc. (a) |
3,000 |
83,813 |
|
|
Excel Technology, Inc. (a) |
3,100 |
114,506 |
|
|
Fiberstars, Inc. (a) |
4,000 |
43,500 |
|
|
FuelCell Energy, Inc. (a) |
1,400 |
166,600 |
|
|
General Electric Co. |
696,184 |
40,856,891 |
|
|
Genlyte Group, Inc. (a) |
400 |
9,350 |
|
|
Gentner Communications Corp. (a) |
2,600 |
38,838 |
|
|
Glenayre Technologies, Inc. (a) |
6,200 |
67,425 |
|
|
Global Technologies Ltd. (a) |
3,300 |
11,550 |
|
|
H Power Corp. |
3,700 |
75,850 |
|
|
Harris Corp. |
6,600 |
198,413 |
|
|
Hubbell, Inc. Class B |
5,400 |
139,725 |
|
|
IEC Electronics Corp. (a) |
100 |
163 |
|
|
Juno Lighting, Inc. (a) |
4,900 |
26,644 |
|
|
L-3 Communications Holdings, Inc. (a) |
2,900 |
171,463 |
|
|
Littelfuse, Inc. (a) |
800 |
29,050 |
|
|
Loral Space & Communications Ltd. (a) |
35,000 |
269,063 |
|
|
LSI, Industries, Inc. |
2,200 |
43,725 |
|
|
MagneTek, Inc. (a) |
6,100 |
64,813 |
|
|
Metawave Communications Corp. |
800 |
16,500 |
|
|
Metretek Technologies, Inc. (a) |
2,900 |
12,144 |
|
|
Optelecom, Inc. (a) |
2,000 |
16,750 |
|
|
Pinnacle Systems (a) |
7,000 |
88,375 |
|
|
Plug Power, Inc. |
3,500 |
156,625 |
|
|
Powerwave Technologies, Inc. (a) |
2,900 |
139,563 |
|
|
Rayovac Corp. (a) |
1,500 |
26,625 |
|
|
Rofin Sinar Technologies, Inc. (a) |
2,800 |
42,000 |
|
|
Roper Industries, Inc. |
800 |
25,900 |
|
|
Satcon Technology Corp. (a) |
2,300 |
79,638 |
|
|
Scientific-Atlanta, Inc. |
10,600 |
826,138 |
|
|
Sensormatic Electronics Corp. (a) |
6,400 |
106,400 |
|
|
SL Industries, Inc. |
2,500 |
30,000 |
|
|
SLI, Inc. |
5,250 |
50,531 |
|
|
Socket Communications, Inc. (a) |
2,000 |
34,875 |
|
|
SonicWALL, Inc. |
1,700 |
129,413 |
|
|
Spectra Physics Lasers, Inc. (a) |
1,700 |
117,938 |
|
|
Spectrian Corp. (a) |
3,400 |
56,100 |
|
|
Spectrum Control, Inc. (a) |
4,600 |
81,075 |
|
|
STM Wireless, Inc. Class A (a) |
4,000 |
25,500 |
|
|
Telaxis Communications Corp. |
2,440 |
36,905 |
|
|
Teledyne Technologies, Inc. (a) |
6,300 |
126,787 |
|
|
Common Stocks - continued |
|||
|
Shares |
Value (Note 1) |
||
|
INDUSTRIAL MACHINERY & EQUIPMENT - continued |
|||
|
Electrical Equipment - continued |
|||
|
Teleflex, Inc. |
3,300 |
$ 117,563 |
|
|
Telular Corp. (a) |
4,200 |
78,225 |
|
|
Thomas & Betts Corp. |
5,300 |
99,375 |
|
|
Triton Network Systems, Inc. |
2,300 |
43,269 |
|
|
ViaSat, Inc. (a) |
1,100 |
65,863 |
|
|
Vicor Corp. (a) |
1,900 |
82,888 |
|
|
ViewCast.com, Inc. (a) |
13,900 |
42,569 |
|
|
Vyyo, Inc. |
900 |
31,050 |
|
|
W.W. Grainger, Inc. |
6,900 |
199,238 |
|
|
Wegener Corp. (a) |
3,500 |
8,859 |
|
|
WESCO International, Inc. (a) |
5,400 |
48,263 |
|
|
Zoltek Companies, Inc. (a) |
800 |
6,350 |
|
|
|
49,640,806 |
||
|
Industrial Machinery & Equipment - 0.7% |
|||
|
Active Power, Inc. |
2,600 |
182,650 |
|
|
AGCO Corp. |
4,000 |
42,000 |
|
|
Allied Products Corp. |
800 |
1,250 |
|
|
Applied Industrial Technologies, Inc. |
700 |
11,856 |
|
|
Applied Power, Inc. Class A |
3,000 |
14,813 |
|
|
Astec Industries, Inc. (a) |
1,000 |
19,625 |
|
|
Asyst Technologies, Inc. (a) |
2,200 |
57,613 |
|
|
Axcelis Technologies, Inc. |
6,500 |
117,406 |
|
|
BioSphere Medical, Inc. (a) |
800 |
9,150 |
|
|
BOLDER Technologies Corp. (a) |
400 |
2,500 |
|
|
Briggs & Stratton Corp. |
5,100 |
220,575 |
|
|
Brooks Automation, Inc. (a) |
1,900 |
105,094 |
|
|
Capstone Turbine Corp. |
5,000 |
461,563 |
|
|
Cascade Corp. |
100 |
1,350 |
|
|
Caterpillar, Inc. |
27,500 |
1,010,625 |
|
|
Columbus McKinnon Corp. |
400 |
5,850 |
|
|
Cooper Industries, Inc. |
7,300 |
257,781 |
|
|
CUNO, Inc. (a) |
700 |
19,950 |
|
|
Deere & Co. |
16,100 |
530,294 |
|
|
Detroit Diesel Corp. |
1,100 |
25,094 |
|
|
Donaldson Co., Inc. |
2,600 |
54,925 |
|
|
Dover Corp. |
15,100 |
738,013 |
|
|
DT Industries, Inc. (a) |
300 |
2,963 |
|
|
EMCORE Corp. (a) |
1,300 |
144,950 |
|
|
ESCO Technologies, Inc. (a) |
200 |
3,688 |
|
|
Exide Corp. |
1,000 |
9,000 |
|
|
Fedders Corp. |
2,400 |
12,450 |
|
|
Flow International Corp. (a) |
600 |
6,450 |
|
|
FSI International, Inc. (a) |
4,300 |
76,325 |
|
|
Gardner Denver Machinery, Inc. (a) |
300 |
4,369 |
|
|
Gasonics International Corp. (a) |
700 |
16,800 |
|
|
Graco, Inc. |
1,100 |
38,981 |
|
|
Harnischfeger Industries, Inc. (a) |
14,500 |
4,785 |
|
|
Hirsch International Corp. Class A (a) |
900 |
1,125 |
|
|
Hughes Supply, Inc. |
2,900 |
61,770 |
|
|
Ibis Technology Corp. (a) |
2,000 |
87,000 |
|
|
IDEX Corp. |
1,700 |
51,638 |
|
|
|
|||
|
Shares |
Value (Note 1) |
||
|
Illinois Tool Works, Inc. |
21,728 |
$ 1,218,126 |
|
|
Ingersoll-Rand Co. |
13,100 |
596,869 |
|
|
Ionics, Inc. (a) |
1,200 |
35,775 |
|
|
JLG Industries, Inc. |
2,200 |
25,438 |
|
|
JLK Direct Distrution, Inc. Class A (a) |
300 |
2,100 |
|
|
Kaydon Corp. |
1,500 |
33,094 |
|
|
Kennametal, Inc. |
2,300 |
58,938 |
|
|
Lawson Products, Inc. |
200 |
5,050 |
|
|
Lincoln Electric Holdings, Inc. |
4,700 |
68,738 |
|
|
Lindsay Manufacturing Co. |
200 |
3,650 |
|
|
Mark IV Industries, Inc. |
2,600 |
58,175 |
|
|
Mattson Technology, Inc. (a) |
2,600 |
56,875 |
|
|
Milacron, Inc. |
1,700 |
26,244 |
|
|
Minuteman International, Inc. |
1,600 |
13,200 |
|
|
MSC Industrial Direct, Inc. (a) |
2,700 |
43,875 |
|
|
Nordson Corp. |
900 |
58,275 |
|
|
Pall Corp. |
8,900 |
190,238 |
|
|
Parker-Hannifin Corp. |
9,000 |
313,313 |
|
|
Pentair, Inc. |
3,000 |
97,500 |
|
|
Presstek, Inc. (a) |
1,500 |
25,406 |
|
|
PRI Automation, Inc. (a) |
1,700 |
87,763 |
|
|
Regal-Beloit Corp. |
3,000 |
51,750 |
|
|
Robotic Vision Systems, Inc. (a) |
9,600 |
121,800 |
|
|
Sauer-Danfoss, Inc. |
2,000 |
18,250 |
|
|
Semitool, Inc. (a) |
4,800 |
60,300 |
|
|
Specialty Equipment Companies, Inc. (a) |
900 |
24,356 |
|
|
SpeedFam-IPEC, Inc. (a) |
1,542 |
28,720 |
|
|
Stewart & Stevenson Services, Inc. |
1,000 |
16,125 |
|
|
Tennant Co. |
400 |
17,550 |
|
|
Tenneco Automotive, Inc. |
6,460 |
46,028 |
|
|
Terex Corp. (a) |
3,900 |
71,419 |
|
|
The Stanley Works |
5,700 |
152,475 |
|
|
Thomas Industries, Inc. |
500 |
10,094 |
|
|
Timken Co. |
3,600 |
58,725 |
|
|
Toro Co. |
500 |
15,125 |
|
|
UCAR International, Inc. (a) |
4,800 |
65,400 |
|
|
Ultratech Stepper, Inc. (a) |
1,000 |
18,000 |
|
|
UNOVA, Inc. (a) |
2,400 |
18,000 |
|
|
Valmont Industries, Inc. |
1,100 |
20,831 |
|
|
Varian Semiconductor Equipment Associates, Inc. (a) |
2,200 |
125,675 |
|
|
Veeco Instruments, Inc. (a) |
1,100 |
98,588 |
|
|
Water Pik Technologies, Inc. (a) |
2,141 |
18,734 |
|
|
WJ Communications, Inc. |
9,100 |
536,331 |
|
|
|
9,025,189 |
||
|
Pollution Control - 0.1% |
|||
|
Allied Waste Industries, Inc. (a) |
8,125 |
74,648 |
|
|
Aquagenix, Inc. (a) |
100 |
1 |
|
|
Calgon Carbon Corp. |
3,000 |
25,500 |
|
|
Casella Waste Systems, Inc. Class A (a) |
1,253 |
12,295 |
|
|
Flanders Corp. (a) |
300 |
806 |
|
|
Fusion Networks Holdings, Inc. (a) |
2,910 |
5,093 |
|
|
Insituform Technologies, Inc. Class A (a) |
1,400 |
42,963 |
|
|
Common Stocks - continued |
|||
|
Shares |
Value (Note 1) |
||
|
INDUSTRIAL MACHINERY & EQUIPMENT - continued |
|||
|
Pollution Control - continued |
|||
|
Kaiser Group International, Inc. (a) |
300 |
$ 11 |
|
|
Republic Services, Inc. (a) |
9,400 |
137,475 |
|
|
Stericycle, Inc. (a) |
5,200 |
117,000 |
|
|
U.S. Plastic Lumber Co. (a) |
6,700 |
23,659 |
|
|
Waste Connections, Inc. (a) |
5,100 |
118,575 |
|
|
Waste Management, Inc. |
40,852 |
773,635 |
|
|
|
1,331,661 |
||
|
TOTAL INDUSTRIAL MACHINERY & EQUIPMENT |
59,997,656 |
||
|
MEDIA & LEISURE - 4.8% |
|||
|
Broadcasting - 2.0% |
|||
|
5th Avenue Channel Corp. (a) |
700 |
284 |
|
|
Adelphia Communications Corp. |
7,402 |
247,967 |
|
|
American Tower Corp. Class A (a) |
9,300 |
337,706 |
|
|
BHC Communications, Inc. Class A |
1,500 |
229,500 |
|
|
Cablevision Systems Corp. Class A (a) |
8,800 |
591,800 |
|
|
CAIS Internet, Inc. (a) |
2,400 |
19,350 |
|
|
Charter Communications, Inc. |
13,400 |
205,188 |
|
|
Chris-Craft Industries, Inc. |
2,811 |
219,961 |
|
|
Citadel Communications Corp. (a) |
2,200 |
45,100 |
|
|
Classic Communications, Inc. Class A |
2,400 |
12,000 |
|
|
Clear Channel Communications, Inc. (a) |
39,814 |
2,881,538 |
|
|
Comcast Corp. Class A (special) (a) |
63,060 |
2,348,985 |
|
|
Cox Communications, Inc. Class A (a) |
39,901 |
1,418,979 |
|
|
Cox Radio, Inc. Class A (a) |
2,400 |
49,950 |
|
|
Crown Media Holdings, Inc. |
1,200 |
19,275 |
|
|
CTC Communications Group, Inc. (a) |
3,000 |
73,875 |
|
|
Cumulus Media, Inc. (a) |
1,700 |
12,538 |
|
|
E.W. Scripps Co. Class A |
5,100 |
258,506 |
|
|
EchoStar Communications Corp. |
15,700 |
765,375 |
|
|
Emmis Communications Corp. |
3,600 |
118,125 |
|
|
Entercom Communications Corp. |
1,900 |
78,494 |
|
|
Hearst-Argyle Television, Inc. (a) |
2,727 |
58,971 |
|
|
Hispanic Broadcasting Corp. (a) |
7,800 |
200,363 |
|
|
i3 Mobile, Inc. |
4,400 |
39,875 |
|
|
Infinity Broadcasting Corp. Class A (a) |
26,593 |
1,007,210 |
|
|
Insight Communications, Inc. |
4,700 |
83,719 |
|
|
Liberty Digital, Inc. (a) |
3,400 |
84,150 |
|
|
Liberty Satellite & Technology, Inc. |
5,500 |
67,375 |
|
|
Mediacom Communications Corp. |
3,350 |
47,685 |
|
|
Metro One Telecommunications, Inc. (a) |
3,500 |
47,250 |
|
|
Metromedia International Group, Inc. (a) |
2,200 |
8,663 |
|
|
Motient Corp. (a) |
2,200 |
26,675 |
|
|
Netro Corp. |
2,800 |
231,350 |
|
|
New Frontier Media, Inc. (a) |
5,100 |
31,556 |
|
|
|
|||
|
Shares |
Value (Note 1) |
||
|
NorthPoint Communication |
6,600 |
$ 75,488 |
|
|
NTL, Inc. (a) |
11,750 |
514,797 |
|
|
Nucentrix Broadband Netwks, Inc. (a) |
100 |
2,613 |
|
|
PanAmSat Corp. (a) |
1,100 |
35,681 |
|
|
Paxson Communications Corp. (a) |
2,900 |
39,875 |
|
|
Pegasus Communications Corp. (a) |
3,200 |
159,200 |
|
|
Radio One, Inc. Class A (a) |
2,200 |
46,338 |
|
|
Radio Unica Communications Corp. |
2,900 |
21,206 |
|
|
Saga Communications, Inc. (a) |
300 |
6,150 |
|
|
Sinclair Broadcast Group, Inc. |
7,100 |
85,644 |
|
|
Sirius Satellite Radio, Inc. (a) |
2,500 |
128,750 |
|
|
Spanish Broadcasting System, Inc. |
5,300 |
53,331 |
|
|
Spectrasite Holdings, Inc. (a) |
8,700 |
203,906 |
|
|
Telscape International, Inc. (a) |
3,700 |
14,800 |
|
|
Time Warner, Inc. |
94,100 |
8,045,550 |
|
|
TiVo, Inc. |
2,000 |
48,250 |
|
|
United Television, Inc. |
500 |
72,000 |
|
|
UnitedGlobalCom, Inc. Class A (a) |
6,100 |
233,706 |
|
|
Univision Communications, Inc. |
14,000 |
617,750 |
|
|
US Wireless Corp. (a) |
2,200 |
28,600 |
|
|
USA Networks, Inc. (a) |
20,032 |
482,020 |
|
|
ValueVision International, Inc. (a) |
2,300 |
67,419 |
|
|
Westwood One, Inc. (a) |
7,200 |
200,250 |
|
|
Wireless Facilities, Inc. |
2,600 |
195,000 |
|
|
WorldQuest Networks, Inc. |
310 |
1,492 |
|
|
Xm Satellite Radio Holdings, Inc. Class A |
3,000 |
128,250 |
|
|
Young Broadcasting, Inc. Class A (a) |
3,600 |
127,350 |
|
|
|
23,504,754 |
||
|
Entertainment - 1.4% |
|||
|
4Kids Entertainment, Inc. (a) |
3,500 |
73,500 |
|
|
Alliance Gaming Corp. (a) |
28 |
70 |
|
|
American Classic Voyager Co. (a) |
500 |
8,500 |
|
|
American Coin Merchandising, Inc. (a) |
100 |
275 |
|
|
AMF Bowling, Inc. (a) |
2,000 |
1,125 |
|
|
Bally Total Fitness Holding Corp. (a) |
1,000 |
24,688 |
|
|
Brilliant Digital Entertainment, Inc. (a) |
500 |
2,250 |
|
|
Carmike Cinemas, Inc. Class A (a) |
200 |
138 |
|
|
Carnival Corp. |
39,500 |
787,531 |
|
|
Cedar Fair LP (depository unit) |
900 |
16,200 |
|
|
Fox Entertainment Group, Inc. Class A (a) |
14,600 |
422,488 |
|
|
Hollywood Entertainment Corp. (a) |
5,900 |
41,300 |
|
|
Image Entertainment, Inc. (a) |
700 |
2,888 |
|
|
International Speedway Corp. Class A |
3,300 |
111,788 |
|
|
Internet Pictures Corp. |
2,959 |
23,117 |
|
|
Isle Capri Casinos, Inc. (a) |
1,000 |
15,625 |
|
|
Kushner Locke Co. (a) |
6,400 |
10,400 |
|
|
Laser-Pacific Media Corp. (a) |
2,700 |
9,450 |
|
|
Littlefield Corp. (a) |
2,100 |
4,594 |
|
|
Mandalay Resort Group (a) |
5,600 |
155,750 |
|
|
Metro-Goldwyn-Mayer, Inc. (a) |
12,300 |
315,188 |
|
|
Common Stocks - continued |
|||
|
Shares |
Value (Note 1) |
||
|
MEDIA & LEISURE - continued |
|||
|
Entertainment - continued |
|||
|
MGM Grand, Inc. |
11,102 |
$ 381,631 |
|
|
NetCurrents, Inc. (a) |
10,200 |
20,400 |
|
|
Park Place Entertainment Corp. (a) |
29,800 |
437,688 |
|
|
Pinnacle Entertainment, Inc. (a) |
1,200 |
24,750 |
|
|
Pixar (a) |
4,500 |
148,500 |
|
|
Platinum Entertainment, Inc. (a) |
500 |
45 |
|
|
Rentrak Corp. (a) |
600 |
2,175 |
|
|
Royal Caribbean Cruises Ltd. |
16,600 |
379,725 |
|
|
Six Flags, Inc. (a) |
4,300 |
64,231 |
|
|
Speedway Motorsports, Inc. (a) |
2,300 |
59,369 |
|
|
Ticketmaster Online CitySearch, Inc. Class B (a) |
2,500 |
60,156 |
|
|
Vail Resorts, Inc. (a) |
1,100 |
20,213 |
|
|
Venture Catalyst, Inc. (a) |
3,900 |
13,406 |
|
|
Viacom, Inc. Class B (non-vtg.) (a) |
106,834 |
7,191,264 |
|
|
Walt Disney Co. |
144,700 |
5,634,256 |
|
|
World Wrestling Federation Entertainment, Inc. Class A |
5,600 |
119,700 |
|
|
Zomax, Inc. (a) |
5,000 |
97,188 |
|
|
|
16,681,562 |
||
|
Leisure Durables & Toys - 0.2% |
|||
|
Adams Golf, Inc. (a) |
400 |
450 |
|
|
Arctic Cat, Inc. |
1,000 |
11,844 |
|
|
Brunswick Corp. |
5,400 |
101,250 |
|
|
Callaway Golf Co. |
4,200 |
60,638 |
|
|
Champion Enterprises, Inc. (a) |
1,600 |
10,600 |
|
|
Coachmen Industries, Inc. |
300 |
3,338 |
|
|
Direct Focus, Inc. (a) |
900 |
26,944 |
|
|
Equity Marketing, Inc. (a) |
2,400 |
33,900 |
|
|
Harley-Davidson, Inc. |
22,600 |
1,125,763 |
|
|
Hasbro, Inc. |
10,755 |
132,421 |
|
|
JAKKS Pacific, Inc. (a) |
5,950 |
105,613 |
|
|
K2, Inc. (a) |
700 |
7,744 |
|
|
Mattel, Inc. |
28,416 |
280,608 |
|
|
National R.V. Holdings, Inc. (a) |
300 |
2,944 |
|
|
Play By Play Toys & Novelties, Inc. (a) |
6,500 |
7,719 |
|
|
Polaris Industries, Inc. |
1,200 |
40,950 |
|
|
Rawlings Sporting Goods, Inc. (a) |
4,400 |
26,675 |
|
|
Russ Berrie & Co., Inc. |
700 |
14,350 |
|
|
Silicon Gaming, Inc. (a) |
100 |
32 |
|
|
Silicon Gaming, Inc. warrants 7/26/04 (a) |
100 |
0 |
|
|
T-HQ, Inc. (a) |
4,700 |
100,463 |
|
|
Thor Industries, Inc. |
200 |
4,663 |
|
|
Toymax International, Inc. (a) |
4,000 |
12,000 |
|
|
West Marine, Inc. (a) |
600 |
5,400 |
|
|
Winnebago Industries, Inc. |
3,100 |
39,719 |
|
|
|
2,156,028 |
||
|
Lodging & Gaming - 0.2% |
|||
|
Anchor Gaming (a) |
800 |
58,600 |
|
|
|
|||
|
Shares |
Value (Note 1) |
||
|
Argosy Gaming Co. (a) |
600 |
$ 9,600 |
|
|
Aztar Corp. (a) |
1,600 |
23,300 |
|
|
Boca Resorts, Inc. Class A (a) |
900 |
10,013 |
|
|
Boyd Gaming Corp. (a) |
300 |
1,388 |
|
|
Championship Auto Racing |
1,900 |
44,294 |
|
|
Choice Hotels International, Inc. (a) |
1,600 |
14,300 |
|
|
Churchill Downs, Inc. |
2,200 |
51,975 |
|
|
Crestline Capital Corp. (a) |
830 |
16,341 |
|
|
Dover Downs Entertainment, Inc. |
1,400 |
14,088 |
|
|
Extended Stay America, Inc. (a) |
5,200 |
77,025 |
|
|
Gaylord Entertainment Co. |
1,600 |
41,800 |
|
|
Gtech Holdings Corp. (a) |
1,700 |
30,388 |
|
|
Harrah's Entertainment, Inc. (a) |
7,800 |
221,325 |
|
|
Hilton Hotels Corp. |
23,737 |
237,370 |
|
|
International Game Technology (a) |
4,550 |
131,950 |
|
|
Interstate Hotels Corp. Class A (a) |
127 |
294 |
|
|
Lodgian, Inc. (a) |
300 |
806 |
|
|
Marcus Corp. |
400 |
4,925 |
|
|
Marriott International, Inc. Class A |
16,800 |
663,600 |
|
|
MeriStar Hotels & Resorts, Inc. (a) |
200 |
500 |
|
|
Penn National Gaming, Inc. (a) |
100 |
1,400 |
|
|
Prime Hospitality Corp. (a) |
1,900 |
19,713 |
|
|
Starwood Hotels & Resorts |
19,556 |
625,792 |
|
|
Station Casinos, Inc. (a) |
3,100 |
44,563 |
|
|
Suburban Lodges of America, Inc. (a) |
200 |
1,438 |
|
|
Trump Hotels & Casino Resorts, Inc. (a) |
700 |
1,925 |
|
|
U.S. Franchise Systems, Inc. Class A (a) |
6,700 |
29,313 |
|
|
WMS Industries, Inc. (a) |
1,300 |
20,800 |
|
|
|
2,398,826 |
||
|
Publishing - 0.6% |
|||
|
A.H. Belo Corp. Class A |
7,400 |
141,525 |
|
|
American Greetings Corp. Class A |
3,700 |
68,913 |
|
|
Applied Graphics Technologies, Inc. (a) |
860 |
3,279 |
|
|
Banta Corp. |
1,200 |
26,475 |
|
|
Dow Jones & Co., Inc. |
6,000 |
375,375 |
|
|
Gannett Co., Inc. |
19,200 |
1,087,200 |
|
|
Harcourt General, Inc. |
6,700 |
397,394 |
|
|
Harte Hanks Communications, Inc. |
4,100 |
103,013 |
|
|
Hollinger International, Inc. Class A |
6,900 |
112,988 |
|
|
Houghton Mifflin Co. |
1,900 |
93,456 |
|
|
Information Holdings, Inc. (a) |
1,100 |
35,338 |
|
|
John Wiley & Sons, Inc. Class A |
3,600 |
71,550 |
|
|
Journal Register Co. (a) |
2,400 |
39,600 |
|
|
Knight-Ridder, Inc. |
8,000 |
437,000 |
|
|
Lee Enterprises, Inc. |
2,500 |
70,000 |
|
|
Martha Stewart Living Omnimedia, Inc. Class A |
2,300 |
77,625 |
|
|
McGraw-Hill Companies, Inc. |
13,400 |
829,963 |
|
|
Media General, Inc. Class A |
1,400 |
72,100 |
|
|
Meredith Corp. |
3,000 |
81,938 |
|
|
Penton Media, Inc. |
3,000 |
93,938 |
|
|
Common Stocks - continued |
|||
|
Shares |
Value (Note 1) |
||
|
MEDIA & LEISURE - continued |
|||
|
Publishing - continued |
|||
|
Playboy Enterprises, Inc. Class B (non-vtg.) (a) |
400 |
$ 5,875 |
|
|
PRIMEDIA, Inc. (a) |
10,400 |
185,900 |
|
|
Pulitzer, Inc. |
200 |
8,613 |
|
|
Reader's Digest Association, Inc. Class A (non-vtg.) |
7,000 |
269,500 |
|
|
Scholastic Corp. (a) |
2,300 |
147,631 |
|
|
The McClatchy Co. Class A |
2,700 |
96,694 |
|
|
The New York Times Co. Class A |
14,400 |
564,300 |
|
|
Topps Co., Inc. (a) |
12,800 |
100,800 |
|
|
Tribune Co. |
21,268 |
759,002 |
|
|
Washington Post Co. Class B |
587 |
298,783 |
|
|
Ziff-Davis, Inc. - ZD |
6,300 |
69,300 |
|
|
|
6,725,068 |
||
|
Restaurants - 0.4% |
|||
|
Applebee's International, Inc. |
5,100 |
115,706 |
|
|
Avado Brands, Inc. |
800 |
1,175 |
|
|
Bob Evans Farms, Inc. |
4,800 |
81,600 |
|
|
Boston Chicken, Inc. (a) |
400 |
4 |
|
|
Brinker International, Inc. (a) |
4,500 |
142,875 |
|
|
Buca, Inc. (a) |
4,700 |
53,169 |
|
|
Buffets, Inc. (a) |
4,700 |
62,275 |
|
|
CBRL Group, Inc. |
12,500 |
150,781 |
|
|
CEC Entertainment, Inc. (a) |
750 |
21,656 |
|
|
Cheesecake Factory, Inc. (a) |
1,875 |
67,617 |
|
|
CKE Restaurants, Inc. |
1,711 |
6,844 |
|
|
Darden Restaurants, Inc. |
4,000 |
70,750 |
|
|
Dave & Busters, Inc. (a) |
1,700 |
13,600 |
|
|
Einstein/Noah Bagel Corp. (a) |
100 |
7 |
|
|
Fine Host Corp. (a) |
500 |
0 |
|
|
Garden Fresh Restaurant Corp. (a) |
2,900 |
36,250 |
|
|
Jack in the Box, Inc. (a) |
1,200 |
26,475 |
|
|
Landry's Seafood Restaurants, Inc. |
1,500 |
11,813 |
|
|
Lone Star Steakhouse & Saloon, Inc. |
7,800 |
65,813 |
|
|
McDonald's Corp. |
93,600 |
2,796,300 |
|
|
Morrison Management Specialists, Inc. |
3,080 |
82,005 |
|
|
O'Charleys, Inc. (a) |
150 |
1,913 |
|
|
Outback Steakhouse, Inc. (a) |
2,200 |
50,463 |
|
|
P.F. Chang's China Bistro, Inc. (a) |
3,700 |
110,769 |
|
|
Papa John's International, Inc. (a) |
1,900 |
42,988 |
|
|
PopMail.com, Inc. (a) |
7,200 |
6,300 |
|
|
Prandium, Inc. (a) |
1,100 |
171 |
|
|
Rainforest Cafe, Inc. (a) |
1,350 |
3,291 |
|
|
Rare Hospitality International, Inc. (a) |
4,100 |
115,313 |
|
|
Rubio's Restaurants, Inc. (a) |
7,800 |
50,700 |
|
|
Ryan's Family Steak Houses, Inc. (a) |
1,200 |
9,750 |
|
|
Schlotzskys, Inc. (a) |
100 |
384 |
|
|
Sodexho Marriott Services, Inc. |
3,800 |
61,750 |
|
|
Sonic Corp. (a) |
3,150 |
102,769 |
|
|
Starbucks Corp. (a) |
10,700 |
391,888 |
|
|
Taco Cabana, Inc. Class A (a) |
5,200 |
23,075 |
|
|
|
|||
|
Shares |
Value (Note 1) |
||
|
Tricon Global Restaurants, Inc. (a) |
8,300 |
$ 241,738 |
|
|
Wendy's International, Inc. |
5,000 |
94,375 |
|
|
|
5,114,352 |
||
|
TOTAL MEDIA & LEISURE |
56,580,590 |
||
|
NONDURABLES - 4.0% |
|||
|
Agriculture - 0.0% |
|||
|
Alico, Inc. |
200 |
3,225 |
|
|
Charles River Labs International, Inc. |
2,200 |
60,363 |
|
|
Delta & Pine Land Co. |
2,500 |
61,094 |
|
|
Fresh Del Monte Produce Inc. (a) |
2,900 |
17,038 |
|
|
Hines Horticulture, Inc. (a) |
800 |
4,200 |
|
|
Northland Cranberries, Inc. Class A |
200 |
325 |
|
|
Tejon Ranch Co. |
700 |
17,325 |
|
|
|
163,570 |
||
|
Beverages - 1.1% |
|||
|
Adolph Coors Co. Class B |
2,500 |
148,906 |
|
|
Anheuser-Busch Companies, Inc. |
31,500 |
2,482,594 |
|
|
Beringer Wine Estates Holdings, Inc. Class B (a) |
1,300 |
71,906 |
|
|
Boston Beer Co., Inc. Class A (a) |
600 |
5,550 |
|
|
Brown-Forman Corp. Class B (non-vtg.) |
4,700 |
249,100 |
|
|
Canandaigua Brands, Inc. Class A (a) |
2,000 |
107,750 |
|
|
Chalone Wine Group, Inc. (a) |
200 |
1,763 |
|
|
Coca-Cola Bottling Co. Consolidated |
500 |
20,031 |
|
|
Coca-Cola Enterprises, Inc. |
29,100 |
541,988 |
|
|
Genesee Corp. Class B |
100 |
3,063 |
|
|
M&F Worldwide Corp. (a) |
500 |
2,719 |
|
|
National Beverage Corp. (a) |
600 |
4,200 |
|
|
Pepsi Bottling Group, Inc. |
10,200 |
323,850 |
|
|
Ravenswood Winery, Inc. (a) |
100 |
1,413 |
|
|
Robert Mondavi Corp. Class A (a) |
500 |
20,500 |
|
|
The Coca-Cola Co. |
172,800 |
9,093,600 |
|
|
Whitman Corp. |
9,200 |
121,325 |
|
|
|
13,200,258 |
||
|
Foods - 1.4% |
|||
|
Agribrands International, Inc. (a) |
540 |
21,465 |
|
|
American Italian Pasta Co. Class A (a) |
1,000 |
16,938 |
|
|
Archer-Daniels-Midland Co. |
43,639 |
384,569 |
|
|
Bestfoods |
19,100 |
1,348,938 |
|
|
Bridgford Foods Corp. |
400 |
5,150 |
|
|
Campbell Soup Co. |
29,300 |
743,488 |
|
|
Chiquita Brands International, Inc. |
800 |
2,650 |
|
|
ConAgra, Inc. |
39,131 |
716,586 |
|
|
Corn Products International, Inc. |
2,600 |
65,325 |
|
|
Dean Foods Co. |
2,600 |
81,250 |
|
|
Del Monte Foods Co. (a) |
2,900 |
19,031 |
|
|
Dole Food Co., Inc. |
3,500 |
49,438 |
|
|
Dreyer's Grand Ice Cream, Inc. |
1,700 |
35,302 |
|
|
Earthgrains Co. |
3,100 |
54,638 |
|
|
Farmer Brothers Co. |
100 |
17,231 |
|
|
Flowers Industries, Inc. |
7,200 |
156,600 |
|
|
Common Stocks - continued |
|||
|
Shares |
Value (Note 1) |
||
|
NONDURABLES - continued |
|||
|
Foods - continued |
|||
|
Gardenburger, Inc. (a) |
400 |
$ 2,000 |
|
|
General Mills, Inc. |
20,600 |
661,775 |
|
|
Gum Tech International, Inc. (a) |
3,500 |
44,406 |
|
|
H.J. Heinz Co. |
24,500 |
934,063 |
|
|
Hershey Foods Corp. |
9,600 |
409,800 |
|
|
Horizon Organic Holding Corp. (a) |
200 |
1,744 |
|
|
Hormel Foods Corp. |
9,600 |
148,200 |
|
|
IBP, Inc. |
7,000 |
112,438 |
|
|
International Multifoods Corp. |
1,000 |
16,313 |
|
|
Interstate Bakeries Corp. |
5,100 |
91,481 |
|
|
J&J Snack Food Corp. (a) |
300 |
4,238 |
|
|
J.M. Smucker Co. |
1,700 |
32,619 |
|
|
Keebler Foods Co. |
5,800 |
265,713 |
|
|
Kellogg Co. |
28,100 |
651,569 |
|
|
Lancaster Colony Corp. |
3,850 |
88,791 |
|
|
Lance, Inc. |
1,500 |
13,969 |
|
|
Maui Land & Pineapple, Inc. |
300 |
7,125 |
|
|
McCormick & Co., Inc. (non-vtg.) |
4,600 |
134,263 |
|
|
Michael Foods, Inc. |
1,200 |
28,500 |
|
|
Nabisco Group Holdings Corp. |
22,600 |
634,213 |
|
|
Nabisco Holdings Corp. Class A |
3,500 |
187,031 |
|
|
Penford Corp. |
600 |
10,913 |
|
|
PepsiCo, Inc. |
100,600 |
4,288,075 |
|
|
Pilgrims Pride Corp. |
1,200 |
8,175 |
|
|
Quaker Oats Co. |
9,100 |
618,231 |
|
|
Ralcorp Holdings, Inc. (a) |
1,680 |
22,680 |
|
|
Ralston Purina Co. |
21,300 |
481,913 |
|
|
Rica Foods, Inc. (a) |
500 |
7,938 |
|
|
Riviana Foods, Inc. |
700 |
11,988 |
|
|
Sanderson Farms, Inc. |
200 |
1,275 |
|
|
Sara Lee Corp. |
60,000 |
1,117,500 |
|
|
Seaboard Corp. |
100 |
19,500 |
|
|
Smithfield Foods, Inc. (a) |
3,800 |
100,938 |
|
|
Suiza Foods Corp. (a) |
3,600 |
180,000 |
|
|
Sysco Corp. |
23,200 |
981,650 |
|
|
Tasty Baking Co. |
200 |
2,263 |
|
|
Tootsie Roll Industries, Inc. |
2,200 |
88,550 |
|
|
Tyson Foods, Inc. Class A |
15,200 |
139,650 |
|
|
Universal Foods Corp. |
4,000 |
82,000 |
|
|
Vlasic Foods International, Inc. (a) |
1,550 |
2,519 |
|
|
Wm. Wrigley Jr. Co. |
8,400 |
622,125 |
|
|
|
16,976,733 |
||
|
Household Products - 1.0% |
|||
|
Alcide Corp. (a) |
300 |
4,969 |
|
|
Aptargroup, Inc. |
2,600 |
60,613 |
|
|
Avon Products, Inc. |
16,500 |
646,594 |
|
|
BioShield Technologies, Inc. (a) |
4,200 |
48,300 |
|
|
Block Drug Co., Inc. Class A |
1,518 |
61,479 |
|
|
Brady Corp. Class A |
1,700 |
49,194 |
|
|
Church & Dwight Co., Inc. |
2,500 |
44,844 |
|
|
Clorox Co. |
16,258 |
588,336 |
|
|
|
|||
|
Shares |
Value (Note 1) |
||
|
Colgate-Palmolive Co. |
40,200 |
$ 2,047,688 |
|
|
Del Laboratories, Inc. |
200 |
2,400 |
|
|
Dial Corp. |
6,300 |
64,575 |
|
|
Enamelon, Inc. (a) |
200 |
62 |
|
|
Estee Lauder Companies, Inc. Class A |
10,000 |
409,375 |
|
|
French Fragrances, Inc. (a) |
400 |
2,850 |
|
|
Gillette Co. |
72,800 |
2,184,000 |
|
|
Guest Supply, Inc. (a) |
200 |
3,725 |
|
|
Helen of Troy Corp. (a) |
1,400 |
7,875 |
|
|
Inter Parfums, Inc. (a) |
300 |
2,175 |
|
|
International Flavors & Fragrances, Inc. |
7,000 |
180,250 |
|
|
NCH Corp. |
400 |
14,925 |
|
|
Playtex Products, Inc. (a) |
3,900 |
46,313 |
|
|
Procter & Gamble Co. |
91,800 |
5,674,388 |
|
|
Racing Champions Corp. (a) |
4,500 |
6,609 |
|
|
Revlon, Inc. Class A (a) |
7,700 |
54,863 |
|
|
Tristar Corp. (a) |
500 |
2,875 |
|
|
Ultralife Batteries, Inc. (a) |
600 |
7,388 |
|
|
USA Detergents, Inc. (a) |
5,500 |
19,422 |
|
|
Vulcan International Corp. |
100 |
3,425 |
|
|
Yankee Candle Co., Inc. |
3,100 |
61,031 |
|
|
York Group, Inc. |
400 |
1,600 |
|
|
|
12,302,143 |
||
|
Tobacco - 0.5% |
|||
|
DIMON, Inc. |
1,100 |
3,438 |
|
|
Philip Morris Companies, Inc. |
161,300 |
4,778,513 |
|
|
RJ Reynolds Tobacco Holdings, Inc. |
7,300 |
261,887 |
|
|
Schweitzer-Mauduit International, Inc. |
500 |
7,250 |
|
|
Universal Corp. |
3,200 |
82,800 |
|
|
UST, Inc. |
11,700 |
253,013 |
|
|
|
5,386,901 |
||
|
TOTAL NONDURABLES |
48,029,605 |
||
|
PRECIOUS METALS - 0.1% |
|||
|
Battle Mountain Gold Co. (a) |
18,000 |
33,750 |
|
|
Coeur d'Alene Mines Corp. (a) |
9,400 |
15,275 |
|
|
Echo Bay Mines Ltd. (a) |
5,300 |
4,286 |
|
|
Homestake Mining Co. |
34,700 |
193,019 |
|
|
Meridian Gold, Inc. (a) |
10,100 |
67,608 |
|
|
Newmont Mining Corp. |
15,045 |
279,273 |
|
|
Stillwater Mining Co. (a) |
2,200 |
74,800 |
|
|
TOTAL PRECIOUS METALS |
668,011 |
||
|
RETAIL & WHOLESALE - 4.3% |
|||
|
Apparel Stores - 0.4% |
|||
|
Abercrombie & Fitch Co. Class A (a) |
4,374 |
101,422 |
|
|
American Eagle Outfitters, Inc. (a) |
2,000 |
59,625 |
|
|
AnnTaylor Stores Corp. (a) |
1,900 |
68,400 |
|
|
Cato Corp. Class A |
800 |
9,900 |
|
|
Charming Shoppes, Inc. (a) |
9,300 |
50,569 |
|
|
Chico's FAS, Inc. (a) |
4,800 |
187,200 |
|
|
Christopher & Banks Corp. (a) |
3,900 |
138,450 |
|
|
Common Stocks - continued |
|||
|
Shares |
Value (Note 1) |
||
|
RETAIL & WHOLESALE - continued |
|||
|
Apparel Stores - continued |
|||
|
Claire's Stores, Inc. |
3,600 |
$ 70,875 |
|
|
Dress Barn, Inc. (a) |
1,000 |
21,313 |
|
|
Factory 2-U Stores, Inc. (a) |
1,500 |
51,844 |
|
|
Footstar, Inc. (a) |
900 |
26,775 |
|
|
Gap, Inc. |
57,925 |
1,299,692 |
|
|
Genesco, Inc. (a) |
1,200 |
19,425 |
|
|
Goody's Family Clothing (a) |
1,100 |
5,053 |
|
|
Guess, Inc. (a) |
2,000 |
45,375 |
|
|
Gymboree Corp. (a) |
900 |
4,444 |
|
|
Hibbett Sporting Goods, Inc. (a) |
2,200 |
49,775 |
|
|
IKON Office Solutions, Inc. |
3,200 |
16,000 |
|
|
Intimate Brands, Inc. Class A |
31,720 |
511,485 |
|
|
iTurf, Inc. (a) |
3,600 |
5,850 |
|
|
Just for Feet, Inc. (a) |
6,200 |
194 |
|
|
Kenneth Cole Productions, Inc. |
700 |
30,844 |
|
|
Paul Harris Stores, Inc. (a) |
100 |
119 |
|
|
Payless ShoeSource, Inc. (a) |
3,661 |
195,406 |
|
|
Ross Stores, Inc. |
9,300 |
140,663 |
|
|
Stage Stores, Inc. (a) |
700 |
82 |
|
|
Talbots, Inc. |
1,100 |
73,631 |
|
|
The Childrens Place Retail Stores, Inc. (a) |
4,700 |
138,650 |
|
|
The Limited, Inc. |
27,452 |
549,040 |
|
|
The Men's Wearhouse, Inc. (a) |
3,300 |
100,650 |
|
|
TJX Companies, Inc. |
17,500 |
329,219 |
|
|
Too, Inc. (a) |
825 |
20,316 |
|
|
United Stationers, Inc. (a) |
5,000 |
162,188 |
|
|
Venator Group, Inc. (a) |
5,600 |
78,400 |
|
|
Wet Seal, Inc. Class A (a) |
1,700 |
23,800 |
|
|
|
4,586,674 |
||
|
Appliance Stores - 0.0% |
|||
|
Cellstar Corp. (a) |
8,600 |
34,400 |
|
|
Drug Stores - 0.3% |
|||
|
CVS Corp. |
27,086 |
1,005,568 |
|
|
Duane Reade, Inc. (a) |
4,000 |
88,500 |
|
|
E Com Ventures, Inc. (a) |
1,300 |
1,544 |
|
|
Longs Drug Stores Corp. |
2,500 |
47,188 |
|
|
Rite Aid Corp. |
14,100 |
56,400 |
|
|
Walgreen Co. |
70,200 |
2,307,825 |
|
|
|
3,507,025 |
||
|
General Merchandise Stores - 1.9% |
|||
|
7-Eleven, Inc. (a) |
13,100 |
175,213 |
|
|
99 Cents Only Stores (a) |
2,174 |
97,694 |
|
|
Ames Department Stores, Inc. (a) |
8,800 |
44,550 |
|
|
BJ's Wholesale Club, Inc. (a) |
5,200 |
176,150 |
|
|
Bradlees, Inc. (a) |
2,500 |
6,406 |
|
|
Consolidated Stores Corp. (a) |
7,294 |
99,381 |
|
|
Cost Plus, Inc. (a) |
3,725 |
125,253 |
|
|
Costco Wholesale Corp. (a) |
30,700 |
1,057,231 |
|
|
Dillards, Inc. Class A |
10,600 |
135,813 |
|
|
|
|||
|
Shares |
Value (Note 1) |
||
|
Dollar General Corp. |
22,701 |
$ 466,789 |
|
|
Dollar Tree Stores, Inc. (a) |
7,175 |
291,036 |
|
|
Elder Beerman Stores Corp. (a) |
500 |
2,250 |
|
|
Family Dollar Stores, Inc. |
11,000 |
198,000 |
|
|
Federated Department Stores, Inc. (a) |
14,300 |
395,038 |
|
|
Freds, Inc. Class A |
600 |
14,400 |
|
|
Hot Topic, Inc. (a) |
3,400 |
96,263 |
|
|
JCPenney Co., Inc. |
17,269 |
241,766 |
|
|
Jo-Ann Stores, Inc. Class A (a) |
500 |
3,281 |
|
|
Kmart Corp. (a) |
31,300 |
219,100 |
|
|
Kohls Corp. (a) |
22,500 |
1,260,000 |
|
|
Michaels Stores, Inc. (a) |
2,200 |
77,000 |
|
|
Neiman Marcus Group, Inc. Class A (a) |
1,700 |
57,056 |
|
|
Nordstrom, Inc. |
6,300 |
108,675 |
|
|
Party City Corp. (a) |
450 |
1,441 |
|
|
Pricesmart, Inc. (a) |
200 |
7,500 |
|
|
Saks, Inc. (a) |
8,831 |
88,310 |
|
|
Sears, Roebuck & Co. |
24,100 |
751,619 |
|
|
Shopko Stores, Inc. (a) |
2,700 |
30,881 |
|
|
Stein Mart, Inc. (a) |
1,300 |
15,275 |
|
|
Target Corp. |
63,200 |
1,469,400 |
|
|
The May Department Stores Co. |
23,300 |
534,444 |
|
|
Tuesday Morning Corp. (a) |
2,200 |
24,200 |
|
|
Value City Department Stores, Inc. (a) |
500 |
4,500 |
|
|
Wal-Mart Stores, Inc. |
313,400 |
14,866,913 |
|
|
|
23,142,828 |
||
|
Grocery Stores - 0.4% |
|||
|
Albertson's, Inc. |
27,459 |
590,369 |
|
|
Central Garden & Pet Co. (a) |
5,600 |
42,000 |
|
|
Delhaize America, Inc. |
8,655 |
129,825 |
|
|
Fleming Companies, Inc. |
4,800 |
74,100 |
|
|
Great Atlantic & Pacific Tea, Inc. |
1,200 |
16,800 |
|
|
Hain Celestial Group, Inc. (a) |
5,268 |
164,625 |
|
|
HomeGrocer.com, Inc. |
7,100 |
28,844 |
|
|
Krispy Kreme Doughnuts, Inc. |
1,900 |
176,700 |
|
|
Kroger Co. (a) |
55,080 |
1,249,628 |
|
|
Nash-Finch Co. |
200 |
1,950 |
|
|
Performance Food Group Co. (a) |
2,200 |
81,675 |
|
|
Safeway, Inc. (a) |
38,400 |
1,893,600 |
|
|
SUPERVALU, Inc. |
8,944 |
133,601 |
|
|
United Natural Foods, Inc. (a) |
4,700 |
71,088 |
|
|
VitaminShoppe.com, Inc. |
5,200 |
5,200 |
|
|
Weis Markets, Inc. |
1,200 |
40,800 |
|
|
Whole Foods Market, Inc. (a) |
4,200 |
212,100 |
|
|
Wild Oats Markets, Inc. (a) |
6,175 |
66,381 |
|
|
Winn-Dixie Stores, Inc. |
8,700 |
121,256 |
|
|
|
5,100,542 |
||
|
Retail & Wholesale, Miscellaneous - 1.3% |
|||
|
1-800 CONTACTS, Inc. (a) |
600 |
24,113 |
|
|
1-800-FLOWERS.COM, Inc. Class A |
4,700 |
24,675 |
|
|
800-JR Cigar, Inc. (a) |
300 |
3,844 |
|
|
Action Performance Companies, Inc. (a) |
7,600 |
30,400 |
|
|
Advanced Marketing Services, Inc. |
600 |
10,763 |
|
|
Common Stocks - continued |
|||
|
Shares |
Value (Note 1) |
||
|
RETAIL & WHOLESALE - continued |
|||
|
Retail & Wholesale, Miscellaneous - continued |
|||
|
AgriBioTech, Inc. (a) |
1,000 |
$ 8 |
|
|
Alberto-Culver Co. Class B |
3,800 |
107,588 |
|
|
Alloy Online, Inc. (a) |
3,300 |
29,081 |
|
|
Ashford.com, Inc. |
4,000 |
11,250 |
|
|
Barnes & Noble, Inc. (a) |
4,300 |
74,444 |
|
|
Bed Bath & Beyond, Inc. (a) |
19,400 |
340,713 |
|
|
Best Buy Co., Inc. (a) |
14,200 |
876,850 |
|
|
Beyond.com Corp. (a) |
9,500 |
11,578 |
|
|
Blair Corp. |
300 |
6,638 |
|
|
Blue Rhino Corp. (a) |
5,100 |
19,444 |
|
|
Bluefly, Inc. (a) |
2,800 |
8,925 |
|
|
Books-A-Million, Inc. (a) |
4,400 |
14,300 |
|
|
Borders Group, Inc. (a) |
5,000 |
66,563 |
|
|
Brookstone Co., Inc. (a) |
200 |
2,613 |
|
|
BUY.com, Inc. |
7,090 |
19,719 |
|
|
Cannondale Corp. (a) |
100 |
631 |
|
|
Circuit City Stores, Inc. - |
14,000 |
363,125 |
|
|
Coldwater Creek, Inc. (a) |
600 |
19,200 |
|
|
Cole National Corp. Class A |
500 |
3,500 |
|
|
Cyberian Outpost, Inc. (a) |
4,000 |
15,000 |
|
|
Daisytek International Corp. |
5,700 |
39,188 |
|
|
Damark International, Inc. Class A (a) |
100 |
1,558 |
|
|
dELiA*s, Inc. (a) |
4,500 |
11,250 |
|
|
Drugstore.com, Inc. |
2,900 |
17,763 |
|
|
E4L, Inc. (a) |
100 |
38 |
|
|
Egghead.com, Inc. (a) |
8,308 |
23,366 |
|
|
Elcom International, Inc. (a) |
2,200 |
12,925 |
|
|
Electronics Boutique Holding Corp. (a) |
1,300 |
29,250 |
|
|
eMerge Interactive, Inc. Class A |
3,930 |
86,706 |
|
|
Emerging Vision, Inc. (a) |
3,900 |
6,094 |
|
|
Enesco Group, Inc. |
5,100 |
33,150 |
|
|
Envision Development Corp. |
200 |
2,650 |
|
|
eToys, Inc. (a) |
15,400 |
69,300 |
|
|
Fatbrain.com, Inc. (a) |
4,600 |
18,256 |
|
|
Finish Line, Inc. Class A (a) |
1,500 |
11,906 |
|
|
Finishmaster, Inc. (a) |
900 |
5,625 |
|
|
Finlay Enterprises, Inc. (a) |
300 |
3,788 |
|
|
Fogdog, Inc. |
6,400 |
6,000 |
|
|
Friedmans, Inc. Class A |
600 |
3,038 |
|
|
FTD.com, Inc. Class A |
9,400 |
22,913 |
|
|
Gadzooks, Inc. (a) |
3,700 |
55,500 |
|
|
Genesis Direct, Inc. (a) |
3,000 |
18 |
|
|
GenesisIntermedia.com, Inc. (a) |
3,100 |
49,213 |
|
|
Global Sports, Inc. (a) |
800 |
7,000 |
|
|
Good Guys, Inc. (a) |
4,600 |
35,650 |
|
|
GSV, Inc. (a) |
980 |
1,409 |
|
|
Guitar Center, Inc. (a) |
2,300 |
34,500 |
|
|
Handleman Co. (a) |
1,200 |
14,850 |
|
|
Hollywood.com, Inc. (a) |
1,200 |
10,050 |
|
|
Home Depot, Inc. |
161,500 |
7,762,094 |
|
|
|
|||
|
Shares |
Value (Note 1) |
||
|
IdeaMall, Inc. (a) |
500 |
$ 1,969 |
|
|
InterTAN, Inc. (a) |
1,600 |
22,200 |
|
|
J. Jill Group, Inc. (a) |
5,100 |
47,175 |
|
|
K-Tel International, Inc. (a) |
4,100 |
7,175 |
|
|
Land's End, Inc. (a) |
2,000 |
48,875 |
|
|
Lillian Vernon Corp. |
200 |
2,225 |
|
|
Lowe's Companies, Inc. |
26,632 |
1,193,447 |
|
|
MediaBay, Inc. (a) |
800 |
1,825 |
|
|
MotherNature.com, Inc. |
7,900 |
5,184 |
|
|
Multiple Zones International, Inc. (a) |
4,100 |
18,450 |
|
|
Musicland Stores Corp. (a) |
1,600 |
11,400 |
|
|
Navarre Corp. (a) |
5,900 |
13,644 |
|
|
Network Commerce, Inc. |
1,300 |
7,150 |
|
|
Newpark Resources, Inc. (a) |
2,100 |
21,525 |
|
|
Office Depot, Inc. (a) |
21,300 |
155,756 |
|
|
Officemax, Inc. (a) |
7,000 |
36,313 |
|
|
PC Connection, Inc. |
2,250 |
145,688 |
|
|
PEAPOD, Inc. (a) |
12,600 |
23,625 |
|
|
PETCO Animal Supplies, Inc. (a) |
1,200 |
25,200 |
|
|
Pets.com, Inc. |
1,450 |
1,405 |
|
|
PETsMART, Inc. (a) |
14,700 |
67,988 |
|
|
Pier 1 Imports, Inc. |
7,550 |
88,713 |
|
|
Piercing Pagoda, Inc. (a) |
300 |
6,394 |
|
|
RadioShack Corp. |
12,940 |
763,460 |
|
|
Rex Stores Corp. (a) |
1,500 |
26,813 |
|
|
RoweCom, Inc. (a) |
4,100 |
24,600 |
|
|
School Specialty, Inc. (a) |
1,200 |
21,675 |
|
|
SCP Pool Corp. (a) |
600 |
17,588 |
|
|
Sharper Image Corp. (a) |
1,100 |
22,000 |
|
|
Shop At Home, Inc. (a) |
5,200 |
19,175 |
|
|
SkyMall, Inc. (a) |
700 |
2,450 |
|
|
Spiegel, Inc. Class A |
12,000 |
81,750 |
|
|
Stamps.com, Inc. (a) |
800 |
5,250 |
|
|
Staples, Inc. (a) |
33,475 |
514,678 |
|
|
Streamline.com, Inc. (a) |
4,200 |
2,494 |
|
|
Sunglass Hut International, Inc. (a) |
14,300 |
103,675 |
|
|
The Sports Authority, Inc. (a) |
1,300 |
2,763 |
|
|
Tiffany & Co., Inc. |
10,000 |
416,250 |
|
|
Toys 'R' Us, Inc. (a) |
14,800 |
269,175 |
|
|
Tractor Supply Co. (a) |
300 |
3,900 |
|
|
Transportation World |
2,900 |
28,094 |
|
|
Tweeter Home Entertainment |
2,600 |
93,438 |
|
|
U.S. Office Products Co. (a) |
1,363 |
596 |
|
|
U.S.A. Floral Products, Inc. (a) |
1,000 |
313 |
|
|
Ultimate Electronics, Inc. (a) |
3,400 |
119,213 |
|
|
Valley Media, Inc. (a) |
3,000 |
8,250 |
|
|
Value America, Inc. (a) |
20,800 |
14,950 |
|
|
Ventro Corp. |
3,200 |
45,600 |
|
|
Webvan Group, Inc. |
800 |
3,200 |
|
|
Whitehall Jewellers, Inc. (a) |
600 |
5,400 |
|
|
Common Stocks - continued |
|||
|
Shares |
Value (Note 1) |
||
|
RETAIL & WHOLESALE - continued |
|||
|
Retail & Wholesale, Miscellaneous - continued |
|||
|
Williams-Sonoma, Inc. (a) |
3,800 |
$ 136,563 |
|
|
Zale Corp. (a) |
2,400 |
88,650 |
|
|
|
15,255,302 |
||
|
TOTAL RETAIL & WHOLESALE |
51,626,771 |
||
|
SERVICES - 1.3% |
|||
|
Advertising - 0.3% |
|||
|
Ackerley Group, Inc. |
700 |
7,919 |
|
|
ADVO, Inc. (a) |
4,100 |
167,844 |
|
|
Digital Impact, Inc. |
800 |
7,625 |
|
|
DoubleClick, Inc. (a) |
7,932 |
322,733 |
|
|
Egreetings Network, Inc. |
5,800 |
6,888 |
|
|
Getty Images, Inc. (a) |
3,900 |
163,800 |
|
|
HA-LO Industries, Inc. (a) |
1,250 |
6,250 |
|
|
Interep National Radio Sales, Inc. |
2,900 |
18,488 |
|
|
Interpublic Group of Companies, Inc. |
20,600 |
787,950 |
|
|
Key3Media Group, Inc. (a) |
3,150 |
23,822 |
|
|
Lamar Advertising Co. Class A (a) |
5,950 |
276,303 |
|
|
Leapnet, Inc. (a) |
6,325 |
19,766 |
|
|
LifeMinders, Inc. |
1,900 |
57,000 |
|
|
Mediaplex, Inc. |
1,500 |
19,031 |
|
|
MyPoints.com, Inc. |
2,832 |
38,586 |
|
|
NetCreations, Inc. |
500 |
10,563 |
|
|
Newgen Results Corp. (a) |
3,400 |
59,075 |
|
|
Omnicom Group, Inc. |
12,400 |
1,034,625 |
|
|
R.H. Donnelley Corp. (a) |
1,300 |
27,300 |
|
|
Switchboard, Inc. |
2,900 |
26,281 |
|
|
TMP Worldwide, Inc. (a) |
6,000 |
415,125 |
|
|
Young & Rubicam, Inc. |
4,700 |
274,950 |
|
|
YouthStream Media Networks, Inc. (a) |
1,300 |
5,931 |
|
|
|
3,777,855 |
||
|
Educational Services - 0.1% |
|||
|
Apollo Group, Inc. Class A (a) |
5,250 |
214,266 |
|
|
Argosy Education Group, Inc. Class A (a) |
1,100 |
7,563 |
|
|
Career Education Corp. (a) |
1,600 |
63,900 |
|
|
Corinthian Colleges, Inc. (a) |
900 |
48,600 |
|
|
Devry, Inc. (a) |
5,000 |
186,875 |
|
|
Edison Schools, Inc. |
5,000 |
155,000 |
|
|
Education Management Corp. (a) |
2,600 |
65,650 |
|
|
Educational Video Conferencing, Inc. (a) |
2,100 |
30,188 |
|
|
GP Strategies Corp. (a) |
1,600 |
6,900 |
|
|
ITT Educational Services, Inc. (a) |
2,900 |
66,700 |
|
|
New Horizons Worldwide, Inc. (a) |
900 |
19,181 |
|
|
Prosoft Training.com (a) |
3,100 |
41,463 |
|
|
Provant, Inc. (a) |
2,300 |
15,669 |
|
|
SkillSoft Corp. |
2,290 |
40,648 |
|
|
|
|||
|
Shares |
Value (Note 1) |
||
|
Strayer Education, Inc. |
1,700 |
$ 39,020 |
|
|
Sylvan Learning Systems (a) |
6,800 |
98,175 |
|
|
|
1,099,798 |
||
|
Leasing & Rental - 0.1% |
|||
|
Aaron Rents, Inc. Class A |
800 |
12,000 |
|
|
Aerocentury Corp. (a) |
800 |
5,400 |
|
|
AMERCO (a) |
1,800 |
35,325 |
|
|
ANC Rental Corp. (a) |
4,000 |
28,000 |
|
|
Avis Group Holdings, Inc. Class A (a) |
4,100 |
126,075 |
|
|
Blockbuster, Inc. Class A |
9,200 |
86,250 |
|
|
Budget Group, Inc. Class A (a) |
1,400 |
6,300 |
|
|
Central Parking Corp. |
2,800 |
54,250 |
|
|
Dollar Thrifty Automotive Group, Inc. (a) |
1,900 |
42,988 |
|
|
GATX Corp. |
3,400 |
138,338 |
|
|
Hertz Corp. Class A |
3,500 |
107,188 |
|
|
International Aircraft Investors (a) |
1,100 |
6,188 |
|
|
Interpool, Inc. |
2,300 |
27,744 |
|
|
Laser Vision Centers, Inc. (a) |
4,800 |
29,550 |
|
|
McGrath RentCorp. |
1,200 |
20,475 |
|
|
Mitcham Industries, Inc. (a) |
1,500 |
8,531 |
|
|
National Equipment Services, Inc. (a) |
300 |
1,575 |
|
|
Neff Corp. (a) |
2,100 |
10,238 |
|
|
PLM International, Inc. (a) |
1,200 |
7,725 |
|
|
Rainbow Rentals, Inc. (a) |
800 |
10,100 |
|
|
Rent-A-Center, Inc. (a) |
5,300 |
174,569 |
|
|
Rent-Way, Inc. (a) |
1,770 |
43,365 |
|
|
Ryder System, Inc. |
4,400 |
84,425 |
|
|
United Rentals, Inc. (a) |
5,300 |
109,975 |
|
|
Universal Compression Holdings, Inc. |
1,100 |
36,163 |
|
|
|
1,212,737 |
||
|
Printing - 0.1% |
|||
|
Bowne & Co., Inc. |
1,100 |
11,413 |
|
|
Consolidated Graphics, Inc. (a) |
2,700 |
39,825 |
|
|
Cyrk, Inc. (a) |
5,700 |
26,006 |
|
|
Deluxe Corp. |
4,400 |
96,800 |
|
|
John H. Harland Co. |
800 |
11,700 |
|
|
New England Business Service, Inc. |
300 |
5,906 |
|
|
Paxar Corp. (a) |
2,000 |
22,000 |
|
|
R.R. Donnelley & Sons Co. |
7,900 |
203,425 |
|
|
Reynolds & Reynolds Co. Class A |
4,500 |
81,563 |
|
|
Standard Register Co. |
900 |
11,531 |
|
|
Valassis Communications, Inc. (a) |
6,300 |
181,913 |
|
|
Wallace Computer Services, Inc. |
1,300 |
15,113 |
|
|
|
707,195 |
||
|
Services - 0.7% |
|||
|
Ablest, Inc. (a) |
1,000 |
4,313 |
|
|
ABM Industries, Inc. |
1,700 |
45,900 |
|
|
ACNielsen Corp. (a) |
3,300 |
79,406 |
|
|
Administaff, Inc. (a) |
1,000 |
81,500 |
|
|
AG Services of America, Inc. (a) |
100 |
1,775 |
|
|
AHL Services, Inc. (a) |
2,600 |
21,613 |
|
|
ALPNET, Inc. (a) |
8,300 |
19,194 |
|
|
Common Stocks - continued |
|||
|
Shares |
Value (Note 1) |
||
|
SERVICES - continued |
|||
|
Services - continued |
|||
|
Alterra Healthcare Corp. (a) |
500 |
$ 1,219 |
|
|
Analytical Surveys, Inc. (a) |
200 |
350 |
|
|
APAC Teleservices, Inc. (a) |
4,400 |
34,925 |
|
|
Applied Analytical Industries, Inc. (a) |
1,800 |
16,200 |
|
|
Assisted Living Concepts, Inc. (a) |
400 |
250 |
|
|
Audio Visual Services Corp. (a) |
900 |
675 |
|
|
Barrett Business Services, Inc. (a) |
1,400 |
7,350 |
|
|
Berlitz International, Inc. (a) |
1,100 |
11,138 |
|
|
Billing Information Concepts Corp. (a) |
1,200 |
3,900 |
|
|
Boron LePore & Associates, Inc. (a) |
600 |
5,925 |
|
|
Braun Consulting, Inc. |
1,700 |
27,625 |
|
|
Bright Horizons Family Solutions, Inc. (a) |
2,800 |
68,600 |
|
|
Brookdale Living Communities, Inc. (a) |
100 |
1,513 |
|
|
Burns International Services Corp. (a) |
2,600 |
55,900 |
|
|
Butler International, Inc. |
1,300 |
8,613 |
|
|
Cadiz, Inc. (a) |
1,900 |
18,406 |
|
|
Caremark Rx, Inc. (a) |
13,300 |
130,506 |
|
|
Cash Technologies, Inc. (a) |
3,400 |
23,588 |
|
|
Catalina Marketing Corp. (a) |
4,500 |
192,094 |
|
|
CDI Corp. (a) |
1,600 |
29,600 |
|
|
Cendant Corp. (a) |
46,210 |
609,394 |
|
|
Century Business Services, Inc. (a) |
2,300 |
4,025 |
|
|
CheckFree Corp. (a) |
3,200 |
165,800 |
|
|
Chemed Corp. |
900 |
27,563 |
|
|
Childtime Learning Centers, Inc. (a) |
900 |
7,425 |
|
|
Cintas Corp. |
11,811 |
490,895 |
|
|
Computer Horizons Corp. (a) |
5,400 |
51,638 |
|
|
Convergys Corp. (a) |
10,700 |
418,638 |
|
|
Cornell Companies, Inc. (a) |
1,400 |
11,638 |
|
|
Corporate Executive Board Co. (a) |
800 |
56,800 |
|
|
Correctional Services Corp. (a) |
27 |
105 |
|
|
CPI Corp. |
2,000 |
48,750 |
|
|
Creditrust Corp. (a) |
6,700 |
8,794 |
|
|
Day Runner, Inc. (a) |
60 |
38 |
|
|
Diamond Technology Partners, Inc. |
1,500 |
95,719 |
|
|
DigitalThink, Inc. |
1,920 |
65,400 |
|
|
Digitas, Inc. |
3,500 |
48,125 |
|
|
Dun & Bradstreet Corp. |
10,700 |
353,100 |
|
|
Ecolab, Inc. |
9,600 |
373,800 |
|
|
Edgewater Technology, Inc. (a) |
2,800 |
17,500 |
|
|
eGlobe, Inc. (a) |
5,500 |
11,516 |
|
|
eLoyalty Corp. |
3,950 |
53,819 |
|
|
Expedia, Inc. Class A |
2,300 |
36,944 |
|
|
Fonar Corp. (a) |
200 |
500 |
|
|
Forrester Research, Inc. (a) |
1,200 |
73,350 |
|
|
FreeMarkets, Inc. |
2,300 |
187,163 |
|
|
Frontline Capital Group (a) |
2,700 |
47,419 |
|
|
FYI, Inc. (a) |
600 |
23,400 |
|
|
G&K Services, Inc. Class A |
5,300 |
153,700 |
|
|
Gartner Group, Inc. Class B (a) |
4,500 |
50,625 |
|
|
|
|||
|
Shares |
Value (Note 1) |
||
|
Greg Manning Auctions, Inc. (a) |
700 |
$ 6,431 |
|
|
H&R Block, Inc. |
5,200 |
186,550 |
|
|
Hall Kinion & Associates, Inc. (a) |
3,400 |
112,200 |
|
|
Headway Corporate Resources (a) |
300 |
731 |
|
|
Heidrick & Struggles International, Inc. (a) |
1,400 |
81,375 |
|
|
iBeam Broadcasting Corp. |
9,900 |
105,188 |
|
|
Insurance Auto Auctions, Inc. (a) |
1,000 |
16,500 |
|
|
Kelly Services, Inc. Class A |
2,700 |
62,438 |
|
|
kforce.com, Inc. (a) |
2,127 |
9,704 |
|
|
Korn/Ferry International (a) |
2,700 |
82,181 |
|
|
Kroll-O'Gara Co. (a) |
3,800 |
19,475 |
|
|
Labor Ready, Inc. (a) |
1,800 |
6,975 |
|
|
Lason, Inc. (a) |
12,200 |
28,975 |
|
|
Learning Tree International, Inc. (a) |
1,600 |
109,500 |
|
|
Mace Security International, Inc. (a) |
2,200 |
2,750 |
|
|
Macrovision Corp. (a) |
3,500 |
373,188 |
|
|
Manpower, Inc. |
5,400 |
195,413 |
|
|
MarchFirst, Inc. (a) |
9,424 |
182,590 |
|
|
Marketing Services Group, Inc. (a) |
500 |
2,563 |
|
|
Maximus, Inc. (a) |
700 |
15,488 |
|
|
Media Arts Group, Inc. (a) |
200 |
800 |
|
|
Media Metrix, Inc. (a) |
1,400 |
34,650 |
|
|
MemberWorks, Inc. (a) |
2,400 |
67,500 |
|
|
Modem Media . Poppe Tyson, Inc. (a) |
4,400 |
46,475 |
|
|
Modis Professional Services, Inc. (a) |
7,300 |
50,188 |
|
|
NAHC, Inc. (a) |
300 |
8 |
|
|
National Processing, Inc. (a) |
1,600 |
18,900 |
|
|
National Service Industries, Inc. |
2,600 |
51,838 |
|
|
Navigant Consulting, Inc. (a) |
6,050 |
24,200 |
|
|
NCO Group, Inc. (a) |
3,400 |
59,075 |
|
|
NewsEdge Corp. (a) |
500 |
1,063 |
|
|
Nextera Enterprises, Inc. (a) |
5,100 |
19,125 |
|
|
Nobel Learning Communities, Inc. (a) |
1,000 |
9,500 |
|
|
NOVA Corp. (a) |
4,357 |
62,632 |
|
|
On Assignment, Inc. (a) |
1,700 |
50,788 |
|
|
Organic, Inc. |
4,830 |
34,716 |
|
|
PeoplePC, Inc. |
7,900 |
67,348 |
|
|
Per-Se Technologies, Inc. (a) |
933 |
11,138 |
|
|
Personnel Group of America, Inc. (a) |
900 |
3,206 |
|
|
Pittston Co. - Brinks Group |
4,000 |
62,250 |
|
|
Plastic Surgery Co. |
300 |
956 |
|
|
Pre-Paid Legal Services, Inc. (a) |
1,000 |
32,813 |
|
|
Probusiness Services, Inc. (a) |
800 |
17,600 |
|
|
Professional Detailing, Inc. (a) |
500 |
24,063 |
|
|
Profit Recovery Group |
8,150 |
73,605 |
|
|
Protection One, Inc. (a) |
100 |
175 |
|
|
PTEK Holdings, Inc. (a) |
8,316 |
29,626 |
|
|
RCM Technologies, Inc. (a) |
1,400 |
6,650 |
|
|
Regis Corp. |
3,200 |
50,600 |
|
|
Register.com, Inc. |
300 |
4,200 |
|
|
RemedyTemp, Inc. Class A (a) |
900 |
10,856 |
|
|
Renaissance Worldwide, Inc. (a) |
2,000 |
3,125 |
|
|
Common Stocks - continued |
|||
|
Shares |
Value (Note 1) |
||
|
SERVICES - continued |
|||
|
Services - continued |
|||
|
Robert Half International, Inc. (a) |
12,500 |
$ 397,656 |
|
|
Rollins, Inc. |
2,400 |
36,000 |
|
|
RTW, Inc. (a) |
2,900 |
9,969 |
|
|
Rural/Metro Corp. (a) |
500 |
1,000 |
|
|
Service Corp. International (SCI) |
16,652 |
38,508 |
|
|
ServiceMaster Co. |
21,850 |
211,672 |
|
|
SITEL Corp. (a) |
2,200 |
12,650 |
|
|
Snyder Communications, Inc. (SNC) |
4,300 |
117,713 |
|
|
SOS Staffing Services, Inc. (a) |
300 |
825 |
|
|
Sotheby's Holdings, Inc. Class A |
3,200 |
66,200 |
|
|
Source Information Management Co. (a) |
4,400 |
44,550 |
|
|
Spherion Corp. (a) |
4,720 |
58,115 |
|
|
Staff Leasing, Inc. (a) |
4,800 |
19,200 |
|
|
StarTek, Inc. (a) |
1,900 |
74,456 |
|
|
Sterile Recoveries, Inc. (a) |
900 |
8,044 |
|
|
Student Advantage, Inc. (a) |
500 |
4,688 |
|
|
Superior Consultant Holdings Corp. (a) |
1,300 |
3,819 |
|
|
TechSys, Inc. (a) |
800 |
7,000 |
|
|
Teletech Holdings, Inc. (a) |
3,800 |
123,975 |
|
|
The Management Network Group, Inc. |
1,200 |
24,075 |
|
|
Total System Services, Inc. |
12,600 |
207,900 |
|
|
TRM Corp. (a) |
1,400 |
4,900 |
|
|
True North Communications |
3,500 |
162,313 |
|
|
Unifirst Corp. |
1,100 |
11,138 |
|
|
Universal Access, Inc. |
2,900 |
45,856 |
|
|
Veterinary Centers of America, Inc. (a) |
8,300 |
120,350 |
|
|
Viad Corp. |
6,700 |
196,394 |
|
|
Vicinity Corp. |
1,410 |
15,686 |
|
|
Vision Twenty-One, Inc. (a) |
3,700 |
578 |
|
|
Volt Information Sciences, Inc. (a) |
1,200 |
40,575 |
|
|
Wackenhut Corp. (a) |
1,400 |
19,863 |
|
|
Wackenhut Corrections Corp. (a) |
2,100 |
19,031 |
|
|
Yellowave Corp. (a) |
500 |
3,531 |
|
|
|
9,023,775 |
||
|
TOTAL SERVICES |
15,821,360 |
||
|
TECHNOLOGY - 34.2% |
|||
|
Communications Equipment - 5.5% |
|||
|
3Com Corp. |
23,500 |
390,688 |
|
|
Accelerated Networks, Inc. |
3,400 |
80,538 |
|
|
Ace Communication Corp. (a) |
3,000 |
28,500 |
|
|
Active Voice Corp. (a) |
6,900 |
92,288 |
|
|
ADC Telecommunications, Inc. (a) |
46,170 |
1,890,084 |
|
|
Advanced Fibre Communications, Inc. (a) |
4,600 |
243,153 |
|
|
AltiGen Communications, Inc. |
3,200 |
16,800 |
|
|
Andrew Corp. (a) |
5,600 |
165,900 |
|
|
Applied Signal Technology, Inc. |
5,000 |
49,375 |
|
|
Aspect Communications Corp. (a) |
2,600 |
58,663 |
|
|
Avanex Corp. |
430 |
65,132 |
|
|
Brooktrout, Inc. (a) |
2,900 |
98,600 |
|
|
|
|||
|
Shares |
Value (Note 1) |
||
|
C-Phone Corp. (a) |
500 |
$ 453 |
|
|
Cable Design Technologies Corp. (a) |
5,775 |
155,925 |
|
|
Cabletron Systems, Inc. (a) |
10,700 |
400,581 |
|
|
Carrier Access Corp. (a) |
1,400 |
67,025 |
|
|
CheckPoint Systems, Inc. (a) |
900 |
7,200 |
|
|
Ciena Corp. (a) |
9,500 |
2,106,031 |
|
|
Cisco Systems, Inc. (a) |
485,172 |
33,294,929 |
|
|
Com21, Inc. (a) |
3,200 |
53,200 |
|
|
Comdial Corp. (a) |
5,700 |
13,003 |
|
|
Comverse Technology, Inc. (a) |
10,579 |
972,607 |
|
|
Corning, Inc. |
19,130 |
6,273,444 |
|
|
Corvis Corp. |
11,800 |
1,224,988 |
|
|
Data Race, Inc. (a) |
12,000 |
69,750 |
|
|
Davox Corp. (a) |
6,800 |
85,850 |
|
|
Digital Island, Inc. |
4,200 |
124,688 |
|
|
Ditech Communications Corp. (a) |
1,400 |
82,600 |
|
|
Efficient Networks, Inc. (a) |
3,700 |
198,817 |
|
|
Elcotel, Inc. (a) |
6,000 |
8,625 |
|
|
General Datacomm Industries, Inc. (a) |
100 |
600 |
|
|
Integrated Telecom Express, Inc. |
2,900 |
91,169 |
|
|
Intelect Communications, Inc. (a) |
20,200 |
38,506 |
|
|
InterDigital Communication Corp. (a) |
2,400 |
42,900 |
|
|
Interlogix, Inc. (a) |
778 |
11,962 |
|
|
InterVoice-Brite, Inc. (a) |
1,987 |
24,713 |
|
|
Jabil Circuit, Inc. (a) |
12,300 |
784,894 |
|
|
Lexent, Inc. |
2,800 |
93,975 |
|
|
LoJack Corp. (a) |
600 |
4,500 |
|
|
Lucent Technologies, Inc. |
228,407 |
9,550,268 |
|
|
McDATA Corp. Class B |
1,800 |
193,613 |
|
|
MCK Communications, Inc. |
2,000 |
57,500 |
|
|
Metricom, Inc. (a) |
2,300 |
93,581 |
|
|
Microtest, Inc. (a) |
4,500 |
37,125 |
|
|
Natural MicroSystems Corp. (a) |
3,000 |
223,688 |
|
|
Network Equipment Technologies, Inc. (a) |
800 |
9,650 |
|
|
Next Level Communications, Inc. |
5,400 |
238,275 |
|
|
OSI Systems, Inc. (a) |
600 |
8,063 |
|
|
Osicom Technologies, Inc. (a) |
600 |
35,400 |
|
|
P-Com, Inc. (a) |
3,900 |
24,375 |
|
|
Panja, Inc. (a) |
5,500 |
64,625 |
|
|
PictureTel Corp. (a) |
1,300 |
12,634 |
|
|
Plantronics, Inc. (a) |
3,900 |
194,756 |
|
|
Pliant Systems, Inc. (a) |
3,900 |
17,306 |
|
|
Quentra Networks, Inc. (a) |
8,900 |
39,494 |
|
|
Sycamore Networks, Inc. |
16,700 |
2,296,250 |
|
|
Symmetricom, Inc. (a) |
900 |
13,950 |
|
|
Tekelec (a) |
3,000 |
118,500 |
|
|
Tellabs, Inc. (a) |
27,888 |
1,566,957 |
|
|
Terayon Communication Systems, Inc. (a) |
3,800 |
210,900 |
|
|
Tollgrade Communications, Inc. (a) |
900 |
100,069 |
|
|
Turnstone Systems, Inc. |
620 |
36,503 |
|
|
Tut Systems, Inc. (a) |
1,100 |
110,688 |
|
|
Ultrak, Inc. (a) |
3,800 |
28,500 |
|
|
UTStarcom, Inc. |
2,400 |
57,300 |
|
|
Veramark Technologies, Inc. (a) |
2,300 |
7,475 |
|
|
Common Stocks - continued |
|||
|
Shares |
Value (Note 1) |
||
|
TECHNOLOGY - continued |
|||
|
Communications Equipment - continued |
|||
|
Video Network Communication, Inc. (a) |
4,900 |
$ 11,025 |
|
|
VTEL Corp. (a) |
10,600 |
33,125 |
|
|
Westell Technologies, Inc. Class A (a) |
5,470 |
87,520 |
|
|
Western Multiplex Corp. Class A |
3,600 |
71,775 |
|
|
XETA Technologies, Inc. (a) |
3,600 |
60,525 |
|
|
Xircom, Inc. (a) |
1,500 |
46,313 |
|
|
ZixIt Corp. (a) |
900 |
43,875 |
|
|
|
65,114,259 |
||
|
Computer Services & Software - 11.2% |
|||
|
24/7 Media, Inc. (a) |
5,100 |
73,631 |
|
|
4Front Technologies, Inc. (a) |
2,100 |
33,173 |
|
|
About.com, Inc. (a) |
1,200 |
52,350 |
|
|
Acclaim Entertainment, Inc. (a) |
18,800 |
35,250 |
|
|
Accrue Software, Inc. |
2,400 |
51,150 |
|
|
ActionPoint, Inc. (a) |
2,000 |
16,125 |
|
|
Activision, Inc. (a) |
4,500 |
63,000 |
|
|
Actuate Software Corp. (a) |
1,600 |
41,500 |
|
|
ACTV, Inc. (a) |
3,400 |
60,563 |
|
|
Acxiom Corp. (a) |
7,900 |
201,450 |
|
|
Adam.com, Inc. (a) |
1,800 |
7,763 |
|
|
Adept Technology, Inc. (a) |
2,500 |
124,844 |
|
|
Adobe Systems, Inc. |
7,900 |
1,027,000 |
|
|
Advantage Learning Systems, Inc. (a) |
800 |
23,500 |
|
|
Advent Software, Inc. (a) |
3,500 |
215,688 |
|
|
Aether Systems, Inc. |
2,700 |
373,950 |
|
|
Affiliated Computer Services, Inc. |
3,100 |
144,344 |
|
|
Affinity Technology Group, Inc. (a) |
10,800 |
8,438 |
|
|
Affymetrix, Inc. (a) |
3,400 |
268,600 |
|
|
AGENCY.COM Ltd. |
1,600 |
38,300 |
|
|
Agile Software Corp. |
2,500 |
173,594 |
|
|
AHT Corp. (a) |
1,000 |
500 |
|
|
Akamai Technologies, Inc. |
578 |
43,675 |
|
|
Allaire Corp. (a) |
3,000 |
101,813 |
|
|
AlphaNet Solutions, Inc. (a) |
400 |
1,650 |
|
|
Alternative Resources Corp. (a) |
700 |
788 |
|
|
Amazon.com, Inc. (a) |
24,200 |
1,004,300 |
|
|
America Online, Inc. (a) |
160,299 |
9,397,529 |
|
|
American Management Systems, Inc. (a) |
4,800 |
89,700 |
|
|
American Software, Inc. Class A (a) |
3,800 |
16,150 |
|
|
Ansoft Corp. (a) |
500 |
7,000 |
|
|
AnswerThink Consulting Group, Inc. (a) |
1,940 |
33,223 |
|
|
Ansys, Inc. (a) |
9,100 |
96,119 |
|
|
AppliedTheory Corp. (a) |
800 |
6,450 |
|
|
Applix, Inc. (a) |
2,600 |
12,025 |
|
|
AppNet Systems, Inc. (a) |
2,400 |
118,650 |
|
|
Apropos Technology, Inc. |
750 |
9,563 |
|
|
AremisSoft Corp. (a) |
2,000 |
54,500 |
|
|
ARI Network Services, Inc. (a) |
2,800 |
5,775 |
|
|
Ariba, Inc. |
16,400 |
2,580,950 |
|
|
ARIS Corp. (a) |
700 |
2,450 |
|
|
|
|||
|
Shares |
Value (Note 1) |
||
|
Art Technology Group, Inc. |
4,500 |
$ 458,719 |
|
|
Artisoft, Inc. (a) |
3,200 |
34,400 |
|
|
Ask Jeeves, Inc. |
1,800 |
54,900 |
|
|
Aspen Technology, Inc. (a) |
2,800 |
128,625 |
|
|
At Home Corp. Series A (a) |
24,600 |
358,238 |
|
|
At Plan, Inc. |
2,900 |
17,581 |
|
|
Audiohighway.com (a) |
5,400 |
6,075 |
|
|
Autobytel.com, Inc. (a) |
5,700 |
28,856 |
|
|
Autodesk, Inc. |
1,800 |
50,625 |
|
|
Automatic Data Processing, Inc. |
43,500 |
2,593,688 |
|
|
Autoweb.Com, Inc. (a) |
5,100 |
8,766 |
|
|
Avant! Corp. (a) |
7,000 |
101,938 |
|
|
AVT Corp. (a) |
7,300 |
43,344 |
|
|
Aware, Inc. (a) |
1,400 |
62,738 |
|
|
Axent Technolgies, Inc. (a) |
1,780 |
42,275 |
|
|
Aztec Technology Partners, Inc. (a) |
6,600 |
10,313 |
|
|
b2bstores.com, Inc. |
3,700 |
7,400 |
|
|
barnesandnoble.com, Inc. Class A (a) |
7,900 |
31,600 |
|
|
Barra, Inc. (a) |
700 |
40,338 |
|
|
Base Ten Systems, Inc. Class A (a) |
40 |
31 |
|
|
Be Free, Inc. |
1,900 |
11,519 |
|
|
BEA Systems, Inc. (a) |
16,000 |
1,089,000 |
|
|
Bell & Howell Co. (a) |
3,800 |
84,550 |
|
|
Bell Industries, Inc. |
7,300 |
18,706 |
|
|
BindView Development Corp. (a) |
4,200 |
41,213 |
|
|
Bitstream, Inc. (a) |
10,400 |
43,550 |
|
|
Bitwise Designs, Inc. (a) |
1,900 |
8,966 |
|
|
Black Box Corp. (a) |
1,400 |
83,300 |
|
|
Blue Martini Software, Inc. |
4,800 |
333,600 |
|
|
Bluestone Software, Inc. |
3,600 |
84,150 |
|
|
BMC Software, Inc. (a) |
14,245 |
384,615 |
|
|
Bottomline Technologies, Inc. (a) |
1,400 |
44,363 |
|
|
Breakaway Solutions, Inc. |
1,700 |
25,288 |
|
|
Brio Technology, Inc. (a) |
1,200 |
11,100 |
|
|
Broadbase Software, Inc. |
3,200 |
67,000 |
|
|
BroadVision, Inc. (a) |
17,059 |
588,536 |
|
|
BSQUARE Corp. |
1,200 |
20,400 |
|
|
C-bridge Internet Solutions, Inc. |
700 |
11,813 |
|
|
CACI International, Inc. Class A (a) |
700 |
15,750 |
|
|
Cadence Design Systems, Inc. (a) |
14,752 |
313,480 |
|
|
Caldera Systems, Inc. |
2,200 |
17,050 |
|
|
Calico Commerce, Inc. |
626 |
6,319 |
|
|
CAM Commerce Solutions, Inc. (a) |
2,300 |
14,303 |
|
|
Cambridge Technology Partners, Inc. (a) |
5,000 |
30,781 |
|
|
Caminus Corp. |
100 |
1,688 |
|
|
CareInsite, Inc. (a) |
4,500 |
100,688 |
|
|
CE Software, Inc. (a) |
400 |
0 |
|
|
CenterSpan Communications Corp. (a) |
1,300 |
20,719 |
|
|
Centra Software, Inc. |
1,280 |
11,760 |
|
|
Centura Software Corp. (a) |
1,900 |
6,472 |
|
|
Ceridian Corp. (a) |
9,300 |
224,944 |
|
|
Cerner Corp. (a) |
3,400 |
129,413 |
|
|
Chordiant Software, Inc. |
1,910 |
23,039 |
|
|
Ciber, Inc. (a) |
4,300 |
44,344 |
|
|
Common Stocks - continued |
|||
|
Shares |
Value (Note 1) |
||
|
TECHNOLOGY - continued |
|||
|
Computer Services & Software - continued |
|||
|
Citrix Systems, Inc. (a) |
9,700 |
$ 213,400 |
|
|
Clarent Corp. |
4,182 |
199,691 |
|
|
Clarus Corp. (a) |
2,600 |
157,300 |
|
|
Click Communication, Inc. |
2,500 |
75,000 |
|
|
CMGI, Inc. (a) |
19,408 |
868,508 |
|
|
CNET Networks, Inc. (a) |
5,500 |
184,250 |
|
|
Cobalt Networks, Inc. |
3,300 |
163,763 |
|
|
Cognizant Technology Solutions Corp. (a) |
1,200 |
51,300 |
|
|
Command Systems, Inc. (a) |
1,300 |
3,006 |
|
|
Commerce One, Inc. |
10,600 |
662,831 |
|
|
Complete Business Solutions, Inc. (a) |
1,255 |
16,943 |
|
|
CompuCom Systems, Inc. (a) |
200 |
700 |
|
|
Computer Associates International, Inc. |
41,256 |
1,309,878 |
|
|
Computer Concepts Corp. |
600 |
525 |
|
|
Computer Learning Centers, Inc. (a) |
420 |
604 |
|
|
Computer Sciences Corp. (a) |
11,399 |
901,233 |
|
|
Compuware Corp. (a) |
18,900 |
199,631 |
|
|
Concero, Inc. (a) |
1,700 |
14,025 |
|
|
Concord Communications, Inc. (a) |
1,200 |
28,800 |
|
|
Concur Technologies, Inc. (a) |
3,000 |
9,188 |
|
|
Continuus Software Corp. |
3,800 |
8,550 |
|
|
Corillian Corp. |
500 |
3,906 |
|
|
Corio, Inc. |
7,700 |
99,619 |
|
|
Cornerstone Internet Solutions Co. (a) |
5,000 |
4,688 |
|
|
Corsair Communictions, Inc. (a) |
3,700 |
40,700 |
|
|
CoStar Group, Inc. (a) |
2,189 |
60,471 |
|
|
Covad Communications Group, Inc. (a) |
8,525 |
139,064 |
|
|
Critical Path, Inc. (a) |
4,158 |
321,206 |
|
|
Crosswalk.com, Inc. (a) |
300 |
619 |
|
|
CSG Systems International, Inc. (a) |
3,300 |
149,119 |
|
|
CSP, Inc. (a) |
3,700 |
19,425 |
|
|
CUseeMe Networks, Inc. (a) |
1,700 |
12,431 |
|
|
Cybercash, Inc. (a) |
7,900 |
42,956 |
|
|
CyberOptics Corp. (a) |
1,950 |
56,550 |
|
|
CyberSource Corp. (a) |
2,800 |
34,650 |
|
|
Cylink Corp. (a) |
100 |
1,425 |
|
|
DAOU Systems, Inc. (a) |
200 |
400 |
|
|
Data Broadcasting Corp. (a) |
1,000 |
4,000 |
|
|
Data Dimensions, Inc. (a) |
200 |
275 |
|
|
Data Return Corp. |
1,800 |
35,859 |
|
|
Datalink Corp. |
2,200 |
34,238 |
|
|
Datastream Systems, Inc. (a) |
2,700 |
24,638 |
|
|
Datatec Systems, Inc. (a) |
5,200 |
25,025 |
|
|
Dataware Technologies, Inc. (a) |
3,100 |
12,400 |
|
|
Dendrite International, Inc. (a) |
3,950 |
104,922 |
|
|
Digex, Inc. Class A |
1,700 |
143,969 |
|
|
Digi International, Inc. (a) |
3,900 |
30,225 |
|
|
Digimarc Corp. |
1,100 |
16,500 |
|
|
Digital Insight Corp. |
1,100 |
29,150 |
|
|
Divine Interventures, Inc. |
7,700 |
69,781 |
|
|
DocuCorp International, Inc. (a) |
20 |
76 |
|
|
|
|||
|
Shares |
Value (Note 1) |
||
|
Documentum, Inc. (a) |
1,600 |
$ 114,500 |
|
|
drkoop.com, Inc. (a) |
16,600 |
24,900 |
|
|
DSET Corp. (a) |
3,600 |
97,425 |
|
|
DSL.net, Inc. |
300 |
1,838 |
|
|
DST Systems, Inc. (a) |
5,010 |
470,940 |
|
|
E.piphany, Inc. |
2,300 |
239,200 |
|
|
EarthLink, Inc. (a) |
7,153 |
80,471 |
|
|
EarthWeb, Inc. (a) |
3,200 |
43,600 |
|
|
eBay, Inc. (a) |
18,100 |
1,122,200 |
|
|
ebenX, Inc. |
1,900 |
39,900 |
|
|
EBT International, Inc. (a) |
3,100 |
18,794 |
|
|
Eclipsys Corp. (a) |
3,105 |
44,634 |
|
|
eCollege.com |
4,000 |
26,500 |
|
|
eFax.com, Inc. (a) |
3,800 |
1,544 |
|
|
eGain Communications Corp. |
5,100 |
66,619 |
|
|
Electric Lightwave, Inc. Class A (a) |
200 |
2,600 |
|
|
Electronic Arts, Inc. (a) |
3,900 |
420,956 |
|
|
Electronic Data Systems Corp. |
32,100 |
1,598,981 |
|
|
Electronics for Imaging, Inc. (a) |
3,900 |
101,400 |
|
|
Eloquent, Inc. |
930 |
4,563 |
|
|
eLOT, Inc. (a) |
10,800 |
19,575 |
|
|
Embarcadero Technologies, Inc. |
300 |
12,600 |
|
|
Engage, Inc. |
10,900 |
154,644 |
|
|
Engineering Animation, Inc. (a) |
3,300 |
36,300 |
|
|
Enlighten Software Solutions, Inc. (a) |
4,000 |
7,750 |
|
|
Entrade, Inc. (a) |
1,600 |
8,000 |
|
|
Entrust Technologies, Inc. (a) |
2,400 |
71,400 |
|
|
Epicor Software Corp. (a) |
438 |
1,766 |
|
|
ePresence, Inc. (a) |
600 |
4,500 |
|
|
Eprise Corp. |
4,700 |
73,144 |
|
|
Equifax, Inc. |
7,600 |
193,325 |
|
|
eShare Technologies, Inc. (a) |
2,500 |
10,000 |
|
|
eSoft, Inc. (a) |
4,600 |
34,500 |
|
|
ESPS, Inc. (a) |
4,100 |
12,044 |
|
|
Etinuum, Inc. |
8,000 |
39,000 |
|
|
EuroWeb International Corp. (a) |
4,200 |
15,225 |
|
|
eXcelon Corp. (a) |
1,500 |
12,094 |
|
|
Exchange Applications, Inc. (a) |
3,300 |
81,056 |
|
|
Exodus Communications, Inc. (a) |
28,500 |
1,950,469 |
|
|
F5 Networks, Inc. (a) |
1,500 |
87,000 |
|
|
FactSet Research Systems, Inc. |
1,700 |
58,119 |
|
|
Fair, Isaac & Co., Inc. |
600 |
27,563 |
|
|
FirePond, Inc. |
1,900 |
39,663 |
|
|
First Data Corp. |
28,400 |
1,354,325 |
|
|
Fiserv, Inc. (a) |
8,600 |
466,013 |
|
|
Fonix corp (a) |
18,900 |
20,081 |
|
|
Fortel, Inc. (a) |
10,000 |
16,875 |
|
|
Foundry Networks, Inc. |
7,900 |
735,194 |
|
|
Frontline Communications Corp. (a) |
1,600 |
2,000 |
|
|
Galileo International, Inc. |
6,000 |
111,750 |
|
|
General Magic, Inc. (a) |
13,500 |
94,922 |
|
|
Genuity, Inc. |
13,500 |
115,931 |
|
|
Geoworks Corp. (a) |
1,000 |
11,438 |
|
|
Go2Net, Inc. (a) |
2,000 |
138,000 |
|
|
Common Stocks - continued |
|||
|
Shares |
Value (Note 1) |
||
|
TECHNOLOGY - continued |
|||
|
Computer Services & Software - continued |
|||
|
GoTo.com, Inc. (a) |
3,500 |
$ 65,188 |
|
|
GraphOn Corp. (a) |
4,300 |
26,875 |
|
|
Great Plains Software, Inc. (a) |
1,700 |
46,219 |
|
|
GRIC Communications, Inc. |
2,000 |
21,063 |
|
|
Health Management Systems, Inc. (a) |
400 |
1,113 |
|
|
Healthcare.com Corp. (a) |
1,800 |
5,738 |
|
|
HealthCentral.com |
4,800 |
21,300 |
|
|
Healtheon/WebMD Corp. (a) |
11,348 |
200,009 |
|
|
HearMe, Inc. (a) |
3,900 |
33,881 |
|
|
High Speed Access Corp. (a) |
5,200 |
29,900 |
|
|
HNC Software, Inc. |
1,200 |
65,288 |
|
|
Homeseekers.com, Inc. (a) |
3,700 |
9,944 |
|
|
Homestore.com, Inc. |
5,100 |
276,356 |
|
|
HotJobs.com Ltd. |
1,200 |
22,875 |
|
|
Hyperion Solutions Corp. (a) |
2,995 |
94,717 |
|
|
i2 Technologies, Inc. (a) |
13,140 |
2,223,124 |
|
|
IDT Corp. (a) |
1,500 |
59,625 |
|
|
IDX Systems Corp. (a) |
900 |
15,300 |
|
|
ImaginOn, Inc. (a) |
1,500 |
1,219 |
|
|
iManage, Inc. |
300 |
3,300 |
|
|
IMR Global Corp. (a) |
950 |
11,281 |
|
|
IMS Health, Inc. |
19,700 |
371,838 |
|
|
Inet Technologies, Inc. (a) |
2,900 |
117,088 |
|
|
InfoCure Corp. (a) |
3,700 |
14,742 |
|
|
Infogrames, Inc. (a) |
600 |
4,463 |
|
|
Infonautics, Inc. (a) |
2,000 |
6,500 |
|
|
Infonet Services Corp. Class B |
20,200 |
263,863 |
|
|
Informatica Corp. (a) |
2,200 |
220,000 |
|
|
Information Architects Corp. (a) |
1,700 |
10,838 |
|
|
Information Management |
5,000 |
78 |
|
|
Informix Corp. (a) |
24,760 |
151,655 |
|
|
Inforte Corp. |
640 |
23,000 |
|
|
InfoSpace.com, Inc. (a) |
15,600 |
608,400 |
|
|
InfoUSA, Inc. (a) |
600 |
3,713 |
|
|
Inktomi Corp. (a) |
7,600 |
990,850 |
|
|
Innodata Corp. (a) |
2,300 |
23,431 |
|
|
Innoveda, Inc. (a) |
1,600 |
6,400 |
|
|
Inprise Corp. (a) |
2,800 |
16,363 |
|
|
insci-statements.com Corp. (a) |
8,200 |
23,063 |
|
|
InteliData Technologies Corp. (a) |
4,800 |
33,300 |
|
|
IntelliCorp, Inc. (a) |
6,100 |
8,388 |
|
|
Intelligroup, Inc. |
2,300 |
5,319 |
|
|
Interactive Intelligence, Inc. |
2,100 |
93,056 |
|
|
InterCept Group, Inc. (a) |
2,500 |
58,125 |
|
|
Interliant, Inc. |
3,200 |
42,400 |
|
|
Internap Network Services Corp. |
8,800 |
316,800 |
|
|
Internet America, Inc. (a) |
4,300 |
16,125 |
|
|
Internet Capital Group, Inc. |
1,800 |
62,775 |
|
|
Internet Commerce Corp. (a) |
600 |
9,225 |
|
|
Internet Security Systems, Inc. (a) |
2,200 |
178,200 |
|
|
|
|||
|
Shares |
Value (Note 1) |
||
|
Internet.com Corp. (a) |
1,200 |
$ 37,800 |
|
|
Intertrust Technologies Corp. |
4,800 |
77,100 |
|
|
InterWorld Corp. |
2,500 |
50,313 |
|
|
Interwoven, Inc. |
3,200 |
307,200 |
|
|
IntraNet Solutions, Inc. (a) |
2,400 |
108,750 |
|
|
Intuit, Inc. (a) |
12,631 |
756,281 |
|
|
iVillage, Inc. (a) |
6,200 |
41,463 |
|
|
iXL Enterprises, Inc. (a) |
4,400 |
42,075 |
|
|
J.D. Edwards & Co. (a) |
6,700 |
166,244 |
|
|
Jack Henry & Associates, Inc. |
4,800 |
213,000 |
|
|
JDA Software Group, Inc. (a) |
3,400 |
43,987 |
|
|
Juno Online Services, Inc. (a) |
5,400 |
33,750 |
|
|
Kana Communications, Inc. |
6,028 |
241,874 |
|
|
Keane, Inc. (a) |
4,000 |
69,250 |
|
|
Keynote Systems, Inc. |
1,600 |
48,400 |
|
|
Landacorp, Inc. |
4,000 |
9,500 |
|
|
Lante Corp. |
2,060 |
19,313 |
|
|
Latitude Communications, Inc. (a) |
2,400 |
21,525 |
|
|
Launch Media, Inc. (a) |
2,600 |
19,663 |
|
|
Learn2.com, Inc. (a) |
2,100 |
5,250 |
|
|
Legato Systems, Inc. (a) |
3,200 |
38,800 |
|
|
Level 8 Systems, Inc. (a) |
1,500 |
30,000 |
|
|
Liberate Technologies |
5,700 |
175,275 |
|
|
Lightning Rod Software, Inc. |
400 |
1,200 |
|
|
Lightspan, Inc. |
2,380 |
8,442 |
|
|
Lionbridge Technologies, Inc. |
3,100 |
29,256 |
|
|
Liquid Audio, Inc. |
4,200 |
29,269 |
|
|
Litronic, Inc. (a) |
2,900 |
15,406 |
|
|
Litton Industries, Inc. (a) |
2,300 |
127,219 |
|
|
Log On America, Inc. (a) |
2,300 |
7,619 |
|
|
LookSmart Ltd. |
5,500 |
92,125 |
|
|
Loudeye Technologies, Inc. |
2,000 |
22,000 |
|
|
Lycos, Inc. (a) |
7,500 |
532,500 |
|
|
Macromedia, Inc. (a) |
3,300 |
228,061 |
|
|
Mail.com, Inc. Class A (a) |
1,700 |
10,731 |
|
|
Manhattan Associates, Inc. (a) |
400 |
18,550 |
|
|
Manugistics Group, Inc. (a) |
2,400 |
210,600 |
|
|
Mapics, Inc. (a) |
700 |
4,200 |
|
|
MapInfo Corp. (a) |
2,550 |
105,825 |
|
|
Marimba, Inc. (a) |
2,500 |
42,188 |
|
|
Marketwatch.com, Inc. (a) |
200 |
2,350 |
|
|
MatrixOne, Inc. |
2,600 |
89,700 |
|
|
McAfee.com Corp. |
2,300 |
60,519 |
|
|
MedCom USA, Inc. (a) |
11,100 |
21,159 |
|
|
Media 100, Inc. (a) |
2,700 |
49,613 |
|
|
MedicaLogic, Inc. |
3,300 |
22,069 |
|
|
Mentor Graphics Corp. (a) |
9,300 |
175,538 |
|
|
Mercator Software, Inc. (a) |
3,100 |
48,438 |
|
|
Mercury Computer Systems, Inc. (a) |
2,600 |
73,694 |
|
|
Mercury Interactive Corp. (a) |
5,000 |
610,938 |
|
|
MessageMedia, Inc. (a) |
5,800 |
20,844 |
|
|
Meta Group, Inc. (a) |
2,450 |
35,525 |
|
|
MetaCreations Corp. (a) |
3,700 |
30,988 |
|
|
Metasolv Software, Inc. |
1,300 |
53,138 |
|
|
Common Stocks - continued |
|||
|
Shares |
Value (Note 1) |
||
|
TECHNOLOGY - continued |
|||
|
Computer Services & Software - continued |
|||
|
MicroAge, Inc. (a) |
11,000 |
$ 1,375 |
|
|
Micromuse, Inc. (a) |
2,000 |
303,750 |
|
|
Microsoft Corp. (a) |
366,905 |
25,614,555 |
|
|
MicroStrategy, Inc. Class A (a) |
3,300 |
91,988 |
|
|
Microware Systems Corp. (a) |
5,500 |
10,313 |
|
|
Midway Games, Inc. (a) |
239 |
2,061 |
|
|
Momentum Business Applications Inc (a) |
52 |
543 |
|
|
MP3.com, Inc. |
2,900 |
23,925 |
|
|
Multex.com, Inc. (a) |
2,900 |
63,075 |
|
|
MyTurn.com, Inc. (a) |
2,500 |
26,563 |
|
|
National Computer Systems, Inc. |
4,100 |
297,763 |
|
|
National Data Corp. |
1,600 |
47,000 |
|
|
National Information Consortium, Inc. |
3,500 |
33,250 |
|
|
National Instrument Corp. (a) |
3,150 |
136,041 |
|
|
Navidec, Inc. (a) |
3,100 |
25,769 |
|
|
NaviSite, Inc. |
3,600 |
173,250 |
|
|
NCR Corp. (a) |
5,900 |
238,213 |
|
|
NEON Systems, Inc. (a) |
900 |
15,131 |
|
|
Net Perceptions, Inc. (a) |
1,600 |
22,700 |
|
|
Net.Genesis Corp. |
300 |
2,513 |
|
|
Netcentives, Inc. |
1,500 |
14,438 |
|
|
Netegrity, Inc. (a) |
1,200 |
105,600 |
|
|
Netguru, Inc. (a) |
1,800 |
32,175 |
|
|
NetIQ Corp. |
2,288 |
129,272 |
|
|
NetManage, Inc. (a) |
8,200 |
23,319 |
|
|
NetObjects, Inc. (a) |
3,300 |
11,963 |
|
|
Netplex Group, Inc. (a) |
3,800 |
4,988 |
|
|
NETRIX Corp. (a) |
600 |
4,350 |
|
|
Netsol International, Inc. (a) |
100 |
2,600 |
|
|
NetSolve, Inc. |
1,900 |
16,863 |
|
|
NetSpeak Corp. (a) |
3,000 |
36,000 |
|
|
Network Engines, Inc. |
2,300 |
89,988 |
|
|
Network Peripherals, Inc. (a) |
3,300 |
47,438 |
|
|
Network-1 Security Solutions, Inc. (a) |
2,100 |
14,438 |
|
|
Networks Associates, Inc. (a) |
6,961 |
180,116 |
|
|
NetZero, Inc. |
6,400 |
27,000 |
|
|
New Era of Networks, Inc. (a) |
4,000 |
140,250 |
|
|
Niku Corp. |
100 |
2,706 |
|
|
Novell, Inc. (a) |
23,100 |
282,975 |
|
|
Nuance Communications, Inc. |
2,000 |
263,250 |
|
|
Numerical Technologies, Inc. |
1,000 |
39,125 |
|
|
NYFIX, Inc. (a) |
300 |
11,250 |
|
|
Objective Systems Integrators, Inc. (a) |
4,700 |
63,156 |
|
|
Omega Research, Inc. (a) |
1,200 |
3,600 |
|
|
ON Technology Corp. (a) |
3,000 |
7,688 |
|
|
OneMain.com, Inc. (a) |
4,000 |
39,438 |
|
|
OneSource Information Services, Inc. (a) |
3,500 |
41,563 |
|
|
OnHealth Network Co. (a) |
1,100 |
3,472 |
|
|
ONYX Software Corp. (a) |
3,500 |
79,406 |
|
|
Open Market, Inc. (a) |
6,100 |
51,469 |
|
|
OpenTV Corp. |
723 |
40,127 |
|
|
|
|||
|
Shares |
Value (Note 1) |
||
|
Optika, Inc. (a) |
1,900 |
$ 7,838 |
|
|
Optio Software, Inc. |
3,000 |
9,375 |
|
|
Oracle Corp. (a) |
197,600 |
17,969,250 |
|
|
Osage Systems Group, Inc. (a) |
4,500 |
6,188 |
|
|
OTG Software, Inc. |
1,400 |
31,325 |
|
|
Packeteer, Inc. |
1,600 |
77,000 |
|
|
Parametric Technology Corp. (a) |
19,000 |
254,125 |
|
|
Paychex, Inc. |
26,075 |
1,163,597 |
|
|
PC-Tel, Inc. |
1,900 |
53,200 |
|
|
pcOrder.com, Inc. (a) |
3,100 |
16,372 |
|
|
Peerless Systems Corp. (a) |
200 |
263 |
|
|
Pegasus Solutions, Inc. (a) |
3,050 |
60,619 |
|
|
Pegasystems, Inc. (a) |
100 |
438 |
|
|
PeopleSoft, Inc. (a) |
16,940 |
546,315 |
|
|
Peregrine Systems, Inc. (a) |
7,662 |
244,705 |
|
|
Peritus Software Services, Inc. (a) |
900 |
153 |
|
|
Perot Systems Corp. (a) |
4,700 |
48,763 |
|
|
Persistence Software, Inc. (a) |
700 |
11,900 |
|
|
Pervasive Software, Inc. (a) |
6,200 |
20,344 |
|
|
Pfsweb, Inc. |
9,421 |
25,908 |
|
|
Pharmacopeia, Inc. (a) |
2,800 |
117,425 |
|
|
Phoenix Technologies Ltd. (a) |
3,000 |
51,750 |
|
|
Phone.com, Inc. (a) |
5,300 |
489,919 |
|
|
Pilot Network Services, Inc. (a) |
4,400 |
58,300 |
|
|
Policy Management Systems Corp. (a) |
1,700 |
22,950 |
|
|
Polycom, Inc. (a) |
2,000 |
224,750 |
|
|
Portal Software, Inc. (a) |
11,300 |
624,325 |
|
|
PowerCerv Corp. (a) |
6,100 |
7,434 |
|
|
Preview Systems, Inc. |
700 |
6,081 |
|
|
Previo, Inc. (a) |
25 |
163 |
|
|
Priceline.com, Inc. (a) |
11,400 |
309,938 |
|
|
Primix Solutions, Inc. (a) |
3,500 |
9,625 |
|
|
Primus Knowledge Solutions, Inc. |
800 |
18,850 |
|
|
Prodigy Communications Corp. |
3,620 |
27,263 |
|
|
Progress Software Corp. (a) |
4,000 |
54,750 |
|
|
Promotions.com, Inc. |
2,400 |
9,300 |
|
|
Proxicom, Inc. (a) |
3,600 |
87,075 |
|
|
PSINet, Inc. (a) |
13,676 |
240,185 |
|
|
Puma Technology, Inc. (a) |
3,800 |
92,388 |
|
|
PurchasePro.com, Inc. |
2,300 |
132,897 |
|
|
QRS Corp. (a) |
1,450 |
26,553 |
|
|
Quadramed Corp. (a) |
6,500 |
10,969 |
|
|
quepasa.com, Inc. (a) |
4,700 |
5,581 |
|
|
Quest Software, Inc. |
4,900 |
252,963 |
|
|
Quintus Corp. |
1,765 |
23,055 |
|
|
Quokka Sports, Inc. |
1,200 |
8,250 |
|
|
Radiant Systems, Inc. (a) |
2,700 |
46,238 |
|
|
Rainbow Technologies, Inc. (a) |
2,550 |
101,044 |
|
|
Ramp Networks, Inc. (a) |
3,700 |
18,963 |
|
|
Rare Medium Group, Inc. (a) |
3,500 |
35,000 |
|
|
Rational Software Corp. (a) |
6,000 |
772,125 |
|
|
RAVISENT Technologies, Inc. |
4,700 |
20,563 |
|
|
Razorfish, Inc. Class A (a) |
5,850 |
73,856 |
|
|
Common Stocks - continued |
|||
|
Shares |
Value (Note 1) |
||
|
TECHNOLOGY - continued |
|||
|
Computer Services & Software - continued |
|||
|
RealNetworks, Inc. (a) |
10,500 |
$ 511,219 |
|
|
Red Hat, Inc. |
9,900 |
248,738 |
|
|
Redback Networks, Inc. (a) |
9,800 |
1,463,875 |
|
|
Remedy Corp. (a) |
2,200 |
51,425 |
|
|
Resonate, Inc. |
1,900 |
83,719 |
|
|
Retek, Inc. |
1,600 |
55,100 |
|
|
Rogue Wave Software, Inc. (a) |
4,700 |
31,725 |
|
|
S1 Corp. (a) |
3,195 |
55,713 |
|
|
Saba Software, Inc. |
2,400 |
68,700 |
|
|
Sabre Holdings Corp. Class A |
6,869 |
191,473 |
|
|
Sagent Technology, Inc. (a) |
6,400 |
68,000 |
|
|
Salon.com, Inc. (a) |
5,600 |
11,025 |
|
|
Sanchez Computer Associates, Inc. (a) |
1,300 |
27,788 |
|
|
Santa Cruz Operation, Inc. (a) |
4,300 |
19,888 |
|
|
Sapient Corp. (a) |
7,400 |
388,500 |
|
|
Savvis Communications Corp. |
5,080 |
44,768 |
|
|
Scient Corp. |
4,900 |
132,606 |
|
|
SciQuest.com, Inc. |
700 |
6,738 |
|
|
SeaChange International, Inc. (a) |
2,250 |
67,500 |
|
|
Secure Computing Corp. (a) |
4,000 |
99,750 |
|
|
Segue Software, Inc. (a) |
1,900 |
15,556 |
|
|
SEI Investments Co. |
5,700 |
361,950 |
|
|
Selectica, Inc. |
1,100 |
52,456 |
|
|
Sema Group PLC sponsored ADR (a) |
2,210 |
81,494 |
|
|
Sequoia Software Corp. |
5,100 |
57,375 |
|
|
Seranova, Inc. (a) |
2,300 |
19,694 |
|
|
SERENA Software, Inc. (a) |
700 |
30,800 |
|
|
ShowCase Corp. |
5,000 |
36,250 |
|
|
Siebel Systems, Inc. (a) |
13,590 |
2,688,272 |
|
|
SignalSoft Corp. |
1,600 |
79,300 |
|
|
SilverStream Software, Inc. |
1,300 |
45,175 |
|
|
SmarterKids.com, Inc. |
5,000 |
7,500 |
|
|
SmartServ Online, Inc. (a) |
900 |
33,131 |
|
|
Smith Micro Software, Inc. (a) |
5,500 |
26,125 |
|
|
Smith-Gardner & Assocs, Inc. (a) |
2,900 |
11,600 |
|
|
SoftNet Systems, Inc. (a) |
2,400 |
16,650 |
|
|
Software Spectrum, Inc. (a) |
3,700 |
48,100 |
|
|
Software Technologies Corp. |
3,000 |
58,500 |
|
|
Software.com, Inc. (a) |
3,200 |
465,800 |
|
|
Sonic Foundry, Inc. (a) |
1,800 |
16,763 |
|
|
Sonic Solutions, Inc. (a) |
3,800 |
10,925 |
|
|
Sonus Networks, Inc. |
100 |
16,638 |
|
|
SpeedUs.com (a) |
6,300 |
22,247 |
|
|
Sportsline.com, Inc. (a) |
1,000 |
17,688 |
|
|
SPSS, Inc. (a) |
100 |
2,788 |
|
|
StarBase Corp. (a) |
4,200 |
28,350 |
|
|
StarMedia Network, Inc. (a) |
3,700 |
31,450 |
|
|
StorageNetworks, Inc. |
2,100 |
213,150 |
|
|
Structural Dynamics Research Corp. (a) |
5,900 |
95,138 |
|
|
SunGard Data Systems, Inc. (a) |
8,668 |
312,048 |
|
|
Support.com, Inc. |
2,300 |
71,336 |
|
|
|
|||
|
Shares |
Value (Note 1) |
||
|
Sybase, Inc. (a) |
7,900 |
$ 216,756 |
|
|
Sykes Enterprises, Inc. (a) |
6,200 |
87,188 |
|
|
Symantec Corp. (a) |
3,100 |
151,319 |
|
|
Synopsys, Inc. (a) |
4,665 |
172,897 |
|
|
Syntel, Inc. (a) |
1,400 |
13,125 |
|
|
Systems & Computer |
3,800 |
68,163 |
|
|
Take-Two Interactive Software, Inc. (a) |
8,800 |
121,963 |
|
|
Talarian Corp. |
5,300 |
97,388 |
|
|
Talk Visual Corp. (a) |
11,900 |
5,474 |
|
|
TCSI Corp. (a) |
8,300 |
15,044 |
|
|
Technology Solutions, Inc. |
8,650 |
26,761 |
|
|
Telescan, Inc. (a) |
1,100 |
5,294 |
|
|
TenFold Corp. (a) |
400 |
2,700 |
|
|
The Bisys Group (a) |
3,700 |
278,656 |
|
|
The Cobalt Group, Inc. |
2,800 |
14,525 |
|
|
The viaLink Co. (a) |
2,400 |
22,800 |
|
|
theglobe.com, Inc. (a) |
6,500 |
9,039 |
|
|
TheStreet.Com, Inc. (a) |
3,700 |
32,838 |
|
|
TIBCO Software, Inc. |
14,000 |
1,427,125 |
|
|
Tier Technologies, Inc. (a) |
7,500 |
48,750 |
|
|
Timberline Software Corp. |
354 |
2,213 |
|
|
Titan Corp. (a) |
2,974 |
73,235 |
|
|
Track Data Corp. (a) |
8,300 |
15,822 |
|
|
Transaction Systems Architects, Inc. |
2,000 |
36,750 |
|
|
Travelocity.com, Inc. (a) |
1,300 |
17,875 |
|
|
TREEV, Inc. (a) |
7,700 |
51,975 |
|
|
TSR, Inc. (a) |
100 |
531 |
|
|
Tumbleweed Communications Corp. |
1,858 |
116,357 |
|
|
Ulticom, Inc. |
1,300 |
77,025 |
|
|
Unicomp, Inc. (a) |
4,900 |
6,738 |
|
|
Unify Corp. (a) |
2,000 |
7,875 |
|
|
Unisys Corp. (a) |
16,500 |
214,500 |
|
|
US Interactive, Inc. |
1,900 |
14,844 |
|
|
Usinternetworking, Inc. (a) |
5,975 |
61,617 |
|
|
USSEARCH.com, Inc. (a) |
4,800 |
8,250 |
|
|
V-One Corp. (a) |
5,900 |
16,963 |
|
|
VA Linux Systems, Inc. |
2,807 |
154,385 |
|
|
ValueClick, Inc. |
900 |
10,350 |
|
|
VelocityHSI, Inc. (a) |
520 |
1,820 |
|
|
Verilink Corp. (a) |
3,400 |
26,988 |
|
|
VeriSign, Inc. (a) |
13,382 |
2,661,345 |
|
|
VERITAS Software Corp. (a) |
26,725 |
3,222,033 |
|
|
Verity, Inc. (a) |
800 |
36,600 |
|
|
Versant Corp. (a) |
3,200 |
16,200 |
|
|
Versata, Inc. |
1,800 |
44,888 |
|
|
Vertel Corp. (a) |
5,700 |
73,388 |
|
|
VerticalNet, Inc. (a) |
5,400 |
287,550 |
|
|
Via Net.Works, Inc. |
2,930 |
37,907 |
|
|
Viant Corp. (a) |
3,300 |
45,788 |
|
|
Vignette Corp. (a) |
14,586 |
556,091 |
|
|
VirtualFund.com, Inc. (a) |
4,900 |
10,106 |
|
|
Visual Data Corp. (a) |
3,100 |
10,463 |
|
|
Common Stocks - continued |
|||
|
Shares |
Value (Note 1) |
||
|
TECHNOLOGY - continued |
|||
|
Computer Services & Software - continued |
|||
|
Visual Networks, Inc. (a) |
6,100 |
$ 49,181 |
|
|
Vitria Technology, Inc. |
8,600 |
404,200 |
|
|
Voyager.net, Inc. |
600 |
4,163 |
|
|
Walker Interactive Systems, Inc. (a) |
4,600 |
17,825 |
|
|
WatchGuard Technologies, Inc. |
1,900 |
93,338 |
|
|
Wave Systems Corp. Class A (a) |
2,100 |
43,313 |
|
|
Wavo Corp. (a) |
1,300 |
934 |
|
|
Webb Interactive Services, Inc. (a) |
4,400 |
41,250 |
|
|
WebEx Communications, Inc. |
2,500 |
138,438 |
|
|
webMethods, Inc. |
3,251 |
349,279 |
|
|
WebTrends Corp. (a) |
1,500 |
56,508 |
|
|
Wind River Systems, Inc. (a) |
3,250 |
132,438 |
|
|
Wink Communications, Inc. |
200 |
3,325 |
|
|
Witness Systems, Inc. |
1,170 |
23,254 |
|
|
WorldGate Communications, Inc. (a) |
1,300 |
25,675 |
|
|
XCare.net, Inc. |
840 |
4,200 |
|
|
Xceed, Inc. (a) |
1,800 |
13,725 |
|
|
Xpedior, Inc. |
2,600 |
27,950 |
|
|
Xybernaut Corp. (a) |
2,100 |
16,275 |
|
|
Yahoo!, Inc. (a) |
37,834 |
4,596,831 |
|
|
Zamba Corp. (a) |
3,800 |
22,800 |
|
|
ZapMe! Corp. |
5,700 |
13,894 |
|
|
ZeroPlus.com, Inc. (a) |
3,800 |
8,313 |
|
|
|
132,879,858 |
||
|
Computers & Office Equipment - 7.7% |
|||
|
Adaptec, Inc. (a) |
5,500 |
134,750 |
|
|
Advanced Digital Information Corp. (a) |
7,800 |
132,600 |
|
|
Alpha Microsystems (a) |
5,500 |
22,000 |
|
|
Alteon Websystems, Inc. |
2,500 |
370,000 |
|
|
Apple Computer, Inc. (a) |
21,700 |
1,322,344 |
|
|
Applied Digital Solutions, Inc. (a) |
11,100 |
45,094 |
|
|
Ariel Corp. (a) |
14,100 |
43,622 |
|
|
Aspeon, Inc. (a) |
2,900 |
10,331 |
|
|
Auspex Systems, Inc. |
800 |
7,000 |
|
|
Avici Systems, Inc. |
3,900 |
584,269 |
|
|
Brocade Communications |
8,100 |
1,829,081 |
|
|
CacheFlow, Inc. |
2,300 |
251,563 |
|
|
CDW Computer Centers, Inc. (a) |
6,000 |
441,000 |
|
|
Comdisco, Inc. |
8,600 |
206,400 |
|
|
Communication Intelligence Corp. (a) |
3,900 |
13,163 |
|
|
Compaq Computer Corp. |
116,861 |
3,980,578 |
|
|
Computer Network Technology Corp. (a) |
1,300 |
26,000 |
|
|
Concurrent Computer Corp. (a) |
3,700 |
63,363 |
|
|
Copper Mountain Networks, Inc. (a) |
3,100 |
185,806 |
|
|
Cray, Inc. (a) |
16,700 |
98,634 |
|
|
Crossroads Systems, Inc. |
8,000 |
90,000 |
|
|
Dataram Corp. (a) |
3,250 |
106,031 |
|
|
Datawatch Corp. (a) |
5,200 |
9,425 |
|
|
Dell Computer Corp. (a) |
178,700 |
7,795,788 |
|
|
Diebold, Inc. |
6,900 |
194,925 |
|
|
|
|||
|
Shares |
Value (Note 1) |
||
|
Digital Lightwave, Inc. (a) |
1,871 |
$ 164,180 |
|
|
Digital River, Inc. (a) |
6,900 |
47,438 |
|
|
Dot Hill Systems Corp. (a) |
300 |
2,663 |
|
|
ECCS, Inc. (a) |
2,600 |
9,588 |
|
|
Echelon Corp. (a) |
2,900 |
136,481 |
|
|
Emachines ltd. |
8,200 |
16,400 |
|
|
EMC Corp. (a) |
152,150 |
14,910,700 |
|
|
Emulex Corp. (a) |
2,800 |
293,125 |
|
|
En Pointe Technologies, Inc. (a) |
1,400 |
10,500 |
|
|
Encad, Inc. (a) |
300 |
938 |
|
|
Equinox Systems, Inc. (a) |
3,300 |
18,253 |
|
|
Exabyte Corp. (a) |
100 |
600 |
|
|
Extended Systems, Inc. (a) |
500 |
22,938 |
|
|
Extreme Networks, Inc. (a) |
8,200 |
763,113 |
|
|
FileNET Corp. (a) |
1,000 |
19,250 |
|
|
Finisar Corp. |
8,200 |
380,275 |
|
|
FOCUS Enhancements, Inc. (a) |
5,600 |
9,100 |
|
|
FVC.com, Inc. (a) |
1,000 |
7,063 |
|
|
Gadzoox Networks, Inc. |
5,700 |
51,656 |
|
|
Gateway, Inc. (a) |
21,600 |
1,470,960 |
|
|
Globix Corp. (a) |
1,900 |
50,944 |
|
|
GoAmerica, Inc. (a) |
2,100 |
22,969 |
|
|
Hauppauge Digital, Inc. (a) |
500 |
4,750 |
|
|
Hewlett-Packard Co. |
71,552 |
8,639,904 |
|
|
HMT Technology Corp. (a) |
1,200 |
2,962 |
|
|
Hunt Corp. |
300 |
2,700 |
|
|
Hutchinson Technology, Inc. (a) |
5,300 |
125,875 |
|
|
Imation Corp. (a) |
3,000 |
66,750 |
|
|
Ingram Micro, Inc. Class A (a) |
4,300 |
64,500 |
|
|
Insight Enterprises, Inc. (a) |
1,850 |
92,963 |
|
|
Intergraph Corp. (a) |
1,500 |
9,000 |
|
|
Interlink Electronics, Inc. (a) |
1,200 |
31,050 |
|
|
International Business Machines Corp. |
123,400 |
16,288,800 |
|
|
Interphase Corp. (a) |
4,100 |
84,563 |
|
|
Intraware, Inc. (a) |
1,200 |
12,600 |
|
|
Intrusion.com, Inc. (a) |
3,700 |
55,038 |
|
|
Iomega Corp. (a) |
8,100 |
33,413 |
|
|
ION Networks, Inc. (a) |
2,400 |
9,000 |
|
|
Itron, Inc. (a) |
600 |
3,600 |
|
|
JNI Corp. |
1,600 |
107,400 |
|
|
Juniper Networks, Inc. (a) |
21,800 |
4,659,750 |
|
|
Komag, Inc. (a) |
1,500 |
4,031 |
|
|
Kronos, Inc. (a) |
2,900 |
108,388 |
|
|
Lexmark International Group, Inc. |
7,900 |
535,719 |
|
|
Maxtor Corp. (a) |
6,500 |
50,984 |
|
|
Micron Electronics, Inc. (a) |
10,500 |
145,031 |
|
|
MICROS Systems, Inc. (a) |
1,800 |
31,613 |
|
|
Mitek Systems, Inc. (a) |
3,900 |
23,644 |
|
|
MMC Networks, Inc. (a) |
2,700 |
328,894 |
|
|
MRV Communications, Inc. (a) |
3,300 |
254,306 |
|
|
MTI Technology Corp. (a) |
3,200 |
20,200 |
|
|
Neoware Systems, Inc. (a) |
5,600 |
20,650 |
|
|
Netopia, Inc. (a) |
1,000 |
36,625 |
|
|
Common Stocks - continued |
|||
|
Shares |
Value (Note 1) |
||
|
TECHNOLOGY - continued |
|||
|
Computers & Office Equipment - continued |
|||
|
Netpliance, Inc. |
3,400 |
$ 18,063 |
|
|
Network Appliance, Inc. (a) |
20,700 |
2,421,900 |
|
|
Oak Technology, Inc. (a) |
2,200 |
64,075 |
|
|
ObjectSoft Corp. (a) |
4,483 |
5,183 |
|
|
Palm, Inc. |
38,050 |
1,674,200 |
|
|
Paradyne Networks, Inc. |
3,300 |
70,744 |
|
|
Performance Technologies, Inc. (a) |
2,900 |
40,238 |
|
|
Pitney Bowes, Inc. |
16,500 |
603,281 |
|
|
Planar Systems, Inc. (a) |
600 |
11,100 |
|
|
Pomeroy Computer Resources, Inc. (a) |
200 |
4,650 |
|
|
Procom Technology, Inc. (a) |
2,300 |
110,975 |
|
|
Programmer's Paradise, Inc. (a) |
1,200 |
4,350 |
|
|
Proxim, Inc. (a) |
1,400 |
84,088 |
|
|
Quantum Corp.: |
|
|
|
|
DLT & Storage Systems Group (a) |
6,726 |
91,221 |
|
|
Hard Disk Drive Group (a) |
9,413 |
91,777 |
|
|
RadiSys Corp. (a) |
2,200 |
123,063 |
|
|
Read-Rite Corp. (a) |
19,000 |
171,594 |
|
|
RSA Security, Inc. (a) |
1,900 |
112,219 |
|
|
Safeguard Scientifics, Inc. (a) |
7,800 |
222,788 |
|
|
SanDisk Corp. (a) |
3,900 |
325,650 |
|
|
SBS Technologies, Inc. (a) |
2,600 |
134,063 |
|
|
Scan-Optics, Inc. (a) |
300 |
253 |
|
|
ScanSoft, Inc. (a) |
8,633 |
21,043 |
|
|
ScanSource, Inc. (a) |
1,500 |
89,906 |
|
|
SCI Systems, Inc. (a) |
9,200 |
568,100 |
|
|
SCM Microsystems, Inc. (a) |
600 |
32,663 |
|
|
Seagate Technology, Inc. (a) |
14,700 |
872,813 |
|
|
SED International Holdings, Inc. (a) |
100 |
325 |
|
|
Silicon Graphics, Inc. |
29,800 |
139,688 |
|
|
Splash Technology Holdings, Inc. (a) |
5,100 |
46,059 |
|
|
Sun Microsystems, Inc. (a) |
110,320 |
14,003,745 |
|
|
Symbol Technologies, Inc. |
8,275 |
342,378 |
|
|
Syquest Technology, Inc. (a) |
1,100 |
2 |
|
|
Tech Data Corp. (a) |
3,900 |
201,338 |
|
|
Telxon Corp. (a) |
2,000 |
39,500 |
|
|
The Sedona Corp. (a) |
6,200 |
15,500 |
|
|
Tidel Technologies, Inc. (a) |
7,800 |
61,913 |
|
|
Trident Microsystems, Inc. (a) |
500 |
5,844 |
|
|
UniView Technologies Corp. (a) |
6,700 |
21,775 |
|
|
Valence Technology, Inc. (a) |
3,400 |
57,588 |
|
|
Western Digital Corp. (a) |
7,800 |
45,825 |
|
|
Xerox Corp. |
43,200 |
693,900 |
|
|
Zebra Technologies Corp.: |
|
|
|
|
Class A (a) |
3,500 |
189,000 |
|
|
Class B |
180 |
9,720 |
|
|
|
92,071,704 |
||
|
Electronic Instruments - 1.3% |
|||
|
Aclara Biosciences, Inc. |
1,800 |
70,200 |
|
|
Aeroflex, Inc. (a) |
1,250 |
45,938 |
|
|
|
|||
|
Shares |
Value (Note 1) |
||
|
Agilent Technologies, Inc. |
30,570 |
$ 1,843,753 |
|
|
Anadigics, Inc. (a) |
2,050 |
73,800 |
|
|
Analogic Corp. |
400 |
15,000 |
|
|
APA Optics, Inc. (a) |
4,900 |
88,200 |
|
|
Applied Materials, Inc. (a) |
55,557 |
4,795,264 |
|
|
Aurora Biosciences Corp. (a) |
1,400 |
95,725 |
|
|
Barringer Technologies, Inc. (a) |
300 |
2,813 |
|
|
Beckman Coulter, Inc. |
4,200 |
319,725 |
|
|
Bruker Daltonics, Inc. |
3,800 |
190,950 |
|
|
Caliper Technologies Corp. |
1,100 |
68,338 |
|
|
Cerprobe Corp. (a) |
100 |
1,700 |
|
|
Cholestech Corp. (a) |
100 |
744 |
|
|
Chromatics Color Sciences |
500 |
906 |
|
|
Cognex Corp. (a) |
4,200 |
168,000 |
|
|
Cohu, Inc. |
3,000 |
61,500 |
|
|
Credence Systems Corp. (a) |
2,800 |
163,975 |
|
|
Electro Scientific Industries, Inc. (a) |
1,900 |
78,256 |
|
|
FEI Co. (a) |
400 |
12,050 |
|
|
Fisher Scientific International, Inc. (a) |
1,000 |
21,938 |
|
|
Genomic Solutions, Inc. |
4,600 |
73,313 |
|
|
Hathaway Corp. (a) |
4,200 |
31,500 |
|
|
Helix Technology, Inc. |
2,700 |
102,263 |
|
|
II-VI, Inc. (a) |
2,817 |
151,414 |
|
|
Illumina, Inc. |
2,200 |
98,450 |
|
|
Keithley Instruments, Inc. |
2,000 |
151,875 |
|
|
KLA-Tencor Corp. (a) |
12,100 |
794,063 |
|
|
Kulicke & Soffa Industries, Inc. (a) |
3,400 |
61,838 |
|
|
LAM Research Corp. (a) |
7,000 |
210,875 |
|
|
LTX Corp. (a) |
2,600 |
66,463 |
|
|
Luminex Corp. |
1,600 |
64,000 |
|
|
Meade Instruments Corp. (a) |
2,600 |
62,400 |
|
|
Mechanical Technology, Inc. (a) |
4,500 |
50,906 |
|
|
Molecular Devices Corp. (a) |
1,600 |
132,500 |
|
|
Nanometrics, Inc. (a) |
1,400 |
69,650 |
|
|
Newport Corp. |
1,800 |
286,200 |
|
|
Novellus Systems, Inc. (a) |
7,900 |
486,344 |
|
|
Packard BioScience Co. |
2,400 |
47,700 |
|
|
PE Corp. - Biosystems Group |
14,076 |
1,384,727 |
|
|
PerkinElmer, Inc. |
2,500 |
224,844 |
|
|
Photon Dynamics, Inc. (a) |
2,500 |
117,344 |
|
|
Precision Optics Corp., Inc. (a) |
4,000 |
50,000 |
|
|
Reliability, Inc. (a) |
100 |
344 |
|
|
Rudolph Technologies, Inc. |
2,100 |
84,000 |
|
|
Sawtek, Inc. (a) |
2,300 |
116,006 |
|
|
Sequenom, Inc. |
3,040 |
91,580 |
|
|
Silicon Valley Group, Inc. (a) |
600 |
16,725 |
|
|
Sunrise Telecom, Inc. |
3,400 |
152,788 |
|
|
Tektronix, Inc. |
2,600 |
198,088 |
|
|
Teradyne, Inc. (a) |
11,400 |
738,863 |
|
|
Therma-Wave, Inc. |
1,200 |
32,550 |
|
|
Thermo Electron Corp. (a) |
12,370 |
287,603 |
|
|
Transgenomic, Inc. |
2,000 |
42,000 |
|
|
Trimble Navigation Ltd. (a) |
3,200 |
133,000 |
|
|
Common Stocks - continued |
|||
|
Shares |
Value (Note 1) |
||
|
TECHNOLOGY - continued |
|||
|
Electronic Instruments - continued |
|||
|
Varian, Inc. (a) |
3,900 |
$ 190,125 |
|
|
Waters Corp. (a) |
8,400 |
668,325 |
|
|
Zygo Corp. (a) |
1,900 |
150,813 |
|
|
|
15,740,254 |
||
|
Electronics - 8.4% |
|||
|
3Dfx Interactive, Inc. (a) |
7,092 |
32,357 |
|
|
Act Manufacturing, Inc. (a) |
3,300 |
168,094 |
|
|
Actel Corp. (a) |
1,600 |
70,400 |
|
|
Advanced Energy Industries, Inc. (a) |
1,000 |
57,125 |
|
|
Advanced Micro Devices, Inc. (a) |
19,600 |
737,450 |
|
|
ALL American Semiconductor, Inc. (a) |
3,900 |
72,150 |
|
|
Alliance Semiconductor Corp. (a) |
2,900 |
76,306 |
|
|
Alpine Group, Inc. (a) |
5,000 |
29,063 |
|
|
Altera Corp. (a) |
26,400 |
1,711,050 |
|
|
Amkor Technology, Inc. (a) |
8,100 |
276,413 |
|
|
Amphenol Corp. Class A (a) |
4,200 |
268,800 |
|
|
Analog Devices, Inc. (a) |
23,800 |
2,391,900 |
|
|
Applied Micro Circuits Corp. (a) |
8,100 |
1,643,794 |
|
|
Applied Science & Technology, Inc. (a) |
4,200 |
64,838 |
|
|
Arrow Electronics, Inc. (a) |
4,800 |
174,600 |
|
|
Artesyn Technologies, Inc. (a) |
5,800 |
241,063 |
|
|
AstroPower, Inc. (a) |
2,700 |
92,813 |
|
|
Atmel Corp. (a) |
26,800 |
536,000 |
|
|
Audiovox Corp. Class A (a) |
1,600 |
29,000 |
|
|
Avnet, Inc. |
2,869 |
171,781 |
|
|
AVX Corp. |
10,300 |
308,356 |
|
|
AXT, Inc. (a) |
1,000 |
38,625 |
|
|
BEI Technologies, Inc. |
2,400 |
137,250 |
|
|
Bel Fuse, Inc. Class A (a) |
100 |
3,475 |
|
|
Benchmark Electronics, Inc. (a) |
100 |
5,206 |
|
|
Blue Wave Systems, Inc. (a) |
3,900 |
24,131 |
|
|
Brightpoint, Inc. (a) |
5,600 |
35,350 |
|
|
Broadcom Corp. Class A (a) |
15,500 |
3,875,000 |
|
|
California Micro Devices Corp. (a) |
3,400 |
85,850 |
|
|
Celeritek, Inc. (a) |
2,800 |
125,650 |
|
|
Centillium Communications, Inc. |
1,600 |
119,200 |
|
|
ChipPac, Inc. |
4,600 |
83,950 |
|
|
Cidco, Inc. (a) |
6,700 |
23,659 |
|
|
Cirrus Logic, Inc. (a) |
8,100 |
245,025 |
|
|
Conductus, Inc. (a) |
3,900 |
75,623 |
|
|
Conexant Systems, Inc. (a) |
13,218 |
491,544 |
|
|
Conolog Corp. (a) |
5,700 |
8,550 |
|
|
Cree, Inc. (a) |
1,700 |
234,175 |
|
|
CTS Corp. |
3,300 |
169,331 |
|
|
Cypress Semiconductor Corp. (a) |
6,700 |
331,231 |
|
|
Dallas Semiconductor Corp. |
4,600 |
190,325 |
|
|
DDi Corp. |
1,000 |
38,125 |
|
|
Dense-Pac Microsystems, Inc (a) |
5,500 |
35,750 |
|
|
DMC Stratex Networks, Inc. (a) |
4,015 |
102,633 |
|
|
Elantec Semiconductor, Inc. (a) |
1,400 |
123,900 |
|
|
Electroglas, Inc. (a) |
5,200 |
116,675 |
|
|
|
|||
|
Shares |
Value (Note 1) |
||
|
ESS Technology, Inc. (a) |
1,300 |
$ 22,506 |
|
|
Exar Corp. |
2,100 |
253,313 |
|
|
Ezenia!, Inc. (a) |
200 |
775 |
|
|
Fairchild Semiconduct International, Inc. Class A |
3,700 |
147,075 |
|
|
Gatefield Corp. (a) |
20 |
95 |
|
|
General Semiconductor, Inc. (a) |
6,800 |
99,025 |
|
|
GlobeSpan, Inc. (a) |
4,900 |
590,144 |
|
|
Harmonic, Inc. (a) |
5,822 |
195,037 |
|
|
Hi/fn, Inc. |
2,425 |
153,988 |
|
|
Illinois Superconductor Corp. (a) |
1,800 |
5,625 |
|
|
Innovex, Inc. |
600 |
9,000 |
|
|
Insilicon Corp. |
4,800 |
97,800 |
|
|
Integrated Circuit Systems, Inc. |
1,000 |
27,500 |
|
|
Integrated Device Technology, Inc. (a) |
5,300 |
465,075 |
|
|
Integrated Silicon Solution (a) |
1,800 |
52,875 |
|
|
Intel Corp. |
469,478 |
35,152,165 |
|
|
International Rectifier Corp. (a) |
3,100 |
195,106 |
|
|
Intersil Holding Corp. Class A |
1,840 |
99,360 |
|
|
Irvine Sensors Corp. (a) |
8,700 |
27,459 |
|
|
IXYS Corp. (a) |
3,800 |
152,950 |
|
|
Jaco Electronics, Inc. (a) |
4,050 |
73,976 |
|
|
JDS Uniphase Corp. (a) |
64,554 |
8,035,965 |
|
|
KEMET Corp. (a) |
5,200 |
156,000 |
|
|
Kent Electronics Corp. (a) |
900 |
26,325 |
|
|
Kopin Corp. (a) |
4,400 |
147,125 |
|
|
Lattice Semiconductor Corp. (a) |
2,300 |
179,113 |
|
|
Linear Technology Corp. |
21,500 |
1,546,656 |
|
|
LSI Logic Corp. (a) |
19,614 |
704,878 |
|
|
Maxim Integrated Products, Inc. (a) |
18,800 |
1,648,525 |
|
|
Maxwell Technologies, Inc. (a) |
3,100 |
50,763 |
|
|
MEMC Electronic Materials, Inc. (a) |
900 |
16,200 |
|
|
Merix Corp. (a) |
3,150 |
152,775 |
|
|
Methode Electronics, Inc. Class A |
2,500 |
150,313 |
|
|
Micrel, Inc. (a) |
7,400 |
565,638 |
|
|
Micro Linear Corp. (a) |
100 |
525 |
|
|
Microchip Technology, Inc. (a) |
4,500 |
306,281 |
|
|
Micron Technology, Inc. (a) |
38,000 |
3,106,500 |
|
|
Micronetics Wireless, Inc. (a) |
3,900 |
37,538 |
|
|
Microsemi Corp. (a) |
3,800 |
160,550 |
|
|
MIPS Technologies, Inc. Class A (a) |
2,600 |
148,850 |
|
|
Molex, Inc. |
12,737 |
672,673 |
|
|
Motorola, Inc. |
149,036 |
5,374,611 |
|
|
National Semiconductor Corp. (a) |
10,600 |
471,700 |
|
|
NeoMagic Corp. (a) |
1,000 |
3,594 |
|
|
Netergy Networks, Inc. (a) |
1,000 |
11,875 |
|
|
NETsilicon, Inc. |
2,600 |
67,275 |
|
|
Network Access Solutions Corp. (a) |
3,900 |
30,956 |
|
|
New Focus, Inc. |
300 |
41,419 |
|
|
NU Horizons Electronics Corp. |
4,300 |
112,875 |
|
|
NVIDIA Corp. (a) |
3,400 |
269,875 |
|
|
Omnivision Technologies, Inc. |
3,900 |
175,500 |
|
|
Pacific Aerospace & Electronics, Inc. (a) |
11,600 |
13,413 |
|
|
Pericom Semiconductor Corp. (a) |
2,300 |
170,200 |
|
|
Common Stocks - continued |
|||
|
Shares |
Value (Note 1) |
||
|
TECHNOLOGY - continued |
|||
|
Electronics - continued |
|||
|
Photronics, Inc. (a) |
4,495 |
$ 131,760 |
|
|
Pioneer Standard Electronics, Inc. |
1,300 |
17,794 |
|
|
Pixelworks, Inc. (a) |
4,600 |
124,775 |
|
|
Plexus Corp. (a) |
2,000 |
309,500 |
|
|
PLX Technology, Inc. (a) |
3,200 |
100,200 |
|
|
PMC-Sierra, Inc. (a) |
546 |
128,856 |
|
|
Power Integrations, Inc. (a) |
4,700 |
79,900 |
|
|
Power-One, Inc. (a) |
2,250 |
356,484 |
|
|
QLogic Corp. (a) |
4,933 |
559,896 |
|
|
Rambus, Inc. (a) |
5,800 |
473,788 |
|
|
Ramtron International Corp. (a) |
4,800 |
71,400 |
|
|
Reptron Electronics, Inc. (a) |
100 |
1,431 |
|
|
RF Micro Devices, Inc. (a) |
9,400 |
419,475 |
|
|
Richardson Electronics Ltd. |
5,600 |
85,225 |
|
|
S3, Inc. (a) |
4,428 |
52,306 |
|
|
Sage, Inc. |
1,900 |
17,100 |
|
|
Sanmina Corp. (a) |
9,896 |
1,167,728 |
|
|
SDL, Inc. (a) |
5,200 |
2,066,025 |
|
|
Semtech Corp. (a) |
2,300 |
272,406 |
|
|
Sigma Designs, Inc. (a) |
4,100 |
16,913 |
|
|
Silicon Image, Inc. |
1,200 |
44,100 |
|
|
Silicon Laboratories, Inc. |
1,400 |
84,525 |
|
|
Silicon Storage Technology, Inc. (a) |
4,200 |
137,813 |
|
|
Siliconix, Inc. (a) |
2,400 |
134,100 |
|
|
Sipex Corp. (a) |
3,000 |
129,188 |
|
|
Solectron Corp. (a) |
40,536 |
1,836,788 |
|
|
Standard Microsystems Corp. (a) |
500 |
9,500 |
|
|
Stanford Microdevices, Inc. |
1,800 |
87,075 |
|
|
Storage Technology Corp. (a) |
4,100 |
64,831 |
|
|
Stratos Lightwave, Inc. |
4,300 |
202,100 |
|
|
Superconductor Technologies, Inc. (a) |
2,900 |
64,163 |
|
|
Technitrol, Inc. |
700 |
89,250 |
|
|
Tegal Corp. (a) |
6,200 |
28,675 |
|
|
Telcom Semiconductor, Inc. (a) |
5,900 |
102,881 |
|
|
Texas Instruments, Inc. |
117,758 |
7,882,426 |
|
|
Three-Five Systems, Inc. (a) |
1,200 |
39,900 |
|
|
Transwitch Corp. (a) |
3,950 |
237,741 |
|
|
TriQuint Semiconductor, Inc. |
4,800 |
265,500 |
|
|
Universal Display Corp. (a) |
2,400 |
59,700 |
|
|
Vari-L, Inc. (a) |
1,700 |
20,400 |
|
|
Viasystems Group, Inc. |
7,300 |
120,450 |
|
|
Virata Corp. |
2,300 |
158,125 |
|
|
Vishay Intertechnology, Inc. (a) |
8,218 |
331,288 |
|
|
Vitesse Semiconductor Corp. (a) |
11,900 |
1,056,869 |
|
|
Vixel Corp. |
6,700 |
55,275 |
|
|
Voxware, Inc. (a) |
9,600 |
33,000 |
|
|
Woodhead Industries, Inc. |
1,900 |
37,525 |
|
|
World Access, Inc. (a) |
3,634 |
32,933 |
|
|
Xicor, Inc. (a) |
8,100 |
96,694 |
|
|
|
|||
|
Shares |
Value (Note 1) |
||
|
Xilinx, Inc. (a) |
21,600 |
$ 1,919,700 |
|
|
Zoran Corp. (a) |
2,200 |
135,988 |
|
|
|
100,202,386 |
||
|
Photographic Equipment - 0.1% |
|||
|
Concord Camera Corp. (a) |
4,400 |
96,800 |
|
|
Eastman Kodak Co. |
22,100 |
1,375,725 |
|
|
InFocus Corp. (a) |
4,000 |
193,500 |
|
|
Lanier Worldwide, Inc. (a) |
15,400 |
15,400 |
|
|
Polaroid Corp. |
7,600 |
129,200 |
|
|
|
1,810,625 |
||
|
TOTAL TECHNOLOGY |
407,819,086 |
||
|
TRANSPORTATION - 0.7% |
|||
|
Air Transportation - 0.3% |
|||
|
AirTran Holdings, Inc. (a) |
1,900 |
7,838 |
|
|
Alaska Air Group, Inc. (a) |
3,000 |
78,000 |
|
|
America West Holding Corp. Class B (a) |
2,200 |
32,175 |
|
|
AMR Corp. |
8,800 |
288,750 |
|
|
Atlantic Coast Airlines Holdings, Inc. (a) |
4,000 |
127,000 |
|
|
Atlas Air, Inc. (a) |
1,450 |
62,713 |
|
|
Cheap Tickets, Inc. (a) |
3,700 |
39,313 |
|
|
Continental Airlines, Inc. Class B (a) |
4,700 |
226,188 |
|
|
Cyber-Care, Inc. (a) |
10,200 |
60,563 |
|
|
Delta Air Lines, Inc. |
7,800 |
386,100 |
|
|
GetThere.com, Inc. |
2,900 |
50,388 |
|
|
Great Lakes Aviation Ltd. (a) |
200 |
325 |
|
|
Hotel Reservations Network, Inc. |
2,640 |
92,895 |
|
|
Mesa Air Group, Inc. (a) |
200 |
1,113 |
|
|
Midway Airlines Corp. (a) |
100 |
563 |
|
|
Midwest Express Holdings, Inc. (a) |
400 |
9,050 |
|
|
Navigant International, Inc. (a) |
700 |
7,350 |
|
|
Northwest Airlines Corp. Class A (a) |
8,700 |
272,419 |
|
|
SkyWest, Inc. |
11,130 |
553,022 |
|
|
Southwest Airlines Co. |
32,762 |
741,240 |
|
|
Transportation World Airlines, Inc. (a) |
2,700 |
5,569 |
|
|
UAL Corp. |
4,100 |
195,775 |
|
|
US Airways Group, Inc. (a) |
3,300 |
112,200 |
|
|
World Fuel Services Corp. |
200 |
1,538 |
|
|
|
3,352,087 |
||
|
Railroads - 0.2% |
|||
|
ABC Rail Products Corp. (a) |
100 |
650 |
|
|
Burlington Northern Santa Fe Corp. |
27,700 |
619,788 |
|
|
CSX Corp. |
13,100 |
312,763 |
|
|
Florida East Coast Industries |
1,200 |
52,350 |
|
|
Kansas City Southern Industries, Inc. |
2,600 |
24,050 |
|
|
Norfolk Southern Corp. |
24,600 |
395,138 |
|
|
RailAmerica, Inc. (a) |
10,900 |
70,169 |
|
|
Trinity Industries, Inc. |
2,800 |
54,250 |
|
|
Union Pacific Corp. |
19,300 |
767,175 |
|
|
Wisconsin Central |
11,300 |
151,138 |
|
|
|
2,447,471 |
||
|
Common Stocks - continued |
|||
|
Shares |
Value (Note 1) |
||
|
TRANSPORTATION - continued |
|||
|
Shipping - 0.0% |
|||
|
Alexander & Baldwin, Inc. |
1,600 |
$ 42,100 |
|
|
Kirby Corp. (a) |
300 |
7,069 |
|
|
Marine Transport Corp. (a) |
10 |
22 |
|
|
OMI Corp. (a) |
100 |
750 |
|
|
Trico Marine Services, Inc. (a) |
600 |
8,700 |
|
|
|
58,641 |
||
|
Trucking & Freight - 0.2% |
|||
|
Airborne Freight Corp. |
1,500 |
22,406 |
|
|
American Freightways Corp. (a) |
300 |
4,931 |
|
|
Arkansas Best Corp. (a) |
4,000 |
60,250 |
|
|
Asche Transportation Services, Inc. (a) |
500 |
313 |
|
|
C.H. Robinson Worldwide, Inc. |
3,000 |
177,563 |
|
|
Celadon Group, Inc. (a) |
4,400 |
50,050 |
|
|
Circle International Group, Inc. |
1,200 |
42,975 |
|
|
CNF Transportation, Inc. |
4,000 |
98,000 |
|
|
Consolidated Freightways Corp. (a) |
800 |
3,662 |
|
|
EGL, Inc. (a) |
3,700 |
132,969 |
|
|
Expeditors International of |
2,900 |
142,100 |
|
|
FedEx Corp. (a) |
19,460 |
785,211 |
|
|
Forward Air Corp. (a) |
2,700 |
123,863 |
|
|
Fritz Companies, Inc. (a) |
1,000 |
14,813 |
|
|
J.B. Hunt Transport Services, Inc. |
1,200 |
16,200 |
|
|
Knights Transportation, Inc. (a) |
3,500 |
59,500 |
|
|
Landstar System, Inc. (a) |
600 |
30,600 |
|
|
M.S. Carriers, Inc. (a) |
400 |
7,375 |
|
|
Roadway Express, Inc. |
3,300 |
75,900 |
|
|
Rollins Truck Leasing Corp. |
4,800 |
32,400 |
|
|
Swift Transportation Co., Inc. (a) |
2,450 |
41,803 |
|
|
United Parcel Service, Inc. Class B |
9,800 |
543,288 |
|
|
US Xpress Enterprises, Inc. (a) |
600 |
4,650 |
|
|
USFreightways Corp. |
4,500 |
140,344 |
|
|
Werner Enterprises, Inc. |
1,400 |
18,900 |
|
|
XTRA Corp. (a) |
1,000 |
44,375 |
|
|
Yellow Corp. (a) |
700 |
10,675 |
|
|
|
2,685,116 |
||
|
TOTAL TRANSPORTATION |
8,543,315 |
||
|
UTILITIES - 8.9% |
|||
|
Cellular - 1.3% |
|||
|
Advanced Radio Telecom Corp. (a) |
2,200 |
22,550 |
|
|
AirGate PCS, Inc. |
1,800 |
122,513 |
|
|
Alamosa PCS Holdings, Inc. |
4,350 |
108,206 |
|
|
ALLTEL Corp. |
22,065 |
1,115,662 |
|
|
Aquis Communication Group, Inc. (a) |
6,600 |
3,713 |
|
|
Arch Communications Group, Inc. (a) |
11,000 |
57,063 |
|
|
Boston Communications Group, Inc. (a) |
1,300 |
18,688 |
|
|
Cellnet Data Systems, Inc. (a) |
11,900 |
179 |
|
|
Centennial Cellular Corp. (a) |
6,700 |
108,456 |
|
|
CoreComm Ltd. (a) |
675 |
8,058 |
|
|
|
|||
|
Shares |
Value (Note 1) |
||
|
Crown Castle International Corp. (a) |
11,600 |
$ 402,375 |
|
|
Dobson Communications Corp. Class A |
6,550 |
141,234 |
|
|
LCC International, Inc. (a) |
2,300 |
50,456 |
|
|
Leap Wireless International, Inc. (a) |
1,800 |
142,875 |
|
|
Lightbridge, Inc. (a) |
2,000 |
35,000 |
|
|
Metrocall, Inc. (a) |
10,900 |
45,644 |
|
|
Nextel Communications, Inc. Class A (a) |
53,000 |
2,938,188 |
|
|
Nextel Partners, Inc. Class A |
11,600 |
350,175 |
|
|
Powertel, Inc. (a) |
2,200 |
171,600 |
|
|
Price Communications Corp. |
5,265 |
107,933 |
|
|
QUALCOMM, Inc. (a) |
51,100 |
3,059,613 |
|
|
Rural Cellular Corp. Class A (a) |
2,000 |
152,000 |
|
|
SBA Communications Corp. Class A (a) |
3,600 |
160,650 |
|
|
Sensar Corp. (a) |
2,300 |
52,038 |
|
|
SpectraLink Corp. (a) |
4,000 |
52,000 |
|
|
Sprint Corp. - PCS Group Series 1 (a) |
64,000 |
3,212,000 |
|
|
TeleCorp PCS, Inc. Class A |
5,100 |
179,775 |
|
|
Telephone & Data Systems, Inc. |
4,200 |
487,200 |
|
|
Tritel, Inc. Class A |
6,900 |
180,263 |
|
|
Triton PCS Holdings, Inc. Class A |
3,800 |
210,425 |
|
|
United States Cellular Corp. (a) |
6,100 |
448,731 |
|
|
VoiceStream Wireless Corp. (a) |
11,252 |
1,266,553 |
|
|
WebLink Wireless, Inc. Class A (a) |
5,500 |
54,484 |
|
|
Western Wireless Corp. Class A (a) |
4,900 |
250,513 |
|
|
|
15,716,813 |
||
|
Electric Utility - 2.0% |
|||
|
AES Corp. (a) |
28,500 |
1,816,875 |
|
|
Allegheny Energy, Inc. |
5,700 |
204,488 |
|
|
Alliant Energy Corp. |
5,200 |
152,100 |
|
|
Ameren Corp. |
12,700 |
513,556 |
|
|
American Electric Power Co., Inc. |
26,800 |
944,700 |
|
|
Avista Corp. |
4,500 |
82,969 |
|
|
Bangor Hydro-Electric Co. |
200 |
4,825 |
|
|
Black Hills Corp. |
400 |
10,200 |
|
|
Calpine Corp. (a) |
8,000 |
792,000 |
|
|
Cinergy Corp. |
14,800 |
434,750 |
|
|
Citizens Communications Co. (a) |
28,625 |
466,945 |
|
|
CMP Group, Inc. |
3,900 |
114,563 |
|
|
CMS Energy Corp. |
12,600 |
329,175 |
|
|
Conectiv, Inc. |
6,750 |
119,813 |
|
|
Consolidated Edison, Inc. |
17,400 |
544,838 |
|
|
Constellation Energy Corp. |
8,500 |
325,125 |
|
|
CP&L Energy, Inc. |
9,200 |
340,400 |
|
|
Dominion Resources, Inc. |
20,343 |
1,078,179 |
|
|
DPL, Inc. |
8,069 |
220,385 |
|
|
DQE, Inc. |
4,300 |
172,806 |
|
|
DTE Energy Co. |
16,300 |
566,425 |
|
|
Duke Energy Corp. |
25,800 |
1,930,163 |
|
|
Edison International |
21,200 |
438,575 |
|
|
Energy East Corp. |
5,900 |
133,856 |
|
|
Entergy Corp. |
17,900 |
544,831 |
|
|
FirstEnergy Corp. |
14,257 |
352,861 |
|
|
Florida Progress Corp. |
5,900 |
306,063 |
|
|
Common Stocks - continued |
|||
|
Shares |
Value (Note 1) |
||
|
UTILITIES - continued |
|||
|
Electric Utility - continued |
|||
|
FPL Group, Inc. |
12,800 |
$ 683,200 |
|
|
GPU, Inc. |
8,000 |
245,000 |
|
|
Hawaiian Electric Industries, Inc. |
200 |
6,550 |
|
|
IDACORP, Inc. |
3,900 |
153,806 |
|
|
IPALCO Enterprises, Inc. |
7,300 |
170,181 |
|
|
Kansas City Power & Light Co. |
1,700 |
45,688 |
|
|
LG&E Energy Corp. |
7,300 |
178,850 |
|
|
Minnesota Power, Inc. |
2,800 |
62,125 |
|
|
Montana Power Co. |
5,200 |
187,525 |
|
|
Niagara Mohawk Holdings, Inc. (a) |
7,300 |
93,988 |
|
|
NiSource, Inc. |
5,200 |
124,475 |
|
|
Northeast Utilities |
10,700 |
243,425 |
|
|
Northwestern Corp. |
1,400 |
30,450 |
|
|
NSTAR Companies |
2,234 |
93,968 |
|
|
Ogden Corp. (a) |
1,500 |
26,063 |
|
|
OGE Energy Corp. |
2,400 |
51,300 |
|
|
PECO Energy Co. |
10,400 |
501,150 |
|
|
PG&E Corp. |
27,700 |
801,569 |
|
|
Pinnacle West Capital Corp. |
6,800 |
280,075 |
|
|
Potomac Electric Power Co. |
5,600 |
141,050 |
|
|
PPL Corp. |
7,510 |
251,585 |
|
|
Public Service Co. of New Mexico |
6,300 |
134,663 |
|
|
Public Service Enterprise Group, Inc. |
20,800 |
754,000 |
|
|
Puget Sound Power & Light Co. |
3,100 |
72,463 |
|
|
Reliant Energy, Inc. |
28,000 |
1,039,500 |
|
|
SCANA Corp. |
4,856 |
132,933 |
|
|
Sierra Pacific Resources |
1,152 |
20,376 |
|
|
Southern Co. |
49,900 |
1,493,881 |
|
|
TECO Energy, Inc. |
5,800 |
142,463 |
|
|
TXU Corp. |
24,000 |
838,500 |
|
|
Unicom Corp. |
18,600 |
849,788 |
|
|
Unisource Energy Corp. |
3,000 |
46,688 |
|
|
Utilicorp United, Inc. |
3,500 |
83,344 |
|
|
Wisconsin Energy Corp. |
5,200 |
110,500 |
|
|
XCEL Energy, Inc. |
17,765 |
445,235 |
|
|
|
23,477,823 |
||
|
Gas - 1.0% |
|||
|
AGL Resources, Inc. |
1,400 |
26,513 |
|
|
Atmos Energy Corp. |
100 |
2,075 |
|
|
Atrion Corp. (a) |
300 |
3,638 |
|
|
Columbia Energy Group |
6,600 |
463,237 |
|
|
Contour Energy Co. (a) |
660 |
1,712 |
|
|
CTG Resources, Inc. |
300 |
12,150 |
|
|
Dynegy, Inc. Class A |
20,272 |
912,240 |
|
|
Eastern Enterprises Co. |
3,800 |
240,350 |
|
|
El Paso Energy Corp. |
17,200 |
1,001,900 |
|
|
Energen Corp. |
900 |
23,344 |
|
|
Enron Corp. |
54,700 |
4,642,663 |
|
|
Equitable Resources, Inc. |
2,100 |
118,256 |
|
|
KeySpan Corp. |
14,892 |
512,843 |
|
|
Kinder Morgan, Inc. |
6,800 |
250,325 |
|
|
|
|||
|
Shares |
Value (Note 1) |
||
|
MCN Energy Group, Inc. |
6,500 |
$ 156,000 |
|
|
MDU Resources Group, Inc. |
3,800 |
95,000 |
|
|
Midcoast Energy Resources, Inc. |
3,100 |
57,738 |
|
|
Mitchell Energy & Development Corp. Class A |
2,700 |
108,000 |
|
|
National Fuel Gas Co. |
1,900 |
99,631 |
|
|
New Jersey Resources Corp. |
100 |
4,000 |
|
|
NICOR, Inc. |
8,000 |
295,000 |
|
|
Northwest Natural Gas Co. |
3,400 |
78,200 |
|
|
ONEOK, Inc. |
1,200 |
38,325 |
|
|
Peoples Energy Corp. |
3,000 |
97,500 |
|
|
Piedmont Natural Gas Co., Inc. |
700 |
19,381 |
|
|
Questar Corp. |
7,500 |
162,656 |
|
|
Sempra Energy |
20,873 |
407,024 |
|
|
Southern Union Co. |
900 |
16,144 |
|
|
Southwest Gas Corp. |
500 |
9,438 |
|
|
Southwestern Energy Co. |
800 |
6,200 |
|
|
UGI Corp. |
4,300 |
98,094 |
|
|
Vectren Corp. |
1,900 |
36,100 |
|
|
Washington Gas Light Co. |
1,500 |
37,969 |
|
|
Western Resources, Inc. |
12,300 |
246,000 |
|
|
Williams Companies, Inc. |
30,299 |
1,395,648 |
|
|
|
11,675,294 |
||
|
Telephone Services - 4.6% |
|||
|
Adelphia Business Solution, Inc. |
900 |
13,444 |
|
|
Alaska Communication |
4,600 |
37,231 |
|
|
Allegiance Telecom, Inc. (a) |
7,100 |
353,669 |
|
|
Allied Riser Communications Corp. |
1,300 |
10,563 |
|
|
AT&T Corp. |
261,281 |
8,230,352 |
|
|
AT&T Latin America Corp. (a) |
2,900 |
40,600 |
|
|
BellSouth Corp. |
130,800 |
4,880,475 |
|
|
BroadWing, Inc. |
13,998 |
391,069 |
|
|
Caprock Communications Corp. (a) |
2,600 |
15,438 |
|
|
CenturyTel, Inc. |
10,775 |
310,455 |
|
|
CFW Communications Co. |
300 |
10,200 |
|
|
Choice One Communications, Inc. |
1,740 |
27,840 |
|
|
Commonwealth Telephone |
900 |
34,763 |
|
|
CT Communications, Inc. |
300 |
7,275 |
|
|
Cypress Communications, Inc. |
2,520 |
13,230 |
|
|
Deltathree.com, Inc. |
500 |
3,188 |
|
|
e.spire Communications, Inc. (a) |
10,500 |
42,656 |
|
|
eOn Communications Corp. |
620 |
2,131 |
|
|
Equinix, Inc. |
5,200 |
83,980 |
|
|
Fibernet Telecom Group, Inc. (a) |
100 |
1,700 |
|
|
Focal Communications Corp. |
4,000 |
123,750 |
|
|
Global TeleSystems Group, Inc. (a) |
10,700 |
92,288 |
|
|
I-Link Corp. (a) |
9,100 |
31,850 |
|
|
iBasis, Inc. |
2,400 |
49,800 |
|
|
ICG Communications, Inc. (a) |
15,000 |
89,531 |
|
|
iGate Capital Corp. (a) |
2,900 |
21,116 |
|
|
Illuminet Holdings, Inc. |
1,700 |
67,575 |
|
|
Common Stocks - continued |
|||
|
Shares |
Value (Note 1) |
||
|
UTILITIES - continued |
|||
|
Telephone Services - continued |
|||
|
Intermedia Communications, Inc. (a) |
3,700 |
$ 76,775 |
|
|
ITC DeltaCom, Inc. (a) |
5,500 |
77,688 |
|
|
ITXC Corp. |
1,400 |
28,000 |
|
|
Level 3 Communications, Inc. (a) |
27,600 |
2,407,669 |
|
|
McLeodUSA, Inc. Class A (a) |
38,877 |
614,743 |
|
|
Metromedia Fiber Network, Inc. |
33,074 |
1,320,893 |
|
|
Mpower Communications Corp. (a) |
2,850 |
52,547 |
|
|
Net2000 Communications, Inc. |
2,000 |
17,500 |
|
|
Net2Phone, Inc. |
1,100 |
32,519 |
|
|
Network Plus Corp. |
2,100 |
24,019 |
|
|
NEXTLINK Communications, Inc. |
15,273 |
535,510 |
|
|
NorthEast Optic Network, Inc. (a) |
1,300 |
57,769 |
|
|
Pac-West Telecomm, Inc. |
1,090 |
15,396 |
|
|
Pacific Gateway Exchange, Inc. (a) |
3,600 |
8,100 |
|
|
PNV, Inc. |
700 |
1,050 |
|
|
Primus Telecommunications |
1,261 |
20,097 |
|
|
Qwest Communications |
115,635 |
5,969,657 |
|
|
RCN Corp. |
4,900 |
118,825 |
|
|
Rhythms NetConnections, Inc. (a) |
5,500 |
49,500 |
|
|
SBC Communications, Inc. |
244,465 |
10,206,414 |
|
|
Source Media, Inc. (a) |
2,500 |
15,313 |
|
|
Sprint Corp. - FON Group |
60,500 |
2,026,750 |
|
|
STAR Telecommunications, Inc. (a) |
7,605 |
24,241 |
|
|
TALK.com, Inc. (a) |
6,500 |
46,719 |
|
|
Teligent, Inc. Class A (a) |
5,100 |
87,019 |
|
|
Time Warner Telecom, Inc. Class A (a) |
1,900 |
123,381 |
|
|
U.S. LEC Corp. Class A (a) |
1,600 |
16,800 |
|
|
Ursus Telecom Corp. (a) |
1,300 |
5,850 |
|
|
Verizon Communications |
195,502 |
8,528,775 |
|
|
Viatel, Inc. (a) |
1,691 |
23,146 |
|
|
West Teleservices Corp. (a) |
3,700 |
87,875 |
|
|
Williams Communications Group, Inc. |
3,800 |
111,625 |
|
|
WinStar Communications, Inc. (a) |
5,400 |
145,125 |
|
|
WorldCom, Inc. (a) |
200,525 |
7,319,163 |
|
|
Z-Tel Technologies, Inc. |
1,100 |
8,939 |
|
|
|
55,191,561 |
||
|
Water - 0.0% |
|||
|
American Water Works, Inc. |
6,200 |
151,900 |
|
|
|
|||
|
Shares |
Value (Note 1) |
||
|
Azurix Corp. (a) |
3,300 |
$ 15,675 |
|
|
Philadelphia Suburban Corp. |
800 |
18,750 |
|
|
|
186,325 |
||
|
TOTAL UTILITIES |
106,247,816 |
||
|
TOTAL COMMON STOCKS (Cost $1,031,812,029) |
1,183,327,377 |
||
|
Preferred Stocks - 0.0% |
|||
|
|
|
|
|
|
Convertible Preferred Stocks - 0.0% |
|||
|
CONSTRUCTION & REAL ESTATE - 0.0% |
|||
|
Real Estate Investment Trusts - 0.0% |
|||
|
Kimco Realty Corp. Series D $1.875 |
36 |
916 |
|
|
Nonconvertible Preferred Stocks - 0.0% |
|||
|
CONSTRUCTION & REAL ESTATE - 0.0% |
|||
|
Real Estate Investment Trusts - 0.0% |
|||
|
Price Enterprises, Inc. Series A $1.40 (a) |
100 |
1,494 |
|
|
TOTAL PREFERRED STOCKS (Cost $2,352) |
2,410 |
||
|
Corporate Bonds - 0.0% |
|||||
|
Moody's Ratings (unaudited) |
Principal Amount |
|
|||
|
Convertible Bonds - 0.0% |
|||||
|
CONSTRUCTION & REAL ESTATE - 0.0% |
|||||
|
Real Estate - 0.0% |
|||||
|
Excel Legacy Corp. 9% 11/4/04 |
- |
|
$ 2,000 |
1,620 |
|
|
Nonconvertible Bonds - 0.0% |
|||||
|
CONSTRUCTION & REAL ESTATE - 0.0% |
|||||
|
Real Estate - 0.0% |
|||||
|
Excel Legacy Corp. 10% 11/4/04 |
- |
|
1,000 |
808 |
|
|
TOTAL CORPORATE BONDS (Cost $2,646) |
2,428 |
||||
|
U.S. Treasury Obligations - 1.1% |
||||
|
|
||||
|
U.S. Treasury Bills, yield at date of purchase 5.87% to 6.19% 9/28/00 to 11/16/00 (c) |
|
13,862,000 |
13,712,666 |
|
|
Cash Equivalents - 4.1% |
|||
|
Shares |
Value (Note 1) |
||
|
Bankers Trust Institutional Daily Asset Fund, 6.6883% (b) |
48,337,370 |
$ 48,337,370 |
|
|
TOTAL INVESTMENT PORTFOLIO - 104.5% (Cost $1,093,867,361) |
1,245,382,251 |
||
|
NET OTHER ASSETS - (4.5)% |
(54,101,448) |
||
|
NET ASSETS - 100% |
$ 1,191,280,803 |
||
|
Futures Contracts |
|||||
|
|
Expiration Date |
Underlying Face Amount at Value |
Unrealized Gain/(Loss) |
||
|
Purchased |
|||||
|
5 Russell 2000 |
Sept. 2000 |
$ 1,342,625 |
$ 85,845 |
||
|
2 S&P 400 Midcap Index Contracts |
Sept. 2000 |
543,250 |
52,488 |
||
|
15 S&P 500 Stock |
Sept. 2000 |
5,704,500 |
304,710 |
||
|
|
|
$ 7,590,375 |
$ 443,043 |
||
|
|
|
The face value of futures purchased as a percentage of net assets - 0.6% |
|
Legend |
|
(a) Non-income producing |
|
(b) The rate quoted is the annualized seven-day yield of the fund at |
|
(c) Security or a portion of the security was pledged to cover margin requirements for futures contracts. At the period end, the value of securities pledged amounted to $844,954. |
|
Other Information |
|
Purchases and sales of securities, other than short-term securities, |
|
The market value of futures contracts opened and closed during the period amounted to $225,620,509 and $226,394,559, respectively. |
|
The fund placed a portion of its portfolio transactions with brokerage firms which are affiliates of Bankers Trust. The commissions paid to these affiliated firms were $8,136 for the period. |
|
The fund participated in the security lending program. At period end, the value of securities loaned amounted to $47,128,432. The fund received cash collateral of $48,337,370 which was invested in the Bankers Trust Institutional Daily Asset Fund. The fund also received non-cash collateral of $219,554 which represents U.S. Treasury obligations. |
|
Income Tax Information |
|
At August 31, 2000, the aggregate cost of investment securities for income tax purposes was $1,099,469,940. Net unrealized appreciation aggregated $145,912,311, of which $271,747,854 related to appreciated investment securities and $125,835,543 related to depreciated investment securities. |
See accompanying notes which are an integral part of the financial statements.
Semiannual Report
Statement of Assets and Liabilities
|
|
August 31, 2000 (Unaudited) |
|
|
Assets |
|
|
|
Investment in securities, at value |
|
$ 1,245,382,251 |
|
Cash |
|
4,052 |
|
Receivable for investments sold |
|
385,359 |
|
Receivable for fund shares sold |
|
897,610 |
|
Dividends receivable |
|
1,214,859 |
|
Interest receivable |
|
30,704 |
|
Redemption fees receivable |
|
80 |
|
Receivable for daily variation on futures contracts |
|
159,186 |
|
Other receivables |
|
575 |
|
Total assets |
|
1,248,074,676 |
|
Liabilities |
|
|
|
Payable for investments purchased |
$ 7,296,288 |
|
|
Payable for fund shares redeemed |
827,811 |
|
|
Accrued management fee |
117,782 |
|
|
Other payables and |
214,622 |
|
|
Collateral on securities loaned, |
48,337,370 |
|
|
Total liabilities |
|
56,793,873 |
|
Net Assets |
|
$ 1,191,280,803 |
|
Net Assets consist of: |
|
|
|
Paid in capital |
|
$ 1,034,972,084 |
|
Undistributed net investment income |
|
4,848,954 |
|
Accumulated undistributed net realized gain (loss) on investments |
|
(498,168) |
|
Net unrealized appreciation (depreciation) on investments |
|
151,957,933 |
|
Net Assets, for 30,172,425 shares outstanding |
|
$ 1,191,280,803 |
|
Net Asset Value, offering price |
|
$39.48 |
Statement of Operations
|
|
Six months ended August 31, 2000 (Unaudited) |
|
|
Investment Income Dividends |
|
$ 5,374,409 |
|
Interest |
|
479,348 |
|
Security lending |
|
216,355 |
|
Total income |
|
6,070,112 |
|
Expenses |
|
|
|
Management fee and |
$ 1,190,512 |
|
|
Transfer agent fees |
585,860 |
|
|
Accounting fees |
130,996 |
|
|
Non-interested trustees' compensation |
1,486 |
|
|
Registration fees |
133,387 |
|
|
Audit |
14,969 |
|
|
Legal |
2,004 |
|
|
Miscellaneous |
5,215 |
|
|
Total expenses before reductions |
2,064,429 |
|
|
Expense reductions |
(798,615) |
1,265,814 |
|
Net investment income |
|
4,804,298 |
|
Realized and Unrealized Gain (Loss) Net realized gain (loss) on: |
|
|
|
Investment securities |
1,274,545 |
|
|
Futures contracts |
(232,562) |
1,041,983 |
|
Change in net unrealized appreciation (depreciation) on: |
|
|
|
Investment securities |
60,126,800 |
|
|
Futures contracts |
364,988 |
60,491,788 |
|
Net gain (loss) |
|
61,533,771 |
|
Net increase (decrease) in net assets resulting from operations |
|
$ 66,338,069 |
See accompanying notes which are an integral part of the financial statements.
Semiannual Report
Spartan Total Market Index Fund
Financial Statements - continued
Statement of Changes in Net Assets
|
Increase (Decrease) in Net Assets |
Six months ended |
Year ended |
|
Operations |
$ 4,804,298 |
$ 5,885,380 |
|
Net realized gain (loss) |
1,041,983 |
5,994,690 |
|
Change in net unrealized appreciation (depreciation) |
60,491,788 |
75,489,551 |
|
Net increase (decrease) in net assets resulting from operations |
66,338,069 |
87,369,621 |
|
Distributions to shareholders |
(1,224,058) |
(4,911,129) |
|
From net realized gain |
(3,663,333) |
(3,035,302) |
|
In excess of net realized gain |
(498,168) |
- |
|
Total distributions |
(5,385,559) |
(7,946,431) |
|
Share transactions |
419,180,818 |
749,760,374 |
|
Reinvestment of distributions |
5,055,303 |
7,501,210 |
|
Cost of shares redeemed |
(152,194,043) |
(192,357,117) |
|
Net increase (decrease) in net assets resulting from share transactions |
272,042,078 |
564,904,467 |
|
Trading fees |
93,050 |
580,370 |
|
Total increase (decrease) in net assets |
333,087,638 |
644,908,027 |
|
Net Assets |
|
|
|
Beginning of period |
858,193,165 |
213,285,138 |
|
End of period (including undistributed net investment income of $4,848,954 and $1,392,866, respectively) |
$ 1,191,280,803 |
$ 858,193,165 |
|
Other Information Shares |
|
|
|
Sold |
11,152,530 |
21,285,032 |
|
Issued in reinvestment of distributions |
128,015 |
207,596 |
|
Redeemed |
(4,046,788) |
(5,368,586) |
|
Net increase (decrease) |
7,233,757 |
16,124,042 |
Financial Highlights
|
|
Six months ended |
Years ended February 28, |
||
|
Selected Per-Share Data |
(Unaudited) |
2000 F |
1999 |
1998 E |
|
Net asset value, beginning of period |
$ 37.41 |
$ 31.30 |
$ 27.78 |
$ 25.00 |
|
Income from Investment Operations |
|
|
|
|
|
Net investment income D |
.18 |
.41 |
.41 |
.15 |
|
Net realized and unrealized gain (loss) |
2.11 |
6.14 |
3.33 |
2.45 |
|
Total from investment operations |
2.29 |
6.55 |
3.74 |
2.60 |
|
Less Distributions |
|
|
|
|
|
From net investment income |
(.05) |
(.29) |
(.23) |
(.08) |
|
From net realized gain |
(.15) |
(.19) |
(.28) |
- |
|
In excess of net realized gain |
(.02) |
- |
- |
- |
|
Total distributions |
(.22) |
(.48) |
(.51) |
(.08) |
|
Trading fees added to paid in capital |
.00 |
.04 |
.29 |
.26 |
|
Net asset value, end of period |
$ 39.48 |
$ 37.41 |
$ 31.30 |
$ 27.78 |
|
Total Return B, C |
6.12% |
21.13% |
14.61% |
11.48% |
|
Ratios and Supplemental Data |
|
|
|
|
|
Net assets, end of period (000 omitted) |
$ 1,191,281 |
$ 858,193 |
$ 213,285 |
$ 38,842 |
|
Ratio of expenses to average net assets |
.25% A, G |
.26% G |
.27% G |
.25% A, G |
|
Ratio of net investment income to average net assets |
.94% A |
1.17% |
1.40% |
1.91% A |
|
Portfolio turnover rate |
16% A |
11% |
4% |
7% A |
|
A Annualized B Total returns for periods of less than one year are not annualized. C The total returns would have been lower had certain expenses not been reduced during the periods shown. D Net investment income per share has been calculated based on average shares outstanding during the period. E For the period November 5, 1997 (commencement of operations) to February 28, 1998. F For the year ended February 29 G FMR agreed to reimburse a portion of the fund's expenses during the period. Without this reimbursement, the fund's expense ratio would have been higher. |
||||
See accompanying notes which are an integral part of the financial statements.
Semiannual Report
There are several ways to evaluate a fund's historical performance. You can look at the total percentage change in value, the average annual percentage change or the growth of a hypothetical $10,000 investment. Total return reflects the change in the value of an investment, assuming reinvestment of the fund's dividend income and capital gains (the profits earned upon the sale of securities that have grown in value). If Fidelity had not reimbursed certain fund expenses, the total returns would have been lower.
Cumulative Total Returns
|
Periods ended August 31, 2000 |
Past 6 |
Past 1 |
Life of |
|
Spartan Extended Market Index |
-5.53% |
34.81% |
57.52% |
|
Wilshire 4500 Completion |
-5.08% |
39.44% |
59.06% |
|
Growth & Income Funds Average |
12.83% |
13.70% |
n/a* |
Cumulative total returns show the fund's performance in percentage terms over a set period - in this case, six months, one year or since the fund started on November 5, 1997. For example, if you had invested $1,000 in a fund that had a 5% return over the past year, the value of your investment would be $1,050. You can compare the fund's return to the performance of the Wilshire 4500 Completion Index (Wilshire 4500) - a market capitalization-weighted index of approximately 6,500 U.S. equity securities. The Wilshire 4500 includes all the stocks in the Wilshire 5000 except for stocks included in the S&P 500®. To measure how the fund's performance stacked up against its peers, you can compare it to the growth & income funds average, which reflects the performance of mutual funds with similar objectives tracked by Lipper Inc. The past six months average represents a peer group of 1,025 mutual funds. These benchmarks include reinvested dividends and capital gains, if any, and exclude the effect of sales charges. Lipper has created new comparison categories that group funds according to portfolio characteristics and capitalization, as well as by capitalization only. These averages are listed on the bottom of this page.(dagger)
Average Annual Total Returns
|
Periods ended August 31, 2000 |
Past 1 |
Life of |
|
Spartan Extended Market Index |
34.81% |
17.47% |
|
Wilshire 4500 Completion |
39.44% |
17.88% |
|
Growth & Income Funds Average |
13.70% |
n/a* |
Average annual total returns take the fund's cumulative return and show you what would have happened if the fund had performed at a constant rate each year.
* Not available
(dagger)The Lipper mid-cap core funds average reflects the performance (excluding sales charges) of mutual funds with similar portfolio characteristics and capitalization. The Lipper mid-cap supergroup average reflects the performance (excluding sales charges) of mutual funds with similar capitalization. As of August 31, 2000, the six month and one year cumulative total returns for the mid-cap core funds average were 7.46% and 52.73%, respectively. The one year average annual return was 52.73%. The six month and one year cumulative and average annual total returns for the mid-cap supergroup were 4.44% and 52.48%, respectively. The one year average annual return was 52.48%.
$10,000 Over Life of Fund
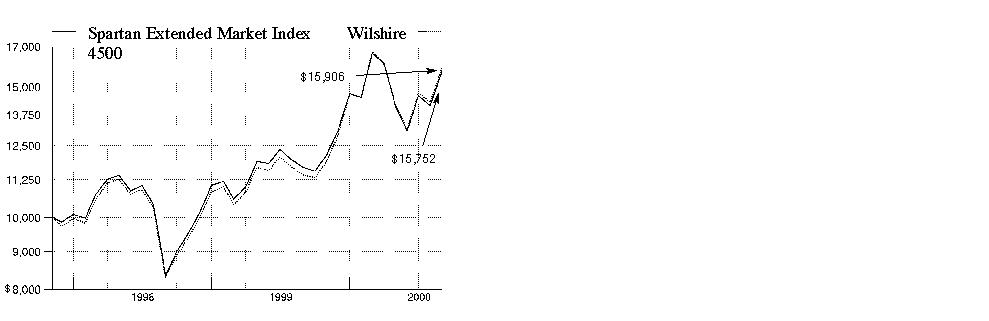
$10,000 Over Life of Fund: Let's say hypothetically that $10,000 was invested in Spartan Extended Market Index Fund on November 5, 1997, when
the fund started. As the chart shows, by August 31, 2000, the value of the investment would have been $15,752 - a 57.52% increase on the initial
investment. For comparison, look at how the Wilshire 4500 Index did over the same period. With dividends and capital gains, if any, reinvested, the same
$10,000 investment would have been $15,906 - a 59.06% increase. How a fund did yesterday is no guarantee of how
it will do tomorrow. The stock market, for example,
has a history of long-term growth and short-term
volatility. In turn, the share price and return of a
fund that invests in stocks will vary. That means if
you sell your shares during a market downturn,
you might lose money. But if you can ride out the
market's ups and downs, you may have a gain.
Understanding Performance
Semiannual Report
(Portfolio Manager photograph)
An interview with
Dean Barr, who oversees
the Spartan Extended Market Index Fund's investment management personnel as Managing Director
for Bankers Trust, sub-adviser of the fund
Q. How did the fund perform, Dean?
A. For the six months that ended August 31, 2000, the fund returned -5.53%, while the Wilshire 4500 Completion Index returned -5.08%. In comparison, the growth & income funds average tracked by Lipper Inc. returned 12.83%. For the 12 months that ended August 31, 2000, the fund returned 34.81%, while the Wilshire 4500 index and Lipper average returned 39.44% and 13.70%, respectively.
Q. How would you describe the market environment during the six-month period?
A. It was one marked by historically high levels of volatility and rapid sector rotations. Concerns about seemingly overstretched valuations and
further tightening by the Federal Reserve Board sent jittery investors fleeing smaller-sized tech stocks in droves for the perceived predictability of
large, well-established companies elsewhere in the market. This migration allowed big-cap names to outpace their smaller-cap counterparts by wide
margins. The Wilshire 4500 index - a proxy for broad market performance outside of the Standard & Poor's 500SM Index - was hurt the most by this
performance disparity because it didn't hold any of the top-performing blue-
chip names found in the S&P 500, which returned 11.73% during the period. In June, investors - sensing a slowing economy and an end to the Fed's
yearlong tightening cycle - eased their way back into tech stocks, this time focusing on seasoned growth companies with demonstrated revenues and
earnings. However, earnings worries related to a decelerating economy tempered optimism surrounding rates and spawned confusion and persistent
volatility during the summer months, with few industries enjoying market leadership for long. With the Fed choosing not to raise rates in August, stocks
staged a "relief rally," with tech shares reclaiming the lead for the first time since early March.
Q. What determined the fate of tech stocks during the period?
A. With many of the blue-chip tech stocks receiving the bulk of the attention from valuation-conscious investors seeking quality of earnings and industry leadership, companies with little-to-no earnings and/or questionable business models were pounded into the ground. Not surprisingly, Internet-related stocks took the worst beating, as evidenced by the collapse of names such as CMGI, Amazon.com, eBay, Ventro, Vignette and InfoSpace. Conversely, firms engaged in the build-out of Internet infrastructure gained widespread appeal with investors. Attempting to satisfy the growing need for communications bandwidth, networking and telecommunications equipment providers Juniper and SDL enjoyed strong advances. Data storage was another hot spot, with leading stocks such as Brocade reaping the rewards. Overall, it was a mixed bag for communications semiconductor companies, as many stocks - most notably QLogic and Vitesse - struggled to shake off their Y2K hangovers. Applied Micro Circuits was a notable exception.
Q. How did some other segments of the market fare?
A. Retailers, such as Saks, suffered from slowing consumer spending, while traditional telecommunications providers, such as McLeodUSA, drifted lower in response to increased competition. On the upside, stocks from the securities industry helped offset some of these losses. Strong capital markets activity, combined with industry consolidation, painted a healthy backdrop for key players such as Goldman Sachs and Donaldson, Lufkin & Jenrette. Not to be left out, insurance stocks also performed well, posting gains on signs of margin improvement. Berkshire Hathaway and MetLife were the standouts here. Most biotechnology stocks failed to recover from the spring's deep declines, although some - namely Ivax and Forest Labs - managed to post strong gains behind investors' renewed enthusiasm for the sector when researchers reported a successful mapping of the human genome. Rising oil and gas prices resulting from supply shortages sparked the energy sector, led by top contributors Vastar and Noble Drilling.
Q. What's your outlook?
A. It appears as if the economy is poised for a soft landing, though it's still too early to know for sure. Inaction on the rate front of late by the Fed tells me that growth is slowing enough right now to keep rates steady for at least the time being. Technology-enabled productivity gains, coupled with slower economic growth, should help neutralize spiking energy prices and keep inflation under wraps. Combine that with the presidential election, and I think we may see a Fed that's on hold for the remainder of 2000. Robust tech spending should further dampen inflationary pressures and keep corporate profits rising. If so, I expect growth stocks to prosper and continue to outperform in the coming months.
The views expressed in this report reflect those of Bankers Trust only through the end of the period of the report as stated on the cover. Any such views are subject to change at any time based on market or other conditions. For more information, see page 2.
Fund Facts
Goal: seeks to provide investment results that correspond to the total return of stocks of small-to mid-capitalization United States companies
Fund number: 398
Trading symbol: FSEMX
Start date: November 5, 1997
Size: as of August 31, 2000, more than
$552 million
Sub-adviser: Bankers Trust, since inception
3Semiannual Report
Spartan Extended Market Index Fund
|
Top Ten Stocks as of August 31, 2000 |
||
|
|
% of fund's |
% of fund's net assets |
|
Berkshire Hathaway, Inc. Class A |
2.1 |
1.4 |
|
Juniper Networks, Inc. |
1.6 |
0.9 |
|
VeriSign, Inc. |
0.9 |
0.6 |
|
Gemstar-TV Guide |
0.9 |
0.0 |
|
Ariba, Inc. |
0.9 |
0.5 |
|
Sycamore Networks, Inc. |
0.8 |
0.8 |
|
i2 Technologies, Inc. |
0.8 |
0.5 |
|
Level 3 Communications, Inc. |
0.8 |
0.8 |
|
Ciena Corp. |
0.8 |
0.5 |
|
SDL, Inc. |
0.7 |
0.3 |
|
|
10.3 |
6.3 |
|
Top Ten Market Sectors as of August 31, 2000 |
||
|
|
% of fund's |
% of fund's net assets |
|
Technology |
36.5 |
43.0 |
|
Finance |
11.7 |
8.5 |
|
Health |
10.1 |
9.1 |
|
Utilities |
8.1 |
9.0 |
|
Media & Leisure |
6.9 |
6.8 |
|
Construction & Real Estate |
4.8 |
3.8 |
|
Energy |
3.7 |
2.3 |
|
Services |
3.6 |
3.4 |
|
Durables |
3.3 |
1.9 |
|
Industrial Machinery & Equipment |
2.8 |
2.4 |
Semiannual Report
Spartan Extended Market Index Fund
(Unaudited)
Showing Percentage of Net Assets
|
Common Stocks - 99.2% |
|||
|
Shares |
Value (Note 1) |
||
|
AEROSPACE & DEFENSE - 0.5% |
|||
|
Aerospace & Defense - 0.2% |
|||
|
AAR Corp. |
7,350 |
$ 82,688 |
|
|
Advanced Aerodynamics & |
600 |
1,500 |
|
|
Alliant Techsystems, Inc. (a) |
2,308 |
177,860 |
|
|
Aviall, Inc. (a) |
2,500 |
15,000 |
|
|
BE Aerospace, Inc. (a) |
8,600 |
139,213 |
|
|
Blount International, Inc. (a) |
1,900 |
15,913 |
|
|
Curtiss-Wright Corp. |
300 |
13,631 |
|
|
Datron Systems, Inc. (a) |
3,500 |
50,531 |
|
|
Fairchild Corp. Class A |
10,150 |
69,781 |
|
|
GenCorp, Inc. |
1,300 |
9,506 |
|
|
Harsco Corp. |
3,200 |
89,000 |
|
|
Kellstrom Industries, Inc. (a) |
5,700 |
29,213 |
|
|
Moog, Inc. Class A (a) |
200 |
6,500 |
|
|
Northrop Grumman Corp. |
1,427 |
111,038 |
|
|
Orbital Sciences Corp. (a) |
1,100 |
9,831 |
|
|
Precision Castparts Corp. |
4,700 |
357,200 |
|
|
Primex Technologies, Inc. |
1,500 |
36,375 |
|
|
Sequa Corp. Class A (a) |
300 |
13,875 |
|
|
Simula, Inc. (a) |
100 |
138 |
|
|
Standex International Corp. |
400 |
7,425 |
|
|
Sturm Ruger & Co., Inc. |
800 |
6,650 |
|
|
United Industrial Corp. |
100 |
1,006 |
|
|
Woodward Governor Co. |
300 |
11,888 |
|
|
|
1,255,762 |
||
|
Defense Electronics - 0.2% |
|||
|
Alpha Industries, Inc. (a) |
5,300 |
267,319 |
|
|
Anaren Microwave, Inc. (a) |
1,400 |
165,288 |
|
|
Ashton Technology Group, Inc. (a) |
4,500 |
16,172 |
|
|
Comarco, Inc. (a) |
2,000 |
63,000 |
|
|
Cubic Corp. |
200 |
4,300 |
|
|
Datum, Inc. (a) |
2,100 |
83,869 |
|
|
Ducommun, Inc. (a) |
150 |
2,175 |
|
|
Flir Systems, Inc. |
600 |
3,338 |
|
|
Frequency Electronics, Inc. |
150 |
5,269 |
|
|
Giga-Tronics, Inc. (a) |
4,900 |
40,425 |
|
|
Herley Industries, Inc. (a) |
4,500 |
82,969 |
|
|
REMEC, Inc. (a) |
5,100 |
145,350 |
|
|
|
879,474 |
||
|
Ship Building & Repair - 0.1% |
|||
|
Dril-Quip, Inc. (a) |
800 |
36,350 |
|
|
Newport News Shipbuilding, Inc. |
6,800 |
289,000 |
|
|
|
325,350 |
||
|
TOTAL AEROSPACE & DEFENSE |
2,460,586 |
||
|
BASIC INDUSTRIES - 1.9% |
|||
|
Chemicals & Plastics - 0.9% |
|||
|
A. Schulman, Inc. |
2,600 |
31,363 |
|
|
Airgas, Inc. (a) |
4,300 |
28,488 |
|
|
|
|||
|
Shares |
Value (Note 1) |
||
|
Albemarle Corp. |
3,840 |
$ 95,280 |
|
|
Arch Chemicals, Inc. |
2,750 |
50,016 |
|
|
ATMI, Inc. (a) |
3,500 |
93,789 |
|
|
Bush Boake Allen, Inc. (a) |
1,200 |
52,650 |
|
|
Cabot Corp. |
12,400 |
458,800 |
|
|
Cabot Microelectronics Corp. |
2,200 |
128,425 |
|
|
Carbide/Graphite Group, Inc. (a) |
2,600 |
11,700 |
|
|
ChemFirst, Inc. |
700 |
16,144 |
|
|
Crompton Corp. |
10,495 |
94,455 |
|
|
Cytec Industries, Inc. (a) |
6,800 |
226,950 |
|
|
Diversa Corp. |
750 |
21,375 |
|
|
Entegris, Inc. |
8,500 |
94,563 |
|
|
Ethyl Corp. |
1,200 |
2,475 |
|
|
First Years, Inc. |
200 |
2,200 |
|
|
Foamex International, Inc. (a) |
800 |
4,650 |
|
|
General Chemical Group, Inc. (a) |
1,000 |
1,063 |
|
|
Geon Co. |
1,600 |
27,900 |
|
|
Georgia Gulf Corp. |
7,100 |
92,300 |
|
|
Gundle/SLT Environmental, Inc. (a) |
100 |
313 |
|
|
H.B. Fuller Co. |
3,900 |
133,819 |
|
|
Hawkins Chemicals, Inc. |
100 |
775 |
|
|
IMC Global, Inc. |
13,680 |
200,925 |
|
|
International Specialty Products, Inc. (a) |
3,500 |
20,125 |
|
|
Isolyser, Inc. (a) |
1,000 |
2,563 |
|
|
Ivex Packaging Corp. (a) |
7,700 |
84,700 |
|
|
Lamson & Sessions Co. (a) |
5,400 |
106,650 |
|
|
LESCO, Inc. |
1,700 |
29,856 |
|
|
Lubrizol Corp. |
7,700 |
166,994 |
|
|
Lydall, Inc. (a) |
500 |
6,031 |
|
|
Lyondell Chemical Co. |
21,200 |
276,925 |
|
|
M.A. Hanna Co. |
2,900 |
24,106 |
|
|
MacDermid, Inc. |
2,400 |
60,000 |
|
|
Medical Manager Corp. (a) |
6,537 |
285,994 |
|
|
Millennium Chemicals, Inc. |
12,800 |
211,200 |
|
|
Minerals Technologies, Inc. |
4,100 |
212,688 |
|
|
Mississippi Chemical Corp. |
800 |
3,300 |
|
|
Myers Industries, Inc. |
605 |
8,470 |
|
|
NL Industries, Inc. |
4,000 |
93,250 |
|
|
North American Scientific, Inc. (a) |
3,200 |
77,200 |
|
|
NuCo2, Inc. (a) |
2,200 |
16,225 |
|
|
Oil-Dri Corp. of America |
100 |
944 |
|
|
Olin Corp. |
9,100 |
150,150 |
|
|
OM Group, Inc. |
2,000 |
94,750 |
|
|
Park Electrochemical Corp. |
300 |
12,056 |
|
|
PW Eagle, Inc. (a) |
5,000 |
85,625 |
|
|
Rogers Corp. (a) |
200 |
6,975 |
|
|
Scotts Co. Class A (a) |
2,500 |
77,500 |
|
|
Solutia, Inc. |
19,300 |
290,706 |
|
|
Southwall Technologies, Inc. (a) |
7,100 |
43,488 |
|
|
Spartech Corp. |
2,200 |
54,450 |
|
|
Stepan Co. |
300 |
6,263 |
|
|
Synalloy Corp. |
100 |
663 |
|
|
Synthetech, Inc. (a) |
100 |
278 |
|
|
Terra Industries, Inc. (a) |
1,900 |
2,969 |
|
|
Common Stocks - continued |
|||
|
Shares |
Value (Note 1) |
||
|
BASIC INDUSTRIES - continued |
|||
|
Chemicals & Plastics - continued |
|||
|
Tredegar Industries, Inc. |
3,255 |
$ 63,473 |
|
|
Tuscarora Plastics, Inc. |
100 |
1,425 |
|
|
Uniroyal Technology Corp. (a) |
7,200 |
121,500 |
|
|
USEC, Inc. |
30,500 |
133,438 |
|
|
Valhi, Inc. |
10,500 |
134,531 |
|
|
Valspar Corp. |
8,000 |
236,000 |
|
|
Viskase Companies, Inc. (a) |
100 |
163 |
|
|
Wellman, Inc. |
4,200 |
50,663 |
|
|
|
5,124,705 |
||
|
Iron & Steel - 0.2% |
|||
|
Advanced Technical Products, Inc. (a) |
100 |
303 |
|
|
AK Steel Holding Corp. |
23,240 |
252,735 |
|
|
Ampco-Pittsburgh Corp. |
100 |
1,138 |
|
|
Atchison Casting Corp. (a) |
100 |
556 |
|
|
Barnes Group, Inc. |
800 |
15,550 |
|
|
Birmingham Steel Corp. |
3,300 |
9,281 |
|
|
Carpenter Technology Corp. |
6,400 |
208,000 |
|
|
Circor International, Inc. |
100 |
919 |
|
|
Cleveland-Cliffs, Inc. |
2,400 |
60,300 |
|
|
Cold Metal Products, Inc. |
100 |
263 |
|
|
Commercial Metals Co. |
700 |
19,556 |
|
|
Gibraltar Steel Corp. |
300 |
5,250 |
|
|
Huntco, Inc. Class A (a) |
100 |
200 |
|
|
Insteel Industries, Inc. |
400 |
1,975 |
|
|
Keystone Consolidated Industries, Inc. (a) |
100 |
350 |
|
|
KRUG International Corp. (a) |
100 |
125 |
|
|
LTV Corp. |
30,000 |
54,375 |
|
|
Material Sciences Corp. (a) |
600 |
6,300 |
|
|
Mueller Industries, Inc. |
4,900 |
154,656 |
|
|
National Steel Corp. Class B |
1,400 |
5,688 |
|
|
Northwest Pipe Co. (a) |
400 |
5,050 |
|
|
NS Group, Inc. (a) |
700 |
12,338 |
|
|
Oregon Steel Mills, Inc. |
1,000 |
2,563 |
|
|
Roanoke Electric Steel Corp. |
350 |
4,200 |
|
|
Rouge Industries, Inc. Class A |
500 |
1,750 |
|
|
Schnitzer Steel Industries, Inc. Class A |
100 |
1,475 |
|
|
SEMX Corp. (a) |
6,100 |
35,075 |
|
|
Shiloh Industries, Inc. (a) |
400 |
2,950 |
|
|
SPS Technologies, Inc. (a) |
1,000 |
47,063 |
|
|
Steel Dynamics, Inc. (a) |
15,000 |
181,875 |
|
|
Steel Technologies, Inc. |
4,900 |
33,381 |
|
|
Sun Hydraulics Corp. (a) |
100 |
806 |
|
|
Titan International, Inc. |
700 |
3,544 |
|
|
Watts Industries, Inc. Class A |
1,500 |
16,875 |
|
|
Webco Industries, Inc. (a) |
100 |
256 |
|
|
Weirton Steel Corp. (a) |
9,000 |
28,688 |
|
|
WHX Corp. (a) |
3,100 |
11,819 |
|
|
|
1,187,228 |
||
|
Metals & Mining - 0.2% |
|||
|
Amcol International Corp. |
1,150 |
3,809 |
|
|
|
|||
|
Shares |
Value (Note 1) |
||
|
Belden, Inc. |
1,000 |
$ 26,125 |
|
|
Brush Engineered Materials, Inc. |
600 |
14,025 |
|
|
Castle A.M. & Co. |
400 |
4,200 |
|
|
Century Aluminum Co. |
2,000 |
26,125 |
|
|
Commonwealth Industries, Inc. |
2,300 |
11,644 |
|
|
CommScope, Inc. (a) |
5,100 |
127,181 |
|
|
Encore Wire Corp. (a) |
450 |
3,459 |
|
|
General Cable Corp. |
2,550 |
21,356 |
|
|
Hecla Mining Co. (a) |
10,800 |
9,450 |
|
|
IMCO Recycling, Inc. |
500 |
4,000 |
|
|
Kaiser Aluminum Corp. (a) |
2,400 |
13,650 |
|
|
Martin Marietta Materials, Inc. |
8,000 |
320,000 |
|
|
Matthews International Corp. Class A |
500 |
14,500 |
|
|
MAXXAM, Inc. (a) |
200 |
4,288 |
|
|
McMoRan Exploration Co. (a) |
88 |
913 |
|
|
Metals USA, Inc. |
1,200 |
5,775 |
|
|
Olympic Steel, Inc. (a) |
500 |
1,688 |
|
|
Optical Cable Corp. (a) |
5,200 |
204,750 |
|
|
Quanex Corp. |
600 |
11,213 |
|
|
Reliance Steel & Aluminum Co. |
1,500 |
30,938 |
|
|
RTI International Metals, Inc. (a) |
2,400 |
33,750 |
|
|
Ryerson Tull, Inc. |
764 |
7,210 |
|
|
Special Metals Corp. (a) |
200 |
675 |
|
|
Superior Telecom, Inc. |
4,460 |
37,631 |
|
|
Titanium Metals Corp. |
2,900 |
25,375 |
|
|
Tremont Corp. |
200 |
6,450 |
|
|
Wolverine Tube, Inc. (a) |
2,100 |
34,913 |
|
|
|
1,005,093 |
||
|
Packaging & Containers - 0.1% |
|||
|
Alltrista Corp. (a) |
100 |
2,181 |
|
|
BWAY Corp. (a) |
100 |
594 |
|
|
EarthShell Corp. (a) |
3,100 |
6,200 |
|
|
Gaylord Container Corp. Class A (a) |
1,700 |
4,675 |
|
|
Greif Brothers Corp. Class A |
900 |
25,988 |
|
|
Longview Fibre Co. |
1,800 |
20,475 |
|
|
Packaging Corp. of America |
16,700 |
195,181 |
|
|
Silgan Holdings, Inc. (a) |
500 |
4,375 |
|
|
Sonoco Products Co. |
15,350 |
296,447 |
|
|
U.S. Can Corp. (a) |
200 |
3,825 |
|
|
|
559,941 |
||
|
Paper & Forest Products - 0.5% |
|||
|
Albany International Corp. Class A |
1,045 |
14,565 |
|
|
American Pad & Paper Co. (a) |
400 |
18 |
|
|
Bowater, Inc. |
6,700 |
344,213 |
|
|
Buckeye Technologies, Inc. (a) |
1,000 |
24,938 |
|
|
Caraustar Industries, Inc. |
8,900 |
137,394 |
|
|
Chesapeake Corp. |
3,100 |
74,013 |
|
|
Consolidated Papers, Inc. |
16,100 |
632,931 |
|
|
Georgia-Pacific Corp. - Timber Group |
13,900 |
407,444 |
|
|
Mail-Well, Inc. (a) |
1,300 |
9,425 |
|
|
MCSi, Inc. (a) |
4,000 |
137,500 |
|
|
P.H. Glatfelter Co. |
1,300 |
13,650 |
|
|
Pope & Talbot, Inc. |
400 |
7,950 |
|
|
Common Stocks - continued |
|||
|
Shares |
Value (Note 1) |
||
|
BASIC INDUSTRIES - continued |
|||
|
Paper & Forest Products - continued |
|||
|
Precept Business Services, Inc. (a) |
600 |
$ 225 |
|
|
Rayonier, Inc. |
7,000 |
290,938 |
|
|
Rock-Tenn Co. Class A |
700 |
7,219 |
|
|
Smurfit-Stone Container Corp. (a) |
28,300 |
371,438 |
|
|
The St. Joe Co. |
6,400 |
187,600 |
|
|
Trex Co., Inc. (a) |
3,300 |
102,300 |
|
|
U.S. Timberlands Co. LP |
6,000 |
61,500 |
|
|
Wausau-Mosinee Paper Corp. |
1,840 |
16,330 |
|
|
Workflow Management, Inc. (a) |
3,201 |
18,806 |
|
|
|
2,860,397 |
||
|
TOTAL BASIC INDUSTRIES |
10,737,364 |
||
|
CONSTRUCTION & REAL ESTATE - 4.8% |
|||
|
Building Materials - 0.8% |
|||
|
Alpha Technologies Group, Inc. (a) |
4,700 |
61,688 |
|
|
Alyn Corp. (a) |
100 |
2 |
|
|
American Access Technologies, Inc. (a) |
3,100 |
18,503 |
|
|
American Standard Companies, Inc. (a) |
11,100 |
514,069 |
|
|
American Woodmark Corp. |
100 |
2,319 |
|
|
Ameron International Corp. |
100 |
3,375 |
|
|
Barnett, Inc. (a) |
1,400 |
17,413 |
|
|
Carlisle Companies, Inc. |
4,200 |
192,413 |
|
|
Centex Construction Products, Inc. |
900 |
23,231 |
|
|
Charles & Colvard Ltd. (a) |
600 |
2,775 |
|
|
Continental Materials Corp. (a) |
500 |
7,375 |
|
|
CoorsTek, Inc. (a) |
3,200 |
150,000 |
|
|
Dal-Tile International, Inc. (a) |
3,600 |
40,500 |
|
|
Drew Industries, Inc. (a) |
96 |
672 |
|
|
Elcor Corp. |
825 |
13,561 |
|
|
Fastenal Co. |
4,700 |
300,213 |
|
|
Ferro Corp. |
5,700 |
117,563 |
|
|
Florida Rock Industries, Inc. |
3,100 |
119,156 |
|
|
Flowserve Corp. |
2,700 |
49,950 |
|
|
Graphic Packaging International Corp. |
900 |
1,800 |
|
|
Hexcel Corp. (a) |
1,100 |
15,194 |
|
|
Huttig Building Products, Inc. (a) |
7,400 |
33,763 |
|
|
Industrial Holdings, Inc. (a) |
100 |
238 |
|
|
ITEQ, Inc. (a) |
300 |
150 |
|
|
Johns Manville Corp. |
26,700 |
333,750 |
|
|
Lafarge Corp. |
8,700 |
212,063 |
|
|
Lennox International, Inc. |
4,316 |
59,615 |
|
|
Lilly Industries, Inc. Class A |
3,600 |
110,250 |
|
|
Manitowoc Co., Inc. |
2,200 |
50,463 |
|
|
Mestek, Inc. |
100 |
1,694 |
|
|
Mobile Mini, Inc. (a) |
4,400 |
82,225 |
|
|
Nanophase Technologies Corp. (a) |
4,400 |
61,600 |
|
|
Nortek, Inc. (a) |
200 |
4,088 |
|
|
Park-Ohio Holdings Corp. (a) |
2,400 |
24,750 |
|
|
Penn Engineering & Manufacturing Corp. (non-vtg.) |
100 |
3,331 |
|
|
|
|||
|
Shares |
Value (Note 1) |
||
|
Questron Technology, Inc. (a) |
3,900 |
$ 20,231 |
|
|
Republic Group, Inc. |
400 |
7,125 |
|
|
Robbins & Myers, Inc. |
300 |
7,163 |
|
|
Rock of Ages Corp. Class A (a) |
600 |
3,300 |
|
|
ROHN Industries, Inc. (a) |
2,000 |
8,250 |
|
|
RPM, Inc. |
20,025 |
191,489 |
|
|
Selas Corp. of America |
100 |
563 |
|
|
Shaw Group (a) |
3,900 |
217,181 |
|
|
Southdown, Inc. |
6,764 |
424,441 |
|
|
Swiss Army Brands, Inc. (a) |
1,300 |
5,809 |
|
|
Tecumseh Products Co. Class A |
5,900 |
234,525 |
|
|
Texas Industries, Inc. |
4,500 |
153,563 |
|
|
Thermo TerraTech, Inc. (a) |
200 |
1,800 |
|
|
United Dominion Industries Ltd. |
1,879 |
30,327 |
|
|
Universal Forest Products, Inc. |
2,500 |
31,406 |
|
|
USG Corp. |
8,900 |
286,469 |
|
|
Watsco, Inc. |
1,300 |
16,575 |
|
|
West Pharmaceutical Services, Inc. |
479 |
9,969 |
|
|
York International Corp. |
5,000 |
124,375 |
|
|
|
4,404,313 |
||
|
Construction - 0.3% |
|||
|
American Homestar Corp. (a) |
500 |
656 |
|
|
Avatar Holdings, Inc. (a) |
1,100 |
21,175 |
|
|
Beazer Homes USA, Inc. (a) |
300 |
7,425 |
|
|
Butler Manufacturing Co. |
200 |
4,438 |
|
|
California Coastal Communities, Inc. |
2,900 |
15,950 |
|
|
Cavalier Homes, Inc. |
600 |
900 |
|
|
Clayton Homes, Inc. |
10,075 |
98,231 |
|
|
Crossman Communities, Inc. (a) |
1,700 |
31,131 |
|
|
D.R. Horton, Inc. |
10,250 |
201,156 |
|
|
Del Webb Corp. (a) |
1,900 |
42,513 |
|
|
Dominion Homes, Inc. (a) |
200 |
1,375 |
|
|
Emcor Group, Inc. (a) |
5,500 |
133,117 |
|
|
Engle Homes, Inc. |
500 |
7,688 |
|
|
Fleetwood Enterprises, Inc. |
3,800 |
52,013 |
|
|
Granite Construction, Inc. |
1,100 |
25,025 |
|
|
Jacobs Engineering Group, Inc. (a) |
6,200 |
235,600 |
|
|
Lennar Corp. |
12,414 |
342,937 |
|
|
M. D. C. Holdings, Inc. |
1,700 |
42,606 |
|
|
M/I Schottenstein Homes, Inc. |
200 |
3,938 |
|
|
Modtech Holdings, Inc. (a) |
425 |
4,170 |
|
|
NCI Building Systems, Inc. (a) |
1,100 |
19,388 |
|
|
NVR, Inc. (a) |
1,100 |
80,850 |
|
|
Oakwood Homes Corp. |
9,000 |
14,625 |
|
|
Palm Harbor Homes, Inc. (a) |
750 |
10,969 |
|
|
Ryland Group, Inc. |
1,900 |
46,669 |
|
|
Schuler Homes, Inc. (a) |
100 |
753 |
|
|
Skyline Corp. |
200 |
4,425 |
|
|
Southern Energy Homes, Inc. (a) |
400 |
512 |
|
|
Standard Pacific Corp. |
3,000 |
49,313 |
|
|
Toll Brothers, Inc. (a) |
4,700 |
153,338 |
|
|
Walter Industries, Inc. |
1,600 |
13,200 |
|
|
|
1,666,086 |
||
|
Common Stocks - continued |
|||
|
Shares |
Value (Note 1) |
||
|
CONSTRUCTION & REAL ESTATE - continued |
|||
|
Engineering - 0.3% |
|||
|
Able Telcom Holding Corp. (a) |
3,800 |
$ 11,875 |
|
|
Anthony & Sylvan Pools Corp. (a) |
33 |
256 |
|
|
Apogee Enterprises, Inc. |
800 |
3,550 |
|
|
Arguss Commu, Inc. (a) |
4,300 |
85,463 |
|
|
Biospherics, Inc. (a) |
400 |
2,750 |
|
|
Comfort Systems USA, Inc. (a) |
1,200 |
6,600 |
|
|
DSP Group, Inc. (a) |
2,400 |
111,000 |
|
|
DualStar Technologies Corp. (a) |
5,900 |
18,991 |
|
|
Dycom Industries, Inc. (a) |
5,425 |
287,525 |
|
|
Encompass Services Corp. (a) |
406 |
2,233 |
|
|
Harris Interactive, Inc. |
4,200 |
17,325 |
|
|
Jupiter Communications, Inc. |
3,700 |
88,106 |
|
|
MasTec, Inc. (a) |
7,200 |
259,200 |
|
|
Morrison Knudsen Corp. (a) |
1,000 |
12,000 |
|
|
NetRatings, Inc. |
2,800 |
48,475 |
|
|
Noble International Ltd. |
2,600 |
22,913 |
|
|
Primark Corp. (a) |
4,894 |
181,078 |
|
|
Quanta Services, Inc. (a) |
6,850 |
320,238 |
|
|
Stone & Webster, Inc. |
2,100 |
2,756 |
|
|
Tetra Tech, Inc. (a) |
8,107 |
219,902 |
|
|
URS Corp. (a) |
500 |
6,594 |
|
|
ViaSource Communications, Inc. |
11,300 |
107,350 |
|
|
VSI Holdings, Inc. (a) |
100 |
388 |
|
|
|
1,816,568 |
||
|
Real Estate - 0.2% |
|||
|
American Realty Investments, Inc. (a) |
91 |
882 |
|
|
Bluegreen Corp. (a) |
800 |
2,900 |
|
|
Catellus Development Corp. (a) |
20,800 |
371,800 |
|
|
CB Richard Ellis Services, Inc. (a) |
1,500 |
15,750 |
|
|
Consolidated-Tomoka Land Co. |
2,000 |
24,375 |
|
|
Crescent Operating, Inc. (a) |
100 |
169 |
|
|
Fairfield Communities, Inc. (a) |
7,600 |
60,800 |
|
|
Forest City Enterprises, Inc. Class A |
1,600 |
56,000 |
|
|
Getty Realty Corp. |
400 |
4,700 |
|
|
Grubb & Ellis Co. (a) |
700 |
4,288 |
|
|
Hovnanian Enterprises, Inc. Class A (a) |
100 |
719 |
|
|
Insignia Financial Group, Inc. (a) |
1,266 |
11,948 |
|
|
Iron Mountain, Inc. (a) |
6,930 |
236,486 |
|
|
Jones Lang LaSalle, Inc. (a) |
2,400 |
34,950 |
|
|
Kennedy-Wilson, Inc. (a) |
2,000 |
13,250 |
|
|
LNR Property Corp. |
800 |
17,000 |
|
|
Merry Land Properties, Inc. (a) |
65 |
358 |
|
|
Newhall Land & Farming Co. |
2,700 |
66,488 |
|
|
Plains All American Pipeline LP |
4,900 |
92,488 |
|
|
ResortQuest International, Inc. (a) |
1,600 |
9,400 |
|
|
Silverleaf Resorts, Inc. (a) |
100 |
350 |
|
|
Stewart Enterprises, Inc. Class A |
23,000 |
73,313 |
|
|
Stratus Properties, Inc. (a) |
100 |
466 |
|
|
Trammell Crow Co. (a) |
3,000 |
41,625 |
|
|
Trendwest Resorts, Inc. (a) |
1,000 |
19,125 |
|
|
|
|||
|
Shares |
Value (Note 1) |
||
|
Vornado Operating Co. (a) |
81 |
$ 547 |
|
|
Wellsford Real Properties, Inc. (a) |
312 |
5,967 |
|
|
|
1,166,144 |
||
|
Real Estate Investment Trusts - 3.2% |
|||
|
Acadia Realty Trust |
100 |
606 |
|
|
Alexander's, Inc. (a) |
100 |
8,075 |
|
|
Alexandria Real Estate Equities, Inc. |
400 |
14,000 |
|
|
AMB Property Corp. |
7,800 |
188,663 |
|
|
American Real Estate Partners LP (a) |
200 |
1,763 |
|
|
AMLI Residential Properties Trust (SBI) |
500 |
12,375 |
|
|
Annaly Mortgage Management, Inc. |
3,500 |
29,531 |
|
|
Anthracite Capital, Inc. |
300 |
2,250 |
|
|
Apartment Investment & |
11,317 |
507,850 |
|
|
Archstone Communities Trust |
22,500 |
554,063 |
|
|
Arden Realty Group, Inc. |
12,700 |
323,850 |
|
|
Associated Estates Realty Corp. |
700 |
5,425 |
|
|
Avalonbay Communities, Inc. |
11,114 |
496,657 |
|
|
Banyan Strategic Realty Trust (SBI) |
100 |
575 |
|
|
Bedford Property Investors, Inc. |
100 |
1,944 |
|
|
Boston Properties, Inc. |
11,600 |
469,075 |
|
|
Boykin Lodging Co. |
500 |
4,969 |
|
|
Bradley Real Estate, Inc. (SBI) |
1,700 |
37,188 |
|
|
Brandywine Realty Trust |
1,100 |
22,550 |
|
|
BRE Properties, Inc. Class A |
9,800 |
286,038 |
|
|
Burnham Pacific Properties, Inc. |
400 |
2,400 |
|
|
Cabot Industrial Trust |
1,800 |
35,325 |
|
|
Camden Property Trust (SBI) |
3,151 |
94,333 |
|
|
Capital Automotive |
10,200 |
141,525 |
|
|
Capstead Mortgage Corp. |
698 |
5,977 |
|
|
Captec Net Lease Realty, Inc. |
7,200 |
75,150 |
|
|
CarrAmerica Realty Corp. |
12,700 |
369,094 |
|
|
CBL & Associates Properties, Inc. |
900 |
21,488 |
|
|
Center Trust, Inc. |
800 |
4,600 |
|
|
CenterPoint Properties Trust |
800 |
35,050 |
|
|
Charles E. Smith Residential Realty, Inc. |
900 |
37,013 |
|
|
Chateau Communities, Inc. |
1,200 |
31,200 |
|
|
Chelsea GCA Realty, Inc. |
500 |
16,781 |
|
|
Colonial Properties Trust (SBI) |
2,600 |
69,550 |
|
|
Commercial Net Lease Realty, Inc. |
1,000 |
10,438 |
|
|
Corporate Office Properties Trust |
100 |
900 |
|
|
Cousins Properties, Inc. |
2,200 |
90,475 |
|
|
Crescent Real Estate Equities Co. |
20,300 |
449,138 |
|
|
Criimi Mae, Inc. |
2,260 |
3,814 |
|
|
Crown American Realty Trust |
900 |
5,344 |
|
|
Developers Diversified Realty Corp. |
15,600 |
226,200 |
|
|
Duke-Weeks Realty Corp. |
21,128 |
501,790 |
|
|
Dynex Capital, Inc. |
375 |
539 |
|
|
Eastgroup Properties, Inc. |
500 |
10,938 |
|
|
Entertainment Properties Trust |
11,300 |
122,888 |
|
|
Equity Inns, Inc. |
11,300 |
72,038 |
|
|
Equity Office Properties Trust |
42,587 |
1,229,700 |
|
|
Equity Residential Properties Trust (SBI) |
18,889 |
906,672 |
|
|
Common Stocks - continued |
|||
|
Shares |
Value (Note 1) |
||
|
CONSTRUCTION & REAL ESTATE - continued |
|||
|
Real Estate Investment Trusts - continued |
|||
|
Essex Property Trust, Inc. |
600 |
$ 29,513 |
|
|
Federal Realty Investment Trust (SBI) |
1,800 |
36,000 |
|
|
FelCor Lodging Trust, Inc. |
10,105 |
224,836 |
|
|
First Industrial Realty Trust, Inc. |
8,800 |
261,250 |
|
|
First Union Real Estate Equity & Mortgage Investments |
1,480 |
3,978 |
|
|
Franchise Finance Corp. of America |
4,100 |
92,250 |
|
|
Gables Residential Trust (SBI) |
1,000 |
27,750 |
|
|
General Growth Properties, Inc. |
10,200 |
327,675 |
|
|
Glenborough Realty Trust, Inc. |
10,200 |
189,975 |
|
|
Glimcher Realty Trust (SBI) |
800 |
12,300 |
|
|
Great Lakes REIT, Inc. |
200 |
3,838 |
|
|
Health Care Property Investors, Inc. |
3,824 |
100,619 |
|
|
Health Care REIT, Inc. |
6,700 |
121,019 |
|
|
Healthcare Realty Trust, Inc. |
10,066 |
198,804 |
|
|
Highwoods Properties, Inc. |
12,400 |
298,375 |
|
|
Home Properties of New York, Inc. |
600 |
17,813 |
|
|
Hospitality Properties Trust (SBI) |
8,600 |
199,950 |
|
|
Host Marriott Corp. |
39,200 |
418,950 |
|
|
HRPT Properties Trust |
34,100 |
232,306 |
|
|
Humphrey Hospitality Trust (REIT) |
130 |
1,040 |
|
|
Impac Mortgage Holdings, Inc. |
700 |
1,881 |
|
|
Innkeepers USA Trust |
7,100 |
73,663 |
|
|
IRT Property Co. |
1,000 |
8,813 |
|
|
iStar Financial, Inc. |
8,758 |
183,371 |
|
|
Jameson Inns, Inc. |
100 |
738 |
|
|
JDN Realty Corp. |
13,000 |
134,063 |
|
|
JP Realty, Inc. |
500 |
8,875 |
|
|
Kilroy Realty Corp. |
900 |
22,388 |
|
|
Kimco Realty Corp. |
10,700 |
434,688 |
|
|
Koger Equity, Inc. |
200 |
3,425 |
|
|
Konover Property Trust, Inc. |
100 |
419 |
|
|
Kramont Realty Trust |
100 |
994 |
|
|
Lexington Corporate Properties Trust |
100 |
1,138 |
|
|
Liberty Property Trust (SBI) |
13,100 |
342,238 |
|
|
LTC Properties, Inc. |
200 |
813 |
|
|
Macerich Co. |
1,500 |
31,406 |
|
|
Mack-Cali Realty Corp. |
11,800 |
309,013 |
|
|
Manufactured Home Communities, Inc. |
800 |
18,900 |
|
|
Meditrust Corp. unit |
30,134 |
69,685 |
|
|
MeriStar Hospitality Corp. |
11,154 |
246,782 |
|
|
MGI Properties, Inc. |
400 |
925 |
|
|
Mid-America Apartment |
700 |
16,931 |
|
|
Mills Corp. |
4,900 |
88,813 |
|
|
National Golf Properties, Inc. |
400 |
8,200 |
|
|
National Health Investors, Inc. |
200 |
1,475 |
|
|
Nationwide Health Properties, Inc. |
1,400 |
20,213 |
|
|
New Plan Excel Realty Trust |
18,240 |
251,940 |
|
|
Omega Healthcare Investors, Inc. |
9,400 |
56,988 |
|
|
Pacific Gulf Properties, Inc. |
6,000 |
167,625 |
|
|
|
|||
|
Shares |
Value (Note 1) |
||
|
Pan Pacific Retail Properties, Inc. |
600 |
$ 11,438 |
|
|
Parkway Properties, Inc. |
100 |
3,175 |
|
|
Pennsylvania Real Estate Investment Trust |
400 |
6,975 |
|
|
Pinnacle Holdings, Inc. (a) |
6,400 |
257,600 |
|
|
Post Properties, Inc. |
7,600 |
321,575 |
|
|
Prentiss Properties Trust (SBI) |
6,100 |
148,306 |
|
|
Prime Retail, Inc. |
479 |
329 |
|
|
Prison Realty Corp. |
17,725 |
42,097 |
|
|
ProLogis Trust |
25,820 |
590,633 |
|
|
PS Business Parks, Inc. |
100 |
2,650 |
|
|
Public Storage, Inc. |
20,872 |
508,755 |
|
|
Realty Income Corp. |
800 |
18,200 |
|
|
Reckson Associates Realty Corp. |
10,500 |
255,281 |
|
|
Redwood Trust, Inc. |
300 |
4,744 |
|
|
Regency Realty Corp. |
3,800 |
85,975 |
|
|
RFS Hotel Investors, Inc. |
900 |
11,250 |
|
|
Saul Centers, Inc. |
100 |
1,581 |
|
|
Senior Housing Properties Trust (REIT) |
940 |
8,578 |
|
|
Shurgard Storage Centers, Inc. Class A |
1,200 |
28,575 |
|
|
Simon Property Group, Inc. |
26,100 |
595,406 |
|
|
SL Green Realty Corp. |
600 |
16,088 |
|
|
Sovran Self Storage, Inc. |
400 |
7,775 |
|
|
Spieker Properties, Inc. |
10,500 |
573,563 |
|
|
Storage USA, Inc. |
1,500 |
45,188 |
|
|
Summit Properties, Inc. |
1,100 |
25,575 |
|
|
Sun Communities, Inc. |
500 |
15,469 |
|
|
Tanger Factory Outlet Centers, Inc. |
100 |
2,106 |
|
|
Taubman Centers, Inc. |
1,700 |
18,594 |
|
|
The Rouse Co. |
13,800 |
332,925 |
|
|
Thornburg Mortgage, Inc. |
600 |
4,913 |
|
|
Town & Country Trust |
500 |
8,844 |
|
|
United Dominion Realty Trust, Inc. |
8,300 |
89,744 |
|
|
Universal Health Realty Income Trust |
100 |
1,756 |
|
|
Urban Shopping Centers, Inc. |
500 |
17,469 |
|
|
Ventas, Inc. (a) |
2,000 |
9,875 |
|
|
Vornado Realty Trust |
14,224 |
526,288 |
|
|
Washington (SBI) |
700 |
13,431 |
|
|
Weingarten Realty Investors (SBI) |
1,600 |
64,800 |
|
|
Western Properties Trust |
500 |
5,813 |
|
|
Westfield America, Inc. |
4,500 |
67,219 |
|
|
Winston Hotels, Inc. |
500 |
4,344 |
|
|
Wyndham International, Inc. Class A (a) |
7,215 |
15,332 |
|
|
|
17,612,685 |
||
|
TOTAL CONSTRUCTION & REAL ESTATE |
26,665,796 |
||
|
DURABLES - 3.3% |
|||
|
Autos, Tires, & Accessories - 0.7% |
|||
|
Aftermarket Technology Corp. (a) |
700 |
4,288 |
|
|
Amcast Industrial Corp. |
1,000 |
12,000 |
|
|
ArvinMeritor, Inc. |
12,450 |
205,425 |
|
|
AutoNation, Inc. |
45,200 |
293,800 |
|
|
Aviation Sales Co. (a) |
2,600 |
13,000 |
|
|
Bandag, Inc. |
2,300 |
74,894 |
|
|
Common Stocks - continued |
|||
|
Shares |
Value (Note 1) |
||
|
DURABLES - continued |
|||
|
Autos, Tires, & Accessories - continued |
|||
|
Borg-Warner Automotive, Inc. |
6,100 |
$ 209,688 |
|
|
Boyds Wheels, Inc. (a) |
800 |
56 |
|
|
Breed Technologies, Inc. (a) |
2,500 |
500 |
|
|
Casey's General Stores, Inc. |
14,400 |
163,800 |
|
|
CLARCOR, Inc. |
1,550 |
31,969 |
|
|
Colonels International, Inc. (a) |
200 |
1,000 |
|
|
Copart, Inc. (a) |
5,400 |
91,463 |
|
|
CSK Auto Corp. (a) |
2,800 |
15,225 |
|
|
Discount Auto Parts, Inc. (a) |
1,400 |
12,425 |
|
|
Donnelly Corp. Class A |
100 |
1,388 |
|
|
Dura Automotive Systems, Inc. |
8,544 |
91,848 |
|
|
Evans Systems, Inc. (a) |
3,400 |
2,380 |
|
|
Federal Signal Corp. |
8,200 |
176,813 |
|
|
Federal-Mogul Corp. |
11,300 |
116,531 |
|
|
Fidelity Holdings, Inc. (a) |
7,100 |
9,541 |
|
|
GenTek, Inc. |
480 |
7,320 |
|
|
Gentex Corp. (a) |
12,600 |
326,025 |
|
|
Getty Petroleum Marketing, Inc. (a) |
100 |
388 |
|
|
Giant Industries, Inc. (a) |
87 |
587 |
|
|
Hayes Lemmerz International, Inc. (a) |
900 |
11,588 |
|
|
IMPCO Technologies, Inc. (a) |
3,100 |
74,594 |
|
|
Intermet Corp. |
3,100 |
24,025 |
|
|
Keystone Automotive Industries, Inc. (a) |
3,200 |
18,000 |
|
|
Lear Corp. (a) |
8,800 |
189,750 |
|
|
Lithia Motors, Inc. Class A (a) |
900 |
11,025 |
|
|
Lufkin Industries, Inc. |
200 |
3,763 |
|
|
Mascotech, Inc. |
8,700 |
144,094 |
|
|
McLaren Automotive Group, Inc. (a) |
300 |
563 |
|
|
Midas, Inc. |
1,400 |
23,800 |
|
|
Miller Industries, Inc. (a) |
1,500 |
2,156 |
|
|
Modine Manufacturing Co. |
900 |
25,313 |
|
|
Monaco Coach Corp. (a) |
600 |
10,500 |
|
|
Monro Muffler Brake, Inc. (a) |
1,105 |
11,188 |
|
|
NACCO Industries, Inc. Class A |
3,700 |
173,438 |
|
|
O'Reilly Automotive, Inc. (a) |
11,000 |
167,750 |
|
|
Oshkosh Truck Co. |
3,850 |
136,675 |
|
|
Raytech Corp. (a) |
100 |
300 |
|
|
Simpson Industries, Inc. |
600 |
5,850 |
|
|
Sonic Automotive, Inc. Class A (a) |
2,700 |
28,519 |
|
|
Spartan Motors, Inc. |
100 |
266 |
|
|
SPX Corp. (a) |
4,400 |
721,600 |
|
|
Standard Motor Products, Inc. |
1,000 |
9,688 |
|
|
Strattec Security Corp. (a) |
1,000 |
34,625 |
|
|
Superior Industries International, Inc. |
6,200 |
201,113 |
|
|
Supreme Industries, Inc. Class A |
100 |
475 |
|
|
TBC Corp. (a) |
700 |
3,894 |
|
|
Tower Automotive, Inc. (a) |
7,100 |
80,763 |
|
|
Ugly Duckling Corp. (a) |
200 |
1,388 |
|
|
|
|||
|
Shares |
Value (Note 1) |
||
|
United Auto Group, Inc. (a) |
1,800 |
$ 15,188 |
|
|
Wabash National Corp. |
700 |
7,788 |
|
|
|
4,002,033 |
||
|
Consumer Durables - 0.2% |
|||
|
Ballantyne of Omaha, Inc. (a) |
530 |
629 |
|
|
Blyth, Inc. |
7,700 |
180,469 |
|
|
Boyds Collection, Ltd. (a) |
6,000 |
53,250 |
|
|
Daktronics, Inc. (a) |
3,200 |
44,800 |
|
|
Department 56, Inc. (a) |
2,600 |
35,263 |
|
|
Dupont Photomasks, Inc. (a) |
3,200 |
242,800 |
|
|
Libbey, Inc. |
800 |
26,250 |
|
|
Lifetime Hoan Corp. |
100 |
650 |
|
|
Mikasa, Inc. |
2,200 |
21,313 |
|
|
Oneida Ltd. |
450 |
6,188 |
|
|
Printrak International, Inc. (a) |
100 |
1,175 |
|
|
SAF T LOK, Inc. (a) |
17,000 |
17,531 |
|
|
Shuffle Master, Inc. (a) |
4,300 |
74,175 |
|
|
Simpson Manufacturing Co. Ltd. (a) |
900 |
42,300 |
|
|
Sola International, Inc. (a) |
1,600 |
11,200 |
|
|
|
757,993 |
||
|
Consumer Electronics - 1.6% |
|||
|
American Technology Corp. (a) |
1,600 |
8,000 |
|
|
Applica, Inc. (a) |
2,700 |
28,013 |
|
|
Audible, Inc. |
4,200 |
7,350 |
|
|
Boston Acoustics, Inc. |
200 |
2,475 |
|
|
Digital Video Systems, Inc. (a) |
1,400 |
10,413 |
|
|
Fossil, Inc. (a) |
5,825 |
101,573 |
|
|
Gemstar-TV Guide International, Inc. (a) |
54,800 |
4,945,700 |
|
|
General Motors Corp. Class H |
87,800 |
2,908,375 |
|
|
Harman International Industries, Inc. |
2,900 |
222,575 |
|
|
Movado Group, Inc. |
5,600 |
78,400 |
|
|
National Presto Industries, Inc. |
900 |
27,394 |
|
|
Odetics, Inc. Class B |
4,600 |
64,975 |
|
|
Parkervision, Inc. (a) |
2,800 |
119,000 |
|
|
Recoton Corp. (a) |
4,300 |
61,006 |
|
|
Royal Appliance Manufacturing Co. (a) |
600 |
4,088 |
|
|
Salton, Inc. (a) |
1,350 |
50,794 |
|
|
Sunbeam Corp. (a) |
4,208 |
8,153 |
|
|
Sunbeam Corp. warrants 8/24/03 (a) |
610 |
0 |
|
|
TrueTime, Inc. |
3,000 |
12,375 |
|
|
U.S. Industries, Inc. |
9,960 |
126,990 |
|
|
Universal Electronics, Inc. (a) |
4,200 |
99,553 |
|
|
|
8,887,202 |
||
|
Home Furnishings - 0.3% |
|||
|
Bassett Furniture Industries, Inc. |
1,600 |
22,000 |
|
|
Bush Industries, Inc. Class A. |
1,400 |
18,200 |
|
|
Chromcraft Revington, Inc. (a) |
1,500 |
16,688 |
|
|
Craftmade International, Inc. |
1,100 |
8,731 |
|
|
Ethan Allen Interiors, Inc. |
5,100 |
137,381 |
|
|
Falcon Products, Inc. |
1,200 |
11,700 |
|
|
Flexsteel Industries, Inc. |
900 |
11,025 |
|
|
Furniture Brands International, Inc. (a) |
6,300 |
101,588 |
|
|
Common Stocks - continued |
|||
|
Shares |
Value (Note 1) |
||
|
DURABLES - continued |
|||
|
Home Furnishings - continued |
|||
|
Haverty Furniture Companies, Inc. |
2,000 |
$ 23,125 |
|
|
Heilig-Meyers Co. |
1,800 |
342 |
|
|
Herman Miller, Inc. |
13,300 |
424,769 |
|
|
Hillenbrand Industries, Inc. |
4,300 |
149,694 |
|
|
HON Industries, Inc. |
7,000 |
188,563 |
|
|
Kimball International, Inc. Class B |
1,300 |
22,100 |
|
|
La-Z-Boy, Inc. |
7,106 |
114,140 |
|
|
Linens'n Things, Inc. (a) |
4,300 |
116,100 |
|
|
Mity-Lite, Inc. (a) |
700 |
7,044 |
|
|
Restoration Hardware, Inc. (a) |
6,200 |
35,650 |
|
|
Rowe Furniture Corp. |
2,010 |
8,919 |
|
|
Select Comfort Corp. (a) |
2,600 |
5,525 |
|
|
Stanley Furniture Co., Inc. (a) |
1,000 |
27,125 |
|
|
Steelcase, Inc. Class A |
8,000 |
132,500 |
|
|
TAB Products Co. |
1,100 |
4,675 |
|
|
The Bombay Company, Inc. (a) |
18,700 |
50,256 |
|
|
Virco Manufacturing Co. |
1,441 |
18,553 |
|
|
|
1,656,393 |
||
|
Textiles & Apparel - 0.5% |
|||
|
Active Apparel Group, Inc. (a) |
200 |
975 |
|
|
Ashworth, Inc. (a) |
600 |
3,319 |
|
|
BEBE Stores, Inc. (a) |
5,600 |
87,850 |
|
|
Brown Shoe Co., Inc. |
1,400 |
15,050 |
|
|
Burlington Industries, Inc. (a) |
2,000 |
3,500 |
|
|
Candies, Inc. (a) |
700 |
875 |
|
|
Collins & Aikman Corp. (a) |
1,800 |
9,338 |
|
|
Columbia Sportswear Co. (a) |
1,600 |
65,400 |
|
|
Cone Mills Corp. (a) |
800 |
3,500 |
|
|
Converse, Inc. (a) |
200 |
194 |
|
|
Crown Crafts, Inc. |
100 |
50 |
|
|
Culp, Inc. |
100 |
425 |
|
|
Cutter & Buck, Inc. (a) |
5,500 |
74,250 |
|
|
Deckers Outdoor Corp. (a) |
100 |
544 |
|
|
Delta Apparel, Inc. (a) |
80 |
820 |
|
|
Delta Woodside Industries |
800 |
1,300 |
|
|
Dixie Group, Inc. (a) |
1,800 |
7,200 |
|
|
Donna Karan International, Inc. (a) |
700 |
4,244 |
|
|
Duck Head Apparel Co., Inc. (a) |
80 |
80 |
|
|
Durango Apparel, Inc. (a) |
100 |
4 |
|
|
Dyersburg Corp. (a) |
100 |
9 |
|
|
Florsheim Group, Inc. (a) |
100 |
88 |
|
|
G-III Apparel Group Ltd. (a) |
1,200 |
7,950 |
|
|
Galey & Lord, Inc. (a) |
400 |
1,775 |
|
|
Guilford Mills, Inc. |
700 |
2,450 |
|
|
Haggar Corp. |
300 |
3,694 |
|
|
Hartmarx Corp. (a) |
1,100 |
3,300 |
|
|
Interface, Inc. Class A |
8,100 |
56,194 |
|
|
Jones Apparel Group, Inc. (a) |
19,101 |
467,975 |
|
|
Jos. A. Bank Clothiers, Inc. (a) |
100 |
403 |
|
|
K-Swiss, Inc. Class A |
5,200 |
117,000 |
|
|
Kellwood Co. |
7,200 |
115,200 |
|
|
|
|||
|
Shares |
Value (Note 1) |
||
|
Madden Steven Ltd. (a) |
7,900 |
$ 97,269 |
|
|
Maxwell Shoe, Inc. Class A (a) |
2,500 |
26,250 |
|
|
McNaughton Apparel Group, Inc. (a) |
100 |
1,600 |
|
|
Mohawk Industries, Inc. (a) |
7,000 |
166,250 |
|
|
Mossimo, Inc. (a) |
800 |
1,050 |
|
|
Nautica Enterprises, Inc. (a) |
10,100 |
119,306 |
|
|
Oshkosh B'Gosh, Inc. Class A |
1,330 |
18,953 |
|
|
Oxford Industries, Inc. |
100 |
2,213 |
|
|
Pacific Sunwear of California, Inc. (a) |
2,400 |
31,950 |
|
|
Phillips-Van Heusen Corp. |
900 |
8,213 |
|
|
Pillowtex Corp. |
4,926 |
12,007 |
|
|
Polo Ralph Lauren Corp. Class A (a) |
7,400 |
143,375 |
|
|
Polymer Group, Inc. |
5,800 |
40,600 |
|
|
Quaker Fabric Corp. (a) |
850 |
4,303 |
|
|
Quiksilver, Inc. (a) |
1,250 |
18,594 |
|
|
R.G. Barry Corp. (a) |
100 |
319 |
|
|
Rocky Shoes Boots, Inc. (a) |
100 |
525 |
|
|
Samsonite Corp. (a) |
2,743 |
11,829 |
|
|
Saucony, Inc. (a) |
1,400 |
13,475 |
|
|
Shaw Industries, Inc. |
17,909 |
222,743 |
|
|
Skechers U.S.A., Inc. Class A, (a) |
5,300 |
94,406 |
|
|
Sport-Haley, Inc. (a) |
100 |
325 |
|
|
Stride Rite Corp. |
4,400 |
26,400 |
|
|
Superior Uniform Group, Inc. |
100 |
763 |
|
|
Tarrant Apparel Group (a) |
1,600 |
12,300 |
|
|
Timberland Co. Class A (a) |
3,300 |
134,475 |
|
|
Tropical Sportswear |
900 |
16,256 |
|
|
U.S. Home & Garden, Inc. (a) |
2,900 |
6,706 |
|
|
Unifi, Inc. (a) |
4,800 |
54,300 |
|
|
Vans, Inc. (a) |
6,400 |
100,000 |
|
|
Warnaco Group, Inc. Class A |
12,664 |
63,320 |
|
|
WestPoint Stevens, Inc. |
10,300 |
144,844 |
|
|
Wolverine World Wide, Inc. |
1,300 |
14,219 |
|
|
Worldtex, Inc. (a) |
100 |
31 |
|
|
|
2,664,125 |
||
|
TOTAL DURABLES |
17,967,746 |
||
|
ENERGY - 3.7% |
|||
|
Coal - 0.0% |
|||
|
Arch Coal, Inc. |
1,300 |
9,750 |
|
|
CONSOL Energy, Inc. |
5,600 |
116,550 |
|
|
|
126,300 |
||
|
Energy Services - 2.0% |
|||
|
Atwood Oceanics, Inc. (a) |
4,300 |
195,113 |
|
|
BJ Services Co. (a) |
9,200 |
616,400 |
|
|
Cal Dive International, Inc. (a) |
3,800 |
218,500 |
|
|
Carbo Ceramics, Inc. |
300 |
10,894 |
|
|
Dawson Geophysical Co. (a) |
200 |
2,025 |
|
|
Diamond Offshore Drilling, Inc. |
18,000 |
806,625 |
|
|
Eagle Geophysical, Inc. (a) |
639 |
3 |
|
|
ENSCO International, Inc. |
16,100 |
641,988 |
|
|
Common Stocks - continued |
|||
|
Shares |
Value (Note 1) |
||
|
ENERGY - continued |
|||
|
Energy Services - continued |
|||
|
Global Industries Ltd. (a) |
19,400 |
$ 241,288 |
|
|
Global Marine, Inc. (a) |
18,800 |
607,475 |
|
|
Grey Wolf, Inc. (a) |
7,500 |
41,250 |
|
|
Hanover Compressor Co. (a) |
9,400 |
298,450 |
|
|
Helmerich & Payne, Inc. |
8,900 |
328,744 |
|
|
Input/Output, Inc. (a) |
1,600 |
14,400 |
|
|
Kaneb Services, Inc. (a) |
200 |
900 |
|
|
Key Energy Group, Inc. (a) |
8,400 |
87,150 |
|
|
Layne Christensen Co. (a) |
100 |
450 |
|
|
Lone Star Technologies, Inc. (a) |
5,100 |
256,275 |
|
|
Marine Drilling Companies, Inc. (a) |
4,100 |
111,469 |
|
|
Maverick Tube Corp. (a) |
4,800 |
134,700 |
|
|
Nabors Industries, Inc. (a) |
16,596 |
789,347 |
|
|
Noble Drilling Corp. (a) |
14,700 |
712,950 |
|
|
Oceaneering International, Inc. (a) |
3,800 |
66,263 |
|
|
Offshore Logistics, Inc. (a) |
9,600 |
166,800 |
|
|
Parker Drilling Co. (a) |
24,900 |
178,969 |
|
|
Patterson Energy, Inc. (a) |
7,300 |
229,038 |
|
|
Powell Industries, Inc. (a) |
100 |
950 |
|
|
Pride International, Inc. (a) |
12,900 |
317,663 |
|
|
R&B Falcon Corp. (a) |
21,340 |
608,190 |
|
|
RPC, Inc. |
900 |
9,900 |
|
|
Santa Fe International Corp. |
19,500 |
766,594 |
|
|
SEACOR SMIT, Inc. (a) |
4,200 |
191,363 |
|
|
Seitel, Inc. (a) |
8,500 |
133,344 |
|
|
Smith International, Inc. (a) |
5,100 |
405,450 |
|
|
Superior Energy Services, Inc. (a) |
17,500 |
192,500 |
|
|
TETRA Technologies, Inc. (a) |
400 |
5,450 |
|
|
Tidewater, Inc. |
6,600 |
266,475 |
|
|
Unit Corp. (a) |
4,300 |
67,188 |
|
|
UTI Energy Corp. (a) |
4,500 |
167,625 |
|
|
Varco International, Inc. (a) |
18,075 |
364,889 |
|
|
Weatherford International, Inc. |
13,062 |
613,098 |
|
|
Zapata Corp. |
800 |
2,550 |
|
|
|
10,870,695 |
||
|
Oil & Gas - 1.7% |
|||
|
3Tec Energy Corp. (a) |
6,900 |
113,850 |
|
|
American International |
100 |
53 |
|
|
APCO Argentina, Inc. |
100 |
2,350 |
|
|
Barrett Resources Corp. (a) |
6,900 |
238,913 |
|
|
Basin Exploration, Inc. (a) |
6,400 |
128,000 |
|
|
Belco Oil & Gas Corp. (a) |
1,000 |
9,125 |
|
|
Bellwether Exploration Co. (a) |
11,400 |
90,844 |
|
|
Benton Oil & Gas Co. (a) |
1,100 |
2,338 |
|
|
Berry Petroleum Co. Class A |
300 |
5,700 |
|
|
BP Prudhoe Bay Royalty Trust |
200 |
2,513 |
|
|
Brigham Exploration Co. (a) |
100 |
222 |
|
|
Buckeye Partners LP |
800 |
22,500 |
|
|
Cabot Oil & Gas Corp. Class A |
7,500 |
150,000 |
|
|
Carrizo Oil & Gas, Inc. (a) |
100 |
1,075 |
|
|
|
|||
|
Shares |
Value (Note 1) |
||
|
Castle Energy Corp. |
900 |
$ 6,553 |
|
|
Chesapeake Energy Corp. (a) |
25,798 |
196,710 |
|
|
Comstock Resources, Inc. (a) |
1,000 |
9,938 |
|
|
Cooper Cameron Corp. (a) |
5,300 |
412,406 |
|
|
Costilla Energy, Inc. (a) |
100 |
1 |
|
|
Cross Timbers Oil Co. |
9,650 |
255,122 |
|
|
Crown Central Petroleum Corp. |
100 |
931 |
|
|
Denbury Resources, Inc. (a) |
400 |
2,718 |
|
|
Edge Petroleum Corp. (a) |
1,200 |
4,200 |
|
|
EEX Corp. (a) |
1,400 |
7,700 |
|
|
Enterprise Products Partners LP |
800 |
20,450 |
|
|
EOG Resources, Inc. |
14,500 |
554,625 |
|
|
Evergreen Resources, Inc. (a) |
5,400 |
157,613 |
|
|
Forest Oil Corp. (a) |
5,800 |
88,813 |
|
|
Friede Goldman Halter, Inc. (a) |
3,168 |
17,820 |
|
|
Frontier Oil Corp. (a) |
500 |
3,563 |
|
|
FX Energy, Inc. (a) |
500 |
2,000 |
|
|
Gothic Energy Corp. (a) |
300 |
389 |
|
|
Grant Prideco, Inc. (a) |
14,362 |
337,507 |
|
|
Greka Energy Corp. (a) |
16 |
190 |
|
|
Gulf Island Fabrication, Inc. (a) |
6,800 |
125,800 |
|
|
Hallwood Energy Corp. |
74 |
648 |
|
|
Harken Energy Corp. (a) |
4,400 |
3,575 |
|
|
Holly Corp. |
300 |
3,863 |
|
|
Houston Exploration Co. (a) |
700 |
18,113 |
|
|
HS Resources, Inc. (a) |
4,900 |
155,269 |
|
|
Hugoton Royalty Trust |
2,700 |
34,594 |
|
|
Inland Resources, Inc. (a) |
10 |
46 |
|
|
Key Production Co., Inc. (a) |
100 |
1,800 |
|
|
Louis Dreyfus Natural Gas Corp. (a) |
8,600 |
298,850 |
|
|
Magnum Hunter Resources, Inc. (a) |
900 |
6,975 |
|
|
Magnum Hunter Resources, Inc. |
300 |
600 |
|
|
Mallon Resources Corp. (a) |
500 |
3,438 |
|
|
Markwest Hydrocarbon, Inc. (a) |
100 |
913 |
|
|
Meridian Resource Corp. (a) |
1,500 |
9,469 |
|
|
Miller Exploration Co. (a) |
600 |
1,013 |
|
|
Murphy Oil Corp. |
7,200 |
480,600 |
|
|
National Energy Group, Inc. (a) |
900 |
315 |
|
|
National-Oilwell, Inc. (a) |
13,140 |
455,794 |
|
|
Newfield Exploration Co. (a) |
8,700 |
376,275 |
|
|
Noble Affiliates, Inc. |
7,400 |
286,750 |
|
|
Nuevo Energy Co. (a) |
1,800 |
34,538 |
|
|
Ocean Energy, Inc. (a) |
23,052 |
350,102 |
|
|
Parallel Petroleum Corp. (a) |
100 |
353 |
|
|
Patina Oil & Gas Corp. |
3,700 |
78,625 |
|
|
Penn Virginia Corp. |
200 |
5,463 |
|
|
Pennzoil-Quaker State Co. |
18,166 |
225,940 |
|
|
Petroleum Development Corp. (a) |
100 |
544 |
|
|
Pioneer Natural Resources Co. (a) |
9,900 |
137,363 |
|
|
Plains Resources, Inc. (a) |
4,300 |
76,325 |
|
|
Pogo Producing Co. |
7,500 |
201,563 |
|
|
Prima Energy Corp. (a) |
2,900 |
130,138 |
|
|
Common Stocks - continued |
|||
|
Shares |
Value (Note 1) |
||
|
ENERGY - continued |
|||
|
Oil & Gas - continued |
|||
|
Range Resources Corp. |
1,120 |
$ 5,600 |
|
|
Remington Oil & Gas Corp. (a) |
400 |
3,625 |
|
|
Resource America, Inc. Class A |
5,200 |
43,875 |
|
|
Seven Seas Petroleum, Inc. (a) |
1,200 |
3,450 |
|
|
St. Mary Land & Exploration Co. |
4,000 |
165,500 |
|
|
Stone Energy Corp. (a) |
3,000 |
179,438 |
|
|
Swift Energy Co. (a) |
1,900 |
54,981 |
|
|
TEPPCO Partners LP |
1,500 |
35,625 |
|
|
Tesoro Petroleum Corp. (a) |
11,300 |
108,763 |
|
|
Tom Brown, Inc. (a) |
2,300 |
50,025 |
|
|
TransMontaigne, Inc. (a) |
1,000 |
4,438 |
|
|
Ultramar Diamond Shamrock Corp. |
17,500 |
410,156 |
|
|
UNIFAB International, Inc. (a) |
300 |
3,338 |
|
|
Valero Energy Corp. |
8,000 |
241,000 |
|
|
Vastar Resources, Inc. |
14,500 |
1,199,875 |
|
|
Veritas DGC, Inc. (a) |
3,000 |
80,063 |
|
|
Vintage Petroleum, Inc. |
11,400 |
239,400 |
|
|
WD-4O Co. |
700 |
13,563 |
|
|
Western Gas Resources, Inc. |
8,100 |
177,694 |
|
|
Williams Clayton Energy, Inc. (a) |
3,300 |
133,238 |
|
|
Wiser Oil Co. (a) |
100 |
394 |
|
|
|
9,506,427 |
||
|
TOTAL ENERGY |
20,503,422 |
||
|
FINANCE - 11.7% |
|||
|
Banks - 2.9% |
|||
|
1st Source Corp. |
557 |
10,374 |
|
|
Abigail Adams National Bancorp, Inc. |
100 |
888 |
|
|
Advanta Corp. |
8,600 |
111,800 |
|
|
Alabama National Bancorp |
100 |
1,931 |
|
|
Allegiant Bancorp, Inc. |
260 |
2,243 |
|
|
Amcore Financial, Inc. |
5,600 |
101,150 |
|
|
American Pacific Bank of Oregon |
300 |
1,031 |
|
|
Area Bankshares Corp. |
200 |
4,500 |
|
|
Associated Banc-Corp. |
14,657 |
368,028 |
|
|
BancorpSouth, Inc. |
4,000 |
58,500 |
|
|
BancWest Corp. |
6,120 |
108,248 |
|
|
Bank of Granite Corp. |
325 |
7,434 |
|
|
BankAtlantic Bancorp, Inc. Class A (non-vtg.) |
431 |
1,697 |
|
|
Banknorth Group, Inc. |
26,663 |
436,607 |
|
|
BOK Financial Corp. |
3,266 |
58,380 |
|
|
Boston Private Financial Holdings, Inc. |
100 |
1,331 |
|
|
Brenton Banks, Inc. |
242 |
2,961 |
|
|
BT Financial Corp. |
720 |
12,960 |
|
|
Capital Crossing Bank (a) |
1,200 |
10,500 |
|
|
Cathay Bancorp, Inc. |
100 |
4,988 |
|
|
Centura Banks, Inc. |
3,960 |
139,837 |
|
|
Century South Banks, Inc. |
300 |
6,563 |
|
|
|
|||
|
Shares |
Value (Note 1) |
||
|
Chemical Financial Corp. |
242 |
$ 5,203 |
|
|
Chittenden Corp. |
1,867 |
51,109 |
|
|
Citizens Banking Corp. |
3,334 |
76,682 |
|
|
City Holding Co. |
111 |
839 |
|
|
City National Corp. |
9,360 |
365,625 |
|
|
Colonial Bancgroup, Inc. |
8,900 |
86,775 |
|
|
Commerce Bancorp, Inc. |
7,100 |
366,981 |
|
|
Commerce Bancshares, Inc. |
11,424 |
411,264 |
|
|
Community First Bankshares, Inc. |
12,500 |
225,000 |
|
|
Community Trust Bancorp, Inc. |
341 |
5,264 |
|
|
Compass Bancshares, Inc. |
22,050 |
402,413 |
|
|
Corus Bankshares, Inc. |
500 |
16,500 |
|
|
CPB, Inc. |
100 |
2,588 |
|
|
Cullen Frost Bankers, Inc. |
11,900 |
368,900 |
|
|
CVB Financial Corp. |
206 |
3,296 |
|
|
East West Bancorp, Inc. |
10,600 |
180,863 |
|
|
F&M National Corp. |
1,021 |
24,887 |
|
|
Fidelity National Corp., Georgia |
500 |
3,531 |
|
|
First BanCorp P R |
2,100 |
40,950 |
|
|
First Citizen Bancshares, Inc. |
700 |
46,069 |
|
|
First Commonwealth Financial Corp. |
2,704 |
25,857 |
|
|
First Financial Bancorp Ohio |
4,254 |
71,786 |
|
|
First Financial Bankshares, Inc. |
110 |
3,520 |
|
|
First Midwest Bancorp, Inc. |
8,864 |
228,802 |
|
|
First Security Corp. |
31,626 |
482,297 |
|
|
First Tennessee National Corp. |
21,600 |
475,200 |
|
|
First United Bancshares, Inc. |
200 |
3,250 |
|
|
First Virginia Banks, Inc. |
9,300 |
397,575 |
|
|
Firstmerit Corp. |
15,892 |
370,482 |
|
|
FNB Corp. Pennsylvania |
1,485 |
32,670 |
|
|
Fulton Financial Corp. |
7,522 |
157,962 |
|
|
GBC Bancorp |
595 |
22,536 |
|
|
Gold Banc Corp., Inc. |
3,309 |
17,734 |
|
|
Greater Bay Bancorp |
4,100 |
254,200 |
|
|
Hamilton Bancorp, Inc. (a) |
1,100 |
16,363 |
|
|
Hancock Holding Co. |
100 |
3,213 |
|
|
Hibernia Corp. Class A |
31,800 |
399,488 |
|
|
Hudson United Bancorp |
10,326 |
260,086 |
|
|
Imperial Bancorp |
9,964 |
216,717 |
|
|
Independent Bank Corp. |
500 |
6,906 |
|
|
Integra Bank Corp. |
530 |
10,203 |
|
|
International Bancshares Corp. |
1,531 |
46,983 |
|
|
Irwin Financial Corp. |
700 |
10,369 |
|
|
Jefferson Savings Bancorp, Inc. |
100 |
1,088 |
|
|
Keystone Financial, Inc. |
11,600 |
266,800 |
|
|
M&T Bank Corp. |
1,199 |
581,140 |
|
|
Marshall & Ilsley Corp. |
16,400 |
799,500 |
|
|
Mercantile Bankshares Corp. |
11,700 |
403,467 |
|
|
Merchants New York Bancorp, Inc. |
200 |
3,588 |
|
|
MidAmerica Bancorp |
106 |
2,756 |
|
|
Mississippi Valley Bancshares, Inc. |
300 |
7,650 |
|
|
National City Bancorp. |
110 |
1,980 |
|
|
National Commmerce Bancorp |
35,800 |
691,387 |
|
|
National Penn Bancshares, Inc. |
341 |
6,905 |
|
|
Common Stocks - continued |
|||
|
Shares |
Value (Note 1) |
||
|
FINANCE - continued |
|||
|
Banks - continued |
|||
|
NBT Bancorp, Inc. |
355 |
$ 4,038 |
|
|
North Fork Bancorp, Inc. |
30,657 |
547,994 |
|
|
Old National Bancorp |
8,703 |
244,228 |
|
|
Omega Financial Corp. |
200 |
5,550 |
|
|
Oriental Financial Group, Inc. |
533 |
6,996 |
|
|
Pacific Capital Bancorp |
1,500 |
40,219 |
|
|
Pacific Century Financial Corp. |
17,100 |
239,400 |
|
|
Park National Corp. |
715 |
64,618 |
|
|
Popular, Inc. |
16,100 |
332,063 |
|
|
Provident Financial Group, Inc. |
10,900 |
286,806 |
|
|
R&G Financial Corp. Class B |
600 |
6,225 |
|
|
Republic Bancorp, Inc. |
3,335 |
29,598 |
|
|
Republic Bancshares, Inc. (a) |
1,100 |
13,338 |
|
|
Riggs National Corp. |
10,300 |
122,956 |
|
|
S&T Bancorp, Inc. |
880 |
17,366 |
|
|
Santander Bancorp |
1,500 |
17,625 |
|
|
Seacoast Financial Services Corp. |
2,777 |
28,117 |
|
|
Silicon Valley Bancshares (a) |
6,400 |
368,800 |
|
|
Sky Financial Group, Inc. |
12,353 |
216,178 |
|
|
South Financial Group, Inc. |
2,470 |
32,110 |
|
|
Southwest Bancorp Texas, Inc. (a) |
7,400 |
215,063 |
|
|
State Financial Services Corp. |
2,200 |
22,688 |
|
|
Sterling Bancshares, Inc. |
850 |
12,046 |
|
|
Sun Bancorp, Inc. |
2,940 |
22,050 |
|
|
Susquehanna Bancshares, Inc. |
1,400 |
20,037 |
|
|
Texas Regional Bancshares, Inc. Class A |
700 |
17,850 |
|
|
TF Financial Corp. |
100 |
1,425 |
|
|
Trust Co. of New Jersey |
600 |
9,900 |
|
|
Trustco Bank Corp. |
5,010 |
64,504 |
|
|
Trustmark Corp. |
5,800 |
107,300 |
|
|
UAB Financial Corp. |
1,355 |
48,865 |
|
|
UCBH Holdings, Inc. |
4,500 |
136,125 |
|
|
UnionBanCal Corp. |
27,000 |
669,938 |
|
|
United Bankshares, Inc. |
3,070 |
61,016 |
|
|
United National Bancorp |
116 |
2,030 |
|
|
USBANCORP, Inc. Pennsylvania |
600 |
2,644 |
|
|
Valley National Bancorp |
5,579 |
146,449 |
|
|
WesBanco, Inc. |
600 |
14,025 |
|
|
West Coast Bancorp |
1,771 |
17,489 |
|
|
Westamerica Bancorp. |
7,600 |
230,375 |
|
|
Whitney Holding Corp. |
1,400 |
49,788 |
|
|
Wilmington Trust Corp. |
6,500 |
327,438 |
|
|
Zions Bancorp |
14,168 |
634,018 |
|
|
|
15,874,438 |
||
|
Credit & Other Finance - 0.8% |
|||
|
5B Technologies Corp. (a) |
2,200 |
4,400 |
|
|
Aames Financial Corp. (a) |
440 |
303 |
|
|
Ace Cash Express, Inc. (a) |
100 |
1,075 |
|
|
Actrade Financial Technologies Ltd. (a) |
4,800 |
165,000 |
|
|
Allied Capital Corp. |
18,120 |
366,930 |
|
|
Allstate Financial Corp. (a) |
400 |
400 |
|
|
|
|||
|
Shares |
Value (Note 1) |
||
|
AmeriCredit Corp. (a) |
7,300 |
$ 201,663 |
|
|
Ampal-American Israel Corp. Class A (a) |
4,900 |
76,256 |
|
|
AMRESCO, Inc. (a) |
1,460 |
1,643 |
|
|
Associates First Capital Corp. (a) |
2,400 |
74 |
|
|
Cash America International, Inc. |
1,700 |
12,750 |
|
|
CompuCredit Corp. (a) |
9,000 |
356,625 |
|
|
Concord EFS, Inc. (a) |
29,600 |
950,900 |
|
|
Consumer Portfolio Services, Inc. (a) |
600 |
1,050 |
|
|
ContiFinancial Corp. (a) |
1,500 |
30 |
|
|
Credit Acceptance Corp. (a) |
1,500 |
9,000 |
|
|
Delta Financial Corp. (a) |
500 |
406 |
|
|
Doral Financial Corp. |
5,200 |
77,350 |
|
|
E-Loan, Inc. |
9,200 |
31,912 |
|
|
Electronic Clearing House, Inc. (a) |
10,300 |
18,347 |
|
|
ePlus, Inc. (a) |
1,800 |
35,213 |
|
|
Federal Agricultural Mortgage Corp. (a) |
300 |
5,363 |
|
|
Financial Federal Corp. (a) |
800 |
17,000 |
|
|
Finet.Com, Inc. (a) |
5,400 |
3,038 |
|
|
Finova Group, Inc. |
15,900 |
110,306 |
|
|
First Alliance Corp. (a) |
700 |
219 |
|
|
First Charter Corp. |
1,584 |
25,443 |
|
|
Greenpoint Financial Corp. |
11,200 |
292,600 |
|
|
Heller Financial, Inc. Class A |
7,864 |
195,617 |
|
|
Home Gold Financial, Inc. (a) |
100 |
63 |
|
|
IMC Mortgage Co. (a) |
1,800 |
45 |
|
|
Imperial Credit Industries (a) |
1,500 |
3,000 |
|
|
Indymac Bancorp, Inc. |
14,700 |
248,063 |
|
|
Investors Financial Services Corp. |
6,200 |
381,688 |
|
|
LendingTree, Inc. |
8,010 |
39,549 |
|
|
Medallion Financial Corp. |
700 |
11,288 |
|
|
Metris Companies, Inc. |
5,916 |
212,606 |
|
|
New Century Financial Corp. (a) |
1,900 |
21,731 |
|
|
NextCard, Inc. (a) |
4,900 |
40,272 |
|
|
PMC Capital, Inc. |
100 |
975 |
|
|
Point West Capital Corp. (a) |
2,100 |
5,644 |
|
|
Resource Bancshares |
810 |
4,202 |
|
|
SierraCities.com, Inc. (a) |
2,800 |
8,400 |
|
|
Student Loan Corp. |
1,900 |
90,606 |
|
|
T&W Financial Corp. (a) |
600 |
28 |
|
|
The Midland Co. |
3,600 |
92,700 |
|
|
Triad Guaranty, Inc. (a) |
1,600 |
39,300 |
|
|
UniCapital Corp. (a) |
9,400 |
1,175 |
|
|
WFS Financial, Inc. (a) |
2,100 |
31,106 |
|
|
Willis Lease Finance Corp. (a) |
2,100 |
15,750 |
|
|
World Acceptance Corp. (a) |
100 |
525 |
|
|
WSFS Financial Corp. |
4,000 |
43,250 |
|
|
|
4,252,879 |
||
|
Federal Sponsored Credit - 0.0% |
|||
|
Charter Municipal Mortgage |
1,100 |
14,919 |
|
|
Insurance - 4.3% |
|||
|
21st Century Holding Co. (a) |
8,200 |
38,950 |
|
|
Common Stocks - continued |
|||
|
Shares |
Value (Note 1) |
||
|
FINANCE - continued |
|||
|
Insurance - continued |
|||
|
21st Century Insurance Group |
10,200 |
$ 161,288 |
|
|
Acceptance Insurance Co., Inc. |
1,700 |
9,988 |
|
|
ACMAT Corp. Class A (a) |
6,500 |
47,531 |
|
|
Alfa Corp. |
4,600 |
87,113 |
|
|
Allcity Insurance Co. (a) |
2,800 |
28,000 |
|
|
Allmerica Financial Corp. |
6,900 |
420,038 |
|
|
AMBAC Financial Group, Inc. |
8,200 |
529,925 |
|
|
American Financial Group, Inc. |
6,900 |
171,206 |
|
|
American National Insurance Co. |
3,100 |
190,650 |
|
|
Amerus Life Holdings, Inc. |
1,034 |
25,527 |
|
|
Amwest Insurance Group, Inc. |
7,300 |
33,763 |
|
|
Arch Capital Group Ltd. (a) |
2,000 |
30,375 |
|
|
Argonaut Group, Inc. |
2,600 |
42,900 |
|
|
Arthur J. Gallagher & Co. |
5,800 |
284,200 |
|
|
Atlantic American Corp. (a) |
400 |
900 |
|
|
Baldwin & Lyons, Inc. Class B |
1,500 |
29,156 |
|
|
Berkshire Hathaway, Inc. Class A (a) |
202 |
11,654,974 |
|
|
Brown & Brown, Inc. |
2,300 |
61,381 |
|
|
Capitol Transamerica Corp. |
1,300 |
15,356 |
|
|
Ceres Group, Inc. (a) |
300 |
1,988 |
|
|
ChoicePoint, Inc. (a) |
3,315 |
155,391 |
|
|
Citizens, Inc. Class A |
107 |
689 |
|
|
Claimsnet.com, Inc. (a) |
2,700 |
11,222 |
|
|
Clark/Bardes Holdings, Inc. (a) |
100 |
1,013 |
|
|
CNA Financial Corp. (a) |
21,700 |
861,219 |
|
|
CNA Surety Corp. |
5,100 |
58,969 |
|
|
Commerce Group, Inc. |
4,100 |
106,600 |
|
|
Core, Inc. (a) |
7,300 |
43,800 |
|
|
Crawford & Co. Class B |
4,600 |
57,213 |
|
|
Danielson Holding Corp. (a) |
2,100 |
8,925 |
|
|
Delphi Financial Group, Inc. Class A |
1,044 |
43,196 |
|
|
Donegal Group, Inc. |
7,433 |
52,960 |
|
|
E.W. Blanch Holdings, Inc. |
5,400 |
118,463 |
|
|
EMC Insurance Group |
7,500 |
72,188 |
|
|
Enhance Financial Services Group, Inc. |
4,500 |
70,875 |
|
|
Erie Indemnity Co. Class A |
6,900 |
213,469 |
|
|
Farm Family Holdings, Inc. (a) |
700 |
21,088 |
|
|
FBL Financial Group, Inc. Class A |
1,000 |
14,750 |
|
|
Fidelity National Financial, Inc. |
7,852 |
156,549 |
|
|
First American Corp. Calif |
7,650 |
126,225 |
|
|
First Health Group Corp. (a) |
9,000 |
279,563 |
|
|
Fortune Financial, Inc. (a) |
200 |
463 |
|
|
FPIC Insurance Group, Inc. (a) |
6,500 |
98,719 |
|
|
Fremont General Corp. |
8,200 |
26,138 |
|
|
Frontier Insurance Group, Inc. |
8,950 |
2,797 |
|
|
Gainsco, Inc. |
2,400 |
9,300 |
|
|
Great American Financial Resources, Inc. |
2,400 |
43,050 |
|
|
Harleysville Group, Inc. |
3,400 |
65,450 |
|
|
HCC Insurance Holdings, Inc. |
5,800 |
122,525 |
|
|
HealthAxis, Inc. (a) |
1,900 |
5,403 |
|
|
|
|||
|
Shares |
Value (Note 1) |
||
|
Healthcare Recoveries, Inc. (a) |
1,300 |
$ 5,444 |
|
|
HealthExtras, Inc. |
2,000 |
8,250 |
|
|
Healthplan Services Corp. |
2,200 |
7,975 |
|
|
Highlands Insurance Group, Inc. (a) |
1,600 |
14,300 |
|
|
Hilb, Rogal & Hamilton Co. |
900 |
36,000 |
|
|
Horace Mann Educators Corp. |
4,800 |
73,200 |
|
|
HSB Group, Inc. |
3,450 |
137,784 |
|
|
Independence Holding Co. |
220 |
2,805 |
|
|
INSpire Insurance Solutions, Inc. (a) |
4,100 |
10,250 |
|
|
Interstate National Dealer |
100 |
544 |
|
|
Investors Title Co. |
5,500 |
59,125 |
|
|
John Hancock Financial Services, Inc. |
40,300 |
1,017,575 |
|
|
Kansas City Life Insurance Co. |
100 |
3,338 |
|
|
LandAmerica Financial Group, Inc. |
1,600 |
40,700 |
|
|
Liberty Corp. (The) |
592 |
22,792 |
|
|
Liberty Financial Companies, Inc. |
3,500 |
82,688 |
|
|
Markel Corp. (a) |
600 |
87,525 |
|
|
Medical Assurance, Inc. |
2,768 |
32,178 |
|
|
MedicalControl, Inc. (a) |
400 |
2,400 |
|
|
MEEMIC Holdings, Inc. (a) |
4,300 |
85,194 |
|
|
Merchants Group, Inc. |
100 |
1,738 |
|
|
Mercury General Corp. |
6,400 |
175,600 |
|
|
Meridian Insurance Group, Inc. |
5,032 |
87,746 |
|
|
MetLife, Inc. |
33,800 |
821,763 |
|
|
MONY Group, Inc. |
4,100 |
155,031 |
|
|
Motor Club of America (a) |
7,800 |
63,375 |
|
|
National Security Group, Inc. |
100 |
1,488 |
|
|
Nationwide Financial Services, Inc. |
6,400 |
255,200 |
|
|
Navigators Group, Inc. (a) |
6,300 |
72,450 |
|
|
Nymagic, Inc. |
1,100 |
15,606 |
|
|
Ohio Casualty Corp. |
16,700 |
123,163 |
|
|
Old Guard Group, Inc. |
400 |
4,700 |
|
|
Old Republic International Corp. |
15,800 |
378,213 |
|
|
Penn Treaty American Corp. (a) |
200 |
3,575 |
|
|
Penn-America Group, Inc. |
1,000 |
7,375 |
|
|
Philadelphia Consolidated |
1,500 |
24,750 |
|
|
PICO Holdings, Inc. (a) |
1,600 |
22,100 |
|
|
PMA Capital Corp. |
1,200 |
20,250 |
|
|
PMI Group, Inc. |
5,300 |
328,600 |
|
|
Presidential Life Corp. |
900 |
13,613 |
|
|
Professionals Group, Inc. (a) |
1,100 |
25,163 |
|
|
Protective Life Corp. |
11,415 |
328,181 |
|
|
Quotesmith.com, Inc. |
2,500 |
5,313 |
|
|
Radian Group, Inc. |
4,386 |
272,480 |
|
|
Reinsurance Group of America, Inc. |
4,894 |
139,479 |
|
|
Reliance Group Holdings, Inc. |
13,500 |
2,953 |
|
|
Reliastar Financial Corp. |
12,050 |
648,441 |
|
|
RLI Corp. |
1,225 |
47,163 |
|
|
SCPIE Holding, Inc. |
1,400 |
30,450 |
|
|
Selective Insurance Group, Inc. |
3,200 |
57,400 |
|
|
StanCorp Financial Group, Inc. |
2,300 |
92,000 |
|
|
Common Stocks - continued |
|||
|
Shares |
Value (Note 1) |
||
|
FINANCE - continued |
|||
|
Insurance - continued |
|||
|
State Auto Financial Corp. |
4,700 |
$ 59,044 |
|
|
Stewart Information Services Corp. |
1,600 |
21,500 |
|
|
Symons International Group, Inc. (a) |
200 |
150 |
|
|
Transatlantic Holdings, Inc. |
4,100 |
357,469 |
|
|
Trenwick Group, Inc. |
2,190 |
41,473 |
|
|
UICI (a) |
3,300 |
21,863 |
|
|
Unico American Corp. |
9,700 |
66,688 |
|
|
United Fire & Casualty Co. |
3,900 |
72,638 |
|
|
Unitrin, Inc. |
8,300 |
252,631 |
|
|
Vesta Insurance Group Corp. |
2,200 |
11,138 |
|
|
W.R. Berkley Corp. |
3,400 |
90,100 |
|
|
Wesco Financial Corp. |
800 |
192,000 |
|
|
White Mountains Insurance Group Ltd. |
570 |
92,910 |
|
|
Zenith National Insurance Corp. |
2,000 |
46,375 |
|
|
|
23,994,826 |
||
|
Investment Companies - 0.0% |
|||
|
Harris & Harris Group, Inc. (a) |
5,500 |
39,875 |
|
|
THCG, Inc. (a) |
1,300 |
5,241 |
|
|
Winfield Capital Corp. (a) |
1,100 |
13,613 |
|
|
|
58,729 |
||
|
Savings & Loans - 1.1% |
|||
|
Alliance Bancorp |
100 |
1,731 |
|
|
Ambanc Holding Co., Inc. |
200 |
3,025 |
|
|
Anchor Bancorp Wisconsin, Inc. |
1,500 |
24,469 |
|
|
Andover Bancorp, Inc. |
300 |
8,775 |
|
|
Astoria Financial Corp. |
12,390 |
435,199 |
|
|
Bank Plus Corp. (a) |
4,000 |
13,500 |
|
|
Bank United Corp. Class A |
7,000 |
315,000 |
|
|
BankUnited Financial Corp. Class A (a) |
2,100 |
15,750 |
|
|
Bay View Capital Corp. |
3,636 |
35,451 |
|
|
BSB Bancorp, Inc. |
300 |
6,600 |
|
|
Capitol Federal Financial |
7,900 |
114,550 |
|
|
CFS Bancorp, Inc. |
800 |
8,100 |
|
|
Commercial Federal Corp. |
13,995 |
252,785 |
|
|
Commonwealth Bancorp, Inc. |
2,100 |
30,188 |
|
|
Community Savings Bankshares, Inc. |
700 |
8,400 |
|
|
Dime Bancorp, Inc. |
13,700 |
251,738 |
|
|
Dime Community Bancorp, Inc. |
948 |
19,079 |
|
|
Downey Financial Corp. |
2,310 |
77,385 |
|
|
Eagle Bancshares, Inc. |
400 |
4,375 |
|
|
First Federal Capital Corp. |
600 |
6,938 |
|
|
First Financial Holdings, Inc. |
200 |
2,913 |
|
|
First Indiana Corp. |
420 |
8,794 |
|
|
First Niagara Financial Group, Inc. |
6,100 |
58,903 |
|
|
First Place Financial Corp. |
5,200 |
58,500 |
|
|
First Republic Bank (a) |
300 |
7,444 |
|
|
First Sentinel Bancorp, Inc. |
4,891 |
44,630 |
|
|
First Washington Bancorp, Inc. |
410 |
6,073 |
|
|
Firstfed America Bancorp, Inc. |
100 |
1,494 |
|
|
FirstFed Financial Corp. (a) |
700 |
12,600 |
|
|
|
|||
|
Shares |
Value (Note 1) |
||
|
Flagstar Bancorp, Inc. |
2,300 |
$ 27,025 |
|
|
Flushing Financial Corp. |
750 |
11,297 |
|
|
Golden State Bancorp, Inc. |
21,824 |
439,208 |
|
|
Harbor Florida Bancshares, Inc. |
1,300 |
15,519 |
|
|
Harris Financial, Inc. |
1,200 |
9,150 |
|
|
Haven Bancorp, Inc. |
5,800 |
154,425 |
|
|
HomeFed Corp. (a) |
792 |
562 |
|
|
Hudson City Bancorp, Inc. |
10,200 |
176,588 |
|
|
Hudson River Bancorp, Inc. |
3,100 |
40,300 |
|
|
IBERIABANK Corp. |
600 |
10,275 |
|
|
Independence Community Bank Corp. |
15,600 |
211,575 |
|
|
Interwest Bancorp, Inc. |
1,850 |
24,513 |
|
|
Klamath First Bancorp, Inc. |
3,548 |
42,576 |
|
|
Life Financial Corp. (a) |
300 |
938 |
|
|
MAF Bancorp., Inc. |
1,600 |
34,400 |
|
|
MetroWest Bank |
100 |
594 |
|
|
Net.B@nk, Inc. (a) |
8,300 |
94,413 |
|
|
Northwest Bancorp, Inc. |
2,600 |
22,100 |
|
|
OceanFirst Financial Corp. |
2,500 |
51,563 |
|
|
Ocwen Financial Corp. (a) |
4,626 |
26,310 |
|
|
PBOC Holdings, Inc. (a) |
200 |
1,525 |
|
|
People's Bank |
6,300 |
133,088 |
|
|
PFF Bancorp, Inc. |
2,000 |
40,000 |
|
|
Provident Bankshares Corp. |
8,569 |
122,108 |
|
|
Queens County Bancorp, Inc. |
8,800 |
232,100 |
|
|
Republic Security Financial Corp. |
6,558 |
28,281 |
|
|
Richmond County Financial Corp. |
8,200 |
165,025 |
|
|
Roslyn Bancorp, Inc. |
17,035 |
337,506 |
|
|
Sovereign Bancorp, Inc. |
45,313 |
385,161 |
|
|
Staten Island Bancorp, Inc. |
3,400 |
62,688 |
|
|
Sterling Financial Corp. (a) |
100 |
1,138 |
|
|
TCF Financial Corp. |
14,200 |
465,938 |
|
|
Timberland Bancorp, Inc. |
500 |
6,125 |
|
|
Troy Financial Corp. |
5,000 |
57,500 |
|
|
United Community Financial Corp. |
5,000 |
31,563 |
|
|
USABancShares, Inc. (a) |
3,700 |
12,950 |
|
|
W Holding Co., Inc. |
3,000 |
28,313 |
|
|
Washington Federal, Inc. |
13,957 |
289,608 |
|
|
Webster Financial Corp. |
12,116 |
298,735 |
|
|
Westcorp, Inc. |
1,920 |
25,080 |
|
|
York Financial Corp. |
110 |
1,650 |
|
|
|
5,953,802 |
||
|
Securities Industry - 2.6% |
|||
|
A.B. Watley Group, Inc. (a) |
3,800 |
62,225 |
|
|
A.G. Edwards, Inc. |
14,700 |
764,400 |
|
|
Acacia Research Corp. (a) |
1,000 |
27,438 |
|
|
Advest Group, Inc. |
300 |
9,169 |
|
|
AER Energy Resources, Inc. (a) |
8,200 |
5,894 |
|
|
Affiliated Managers Group, Inc. (a) |
1,900 |
105,925 |
|
|
Alleghany Corp. |
922 |
160,831 |
|
|
Alliance Capital Management Holding LP |
23,300 |
1,205,775 |
|
|
American Capital Strategies Ltd. |
5,800 |
138,475 |
|
|
Common Stocks - continued |
|||
|
Shares |
Value (Note 1) |
||
|
FINANCE - continued |
|||
|
Securities Industry - continued |
|||
|
American Insured Mortgage Investors: |
|
|
|
|
Series 86 |
100 |
$ 400 |
|
|
Series 88 |
100 |
650 |
|
|
Ameritrade Holding Corp. Class A (a) |
22,500 |
423,281 |
|
|
Atalanta Sosnoff Capital Corp. (a) |
100 |
975 |
|
|
AXA Financial, Inc. |
59,800 |
3,094,650 |
|
|
Competitive Technologies, Inc. (a) |
4,100 |
36,644 |
|
|
Covol Technologies, Inc. (a) |
6,600 |
20,213 |
|
|
Dain Rauscher Corp. |
3,400 |
273,488 |
|
|
DLJ, Inc. |
19,200 |
1,699,200 |
|
|
E*Trade Group, Inc. (a) |
35,260 |
625,865 |
|
|
Eaton Vance Corp. (non-vtg.) |
3,300 |
159,844 |
|
|
eSpeed, Inc. Class A |
3,000 |
92,250 |
|
|
eVision USA.com, Inc. (a) |
7,000 |
4,690 |
|
|
Federated Investors, Inc. Class B (non-vtg.) |
19,349 |
453,492 |
|
|
Friedman, Billings, Ramsey Group, Inc. Class A (a) |
3,900 |
29,006 |
|
|
Gilman & Ciocia, Inc. (a) |
200 |
788 |
|
|
Global Capital Partners, Inc. (a) |
4,800 |
33,000 |
|
|
GlobalNet Financial.com, Inc. (a) |
2,600 |
25,675 |
|
|
Goldman Sachs Group, Inc. |
11,000 |
1,408,688 |
|
|
Hyperfeed Technologies, Inc. (a) |
7,500 |
31,875 |
|
|
Investment Technology Group, Inc. (a) |
2,597 |
124,656 |
|
|
JB Oxford Holdings, Inc. (a) |
10,700 |
48,484 |
|
|
Jefferies Group, Inc. |
1,300 |
39,569 |
|
|
John Nuveen Co. (The) Class A |
4,200 |
190,575 |
|
|
JWGenesis Financial Corp. (a) |
1,041 |
15,485 |
|
|
Kaiser Ventures, Inc. (a) |
100 |
1,269 |
|
|
Knight Trading Group, Inc. (a) |
16,000 |
502,000 |
|
|
LaBranche & Co., Inc. |
3,000 |
90,375 |
|
|
Legg Mason, Inc. |
7,500 |
395,625 |
|
|
Meyerson & Co., Inc. (a) |
1,100 |
5,844 |
|
|
Morgan Keegan, Inc. |
1,400 |
28,088 |
|
|
National Discount Brokers Group, Inc. (a) |
900 |
32,569 |
|
|
Neuberger Berman, Inc. |
4,600 |
272,263 |
|
|
Nvest LP |
3,900 |
152,344 |
|
|
Olympic Cascade Financial Corp. (a) |
1,000 |
7,250 |
|
|
Omega Worldwide, Inc. (a) |
66 |
173 |
|
|
Phoenix Investment Partners Ltd. |
1,600 |
23,800 |
|
|
Pioneer Group, Inc. (a) |
5,500 |
239,938 |
|
|
Raymond James Financial, Inc. |
3,900 |
111,150 |
|
|
Security Capital Group, Inc. Class B (a) |
12,000 |
204,000 |
|
|
Siebert Financial Corp. |
1,400 |
12,688 |
|
|
Southwest Securities Group, Inc. |
4,019 |
133,381 |
|
|
Spatializer Audio Labs, Inc. (a) |
12,700 |
8,731 |
|
|
SRS Labs, Inc. (a) |
2,800 |
24,850 |
|
|
Stifel Financial Corp. |
110 |
1,430 |
|
|
TD Waterhouse Group, Inc. (a) |
3,600 |
72,900 |
|
|
Tucker Anthony Sutro Corp. |
500 |
11,781 |
|
|
United Asset Management Corp. |
10,500 |
257,250 |
|
|
|
|||
|
Shares |
Value (Note 1) |
||
|
Value Line, Inc. |
300 |
$ 10,763 |
|
|
Waddell & Reed Financial, Inc. Class A |
10,950 |
381,881 |
|
|
Web Street, Inc. |
4,900 |
12,250 |
|
|
Wit Soundview Group, Inc. (a) |
13,000 |
120,250 |
|
|
|
14,428,418 |
||
|
TOTAL FINANCE |
64,578,011 |
||
|
HEALTH - 10.1% |
|||
|
Drugs & Pharmaceuticals - 7.3% |
|||
|
3 Dimensional Pharmaceuticals, Inc. |
2,600 |
101,075 |
|
|
Aastrom Biosciences, Inc. (a) |
15,600 |
52,163 |
|
|
Abgenix, Inc. (a) |
10,000 |
751,719 |
|
|
Abiomed, Inc. (a) |
2,300 |
138,863 |
|
|
Accredo Health, Inc. (a) |
3,450 |
149,428 |
|
|
Advanced Photonix, Inc. Class A (a) |
11,900 |
40,163 |
|
|
Advanced Polymer Systems, Inc. (a) |
200 |
675 |
|
|
Advanced Tissue Sciences, Inc. |
10,100 |
71,963 |
|
|
Akorn, Inc. (a) |
7,100 |
72,331 |
|
|
Albany Molecular Research, Inc. (a) |
5,200 |
185,900 |
|
|
Alexion Pharmaceuticals, Inc. (a) |
1,800 |
189,000 |
|
|
Alkermes, Inc. (a) |
6,000 |
277,500 |
|
|
Allergan Specialty Therapeutics, Inc. Class A (a) |
400 |
7,350 |
|
|
Alliance Pharmaceutical Corp. (a) |
9,400 |
143,350 |
|
|
Alpharma, Inc. Class A |
4,300 |
243,488 |
|
|
Alteon, Inc. (a) |
7,600 |
22,325 |
|
|
AMBI, Inc. (a) |
17,400 |
33,713 |
|
|
American Biogenetic Sciences Class A (a) |
14,800 |
24,975 |
|
|
Amylin Pharmaceuticals, Inc. (a) |
11,600 |
157,325 |
|
|
Andrx Corp. (a) |
8,300 |
722,100 |
|
|
Anesta Corp. (a) |
3,700 |
88,106 |
|
|
Anika Therapeutics, Inc. (a) |
1,100 |
1,925 |
|
|
Antigenics, Inc. |
2,350 |
39,656 |
|
|
Aphton Corp. (a) |
200 |
5,775 |
|
|
Applied Molecular Evolution, Inc. |
2,800 |
90,125 |
|
|
Aquila Biopharmaceuticals, Inc. (a) |
5,100 |
23,588 |
|
|
Argonaut Technologies, Inc. |
2,100 |
36,488 |
|
|
ARIAD Pharmaceuticals, Inc. (a) |
3,500 |
44,188 |
|
|
Aronex Pharmaceuticals, Inc. (a) |
16,100 |
59,369 |
|
|
ArQule, Inc. (a) |
4,000 |
82,250 |
|
|
Atrix Laboratories, Inc. (a) |
1,900 |
29,094 |
|
|
AutoImmune, Inc. (a) |
19,900 |
46,641 |
|
|
AVANIR Pharmaceuticals Class A (a) |
8,200 |
49,713 |
|
|
Avant Immunotherapeutics, Inc. (a) |
9,200 |
89,125 |
|
|
AVAX Technologies, Inc. (a) |
4,900 |
48,081 |
|
|
AVI BioPharma, Inc. (a) |
5,800 |
53,288 |
|
|
Avigen, Inc. (a) |
2,100 |
76,519 |
|
|
Aviron (a) |
3,800 |
171,000 |
|
|
AXYS Pharmaceuticals, Inc. (a) |
10,935 |
84,746 |
|
|
Barr Laboratories, Inc. (a) |
3,250 |
230,750 |
|
|
Bio-Technology General Corp. (a) |
4,700 |
65,506 |
|
|
BioCryst Pharmaceuticals, Inc. (a) |
2,400 |
76,650 |
|
|
Common Stocks - continued |
|||
|
Shares |
Value (Note 1) |
||
|
HEALTH - continued |
|||
|
Drugs & Pharmaceuticals - continued |
|||
|
Biomatrix, Inc. (a) |
1,900 |
$ 40,375 |
|
|
Biopure Corp. |
5,000 |
80,000 |
|
|
BioReliance Corp. (a) |
100 |
1,025 |
|
|
Biosite Diagnostics, Inc. (a) |
2,400 |
166,950 |
|
|
BioSource International, Inc. (a) |
3,400 |
74,375 |
|
|
BioTime, Inc. (a) |
500 |
3,781 |
|
|
Biotransplant, Inc. (a) |
5,300 |
67,906 |
|
|
Bone Care International, Inc. (a) |
100 |
2,281 |
|
|
Boston Life Sciences, Inc. (a) |
7,300 |
56,575 |
|
|
Cadus Pharmaceutical Corp. (a) |
100 |
69 |
|
|
Calypte Biomedical Corp. (a) |
11,000 |
38,500 |
|
|
Cambrex Corp. |
1,100 |
51,631 |
|
|
Carrington Laboratories, Inc. (a) |
5,500 |
11,000 |
|
|
Carter-Wallace, Inc. |
1,700 |
45,263 |
|
|
Catalytica, Inc. (a) |
9,500 |
126,469 |
|
|
Cel-Sci Corp. (a) |
5,700 |
17,100 |
|
|
Celgene Corp. (a) |
7,700 |
569,800 |
|
|
Cell Genesys, Inc. (a) |
2,400 |
73,950 |
|
|
Cell Pathways, Inc. (a) |
2,300 |
76,906 |
|
|
Cell Therapeutics, Inc. (a) |
2,000 |
93,000 |
|
|
Cellegy Pharmaceuticals, Inc. (a) |
5,300 |
45,713 |
|
|
Cephalon, Inc. (a) |
3,600 |
181,125 |
|
|
Cerus Corp. (a) |
1,900 |
100,819 |
|
|
Chattem, Inc. (a) |
4,300 |
52,406 |
|
|
Chirex, Inc. (a) |
4,100 |
127,613 |
|
|
Chiron Corp. (a) |
23,900 |
1,292,094 |
|
|
CIMA Labs, Inc. (a) |
2,600 |
107,575 |
|
|
Collagenex Pharmaceuticals, Inc. (a) |
4,900 |
47,775 |
|
|
Columbia Laboratories, Inc. (a) |
1,000 |
5,500 |
|
|
Connetics Corp. (a) |
6,400 |
114,000 |
|
|
COR Therapeutics, Inc. (a) |
5,800 |
326,250 |
|
|
Corixa Corp. (a) |
2,600 |
133,088 |
|
|
Cortex Pharmaceuticals, Inc. (a) |
7,500 |
22,266 |
|
|
Corvas International, Inc. (a) |
5,700 |
90,844 |
|
|
Coulter Pharmaceutical, Inc. (a) |
900 |
28,181 |
|
|
Covalent Group, Inc. (a) |
7,800 |
26,081 |
|
|
Crescendo Pharmaceuticals Corp. (a) |
1,100 |
22,413 |
|
|
Cubist Pharmaceuticals, Inc. (a) |
2,500 |
152,813 |
|
|
CuraGen Corp. (a) |
3,800 |
168,625 |
|
|
Curative Health Services, Inc. (a) |
3,200 |
16,400 |
|
|
CV Therapeutics, Inc. (a) |
3,000 |
225,000 |
|
|
Cytoclonal Pharmaceuticals, Inc. (a) |
6,300 |
60,244 |
|
|
CYTOGEN Corp. (a) |
7,000 |
62,125 |
|
|
Cytyc Corp. (a) |
3,800 |
177,175 |
|
|
Deltagen, Inc. |
3,900 |
112,613 |
|
|
Dexter Corp. |
4,500 |
266,063 |
|
|
Diacrin, Inc. (a) |
100 |
906 |
|
|
Diagnostic Products Corp. |
500 |
21,188 |
|
|
Discovery Laboratories, Inc. (a) |
10,400 |
59,800 |
|
|
Dura Pharmaceuticals, Inc. (a) |
7,400 |
203,963 |
|
|
Duramed Pharmaceuticals, Inc. (a) |
10,200 |
68,850 |
|
|
|
|||
|
Shares |
Value (Note 1) |
||
|
Dyax Corp. (a) |
2,400 |
$ 84,000 |
|
|
Elan Corp. PLC rights 1/15/03 (a) |
2,000 |
1,875 |
|
|
Electrosource, Inc. (a) |
3,500 |
18,375 |
|
|
Embrex, Inc. (a) |
4,400 |
55,825 |
|
|
Emisphere Technologies, Inc. (a) |
2,100 |
69,300 |
|
|
Enchira Biotechnology Corp. (a) |
4,100 |
25,113 |
|
|
Endo Pharmaceuticals Holdings, Inc. (a) |
600 |
3,075 |
|
|
Endo Pharmaceuticals Holdings, Inc. warrants 12/31/02 (a) |
600 |
1,425 |
|
|
EntreMed, Inc. (a) |
1,000 |
29,750 |
|
|
Enzo Biochem, Inc. (a) |
2,510 |
150,600 |
|
|
Enzon, Inc. (a) |
4,200 |
255,675 |
|
|
Epimmune, Inc. (a) |
6,800 |
36,550 |
|
|
Epitope, Inc. (a) |
5,800 |
73,225 |
|
|
Epix Medical, Inc. (a) |
100 |
1,500 |
|
|
Ergo Science Corp. (a) |
8,000 |
8,250 |
|
|
Exelixis, Inc. |
4,600 |
207,000 |
|
|
Forest Laboratories, Inc. (a) |
10,300 |
1,008,113 |
|
|
GelTex Pharmaceuticals, Inc. (a) |
3,800 |
153,959 |
|
|
Gene Logic, Inc. (a) |
3,100 |
76,144 |
|
|
Genelabs Technologies, Inc. (a) |
4,000 |
16,250 |
|
|
Genencor International, Inc. |
7,900 |
245,888 |
|
|
Genentech, Inc. |
11,100 |
2,114,550 |
|
|
Genome Therapeutics Corp. (a) |
2,500 |
62,813 |
|
|
Genta, Inc. (a) |
7,700 |
68,338 |
|
|
Genzyme Corp.: |
|
|
|
|
General Division (a) |
10,000 |
750,625 |
|
|
Molecular Oncology (a) |
4,083 |
57,162 |
|
|
Genzyme Transgenics Corp. (a) |
4,700 |
174,781 |
|
|
Geron Corp. (a) |
1,500 |
48,469 |
|
|
Gilead Sciences, Inc. (a) |
5,100 |
550,800 |
|
|
Gliatech, Inc. (a) |
3,900 |
31,200 |
|
|
Guilford Pharmaceuticals, Inc. (a) |
4,900 |
131,075 |
|
|
Hauser, Inc. (a) |
25 |
16 |
|
|
Hemispherx Biopharma, Inc. (a) |
1,100 |
6,669 |
|
|
Herbalife International, Inc. Class A |
466 |
4,514 |
|
|
Heska Corp. (a) |
600 |
2,250 |
|
|
Hollis-Eden Pharmaceutcals, Inc. (a) |
2,500 |
24,688 |
|
|
Human Genome Sciences, Inc. (a) |
6,800 |
1,135,175 |
|
|
Hyseq, Inc. (a) |
2,100 |
88,069 |
|
|
ICN Pharmaceuticals, Inc. |
8,200 |
232,163 |
|
|
ICOS Corp. (a) |
6,100 |
357,994 |
|
|
IDEC Pharmaceuticals Corp. (a) |
5,400 |
753,975 |
|
|
IDEXX Laboratories, Inc. (a) |
6,300 |
164,588 |
|
|
IGEN International, Inc. (a) |
4,500 |
85,500 |
|
|
Ilex Oncology, Inc. (a) |
3,800 |
125,400 |
|
|
ImClone Systems, Inc. (a) |
3,400 |
327,675 |
|
|
Immtech International, Inc. (a) |
700 |
14,875 |
|
|
Immucor, Inc. (a) |
5,800 |
21,750 |
|
|
Immune Response Corp. (a) |
2,600 |
23,400 |
|
|
Immunex Corp. (a) |
65,300 |
3,281,325 |
|
|
ImmunoGen, Inc. (a) |
3,200 |
54,000 |
|
|
Immunomedics, Inc. (a) |
6,500 |
162,500 |
|
|
Incyte Genomics, Inc. (a) |
3,700 |
306,869 |
|
|
Common Stocks - continued |
|||
|
Shares |
Value (Note 1) |
||
|
HEALTH - continued |
|||
|
Drugs & Pharmaceuticals - continued |
|||
|
Inhale Therapeutic Systems, Inc. (a) |
4,000 |
$ 202,000 |
|
|
InKine Pharmaceutical, Inc. (a) |
7,500 |
71,250 |
|
|
Inspire Pharmaceuticals, Inc. |
3,300 |
57,750 |
|
|
Interferon Sciences, Inc. (a) |
20 |
24 |
|
|
Intermune Pharmaceuticals, Inc. |
4,100 |
156,056 |
|
|
International Isotopes, Inc. (a) |
200 |
725 |
|
|
Interneuron Pharmaceuticals, Inc. (a) |
10,800 |
24,638 |
|
|
Invitrogen Corp. (a) |
3,100 |
195,688 |
|
|
Isis Pharmaceuticals Co. (a) |
3,000 |
39,188 |
|
|
IVAX Corp. (a) |
20,700 |
716,738 |
|
|
Jones Pharma, Inc. |
8,700 |
311,025 |
|
|
Kendle International, Inc. (a) |
3,600 |
30,713 |
|
|
King Pharmaceuticals, Inc. (a) |
11,397 |
366,129 |
|
|
Kos Pharmaceuticals, Inc. (a) |
3,800 |
53,200 |
|
|
KV Pharmaceutical Co. Class A (a) |
350 |
13,913 |
|
|
La Jolla Pharmaceutical Co. (a) |
9,400 |
63,450 |
|
|
Lexicon Genetics, Inc. |
6,300 |
209,475 |
|
|
LifeCell Corp. (a) |
9,400 |
46,119 |
|
|
Ligand Pharmaceuticals, Inc. Class B (a) |
5,100 |
66,300 |
|
|
Lynx Therapeutics, Inc. (a) |
1,000 |
34,750 |
|
|
Magainin Pharmaceuticals, Inc. (a) |
13,200 |
49,087 |
|
|
Martek Biosciences (a) |
4,200 |
94,500 |
|
|
Matritech, Inc. (a) |
5,000 |
40,000 |
|
|
Matrix Pharmaceutical, Inc. (a) |
6,100 |
89,213 |
|
|
Maxim Pharmaceuticals, Inc. (a) |
1,900 |
116,256 |
|
|
Maxygen, Inc. |
4,300 |
231,125 |
|
|
Medarex, Inc. (a) |
4,200 |
464,100 |
|
|
Medicis Pharmaceutical Corp. Class A (a) |
2,500 |
161,094 |
|
|
Meridian Diagnostics, Inc. |
100 |
775 |
|
|
MGI Pharma, Inc. (a) |
3,500 |
121,406 |
|
|
Microcide Pharmaceuticals, Inc. (a) |
5,700 |
52,725 |
|
|
Microvision, Inc. (a) |
1,000 |
40,875 |
|
|
Millennium Pharmaceuticals, Inc. (a) |
11,616 |
1,662,540 |
|
|
Miravant Medical Technologies (a) |
4,400 |
110,275 |
|
|
Molecular Biosystems, Inc. (a) |
600 |
263 |
|
|
Mylan Laboratories, Inc. |
16,368 |
434,775 |
|
|
Myriad Genetics, Inc. (a) |
1,100 |
153,863 |
|
|
Nabi (a) |
10,500 |
85,313 |
|
|
Nanogen, Inc. (a) |
1,900 |
45,838 |
|
|
NaPro BioTherapeutics, Inc. (a) |
8,500 |
66,938 |
|
|
Nature's Sunshine Products, Inc. |
300 |
2,363 |
|
|
NBTY, Inc. (a) |
8,400 |
59,325 |
|
|
NeoRX Corp. (a) |
2,500 |
47,500 |
|
|
Neose Technologies, Inc. (a) |
3,000 |
123,000 |
|
|
NeoTherapeutics, Inc. (a) |
4,500 |
35,156 |
|
|
Neurobiological Technologies (a) |
4,900 |
41,038 |
|
|
Neurogen Corp. (a) |
2,600 |
99,288 |
|
|
Northfield Laboratories, Inc. (a) |
4,900 |
76,563 |
|
|
Novavax, Inc. (a) |
100 |
919 |
|
|
Noven Pharmaceuticals, Inc. (a) |
4,100 |
172,200 |
|
|
NPS Pharmaceuticals, Inc. (a) |
4,300 |
190,275 |
|
|
|
|||
|
Shares |
Value (Note 1) |
||
|
Nutraceutical International Corp. (a) |
600 |
$ 1,613 |
|
|
Omni Nutraceuticals, Inc. (a) |
11,300 |
32,488 |
|
|
ONYX Pharmaceuticals, Inc. (a) |
3,600 |
95,400 |
|
|
Orchid BioSciences, Inc. |
4,400 |
197,725 |
|
|
Organogenesis, Inc. (a) |
931 |
15,129 |
|
|
Orphan Medical, Inc. (a) |
600 |
6,825 |
|
|
Ortec International, Inc. (a) |
200 |
1,475 |
|
|
OSI Pharmaceuticals, Inc. (a) |
3,500 |
174,945 |
|
|
OXiGENE, Inc. (a) |
2,400 |
26,700 |
|
|
Oxis International, Inc. (a) |
5,100 |
7,013 |
|
|
Pain Therapeutics, Inc. |
3,300 |
63,525 |
|
|
Paradigm Genetics, Inc. |
6,200 |
102,300 |
|
|
PAREXEL International Corp. (a) |
4,400 |
43,863 |
|
|
PathoGenesis Corp. (a) |
3,400 |
130,050 |
|
|
PE Corp. - Celera Genomics Group (a) |
7,100 |
769,906 |
|
|
Penwest Pharmaceuticals Co. (a) |
1,700 |
21,781 |
|
|
Pharmaceutical Product Development, Inc. (a) |
6,100 |
133,819 |
|
|
Pharmacyclics, Inc. (a) |
1,200 |
60,150 |
|
|
PharmaPrint, Inc. (a) |
11,100 |
3,552 |
|
|
Pharmos Corp. (a) |
13,200 |
54,863 |
|
|
PRAECIS Pharmaceuticals, Inc. |
4,300 |
188,394 |
|
|
Progenics Pharmaceuticals, Inc. (a) |
2,900 |
85,550 |
|
|
Protein Design Labs, Inc. (a) |
4,400 |
334,400 |
|
|
Pure World, Inc. (a) |
440 |
1,018 |
|
|
Questcor Pharmaceuticals, Inc. (a) |
200 |
313 |
|
|
Quidel Corp. (a) |
11,800 |
76,700 |
|
|
Regeneron Pharmaceuticals, Inc. (a) |
5,900 |
209,081 |
|
|
Repligen Corp. (a) |
9,800 |
74,113 |
|
|
Ribozyme Pharmaceuticals, Inc. (a) |
1,100 |
31,763 |
|
|
Rosetta Inpharmatics, Inc. |
4,000 |
141,500 |
|
|
SafeScience, Inc. (a) |
1,200 |
3,300 |
|
|
Sangstat Medical Corp. (a) |
1,400 |
28,350 |
|
|
SciClone Pharmaceuticals, Inc. (a) |
2,500 |
29,531 |
|
|
Scios, Inc. (a) |
1,500 |
15,188 |
|
|
Sepracor, Inc. (a) |
9,100 |
1,001,000 |
|
|
Serologicals Corp. (a) |
9,050 |
71,834 |
|
|
Shaman Pharmaceuticals, Inc. (a) |
1 |
0 |
|
|
SICOR, Inc. (a) |
16,200 |
156,938 |
|
|
Siga Pharmaceuticals, Inc. (a) |
5,500 |
19,250 |
|
|
SonoSight, Inc. (a) |
3,300 |
110,344 |
|
|
Spectrx, Inc. (a) |
100 |
863 |
|
|
SpeechWorks International, Inc. |
3,900 |
298,838 |
|
|
Spire Corp. (a) |
100 |
625 |
|
|
StemCells, Inc. (a) |
8,800 |
79,200 |
|
|
SuperGen, Inc. (a) |
3,700 |
72,844 |
|
|
Symyx Technologies, Inc. |
2,700 |
100,238 |
|
|
Synaptic Pharmaceutical Corp. (a) |
7,100 |
41,713 |
|
|
Syntroleum Corp. (a) |
7,400 |
125,800 |
|
|
Tanox, Inc. |
4,500 |
209,250 |
|
|
Targeted Genetics Corp. (a) |
7,500 |
101,250 |
|
|
TCPI, Inc. (a) |
14,500 |
8,609 |
|
|
Techniclone Corp. (a) |
18,900 |
52,566 |
|
|
Texas Biotechnology Corp. (a) |
3,400 |
59,925 |
|
|
Common Stocks - continued |
|||
|
Shares |
Value (Note 1) |
||
|
HEALTH - continued |
|||
|
Drugs & Pharmaceuticals - continued |
|||
|
Theragenics Corp. (a) |
1,000 |
$ 7,125 |
|
|
Titan Pharmaceuticals, Inc. (a) |
3,400 |
159,588 |
|
|
Transkaryotic Therapies, Inc. (a) |
3,600 |
156,150 |
|
|
Trega Biosciences, Inc. (a) |
10,900 |
40,534 |
|
|
Triangle Pharmaceuticals, Inc. (a) |
6,500 |
58,500 |
|
|
Trimeris, Inc. (a) |
2,700 |
186,300 |
|
|
Tularik, Inc. |
4,500 |
150,188 |
|
|
Twinlab Corp. (a) |
2,200 |
10,863 |
|
|
Unigene Laboratories, Inc. (a) |
11,200 |
25,200 |
|
|
United Therapeutics Corp. (a) |
3,000 |
259,078 |
|
|
V.I. Technologies, Inc. (a) |
800 |
5,600 |
|
|
Valentis, Inc. (a) |
4,457 |
45,963 |
|
|
Variagenics, Inc. |
4,400 |
124,300 |
|
|
VaxGen, Inc. |
2,100 |
51,975 |
|
|
Ventana Medical Systems, Inc. (a) |
3,600 |
100,575 |
|
|
Vertex Pharmaceuticals, Inc. (a) |
6,000 |
510,000 |
|
|
Vical, Inc. (a) |
4,600 |
112,700 |
|
|
Vion Pharmaceuticals, Inc. (a) |
4,600 |
81,938 |
|
|
Viragen, Inc. (a) |
22,000 |
33,000 |
|
|
ViroPharma, Inc. (a) |
3,500 |
98,000 |
|
|
Vivus, Inc. (a) |
7,900 |
40,981 |
|
|
Vysis, Inc. (a) |
2,700 |
25,313 |
|
|
Weider Nutrition International, Inc. |
400 |
1,625 |
|
|
XOMA Ltd. (a) |
8,400 |
101,850 |
|
|
Zila, Inc. (a) |
12,400 |
46,500 |
|
|
Zonagen, Inc. (a) |
4,300 |
18,275 |
|
|
|
40,132,803 |
||
|
Medical Equipment & Supplies - 1.7% |
|||
|
Acuson Corp. (a) |
800 |
11,500 |
|
|
ADAC Laboratories (a) |
5,300 |
118,588 |
|
|
Advanced Neuromodulation |
3,100 |
58,706 |
|
|
Aksys Ltd. (a) |
100 |
1,088 |
|
|
ALARIS Medical, Inc. (a) |
1,900 |
2,850 |
|
|
Allied Healthcare Products, Inc. (a) |
100 |
281 |
|
|
Allscripts, Inc. |
3,400 |
99,238 |
|
|
American Medical Technologies, Inc. (a) |
100 |
134 |
|
|
AmeriSource Health Corp. Class A (a) |
4,800 |
166,800 |
|
|
Angeion Corp. (a) |
40 |
60 |
|
|
Aradigm Corp. (a) |
5,500 |
98,313 |
|
|
Arrow International, Inc. |
1,600 |
57,000 |
|
|
Arthrocare Corp. (a) |
2,800 |
124,600 |
|
|
ATS Medical, Inc. (a) |
6,200 |
102,300 |
|
|
Avitar, Inc. (a) |
2,400 |
7,050 |
|
|
Bacou USA, Inc. (a) |
600 |
15,075 |
|
|
Baxter International, Inc. rights 12/31/07 (a) |
100 |
10 |
|
|
Bergen Brunswig Corp. Class A |
22,625 |
212,109 |
|
|
Bindley Western Industries, Inc. |
1,610 |
46,388 |
|
|
Bio-Plexus, Inc. (a) |
100 |
225 |
|
|
|
|||
|
Shares |
Value (Note 1) |
||
|
Bio-Rad Laboratories, Inc. Class A (a) |
300 |
$ 7,388 |
|
|
Bio-Vascular, Inc. (a) |
400 |
1,775 |
|
|
BioLase Technology, Inc. (a) |
8,000 |
18,250 |
|
|
Bionx Implants, Inc. (a) |
117 |
322 |
|
|
Boston Biomedica, Inc. (a) |
5,200 |
20,800 |
|
|
Bradley Pharmaceuticals, Inc. Class A (a) |
1,200 |
1,538 |
|
|
BriteSmile, Inc. (a) |
1,400 |
9,800 |
|
|
Candela Corp. (a) |
6,100 |
80,063 |
|
|
Cardiac Pathways Corp. (a) |
20 |
100 |
|
|
Cardima, Inc. (a) |
13,600 |
14,875 |
|
|
Cardiodynamics International Corp. (a) |
7,700 |
49,569 |
|
|
Chad Therapeutics, Inc. (a) |
100 |
106 |
|
|
Closure Medical Corp. (a) |
1,300 |
27,848 |
|
|
CNS., Inc. (a) |
4,000 |
17,750 |
|
|
Coherent, Inc. (a) |
3,900 |
313,950 |
|
|
Cohesion Technologies, Inc. (a) |
5,900 |
63,425 |
|
|
Colorado Medtech, Inc. (a) |
3,100 |
27,513 |
|
|
Computer Motion, Inc. (a) |
1,900 |
17,575 |
|
|
Conceptus, Inc. (a) |
5,300 |
47,700 |
|
|
CONMED Corp. (a) |
4,400 |
59,400 |
|
|
Cooper Companies, Inc. |
1,300 |
42,738 |
|
|
Cyberonics, Inc. (a) |
6,100 |
100,269 |
|
|
Cygnus, Inc. (a) |
6,300 |
76,781 |
|
|
Cypress Bioscience, Inc. (a) |
23,700 |
43,697 |
|
|
Datascope Corp. |
3,500 |
123,375 |
|
|
DENTSPLY International, Inc. |
8,500 |
283,688 |
|
|
Diametrics Medical, Inc. (a) |
4,600 |
32,200 |
|
|
Dianon Systems, Inc. (a) |
2,900 |
129,775 |
|
|
Digene Corp. (a) |
3,200 |
127,400 |
|
|
Dionex Corp. (a) |
3,700 |
109,150 |
|
|
E-Z-EM, Inc. Class A (a) |
100 |
800 |
|
|
Eclipse Surgical Technologies (a) |
2,780 |
10,946 |
|
|
Edwards Lifesciences Corp. (a) |
7,200 |
189,000 |
|
|
Endocardial Solutions, Inc. (a) |
100 |
788 |
|
|
Endocare, Inc. (a) |
4,500 |
79,031 |
|
|
Endosonics Corp. (a) |
400 |
4,300 |
|
|
Fischer Imaging Corp. (a) |
100 |
378 |
|
|
Fusion Medical Technologies, Inc. (a) |
4,000 |
45,000 |
|
|
Gentiva Health Services, Inc. (a) |
10,400 |
115,700 |
|
|
Genzyme Corp. - Surgical Products (a) |
6,619 |
67,845 |
|
|
Guardian Technologies |
2,800 |
2,450 |
|
|
Haemonetics Corp. (a) |
1,000 |
25,188 |
|
|
Heartport, Inc. (a) |
6,100 |
21,541 |
|
|
Henry Schein, Inc. (a) |
6,500 |
119,438 |
|
|
Hologic, Inc. (a) |
4,700 |
39,656 |
|
|
Horizon Medical Products, Inc. (a) |
600 |
788 |
|
|
Hycor Biomedical, Inc. (a) |
7,800 |
53,625 |
|
|
I-Flow Corp. (a) |
11,300 |
36,725 |
|
|
I-Stat Corp. (a) |
100 |
1,856 |
|
|
ICU Medical, Inc. (a) |
100 |
2,344 |
|
|
Imatron, Inc. (a) |
12,700 |
31,750 |
|
|
Implant Sciences Corp. (a) |
300 |
2,663 |
|
|
INAMED Corp. (a) |
4,500 |
147,094 |
|
|
Common Stocks - continued |
|||
|
Shares |
Value (Note 1) |
||
|
HEALTH - continued |
|||
|
Medical Equipment & Supplies - continued |
|||
|
Innerdyne, Inc. (a) |
12,300 |
$ 78,413 |
|
|
Integrated Surgial Systems, Inc. (a) |
3,500 |
2,953 |
|
|
Intermagnetics General Corp. |
414 |
7,530 |
|
|
Interpore International, Inc. (a) |
8,000 |
65,500 |
|
|
Intuitive Surgical, Inc. |
4,800 |
69,600 |
|
|
Invacare Corp. |
1,900 |
51,181 |
|
|
Iridex Corp. (a) |
100 |
919 |
|
|
JMAR Industries, Inc. (a) |
6,100 |
61,763 |
|
|
Kensey Nash Corp. (a) |
1,300 |
16,738 |
|
|
KeraVision, Inc. (a) |
3,600 |
13,500 |
|
|
Laserscope, Inc. (a) |
100 |
194 |
|
|
LaserSight, Inc. (a) |
15,400 |
53,900 |
|
|
Lifecore Biomedical, Inc. (a) |
1,700 |
13,600 |
|
|
LightPath Technologies, Inc. (a) |
1,100 |
58,025 |
|
|
Medical-Design Corp. (a) |
2,300 |
35,650 |
|
|
Mentor Corp. |
5,400 |
114,413 |
|
|
Merit Medical Systems, Inc. (a) |
100 |
581 |
|
|
Micro Therapeutics, Inc. (a) |
1,700 |
11,688 |
|
|
Milestone Scientific, Inc. (a) |
200 |
500 |
|
|
MiniMed, Inc. (a) |
7,600 |
545,656 |
|
|
Minntech Corp. |
100 |
644 |
|
|
NCS HealthCare, Inc. (a) |
5,800 |
1,813 |
|
|
Neoprobe Corp. (a) |
400 |
288 |
|
|
Nexell Therapeutics, Inc. (a) |
4,125 |
52,594 |
|
|
NMT Medical, Inc. (a) |
100 |
250 |
|
|
Novametrix Medical Systems, Inc. (a) |
200 |
1,225 |
|
|
Novoste Corp. (a) |
2,000 |
108,000 |
|
|
Oakley, Inc. (a) |
5,000 |
84,688 |
|
|
Ocular Sciences, Inc. (a) |
7,100 |
76,325 |
|
|
Omnicare, Inc. |
7,700 |
105,394 |
|
|
Optical Sensors, Inc. (a) |
100 |
125 |
|
|
ORATEC Interventions, Inc. |
3,500 |
124,469 |
|
|
Osteotech, Inc. (a) |
8,100 |
96,188 |
|
|
Owens & Minor, Inc. |
1,100 |
16,844 |
|
|
Palomar Medical Technologies, Inc. (a) |
185 |
538 |
|
|
Paradigm Medical Industries, Inc. (a) |
3,600 |
16,875 |
|
|
Patterson Dental Co. (a) |
11,300 |
268,375 |
|
|
Perrigo Co. (a) |
15,200 |
112,575 |
|
|
PharmaNetics, Inc. (a) |
100 |
2,050 |
|
|
Photoelectron Corp. (a) |
100 |
513 |
|
|
Physiometrix, Inc. (a) |
3,200 |
74,000 |
|
|
PLC Systems, Inc. (a) |
600 |
713 |
|
|
Possis Medical, Inc. (a) |
6,900 |
57,788 |
|
|
Priority Healthcare Corp. (a) |
2,906 |
167,822 |
|
|
PSS World Medical, Inc. (a) |
16,175 |
101,094 |
|
|
Q-Medical, Inc. (a) |
100 |
800 |
|
|
Radiance Medical Systems, Inc. (a) |
100 |
1,381 |
|
|
Resmed, Inc. (a) |
2,200 |
80,988 |
|
|
Respironics, Inc. (a) |
1,092 |
20,680 |
|
|
Scott Technologies, Inc. (a) |
1,000 |
18,938 |
|
|
Sonus Pharmaceuticals, Inc. (a) |
5,100 |
19,125 |
|
|
|
|||
|
Shares |
Value (Note 1) |
||
|
Spacelabs Medical, Inc. (a) |
2,500 |
$ 22,656 |
|
|
Staar Surgical Co. (a) |
5,800 |
96,788 |
|
|
Steris Corp. (a) |
2,200 |
22,550 |
|
|
Stryker Corp. |
25,900 |
1,160,644 |
|
|
Sunrise Medical, Inc. (a) |
800 |
4,500 |
|
|
Sunrise Technologies, Inc. (a) |
4,700 |
30,844 |
|
|
Swissray International, Inc. (a) |
3,700 |
7,169 |
|
|
Sybron International, Inc. (a) |
15,000 |
341,250 |
|
|
Techne Corp. (a) |
2,700 |
257,850 |
|
|
Thermo Cardiosystems, Inc. (a) |
1,300 |
12,106 |
|
|
Thoratec Laboratories Corp. (a) |
200 |
3,725 |
|
|
Trex Medical Corp. (a) |
1,000 |
938 |
|
|
Trimedyne, Inc. (a) |
9,200 |
21,275 |
|
|
Uromed Corp. (a) |
8,120 |
15,733 |
|
|
Varian Medical Systems, Inc. (a) |
3,200 |
147,000 |
|
|
Vasomedical, Inc. (a) |
6,100 |
27,450 |
|
|
Ventiv Health, Inc. (a) |
3,465 |
46,344 |
|
|
Vidamed, Inc. (a) |
100 |
263 |
|
|
Vista Medical Technologies, Inc. (a) |
100 |
150 |
|
|
VISX, Inc. (a) |
6,200 |
170,888 |
|
|
Vital Signs, Inc. |
300 |
5,531 |
|
|
Voxel (a) |
100 |
1 |
|
|
Wesley Jessen Visioncare, Inc. (a) |
4,200 |
158,025 |
|
|
Zoll Medical Corp. (a) |
2,500 |
109,375 |
|
|
|
9,448,502 |
||
|
Medical Facilities Management - 1.1% |
|||
|
Advance Paradigm, Inc. (a) |
5,700 |
151,763 |
|
|
American Healthways, Inc. (a) |
100 |
600 |
|
|
American HomePatient, Inc. (a) |
500 |
156 |
|
|
American Medical Securities |
500 |
4,219 |
|
|
AmeriPath, Inc. (a) |
7,400 |
100,825 |
|
|
Amsurg Corp. Class A (a) |
9 |
65 |
|
|
Apria Healthcare Group, Inc. (a) |
1,900 |
28,263 |
|
|
ARV Assisted Living, Inc. (a) |
100 |
100 |
|
|
Cambridge Heart, Inc. (a) |
1,200 |
4,500 |
|
|
Carematrix Corp. (a) |
2,500 |
938 |
|
|
Chronimed, Inc. |
700 |
5,119 |
|
|
Clintrials Research, Inc. (a) |
200 |
988 |
|
|
Comprehensive Care Corp. (a) |
300 |
51 |
|
|
Corvel Corp. (a) |
300 |
8,100 |
|
|
Covance, Inc. (a) |
4,800 |
49,800 |
|
|
Coventry Health Care, Inc. (a) |
4,200 |
67,200 |
|
|
Cryolife, Inc. (a) |
100 |
2,688 |
|
|
Diagnostic Health Services, Inc. (a) |
600 |
6 |
|
|
Emeritus Corp. (a) |
100 |
269 |
|
|
Express Scripts, Inc. Class A (a) |
5,600 |
398,650 |
|
|
Foundation Health Systems, Inc. |
11,400 |
200,213 |
|
|
Genesis Health Ventures, Inc. (a) |
1,200 |
375 |
|
|
Global Unilabs Clinical Trials Ltd. |
100 |
0 |
|
|
Hanger Orthopedic Group, Inc. (a) |
200 |
700 |
|
|
Health Management Associates, Inc. Class A (a) |
27,300 |
445,331 |
|
|
Common Stocks - continued |
|||
|
Shares |
Value (Note 1) |
||
|
HEALTH - continued |
|||
|
Medical Facilities Management - continued |
|||
|
Health Power, Inc. (a) |
400 |
$ 2,400 |
|
|
Health Risk Management, Inc. (a) |
100 |
563 |
|
|
HealthCare Integrated Services, Inc. (a) |
5,000 |
13,125 |
|
|
HealthGrades.com, Inc. (a) |
100 |
106 |
|
|
Hooper Holmes, Inc. |
6,400 |
74,800 |
|
|
IMPATH, Inc. (a) |
4,400 |
158,125 |
|
|
Infu-Tech, Inc. (a) |
2,400 |
12,300 |
|
|
Innovative Clinical Solutions Ltd. (a) |
1,100 |
110 |
|
|
Integrated Health Services, Inc. (a) |
1,700 |
204 |
|
|
Laboratory Corp. of America Holdings (a) |
2,240 |
265,020 |
|
|
LCA-Vision, Inc. (a) |
5,800 |
17,763 |
|
|
Lifepoint Hospitals, Inc. (a) |
7,100 |
213,888 |
|
|
Lincare Holdings, Inc. (a) |
6,500 |
165,750 |
|
|
LTC Healthcare, Inc. (a) |
20 |
10 |
|
|
Matria Healthcare, Inc. (a) |
3,000 |
11,250 |
|
|
Maxicare Health Plans, Inc. (a) |
600 |
750 |
|
|
Meadowbrook Insurance Group, Inc. |
9,800 |
38,588 |
|
|
Medical Resources, Inc. (a) |
133 |
20 |
|
|
Medquist, Inc. (a) |
2,784 |
53,940 |
|
|
Mid-Atlantic Medical Services, Inc. (a) |
1,600 |
25,800 |
|
|
MIM Corp. (a) |
8,500 |
16,203 |
|
|
Monarch Dental Corp. (a) |
400 |
925 |
|
|
Neurocrine Biosciences, Inc. (a) |
4,100 |
169,638 |
|
|
Orthodontic Centers of America, Inc. (a) |
3,400 |
111,350 |
|
|
Orthologic Corp. (a) |
9,300 |
29,644 |
|
|
Oxford Health Plans, Inc. (a) |
8,400 |
256,200 |
|
|
PacifiCare Health Systems, Inc. |
6,400 |
345,200 |
|
|
Paracelsus Healthcare Corp. (a) |
300 |
15 |
|
|
Pediatric Services of America, Inc. (a) |
100 |
394 |
|
|
Pediatrix Medical Group (a) |
7,300 |
97,181 |
|
|
Phycor, Inc. (a) |
20,900 |
2,717 |
|
|
PMR Corp. |
300 |
731 |
|
|
Province Healthcare Co. (a) |
4,600 |
206,425 |
|
|
Psychemedics Corp. |
300 |
1,425 |
|
|
Quest Diagnostics, Inc. (a) |
5,900 |
730,125 |
|
|
Quorum Health Group, Inc. (a) |
11,600 |
149,350 |
|
|
Raytel Medical Corp. (a) |
100 |
84 |
|
|
RehabCare Group, Inc. (a) |
4,600 |
171,925 |
|
|
Renal Care Group, Inc. (a) |
9,700 |
196,425 |
|
|
Res-Care, Inc. (a) |
6,750 |
32,695 |
|
|
Response Oncology, Inc. (a) |
200 |
225 |
|
|
RightCHOICE Managed Care, Inc. |
200 |
3,950 |
|
|
Sierra Health Services, Inc. (a) |
6,800 |
18,700 |
|
|
Sunrise Assisted Living, Inc. (a) |
7,500 |
149,063 |
|
|
Syncor International Corp. (a) |
4,300 |
172,000 |
|
|
Total Renal Care Holdings, Inc. (a) |
4,100 |
28,700 |
|
|
TransWorld Healthcare, Inc. (a) |
100 |
200 |
|
|
Triad Hospitals, Inc. (a) |
7,600 |
219,450 |
|
|
|
|||
|
Shares |
Value (Note 1) |
||
|
Trigon Healthcare, Inc. (a) |
4,800 |
$ 247,800 |
|
|
UniHolding Corp. (a) |
100 |
13 |
|
|
United Wisconsin Services, Inc. |
200 |
1,050 |
|
|
Universal Health Services, Inc. Class B (a) |
2,800 |
198,100 |
|
|
Urocor, Inc. (a) |
100 |
663 |
|
|
Urologix, Inc. (a) |
600 |
5,100 |
|
|
US Oncology, Inc. (a) |
20,058 |
112,199 |
|
|
Vencor, Inc. (a) |
2,400 |
228 |
|
|
VisionAmerica, Inc. (a) |
1,800 |
675 |
|
|
|
6,202,199 |
||
|
TOTAL HEALTH |
55,783,504 |
||
|
HOLDING COMPANIES - 0.0% |
|||
|
Leucadia National Corp. |
6,700 |
175,038 |
|
|
Triarc Companies, Inc. Class A (a) |
775 |
17,631 |
|
|
TOTAL HOLDING COMPANIES |
192,669 |
||
|
INDUSTRIAL MACHINERY & EQUIPMENT - 2.8% |
|||
|
Electrical Equipment - 1.3% |
|||
|
A.O. Smith Corp. Class B |
700 |
11,025 |
|
|
Acme Electric Corp. (a) |
100 |
834 |
|
|
Adaptive Broadband Corp. (a) |
3,200 |
100,000 |
|
|
Adtran, Inc. (a) |
6,000 |
321,375 |
|
|
Advanced Lighting Technologies, Inc. (a) |
2,400 |
38,400 |
|
|
Airnet Communications Corp. |
2,900 |
96,244 |
|
|
Allen Telecom, Inc. (a) |
900 |
17,944 |
|
|
American Superconductor Corp. (a) |
2,400 |
101,850 |
|
|
AMETEK, Inc. |
2,600 |
55,575 |
|
|
AML Communications, Inc. (a) |
5,300 |
17,556 |
|
|
Amplidyne, Inc. (a) |
2,500 |
7,578 |
|
|
Andersen Group, Inc. (a) |
3,500 |
41,125 |
|
|
Andrea Electronics Corp. (a) |
3,700 |
28,906 |
|
|
Anicom, Inc. (a) |
6,900 |
26,522 |
|
|
Anixter International, Inc. (a) |
6,100 |
213,500 |
|
|
ANTEC Corp. (a) |
3,400 |
122,613 |
|
|
Avid Technology, Inc. (a) |
5,400 |
75,938 |
|
|
AZZ, Inc. |
100 |
1,638 |
|
|
Baldor Electric Co. |
1,266 |
24,845 |
|
|
BMC Industries, Inc. |
900 |
5,063 |
|
|
C&D Technologies, Inc. |
3,400 |
187,850 |
|
|
C-COR.net Corp. (a) |
2,500 |
48,750 |
|
|
C-Cube Microsystems, Inc. |
400 |
9,300 |
|
|
California Amplifier, Inc. (a) |
1,200 |
50,100 |
|
|
Chyron Corp. (a) |
7,000 |
13,125 |
|
|
Communications Systems, Inc. |
5,500 |
94,188 |
|
|
Comtech Telecommunications Corp. (a) |
3,900 |
69,225 |
|
|
Cymer, Inc. (a) |
2,800 |
128,625 |
|
|
Data Critical Corp. |
4,700 |
42,300 |
|
|
Datakey, Inc. (a) |
3,000 |
26,625 |
|
|
Destron Fearing Corp. (a) |
10,700 |
56,175 |
|
|
Detection Systems, Inc. (a) |
100 |
913 |
|
|
Electric Fuel Corp. (a) |
7,100 |
68,338 |
|
|
Common Stocks - continued |
|||
|
Shares |
Value (Note 1) |
||
|
INDUSTRIAL MACHINERY & EQUIPMENT - continued |
|||
|
Electrical Equipment - continued |
|||
|
Electro Rent Corp. (a) |
1,700 |
$ 20,825 |
|
|
Emcee Broadcast Products, Inc. (a) |
3,000 |
11,250 |
|
|
EMS Technologies, Inc. (a) |
4,100 |
70,469 |
|
|
Energizer Holdings, Inc. (a) |
18,000 |
355,500 |
|
|
Energy Conversion Devices, Inc. (a) |
4,700 |
131,306 |
|
|
Excel Technology, Inc. (a) |
2,900 |
107,119 |
|
|
Franklin Electric Co., Inc. |
200 |
13,050 |
|
|
FuelCell Energy, Inc. (a) |
2,000 |
238,000 |
|
|
General Electric Co. |
1,949 |
114,382 |
|
|
Genlyte Group, Inc. (a) |
500 |
11,688 |
|
|
Gentner Communications Corp. (a) |
3,900 |
58,256 |
|
|
Glenayre Technologies, Inc. (a) |
4,900 |
53,288 |
|
|
Global Technologies Ltd. (a) |
2,550 |
8,925 |
|
|
Globecomm Systems, Inc. (a) |
1,700 |
17,850 |
|
|
H Power Corp. |
7,100 |
145,550 |
|
|
Harris Corp. |
8,300 |
249,519 |
|
|
Hubbell, Inc. Class B |
4,100 |
106,088 |
|
|
IEC Electronics Corp. (a) |
100 |
163 |
|
|
iGo Corp. |
4,700 |
12,925 |
|
|
Infinite Group, Inc. (a) |
2,800 |
11,725 |
|
|
Information Resources |
2,200 |
79,200 |
|
|
L-3 Communications Holdings, Inc. (a) |
4,300 |
254,238 |
|
|
Littelfuse, Inc. (a) |
3,900 |
141,619 |
|
|
Loral Space & Communications Ltd. (a) |
31,500 |
242,156 |
|
|
LSI, Industries, Inc. |
100 |
1,988 |
|
|
MagneTek, Inc. (a) |
1,900 |
20,188 |
|
|
Metretek Technologies, Inc. (a) |
2,400 |
10,050 |
|
|
Optelecom, Inc. (a) |
2,300 |
19,263 |
|
|
Owosso Corp. |
100 |
175 |
|
|
Pinnacle Systems (a) |
6,000 |
75,750 |
|
|
Plug Power, Inc. |
5,700 |
255,075 |
|
|
Powerwave Technologies, Inc. (a) |
6,900 |
332,063 |
|
|
Rayovac Corp. (a) |
2,300 |
40,825 |
|
|
Repeater Technologies, Inc. |
3,000 |
51,938 |
|
|
Rofin Sinar Technologies, Inc. (a) |
400 |
6,000 |
|
|
Roper Industries, Inc. |
2,100 |
67,988 |
|
|
Satcon Technology Corp. (a) |
3,300 |
114,263 |
|
|
Sensormatic Electronics Corp. (a) |
6,500 |
108,063 |
|
|
SLI, Inc. |
2,150 |
20,694 |
|
|
Socket Communications, Inc. (a) |
1,400 |
24,413 |
|
|
SonicWALL, Inc. |
3,300 |
251,213 |
|
|
Spectra Physics Lasers, Inc. (a) |
2,900 |
201,188 |
|
|
Spectrian Corp. (a) |
900 |
14,850 |
|
|
Spectrum Control, Inc. (a) |
4,400 |
77,550 |
|
|
STM Wireless, Inc. Class A (a) |
4,500 |
28,688 |
|
|
Telaxis Communications Corp. |
3,120 |
47,190 |
|
|
Teledyne Technologies, Inc. (a) |
6,600 |
132,825 |
|
|
Teleflex, Inc. |
5,200 |
185,250 |
|
|
Telular Corp. (a) |
4,375 |
81,484 |
|
|
Transcrypt International, Inc. (a) |
400 |
563 |
|
|
|
|||
|
Shares |
Value (Note 1) |
||
|
Triton Network Systems, Inc. |
4,300 |
$ 80,894 |
|
|
ViaSat, Inc. (a) |
1,100 |
65,863 |
|
|
Vicor Corp. (a) |
6,700 |
292,288 |
|
|
ViewCast.com, Inc. (a) |
11,100 |
33,994 |
|
|
Vyyo, Inc. |
3,300 |
113,850 |
|
|
Wegener Corp. (a) |
12,400 |
31,388 |
|
|
WESCO International, Inc. (a) |
5,100 |
45,581 |
|
|
Zoltek Companies, Inc. (a) |
2,700 |
21,431 |
|
|
|
7,413,962 |
||
|
Industrial Machinery & Equipment - 1.3% |
|||
|
Active Power, Inc. |
5,000 |
351,250 |
|
|
Ag-Chem Equipment, Inc. (a) |
100 |
950 |
|
|
AGCO Corp. |
7,400 |
77,700 |
|
|
Alamo Group, Inc. |
100 |
1,325 |
|
|
Allied Products Corp. |
300 |
469 |
|
|
Applied Industrial Technologies, Inc. |
1,100 |
18,631 |
|
|
Applied Power, Inc. Class A |
7,955 |
39,278 |
|
|
Astec Industries, Inc. (a) |
5,400 |
105,975 |
|
|
Asyst Technologies, Inc. (a) |
2,800 |
73,325 |
|
|
Autologic Information |
100 |
306 |
|
|
Axcelis Technologies, Inc. |
12,100 |
218,556 |
|
|
Baldwin Technology Co., Inc. Class A (a) |
100 |
194 |
|
|
BioSphere Medical, Inc. (a) |
2,400 |
27,450 |
|
|
BOLDER Technologies Corp. (a) |
3,300 |
20,625 |
|
|
Brooks Automation, Inc. (a) |
2,100 |
116,156 |
|
|
Brown & Sharpe Manufacturing Co. Class A (a) |
100 |
213 |
|
|
Capstone Turbine Corp. |
11,600 |
1,070,825 |
|
|
Cascade Corp. |
100 |
1,350 |
|
|
Chart Industries, Inc. (a) |
150 |
816 |
|
|
CMI Corp. Class A |
200 |
450 |
|
|
Columbus McKinnon Corp. |
500 |
7,313 |
|
|
CTB International Corp. (a) |
100 |
750 |
|
|
CUNO, Inc. (a) |
1,100 |
31,350 |
|
|
Detroit Diesel Corp. |
1,700 |
38,781 |
|
|
Donaldson Co., Inc. |
4,300 |
90,838 |
|
|
DT Industries, Inc. (a) |
3,500 |
34,563 |
|
|
Eco Soil Systems, Inc. (a) |
500 |
719 |
|
|
EMCORE Corp. (a) |
1,800 |
200,700 |
|
|
ESCO Technologies, Inc. (a) |
200 |
3,688 |
|
|
Exide Corp. |
800 |
7,200 |
|
|
Fansteel, Inc. (a) |
100 |
406 |
|
|
Fedders Corp. |
4,500 |
23,344 |
|
|
Flow International Corp. (a) |
800 |
8,600 |
|
|
FSI International, Inc. (a) |
7,403 |
131,403 |
|
|
Gardner Denver Machinery, Inc. (a) |
750 |
10,922 |
|
|
Gasonics International Corp. (a) |
5,100 |
122,400 |
|
|
Gehl Co. (a) |
100 |
1,431 |
|
|
Gorman-Rupp Co. |
100 |
1,875 |
|
|
Graco, Inc. |
1,650 |
58,472 |
|
|
Greenbrier Companies, Inc. |
100 |
825 |
|
|
Hardinge, Inc. |
250 |
2,750 |
|
|
Harnischfeger Industries, Inc. (a) |
6,400 |
2,112 |
|
|
Common Stocks - continued |
|||
|
Shares |
Value (Note 1) |
||
|
INDUSTRIAL MACHINERY & EQUIPMENT - continued |
|||
|
Industrial Machinery & Equipment - continued |
|||
|
Hirsch International Corp. Class A (a) |
600 |
$ 750 |
|
|
Hughes Supply, Inc. |
700 |
14,910 |
|
|
Ibis Technology Corp. (a) |
2,400 |
104,400 |
|
|
IDEX Corp. |
2,600 |
78,975 |
|
|
Industrial Distribution Group, Inc. (a) |
100 |
288 |
|
|
Ionics, Inc. (a) |
800 |
23,850 |
|
|
JLG Industries, Inc. |
4,200 |
48,563 |
|
|
JLK Direct Distrution, Inc. Class A (a) |
300 |
2,100 |
|
|
Kaman Corp. Class A |
800 |
10,500 |
|
|
Kaydon Corp. |
2,700 |
59,569 |
|
|
Kennametal, Inc. |
7,200 |
184,500 |
|
|
Key Technology, Inc. (a) |
100 |
869 |
|
|
Lancer Corp. (a) |
100 |
400 |
|
|
Lawson Products, Inc. |
300 |
7,575 |
|
|
Lincoln Electric Holdings, Inc. |
1,400 |
20,475 |
|
|
Lindsay Manufacturing Co. |
350 |
6,388 |
|
|
Mark IV Industries, Inc. |
8,700 |
194,663 |
|
|
Mattson Technology, Inc. (a) |
6,000 |
131,250 |
|
|
Middleby Corp. (a) |
100 |
669 |
|
|
Minuteman International, Inc. |
700 |
5,775 |
|
|
MSC Industrial Direct, Inc. (a) |
3,500 |
56,875 |
|
|
MTS Systems Corp. |
600 |
3,788 |
|
|
NN, Inc. |
200 |
1,725 |
|
|
Nordson Corp. |
4,200 |
271,950 |
|
|
Osmonics, Inc. (a) |
200 |
1,700 |
|
|
Pentair, Inc. |
8,700 |
282,750 |
|
|
Presstek, Inc. (a) |
7,800 |
132,113 |
|
|
PRI Automation, Inc. (a) |
2,100 |
108,413 |
|
|
Regal-Beloit Corp. |
600 |
10,350 |
|
|
Robotic Vision Systems, Inc. (a) |
8,500 |
107,844 |
|
|
Sauer-Danfoss, Inc. |
800 |
7,300 |
|
|
Semitool, Inc. (a) |
6,400 |
80,400 |
|
|
Specialty Equipment Companies, Inc. (a) |
1,200 |
32,475 |
|
|
SpeedFam-IPEC, Inc. (a) |
5,642 |
105,082 |
|
|
Speizman Industries, Inc. (a) |
100 |
269 |
|
|
Stewart & Stevenson Services, Inc. |
11,100 |
178,988 |
|
|
Strategic Distribution, Inc. (a) |
200 |
388 |
|
|
Tennant Co. |
400 |
17,550 |
|
|
Tenneco Automotive, Inc. |
4,900 |
34,913 |
|
|
Terex Corp. (a) |
7,900 |
144,669 |
|
|
Thermo Fibertek, Inc. (a) |
4,000 |
16,500 |
|
|
Thomas Industries, Inc. |
750 |
15,141 |
|
|
Tokheim Corp. (a) |
100 |
25 |
|
|
Toro Co. |
2,000 |
60,500 |
|
|
TurboChef Technologies, Inc. (a) |
500 |
1,875 |
|
|
UCAR International, Inc. (a) |
7,200 |
98,100 |
|
|
Ultratech Stepper, Inc. (a) |
5,600 |
100,800 |
|
|
UNOVA, Inc. (a) |
4,600 |
34,500 |
|
|
Valmont Industries, Inc. |
900 |
17,044 |
|
|
|
|||
|
Shares |
Value (Note 1) |
||
|
Varian Semiconductor Equipment Associates, Inc. (a) |
4,200 |
$ 239,925 |
|
|
Veeco Instruments, Inc. (a) |
2,289 |
205,152 |
|
|
Water Pik Technologies, Inc. (a) |
4,400 |
38,500 |
|
|
Waterlink, Inc. (a) |
100 |
231 |
|
|
Western Power & Equipment Corp. (a) |
100 |
538 |
|
|
WJ Communications, Inc. |
16,200 |
954,788 |
|
|
|
7,165,916 |
||
|
Pollution Control - 0.2% |
|||
|
Airtech International Group, Inc. (a) |
7,500 |
7,969 |
|
|
Aquagenix, Inc. (a) |
100 |
1 |
|
|
BHA Group Holdings, Inc. Class A |
110 |
1,183 |
|
|
Calgon Carbon Corp. |
1,300 |
11,050 |
|
|
Casella Waste Systems, Inc. Class A (a) |
8,073 |
79,216 |
|
|
CET Environmental Services, Inc. (a) |
100 |
100 |
|
|
Earth Sciences, Inc. (a) |
800 |
152 |
|
|
Flanders Corp. (a) |
200 |
538 |
|
|
Fusion Networks Holdings, Inc. (a) |
3,170 |
5,548 |
|
|
GTS Duratek, Inc. (a) |
100 |
850 |
|
|
Insituform Technologies, Inc. Class A (a) |
6,600 |
202,538 |
|
|
IT Group, Inc. (a) |
3,716 |
16,258 |
|
|
Kaiser Group International, Inc. (a) |
400 |
15 |
|
|
Met-Pro Corp. |
100 |
1,025 |
|
|
Republic Services, Inc. (a) |
24,200 |
353,925 |
|
|
Stericycle, Inc. (a) |
5,100 |
114,750 |
|
|
U.S. Liquids, Inc. (a) |
500 |
2,188 |
|
|
U.S. Plastic Lumber Co. (a) |
6,200 |
21,894 |
|
|
Waste Connections, Inc. (a) |
4,100 |
95,325 |
|
|
Waste Industries, Inc. (a) |
800 |
8,400 |
|
|
|
922,925 |
||
|
TOTAL INDUSTRIAL MACHINERY & EQUIPMENT |
15,502,803 |
||
|
MEDIA & LEISURE - 6.9% |
|||
|
Broadcasting - 3.9% |
|||
|
5th Avenue Channel Corp. (a) |
500 |
203 |
|
|
ACT Teleconferencing, Inc. (a) |
2,700 |
15,525 |
|
|
Adelphia Communications Corp. |
14,571 |
488,129 |
|
|
American Tower Corp. Class A (a) |
20,620 |
748,764 |
|
|
Beasley Broadcast Group, Inc. Class A |
6,600 |
81,263 |
|
|
BHC Communications, Inc. Class A |
2,000 |
306,000 |
|
|
Cablevision Systems Corp. Class A (a) |
18,838 |
1,266,856 |
|
|
CAIS Internet, Inc. (a) |
4,400 |
35,475 |
|
|
Charter Communications, Inc. |
22,600 |
346,063 |
|
|
Chris-Craft Industries, Inc. |
6,087 |
476,308 |
|
|
Citadel Communications Corp. (a) |
6,200 |
127,100 |
|
|
Classic Communications, Inc. Class A |
4,600 |
23,000 |
|
|
Clear Channel Communications, Inc. (a) |
28,707 |
2,077,669 |
|
|
Cox Communications, Inc. Class A (a) |
78,231 |
2,782,090 |
|
|
Cox Radio, Inc. Class A (a) |
2,400 |
49,950 |
|
|
CTC Communications Group, Inc. (a) |
5,600 |
137,900 |
|
|
Cumulus Media, Inc. (a) |
2,000 |
14,750 |
|
|
Dial-Through International Corp. (a) |
4,800 |
13,800 |
|
|
Common Stocks - continued |
|||
|
Shares |
Value (Note 1) |
||
|
MEDIA & LEISURE - continued |
|||
|
Broadcasting - continued |
|||
|
Digital Generation Systems, Inc. (a) |
5,100 |
$ 30,919 |
|
|
E.W. Scripps Co. Class A |
12,700 |
643,731 |
|
|
EchoStar Communications Corp. |
29,100 |
1,418,625 |
|
|
Emmis Communications Corp. |
4,100 |
134,531 |
|
|
Entercom Communications Corp. |
2,500 |
103,281 |
|
|
Granite Broadcasting Corp. (a) |
3,800 |
18,763 |
|
|
Hearst-Argyle Television, Inc. (a) |
2,383 |
51,532 |
|
|
Hispanic Broadcasting Corp. (a) |
15,400 |
395,588 |
|
|
i3 Mobile, Inc. |
5,000 |
45,313 |
|
|
Infinity Broadcasting Corp. Class A (a) |
53,493 |
2,026,047 |
|
|
Insight Communications, Inc. |
8,800 |
156,750 |
|
|
Liberty Digital, Inc. (a) |
4,600 |
113,850 |
|
|
Liberty Satellite & Technology, Inc.: |
|
|
|
|
Class A (a) |
4,700 |
57,575 |
|
|
Class B (a) |
100 |
1,225 |
|
|
LodgeNet Entertainment Corp. (a) |
3,900 |
103,594 |
|
|
Mediacom Communications Corp. |
11,450 |
162,984 |
|
|
Metro One Telecommunications, Inc. (a) |
2,500 |
33,750 |
|
|
Metromedia International Group, Inc. (a) |
3,535 |
13,919 |
|
|
Motient Corp. (a) |
3,900 |
47,288 |
|
|
Netro Corp. |
5,800 |
479,225 |
|
|
New Frontier Media, Inc. (a) |
4,200 |
25,988 |
|
|
NorthPoint Communication |
17,000 |
194,438 |
|
|
NTL, Inc. (a) |
19,543 |
856,228 |
|
|
NTN Communications, Inc. (a) |
5,300 |
16,231 |
|
|
Nucentrix Broadband Netwks, Inc. (a) |
1,300 |
33,963 |
|
|
PanAmSat Corp. (a) |
6,000 |
194,625 |
|
|
Paxson Communications Corp. (a) |
4,600 |
63,250 |
|
|
Pegasus Communications Corp. (a) |
4,400 |
218,900 |
|
|
Radio One, Inc. Class A (a) |
5,700 |
120,056 |
|
|
Radio Unica Communications Corp. |
1,600 |
11,700 |
|
|
Regent Communication, Inc. |
9,200 |
80,500 |
|
|
RnetHealth.com, Inc. (a) |
8,400 |
5,628 |
|
|
Sinclair Broadcast Group, Inc. |
12,800 |
154,400 |
|
|
Sirius Satellite Radio, Inc. (a) |
5,700 |
293,550 |
|
|
Spanish Broadcasting System, Inc. |
5,600 |
56,350 |
|
|
Spectrasite Holdings, Inc. (a) |
13,500 |
316,406 |
|
|
Telscape International, Inc. (a) |
4,700 |
18,800 |
|
|
TiVo, Inc. |
4,300 |
103,738 |
|
|
United Television, Inc. |
300 |
43,200 |
|
|
UnitedGlobalCom, Inc. Class A (a) |
9,400 |
360,138 |
|
|
Univision Communications, Inc. |
29,500 |
1,301,688 |
|
|
US Wireless Corp. (a) |
4,600 |
59,800 |
|
|
USA Networks, Inc. (a) |
35,922 |
864,373 |
|
|
|
|||
|
Shares |
Value (Note 1) |
||
|
ValueVision International, Inc. (a) |
4,600 |
$ 134,838 |
|
|
Westwood One, Inc. (a) |
12,800 |
356,000 |
|
|
Wireless Facilities, Inc. |
5,000 |
375,000 |
|
|
WorldQuest Networks, Inc. |
1,860 |
8,951 |
|
|
Xm Satellite Radio Holdings, Inc. Class A |
4,900 |
209,475 |
|
|
Young Broadcasting, Inc. Class A (a) |
3,400 |
120,275 |
|
|
|
21,627,824 |
||
|
Entertainment - 1.1% |
|||
|
4Kids Entertainment, Inc. (a) |
4,200 |
88,200 |
|
|
Alliance Gaming Corp. (a) |
200 |
500 |
|
|
AMC Entertainment, Inc. (a) |
1,400 |
2,625 |
|
|
American Champion |
4,600 |
4,600 |
|
|
American Classic Voyager Co. (a) |
4,700 |
79,900 |
|
|
American Coin Merchandising, Inc. (a) |
300 |
825 |
|
|
American Wagering, Inc. (a) |
4,600 |
4,600 |
|
|
Ameristar Casinos, Inc. (a) |
100 |
456 |
|
|
AMF Bowling, Inc. (a) |
1,900 |
1,069 |
|
|
Bally Total Fitness Holding Corp. (a) |
2,700 |
66,656 |
|
|
Brilliant Digital Entertainment, Inc. (a) |
4,500 |
20,250 |
|
|
Carmike Cinemas, Inc. Class A (a) |
2,200 |
1,513 |
|
|
Cedar Fair LP (depository unit) |
600 |
10,800 |
|
|
Fox Entertainment Group, Inc. Class A (a) |
23,100 |
668,456 |
|
|
Hollywood Entertainment Corp. (a) |
4,500 |
31,500 |
|
|
Image Entertainment, Inc. (a) |
800 |
3,300 |
|
|
International Speedway Corp. Class A |
8,510 |
288,276 |
|
|
Internet Pictures Corp. |
8,511 |
66,492 |
|
|
Isle Capri Casinos, Inc. (a) |
7,600 |
118,750 |
|
|
J2 Communications (a) |
600 |
8,175 |
|
|
Kushner Locke Co. (a) |
5,900 |
9,588 |
|
|
Lakes Gaming, Inc. (a) |
350 |
3,128 |
|
|
Laser-Pacific Media Corp. (a) |
1,800 |
6,300 |
|
|
Liberty Livewire Corp. Class A (a) |
560 |
27,475 |
|
|
Littlefield Corp. (a) |
500 |
1,094 |
|
|
Mandalay Resort Group (a) |
11,700 |
325,406 |
|
|
Metro-Goldwyn-Mayer, Inc. (a) |
23,300 |
597,063 |
|
|
MGM Grand, Inc. |
23,806 |
818,331 |
|
|
MTR Gaming Group, Inc. (a) |
9,700 |
82,147 |
|
|
Multimedia Games, Inc. (a) |
300 |
1,350 |
|
|
Musicmaker.com, Inc. |
10,700 |
10,031 |
|
|
NetCurrents, Inc. (a) |
8,400 |
16,800 |
|
|
On Command Corp. (a) |
1,100 |
14,575 |
|
|
Park Place Entertainment Corp. (a) |
49,900 |
732,906 |
|
|
Pinnacle Entertainment, Inc. (a) |
6,000 |
123,750 |
|
|
Pixar (a) |
7,600 |
250,800 |
|
|
Platinum Entertainment, Inc. (a) |
500 |
45 |
|
|
Rentrak Corp. (a) |
400 |
1,450 |
|
|
Royal Caribbean Cruises Ltd. |
23,800 |
544,425 |
|
|
Scientific Games Holdings Corp. (a) |
700 |
18,113 |
|
|
Six Flags, Inc. (a) |
10,400 |
155,350 |
|
|
Speedway Motorsports, Inc. (a) |
3,800 |
98,088 |
|
|
Team Communications Group, Inc. (a) |
3,900 |
28,275 |
|
|
The Sports Club Co., Inc. (a) |
100 |
325 |
|
|
Common Stocks - continued |
|||
|
Shares |
Value (Note 1) |
||
|
MEDIA & LEISURE - continued |
|||
|
Entertainment - continued |
|||
|
Ticketmaster Online CitySearch, Inc. Class B (a) |
5,600 |
$ 134,750 |
|
|
Tickets.com, Inc. |
6,400 |
9,800 |
|
|
Trimark Holdings, Inc. (a) |
100 |
931 |
|
|
United Leisure Corp. (a) |
3,600 |
25,200 |
|
|
Vail Resorts, Inc. (a) |
1,100 |
20,213 |
|
|
VDI MultiMedia (a) |
2,600 |
10,725 |
|
|
Venture Catalyst, Inc. (a) |
4,800 |
16,500 |
|
|
World Wrestling Federation Entertainment, Inc. Class A |
5,200 |
111,150 |
|
|
Zomax, Inc. (a) |
4,200 |
81,638 |
|
|
|
5,744,665 |
||
|
Leisure Durables & Toys - 0.1% |
|||
|
Adams Golf, Inc. (a) |
900 |
1,013 |
|
|
Aldila, Inc. (a) |
900 |
2,025 |
|
|
Arctic Cat, Inc. |
900 |
10,659 |
|
|
Callaway Golf Co. |
5,800 |
83,738 |
|
|
Champion Enterprises, Inc. (a) |
1,500 |
9,938 |
|
|
Coachmen Industries, Inc. |
600 |
6,675 |
|
|
Coastcast Corp. (a) |
300 |
4,669 |
|
|
Direct Focus, Inc. (a) |
4,200 |
125,738 |
|
|
Equity Marketing, Inc. (a) |
2,300 |
32,488 |
|
|
Huffy Corp. |
400 |
4,425 |
|
|
JAKKS Pacific, Inc. (a) |
5,500 |
97,625 |
|
|
K2, Inc. (a) |
500 |
5,531 |
|
|
L.L. Knickerbocker Co. (a) |
200 |
30 |
|
|
Marvel Enterprises, Inc. (a) |
1,000 |
4,750 |
|
|
National R.V. Holdings, Inc. (a) |
1,500 |
14,719 |
|
|
Play By Play Toys & Novelties, Inc. (a) |
3,400 |
4,038 |
|
|
Polaris Industries, Inc. |
2,100 |
71,663 |
|
|
PTI Holding, Inc. (a) |
100 |
55 |
|
|
Rawlings Sporting Goods, Inc. (a) |
5,800 |
35,163 |
|
|
RockShox, Inc. (a) |
100 |
81 |
|
|
Russ Berrie & Co., Inc. |
700 |
14,350 |
|
|
Silicon Gaming, Inc. warrants 7/26/04 (a) |
800 |
0 |
|
|
Steinway Musical Instruments, Inc. (a) |
200 |
3,550 |
|
|
T-HQ, Inc. (a) |
3,800 |
81,225 |
|
|
Thor Industries, Inc. |
350 |
8,159 |
|
|
Toymax International, Inc. (a) |
3,100 |
9,300 |
|
|
West Marine, Inc. (a) |
1,400 |
12,600 |
|
|
Winnebago Industries, Inc. |
2,200 |
28,188 |
|
|
|
672,395 |
||
|
Lodging & Gaming - 0.5% |
|||
|
Anchor Gaming (a) |
3,400 |
249,050 |
|
|
Argosy Gaming Co. (a) |
9,700 |
155,200 |
|
|
Aztar Corp. (a) |
1,300 |
18,931 |
|
|
Boca Resorts, Inc. Class A (a) |
500 |
5,563 |
|
|
Boyd Gaming Corp. (a) |
6,300 |
29,138 |
|
|
Buckhead America Corp. (a) |
100 |
488 |
|
|
|
|||
|
Shares |
Value (Note 1) |
||
|
Championship Auto Racing |
1,400 |
$ 32,638 |
|
|
Choice Hotels International, Inc. (a) |
2,100 |
18,769 |
|
|
Churchill Downs, Inc. |
1,600 |
37,800 |
|
|
Crestline Capital Corp. (a) |
2,170 |
42,722 |
|
|
Dover Downs Entertainment, Inc. |
9,700 |
97,606 |
|
|
Extended Stay America, Inc. (a) |
6,100 |
90,356 |
|
|
Gaylord Entertainment Co. |
1,000 |
26,125 |
|
|
Gtech Holdings Corp. (a) |
7,400 |
132,275 |
|
|
Hotelworks.com, Inc. (a) |
100 |
94 |
|
|
International Game Technology (a) |
11,241 |
325,989 |
|
|
Interstate Hotels Corp. Class A (a) |
170 |
393 |
|
|
Jackpot Enterprises, Inc. (a) |
5,700 |
59,494 |
|
|
John Q. Hammons Hotels, Inc. |
100 |
694 |
|
|
Lodgian, Inc. (a) |
1,000 |
2,688 |
|
|
Marcus Corp. |
950 |
11,697 |
|
|
MeriStar Hotels & Resorts, Inc. (a) |
150 |
375 |
|
|
Penn National Gaming, Inc. (a) |
200 |
2,800 |
|
|
Prime Hospitality Corp. (a) |
14,960 |
155,210 |
|
|
ShoLodge, Inc. (a) |
100 |
466 |
|
|
Starwood Hotels & Resorts |
29,480 |
943,360 |
|
|
Station Casinos, Inc. (a) |
11,100 |
159,563 |
|
|
Suburban Lodges of America, Inc. (a) |
4,200 |
30,188 |
|
|
Sunburst Hospitality Corp. (a) |
300 |
1,538 |
|
|
Sunterra Corp. (a) |
2,400 |
264 |
|
|
Trump Hotels & Casino Resorts, Inc. (a) |
2,900 |
7,975 |
|
|
U.S. Franchise Systems, Inc. Class A (a) |
11,600 |
50,750 |
|
|
WMS Industries, Inc. (a) |
7,200 |
115,200 |
|
|
|
2,805,399 |
||
|
Publishing - 0.8% |
|||
|
A.H. Belo Corp. Class A |
15,800 |
302,175 |
|
|
Applied Graphics Technologies, Inc. (a) |
10,360 |
39,498 |
|
|
Banta Corp. |
1,000 |
22,063 |
|
|
Franklin Covey Co. (a) |
900 |
6,019 |
|
|
Harte Hanks Communications, Inc. |
5,100 |
128,138 |
|
|
Hollinger International, Inc. Class A |
21,400 |
350,425 |
|
|
Houghton Mifflin Co. |
6,400 |
314,800 |
|
|
IDG Books Worldwide, Inc. (a) |
700 |
6,322 |
|
|
Individual Investor Group, Inc. (a) |
900 |
1,463 |
|
|
John Wiley & Sons, Inc. Class A |
4,800 |
95,400 |
|
|
Journal Register Co. (a) |
1,600 |
26,400 |
|
|
Lee Enterprises, Inc. |
1,500 |
42,000 |
|
|
Martha Stewart Living Omnimedia, Inc. Class A |
5,400 |
182,250 |
|
|
Media General, Inc. Class A |
3,200 |
164,800 |
|
|
Nelson Thomas, Inc. |
200 |
1,600 |
|
|
Pacific Chemical, Inc. (a) |
100 |
0 |
|
|
Penton Media, Inc. |
2,400 |
75,150 |
|
|
Plato Learning, Inc. (a) |
6,400 |
91,200 |
|
|
Playboy Enterprises, Inc. Class B (non-vtg.) (a) |
1,200 |
17,625 |
|
|
PRIMEDIA, Inc. (a) |
17,100 |
305,663 |
|
|
Common Stocks - continued |
|||
|
Shares |
Value (Note 1) |
||
|
MEDIA & LEISURE - continued |
|||
|
Publishing - continued |
|||
|
Pulitzer, Inc. |
1,000 |
$ 43,063 |
|
|
Reader's Digest Association, Inc. |
16,700 |
642,950 |
|
|
Scholastic Corp. (a) |
4,000 |
256,750 |
|
|
The McClatchy Co. Class A |
5,700 |
204,131 |
|
|
Topps Co., Inc. (a) |
14,000 |
110,250 |
|
|
VCampus Corp. (a) |
3,800 |
27,550 |
|
|
Washington Post Co. Class B |
1,474 |
750,266 |
|
|
Ziff-Davis, Inc. - ZD |
11,600 |
127,600 |
|
|
|
4,335,551 |
||
|
Restaurants - 0.5% |
|||
|
Applebee's International, Inc. |
6,800 |
154,275 |
|
|
ARK Restaurants Corp. (a) |
100 |
800 |
|
|
Avado Brands, Inc. |
5,700 |
8,372 |
|
|
Benihana, Inc. Class A (a) |
100 |
1,288 |
|
|
Big Buck Brew & Steakhouse, Inc. (a) |
100 |
225 |
|
|
Bob Evans Farms, Inc. |
9,200 |
156,400 |
|
|
Boston Chicken, Inc. (a) |
1,100 |
11 |
|
|
Brinker International, Inc. (a) |
7,800 |
247,650 |
|
|
Buca, Inc. (a) |
8,000 |
90,500 |
|
|
Buffets, Inc. (a) |
11,100 |
147,075 |
|
|
CBRL Group, Inc. |
13,800 |
166,463 |
|
|
CEC Entertainment, Inc. (a) |
1,900 |
54,863 |
|
|
Champps Entertainment, Inc. (a) |
100 |
575 |
|
|
Chart House Enterprises, Inc. (a) |
100 |
581 |
|
|
Cheesecake Factory, Inc. (a) |
6,050 |
218,178 |
|
|
CKE Restaurants, Inc. |
8,643 |
34,572 |
|
|
Consolidated Products, Inc. (a) |
969 |
8,903 |
|
|
Cooker Restaurant Corp. (a) |
60 |
68 |
|
|
Creative Host Services, Inc. (a) |
4,400 |
30,800 |
|
|
Dave & Busters, Inc. (a) |
900 |
7,200 |
|
|
Einstein/Noah Bagel Corp. (a) |
500 |
35 |
|
|
Elxsi Corp. (a) |
100 |
1,150 |
|
|
Fine Host Corp. (a) |
700 |
0 |
|
|
Friendly Ice Cream Corp. (a) |
900 |
3,544 |
|
|
Frisch's Restaurants, Inc. |
100 |
1,150 |
|
|
Garden Fresh Restaurant Corp. (a) |
100 |
1,250 |
|
|
IHOP Corp. (a) |
600 |
11,775 |
|
|
Il Fornaio America Corp. (a) |
100 |
813 |
|
|
J. Alexanders Corp. (a) |
100 |
344 |
|
|
Jack in the Box, Inc. (a) |
8,300 |
183,119 |
|
|
Landry's Seafood Restaurants, Inc. |
4,200 |
33,075 |
|
|
Lone Star Steakhouse & Saloon, Inc. |
9,000 |
75,938 |
|
|
Luby's, Inc. |
4,500 |
24,750 |
|
|
Max & Ermas Restaurants, Inc. (a) |
100 |
863 |
|
|
Morrison Management Specialists, Inc. |
110 |
2,929 |
|
|
Morton's Restaurant Group, Inc. (a) |
100 |
2,100 |
|
|
New World Coffee-Manhattan |
150 |
314 |
|
|
NPC International, Inc. (a) |
700 |
6,913 |
|
|
O'Charleys, Inc. (a) |
150 |
1,913 |
|
|
|
|||
|
Shares |
Value (Note 1) |
||
|
Outback Steakhouse, Inc. (a) |
10,400 |
$ 238,550 |
|
|
P.F. Chang's China Bistro, Inc. (a) |
4,000 |
119,750 |
|
|
Panera Bread Co. (a) |
100 |
1,600 |
|
|
Papa John's International, Inc. (a) |
3,200 |
72,400 |
|
|
Piccadilly Cafeterias, Inc. |
100 |
238 |
|
|
PJ America, Inc. (a) |
2,400 |
16,650 |
|
|
PopMail.com, Inc. (a) |
10,600 |
9,275 |
|
|
Prandium, Inc. (a) |
2,800 |
434 |
|
|
Rainforest Cafe, Inc. (a) |
9,050 |
22,059 |
|
|
Rare Hospitality International, Inc. (a) |
4,200 |
118,125 |
|
|
Rubio's Restaurants, Inc. (a) |
4,200 |
27,300 |
|
|
Ruby Tuesday, Inc. |
2,400 |
30,000 |
|
|
Ryan's Family Steak Houses, Inc. (a) |
12,300 |
99,938 |
|
|
Santa Barbara Restaurant Group, Inc. (a) |
500 |
453 |
|
|
Schlotzskys, Inc. (a) |
300 |
1,153 |
|
|
Shells Seafood Restaurants, Inc. (a) |
100 |
144 |
|
|
Sodexho Marriott Services, Inc. |
3,500 |
56,875 |
|
|
Sonic Corp. (a) |
4,550 |
148,444 |
|
|
Star Buffet, Inc. (a) |
100 |
306 |
|
|
Taco Cabana, Inc. Class A (a) |
3,700 |
16,419 |
|
|
Total Entertainment Restaurant Corp. (a) |
100 |
225 |
|
|
Uno Restaurant Corp. (a) |
110 |
1,066 |
|
|
VICORP Restaurants, Inc. (a) |
91 |
1,558 |
|
|
|
2,663,736 |
||
|
TOTAL MEDIA & LEISURE |
37,849,570 |
||
|
NONDURABLES - 1.6% |
|||
|
Agriculture - 0.0% |
|||
|
Andersons, Inc. |
100 |
878 |
|
|
Charles River Labs International, Inc. |
4,100 |
112,494 |
|
|
Delta & Pine Land Co. |
2,266 |
55,375 |
|
|
Fresh America Corp. (a) |
500 |
1,188 |
|
|
Northland Cranberries, Inc. Class A |
700 |
1,138 |
|
|
Seminis, Inc. |
14,100 |
22,913 |
|
|
Tejon Ranch Co. |
400 |
9,900 |
|
|
|
203,886 |
||
|
Beverages - 0.3% |
|||
|
Beringer Wine Estates Holdings, Inc. Class B (a) |
5,500 |
304,219 |
|
|
Boston Beer Co., Inc. Class A (a) |
500 |
4,625 |
|
|
Canandaigua Brands, Inc. Class A (a) |
2,700 |
145,463 |
|
|
Coca-Cola Bottling Co. Consolidated |
200 |
8,013 |
|
|
Golden State Vintners, Inc. Class B (a) |
500 |
2,719 |
|
|
M&F Worldwide Corp. (a) |
300 |
1,631 |
|
|
National Beverage Corp. (a) |
200 |
1,400 |
|
|
Pepsi Bottling Group, Inc. |
22,200 |
704,850 |
|
|
PepsiAmericas, Inc. (a) |
100 |
369 |
|
|
Robert Mondavi Corp. Class A (a) |
3,400 |
139,400 |
|
|
Whitman Corp. |
12,100 |
159,569 |
|
|
|
1,472,258 |
||
|
Foods - 0.9% |
|||
|
Agribrands International, Inc. (a) |
900 |
35,775 |
|
|
Common Stocks - continued |
|||
|
Shares |
Value (Note 1) |
||
|
NONDURABLES - continued |
|||
|
Foods - continued |
|||
|
American Italian Pasta Co. Class A (a) |
5,000 |
$ 84,688 |
|
|
Aurora Foods, Inc. (a) |
21,600 |
83,700 |
|
|
Bridgford Foods Corp. |
110 |
1,416 |
|
|
Chiquita Brands International, Inc. |
3,800 |
12,588 |
|
|
ConAgra, Inc. |
1 |
18 |
|
|
Corn Products International, Inc. |
7,800 |
195,975 |
|
|
Cytrx Corp. (a) |
9,300 |
10,463 |
|
|
Darling International, Inc. (a) |
100 |
100 |
|
|
Dean Foods Co. |
7,800 |
243,750 |
|
|
Del Monte Foods Co. (a) |
3,300 |
21,656 |
|
|
Dole Food Co., Inc. |
8,500 |
120,063 |
|
|
Dreyer's Grand Ice Cream, Inc. |
1,200 |
24,919 |
|
|
Earthgrains Co. |
2,600 |
45,825 |
|
|
Flowers Industries, Inc. |
17,600 |
382,800 |
|
|
Gardenburger, Inc. (a) |
700 |
3,500 |
|
|
Golden Enterprises Ltd. |
100 |
313 |
|
|
Gum Tech International, Inc. (a) |
6,100 |
77,394 |
|
|
Horizon Organic Holding Corp. (a) |
700 |
6,103 |
|
|
Hormel Foods Corp. |
18,000 |
277,875 |
|
|
IBP, Inc. |
20,700 |
332,494 |
|
|
Imperial Sugar Co. |
262 |
328 |
|
|
International Multifoods Corp. |
700 |
11,419 |
|
|
Interstate Bakeries Corp. |
8,800 |
157,850 |
|
|
J&J Snack Food Corp. (a) |
100 |
1,413 |
|
|
J.M. Smucker Co. |
500 |
9,594 |
|
|
Keebler Foods Co. |
11,200 |
513,100 |
|
|
Lancaster Colony Corp. |
9,650 |
222,553 |
|
|
Lance, Inc. |
8,500 |
79,156 |
|
|
McCormick & Co., Inc. (non-vtg.) |
13,500 |
394,031 |
|
|
Michael Foods, Inc. |
5,800 |
137,750 |
|
|
Midwest Grain Products, Inc. |
100 |
900 |
|
|
Nabisco Holdings Corp. Class A |
7,800 |
416,813 |
|
|
Opta Food Ingredients, Inc. (a) |
100 |
231 |
|
|
Pierre Foods, Inc. (a) |
38 |
74 |
|
|
Pilgrims Pride Corp. |
900 |
6,131 |
|
|
Ralcorp Holdings, Inc. (a) |
1,650 |
22,275 |
|
|
Riviana Foods, Inc. |
400 |
6,850 |
|
|
Sanderson Farms, Inc. |
200 |
1,275 |
|
|
Smithfield Foods, Inc. (a) |
10,700 |
284,219 |
|
|
Suiza Foods Corp. (a) |
5,647 |
282,350 |
|
|
Tasty Baking Co. |
100 |
1,131 |
|
|
Thorn Apple Valley, Inc. (a) |
400 |
25 |
|
|
Tootsie Roll Industries, Inc. |
2,190 |
88,148 |
|
|
Tyson Foods, Inc. Class A |
19,920 |
183,015 |
|
|
Universal Foods Corp. |
12,100 |
248,050 |
|
|
Vlasic Foods International, Inc. (a) |
1,700 |
2,763 |
|
|
WLR Foods, Inc. (a) |
100 |
459 |
|
|
|
5,033,318 |
||
|
Household Products - 0.2% |
|||
|
Aptargroup, Inc. |
3,000 |
69,938 |
|
|
BioShield Technologies, Inc. (a) |
3,500 |
40,250 |
|
|
|
|||
|
Shares |
Value (Note 1) |
||
|
Block Drug Co., Inc. Class A |
933 |
$ 37,787 |
|
|
Brady Corp. Class A |
1,600 |
46,300 |
|
|
Church & Dwight Co., Inc. |
3,100 |
55,606 |
|
|
Cyclopss Corp. (a) |
400 |
172 |
|
|
Dial Corp. |
9,000 |
92,250 |
|
|
Enamelon, Inc. (a) |
800 |
248 |
|
|
Estee Lauder Companies, Inc. Class A |
16,500 |
675,469 |
|
|
French Fragrances, Inc. (a) |
500 |
3,563 |
|
|
Helen of Troy Corp. (a) |
12,400 |
69,750 |
|
|
Katy Industries, Inc. |
100 |
988 |
|
|
Mikohn Gaming Corp. (a) |
100 |
731 |
|
|
Nu Skin Enterprises, Inc. Class A (a) |
1,000 |
6,563 |
|
|
Paragon Trade Brands, Inc. warrants 1/28/10 (a) |
5 |
14 |
|
|
Perfectdata Corp. |
2,400 |
9,600 |
|
|
Playtex Products, Inc. (a) |
1,900 |
22,563 |
|
|
Racing Champions Corp. (a) |
2,600 |
3,819 |
|
|
Revlon, Inc. Class A (a) |
2,200 |
15,675 |
|
|
Tristar Corp. (a) |
100 |
575 |
|
|
Ultralife Batteries, Inc. (a) |
4,100 |
50,481 |
|
|
USA Detergents, Inc. (a) |
2,800 |
9,888 |
|
|
Yankee Candle Co., Inc. |
3,700 |
72,844 |
|
|
York Group, Inc. |
500 |
2,000 |
|
|
|
1,287,074 |
||
|
Tobacco - 0.2% |
|||
|
DIMON, Inc. |
1,500 |
4,688 |
|
|
RJ Reynolds Tobacco Holdings, Inc. |
17,900 |
642,163 |
|
|
Schweitzer-Mauduit International, Inc. |
1,000 |
14,500 |
|
|
Standard Commercial Corp. |
100 |
463 |
|
|
Universal Corp. |
8,800 |
227,700 |
|
|
|
889,514 |
||
|
TOTAL NONDURABLES |
8,886,050 |
||
|
PRECIOUS METALS - 0.1% |
|||
|
Altair International, Inc. (a) |
16,100 |
55,344 |
|
|
Battle Mountain Gold Co. (a) |
57,400 |
107,625 |
|
|
Coeur d'Alene Mines Corp. (a) |
10,500 |
17,063 |
|
|
Echo Bay Mines Ltd. (a) |
6,800 |
5,499 |
|
|
Meridian Gold, Inc. (a) |
7,100 |
47,526 |
|
|
Stillwater Mining Co. (a) |
5,850 |
198,900 |
|
|
TOTAL PRECIOUS METALS |
431,957 |
||
|
RETAIL & WHOLESALE - 2.4% |
|||
|
Apparel Stores - 0.7% |
|||
|
Abercrombie & Fitch Co. Class A (a) |
10,400 |
241,150 |
|
|
American Eagle Outfitters, Inc. (a) |
4,150 |
123,722 |
|
|
AnnTaylor Stores Corp. (a) |
2,400 |
86,400 |
|
|
Big Dog Holdings, Inc. |
50 |
269 |
|
|
Bon-Ton Stores, Inc. (a) |
3,600 |
8,550 |
|
|
Burlington Coat Factory |
2,600 |
31,688 |
|
|
Cato Corp. Class A |
900 |
11,138 |
|
|
Common Stocks - continued |
|||
|
Shares |
Value (Note 1) |
||
|
RETAIL & WHOLESALE - continued |
|||
|
Apparel Stores - continued |
|||
|
Charming Shoppes, Inc. (a) |
14,800 |
$ 80,475 |
|
|
Chico's FAS, Inc. (a) |
4,700 |
183,300 |
|
|
Christopher & Banks Corp. (a) |
3,400 |
120,700 |
|
|
Claire's Stores, Inc. |
3,800 |
74,813 |
|
|
Deb Shops, Inc. |
1,300 |
14,828 |
|
|
Dress Barn, Inc. (a) |
1,500 |
31,969 |
|
|
Ellet Brothers, Inc. |
100 |
325 |
|
|
Factory 2-U Stores, Inc. (a) |
2,400 |
82,950 |
|
|
Footstar, Inc. (a) |
4,600 |
136,850 |
|
|
Genesco, Inc. (a) |
2,100 |
33,994 |
|
|
Global Imaging Systems, Inc. (a) |
300 |
1,800 |
|
|
Goody's Family Clothing (a) |
1,100 |
5,053 |
|
|
Guess, Inc. (a) |
3,200 |
72,600 |
|
|
Gymboree Corp. (a) |
14,000 |
69,125 |
|
|
Hibbett Sporting Goods, Inc. (a) |
1,600 |
36,200 |
|
|
IKON Office Solutions, Inc. |
21,800 |
109,000 |
|
|
Intimate Brands, Inc. Class A |
61,460 |
991,043 |
|
|
iTurf, Inc. (a) |
4,600 |
7,475 |
|
|
J. Baker, Inc. |
600 |
3,000 |
|
|
Just for Feet, Inc. (a) |
4,100 |
128 |
|
|
Kenneth Cole Productions, Inc. |
3,450 |
152,016 |
|
|
Paul Harris Stores, Inc. (a) |
200 |
238 |
|
|
Payless ShoeSource, Inc. (a) |
2,782 |
148,489 |
|
|
Right Start, Inc. (a) |
1,400 |
4,463 |
|
|
Ross Stores, Inc. |
9,900 |
149,738 |
|
|
Shoe Carnival, Inc. (a) |
100 |
694 |
|
|
Stage Stores, Inc. (a) |
800 |
94 |
|
|
Syms Corp. (a) |
300 |
1,144 |
|
|
Talbots, Inc. |
3,700 |
247,669 |
|
|
The Buckle, Inc. (a) |
650 |
8,491 |
|
|
The Childrens Place Retail Stores, Inc. (a) |
1,800 |
53,100 |
|
|
The Men's Wearhouse, Inc. (a) |
7,265 |
221,583 |
|
|
Too, Inc. (a) |
2,600 |
64,025 |
|
|
Track n Trail, Inc. (a) |
100 |
44 |
|
|
United Retail Group, Inc. (a) |
500 |
3,063 |
|
|
United Stationers, Inc. (a) |
4,400 |
142,725 |
|
|
Urban Outfitters, Inc. (a) |
1,400 |
11,988 |
|
|
Venator Group, Inc. (a) |
13,800 |
193,200 |
|
|
Wet Seal, Inc. Class A (a) |
2,500 |
35,000 |
|
|
Wilsons Leather Experts, Inc. (a) |
150 |
3,056 |
|
|
|
3,999,365 |
||
|
Appliance Stores - 0.0% |
|||
|
Cellstar Corp. (a) |
25,300 |
101,200 |
|
|
Drug Stores - 0.1% |
|||
|
Drug Emporium, Inc. (a) |
5,900 |
7,006 |
|
|
Duane Reade, Inc. (a) |
4,600 |
101,775 |
|
|
E Com Ventures, Inc. (a) |
800 |
950 |
|
|
Rite Aid Corp. |
23,700 |
94,800 |
|
|
|
204,531 |
||
|
|
|||
|
Shares |
Value (Note 1) |
||
|
General Merchandise Stores - 0.5% |
|||
|
7-Eleven, Inc. (a) |
16,200 |
$ 216,675 |
|
|
99 Cents Only Stores (a) |
3,674 |
165,100 |
|
|
Ames Department Stores, Inc. (a) |
5,600 |
28,350 |
|
|
BJ's Wholesale Club, Inc. (a) |
8,600 |
291,325 |
|
|
Bradlees, Inc. (a) |
3,100 |
7,944 |
|
|
Cost Plus, Inc. (a) |
2,475 |
83,222 |
|
|
Dollar Tree Stores, Inc. (a) |
12,050 |
488,778 |
|
|
Elder Beerman Stores Corp. (a) |
2,700 |
12,150 |
|
|
EZCORP, Inc. Class A |
100 |
128 |
|
|
Family Dollar Stores, Inc. |
20,300 |
365,400 |
|
|
Freds, Inc. Class A |
5,025 |
120,600 |
|
|
Gottschalks, Inc. (a) |
300 |
1,988 |
|
|
Hot Topic, Inc. (a) |
3,100 |
87,769 |
|
|
Jo-Ann Stores, Inc. Class A (a) |
1,500 |
9,844 |
|
|
Lechters, Inc. (a) |
700 |
788 |
|
|
Mazel Stores, Inc. (a) |
500 |
3,250 |
|
|
Michaels Stores, Inc. (a) |
3,800 |
133,000 |
|
|
Neiman Marcus Group, Inc. Class A (a) |
4,500 |
151,031 |
|
|
Party City Corp. (a) |
1,450 |
4,645 |
|
|
Phar-Mor, Inc. (a) |
100 |
138 |
|
|
Pricesmart, Inc. (a) |
500 |
18,750 |
|
|
Saks, Inc. (a) |
19,913 |
199,130 |
|
|
Service Merchandise, Inc. (a) |
2,700 |
162 |
|
|
Shopko Stores, Inc. (a) |
7,300 |
83,494 |
|
|
Stein Mart, Inc. (a) |
4,300 |
50,525 |
|
|
Tuesday Morning Corp. (a) |
4,000 |
44,000 |
|
|
Value City Department Stores, Inc. (a) |
700 |
6,300 |
|
|
|
2,574,486 |
||
|
Grocery Stores - 0.3% |
|||
|
Central Garden & Pet Co. (a) |
3,600 |
27,000 |
|
|
Delhaize America, Inc. |
30,392 |
455,880 |
|
|
Fleming Companies, Inc. |
10,000 |
154,375 |
|
|
Grand Union Co. (a) |
7,700 |
1,694 |
|
|
Hain Celestial Group, Inc. (a) |
5,248 |
164,000 |
|
|
Hawaiian Natural Water Co., Inc. (a) |
100 |
19 |
|
|
HomeGrocer.com, Inc. |
14,400 |
58,500 |
|
|
Ingles Markets, Inc. Class A |
600 |
5,925 |
|
|
Krispy Kreme Doughnuts, Inc. |
1,600 |
148,800 |
|
|
Marsh Supermarkets, Inc. Class B |
100 |
1,100 |
|
|
Nash-Finch Co. |
400 |
3,900 |
|
|
Performance Food Group Co. (a) |
4,300 |
159,638 |
|
|
Pizza Inn, Inc. |
100 |
319 |
|
|
Ruddick Corp. |
4,100 |
50,225 |
|
|
Schultz Sav-O Stores, Inc. |
100 |
1,050 |
|
|
Smart & Final, Inc. (a) |
700 |
5,425 |
|
|
Synergy Brands, Inc. (a) |
4,900 |
5,819 |
|
|
United Natural Foods, Inc. (a) |
3,600 |
54,450 |
|
|
VitaminShoppe.com, Inc. |
3,400 |
3,400 |
|
|
Weis Markets, Inc. |
2,200 |
74,800 |
|
|
Whole Foods Market, Inc. (a) |
5,400 |
272,700 |
|
|
Wild Oats Markets, Inc. (a) |
8,575 |
92,181 |
|
|
|
1,741,200 |
||
|
Common Stocks - continued |
|||
|
Shares |
Value (Note 1) |
||
|
RETAIL & WHOLESALE - continued |
|||
|
Retail & Wholesale, Miscellaneous - 0.8% |
|||
|
1-800 CONTACTS, Inc. (a) |
3,800 |
$ 152,713 |
|
|
1-800-FLOWERS.COM, Inc. Class A |
5,000 |
26,250 |
|
|
800-JR Cigar, Inc. (a) |
900 |
11,531 |
|
|
AC Moore Arts & Crafts, Inc. (a) |
100 |
894 |
|
|
Action Performance Companies, Inc. (a) |
9,300 |
37,200 |
|
|
Advanced Marketing Services, Inc. |
1,200 |
21,525 |
|
|
AgriBioTech, Inc. (a) |
1,400 |
11 |
|
|
Alloy Online, Inc. (a) |
2,800 |
24,675 |
|
|
Ashford.com, Inc. |
3,300 |
9,281 |
|
|
Barnes & Noble, Inc. (a) |
7,600 |
131,575 |
|
|
Beyond.com Corp. (a) |
9,900 |
12,066 |
|
|
Blair Corp. |
600 |
13,275 |
|
|
Blue Rhino Corp. (a) |
3,000 |
11,438 |
|
|
Bluefly, Inc. (a) |
1,900 |
6,056 |
|
|
Books-A-Million, Inc. (a) |
8,200 |
26,650 |
|
|
Borders Group, Inc. (a) |
8,500 |
113,156 |
|
|
Brookstone Co., Inc. (a) |
700 |
9,144 |
|
|
Building Material Holding Corp. (a) |
400 |
3,850 |
|
|
BUY.com, Inc. |
14,110 |
39,243 |
|
|
Cannondale Corp. (a) |
300 |
1,894 |
|
|
Coldwater Creek, Inc. (a) |
3,200 |
102,400 |
|
|
Cole National Corp. Class A |
900 |
6,300 |
|
|
Concepts Direct, Inc. (a) |
100 |
356 |
|
|
Cyberian Outpost, Inc. (a) |
8,700 |
32,625 |
|
|
Daisytek International Corp. |
11,900 |
81,813 |
|
|
Damark International, Inc. Class A (a) |
1,600 |
24,925 |
|
|
dELiA*s, Inc. (a) |
3,200 |
8,000 |
|
|
Drugstore.com, Inc. |
4,600 |
28,175 |
|
|
E-Stamp Corp. |
1,300 |
1,950 |
|
|
E4L, Inc. (a) |
300 |
113 |
|
|
Egghead.com, Inc. (a) |
13,565 |
38,152 |
|
|
Elcom International, Inc. (a) |
2,900 |
17,038 |
|
|
Electronics Boutique Holding Corp. (a) |
3,200 |
72,000 |
|
|
eMerge Interactive, Inc. Class A |
4,490 |
99,061 |
|
|
Emerging Vision, Inc. (a) |
5,000 |
7,813 |
|
|
Emusic.com, Inc. (a) |
12,400 |
20,925 |
|
|
Enesco Group, Inc. |
12,000 |
78,000 |
|
|
Envision Development Corp. |
1,700 |
22,525 |
|
|
eToys, Inc. (a) |
20,900 |
94,050 |
|
|
Fashionmall.com, Inc. (a) |
2,900 |
6,253 |
|
|
Fatbrain.com, Inc. (a) |
7,100 |
28,178 |
|
|
Finish Line, Inc. Class A (a) |
5,300 |
42,069 |
|
|
Finlay Enterprises, Inc. (a) |
800 |
10,100 |
|
|
Fogdog, Inc. |
5,800 |
5,438 |
|
|
Friedmans, Inc. Class A |
3,200 |
16,200 |
|
|
FTD.com, Inc. Class A |
400 |
975 |
|
|
Gadzooks, Inc. (a) |
5,400 |
81,000 |
|
|
Garden.com, Inc. |
3,600 |
6,075 |
|
|
Genesis Direct, Inc. (a) |
1,700 |
10 |
|
|
GenesisIntermedia.com, Inc. (a) |
3,100 |
49,213 |
|
|
Gerald Stevens, Inc. (a) |
2,700 |
2,447 |
|
|
|
|||
|
Shares |
Value (Note 1) |
||
|
Global Sports, Inc. (a) |
800 |
$ 7,000 |
|
|
Good Guys, Inc. (a) |
4,600 |
35,650 |
|
|
GSV, Inc. (a) |
700 |
1,006 |
|
|
Guitar Center, Inc. (a) |
2,500 |
37,500 |
|
|
Hancock Fabrics, Inc. |
700 |
3,500 |
|
|
Handleman Co. (a) |
1,000 |
12,375 |
|
|
Hello Direct, Inc. (a) |
5,400 |
58,388 |
|
|
Hollywood.com, Inc. (a) |
1,400 |
11,725 |
|
|
HomeBase, Inc. (a) |
26,100 |
60,356 |
|
|
IdeaMall, Inc. (a) |
3,000 |
11,813 |
|
|
InterTAN, Inc. (a) |
3,050 |
42,319 |
|
|
J. Jill Group, Inc. (a) |
2,700 |
24,975 |
|
|
K-Tel International, Inc. (a) |
8,900 |
15,575 |
|
|
Land's End, Inc. (a) |
3,400 |
83,088 |
|
|
Lillian Vernon Corp. |
500 |
5,563 |
|
|
Little Switzerland, Inc. (a) |
100 |
84 |
|
|
MediaBay, Inc. (a) |
500 |
1,141 |
|
|
Metal Management, Inc. (a) |
9,800 |
5,819 |
|
|
MotherNature.com, Inc. |
6,400 |
4,200 |
|
|
Multiple Zones International, Inc. (a) |
3,500 |
15,750 |
|
|
Musicland Stores Corp. (a) |
3,400 |
24,225 |
|
|
National Record Mart, Inc. (a) |
600 |
431 |
|
|
Natural Wonders, Inc. (a) |
100 |
128 |
|
|
Navarre Corp. (a) |
3,500 |
8,094 |
|
|
Network Commerce, Inc. |
6,200 |
34,100 |
|
|
Newpark Resources, Inc. (a) |
9,900 |
101,475 |
|
|
Officemax, Inc. (a) |
12,600 |
65,363 |
|
|
PC Connection, Inc. |
3,150 |
203,963 |
|
|
PEAPOD, Inc. (a) |
10,500 |
19,688 |
|
|
PETCO Animal Supplies, Inc. (a) |
6,600 |
138,600 |
|
|
Pets.com, Inc. |
10,820 |
10,482 |
|
|
PETsMART, Inc. (a) |
31,600 |
146,150 |
|
|
Pier 1 Imports, Inc. |
11,250 |
132,188 |
|
|
Piercing Pagoda, Inc. (a) |
600 |
12,788 |
|
|
PlanetRx.com, Inc. |
5,300 |
4,141 |
|
|
PolyMedica Corp. (a) |
100 |
3,550 |
|
|
Rex Stores Corp. (a) |
2,900 |
51,838 |
|
|
RoweCom, Inc. (a) |
4,800 |
28,800 |
|
|
School Specialty, Inc. (a) |
4,901 |
88,524 |
|
|
SCP Pool Corp. (a) |
4,125 |
120,914 |
|
|
Sharper Image Corp. (a) |
1,300 |
26,000 |
|
|
Shop At Home, Inc. (a) |
3,000 |
11,063 |
|
|
SkyMall, Inc. (a) |
2,600 |
9,100 |
|
|
Spiegel, Inc. Class A |
19,700 |
134,206 |
|
|
Sport Supply Group, Inc. (a) |
100 |
281 |
|
|
Stamps.com, Inc. (a) |
4,400 |
28,875 |
|
|
Streamline.com, Inc. (a) |
3,500 |
2,078 |
|
|
Styleclick, Inc. (a) |
3,300 |
36,300 |
|
|
Sunglass Hut International, Inc. (a) |
4,500 |
32,625 |
|
|
Systemax, Inc. (a) |
3,500 |
15,094 |
|
|
The Sports Authority, Inc. (a) |
16,300 |
34,638 |
|
|
Tractor Supply Co. (a) |
1,300 |
16,900 |
|
|
Transmedia Network, Inc. (a) |
100 |
350 |
|
|
Common Stocks - continued |
|||
|
Shares |
Value (Note 1) |
||
|
RETAIL & WHOLESALE - continued |
|||
|
Retail & Wholesale, Miscellaneous - continued |
|||
|
Transportation World |
7,050 |
$ 68,297 |
|
|
Tweeter Home Entertainment |
2,800 |
100,625 |
|
|
U.S. Office Products Co. (a) |
1,271 |
556 |
|
|
U.S.A. Floral Products, Inc. (a) |
1,000 |
313 |
|
|
Ultimate Electronics, Inc. (a) |
3,600 |
126,225 |
|
|
Valley Media, Inc. (a) |
4,300 |
11,825 |
|
|
Value America, Inc. (a) |
13,300 |
9,559 |
|
|
Ventro Corp. |
4,400 |
62,700 |
|
|
Vista Eyecare, Inc. (a) |
900 |
180 |
|
|
Webvan Group, Inc. |
2,500 |
10,000 |
|
|
Whitehall Jewellers, Inc. (a) |
1,650 |
14,850 |
|
|
Williams-Sonoma, Inc. (a) |
6,100 |
219,219 |
|
|
Wolohan Lumber Co. |
100 |
1,094 |
|
|
Zale Corp. (a) |
4,100 |
151,444 |
|
|
Zany Brainy, Inc. (a) |
1,600 |
3,600 |
|
|
|
4,397,872 |
||
|
TOTAL RETAIL & WHOLESALE |
13,018,654 |
||
|
SERVICES - 3.6% |
|||
|
Advertising - 0.6% |
|||
|
Ackerley Group, Inc. |
700 |
7,919 |
|
|
ADVO, Inc. (a) |
4,500 |
184,219 |
|
|
Digital Impact, Inc. |
1,200 |
11,438 |
|
|
DoubleClick, Inc. (a) |
15,032 |
611,615 |
|
|
Egreetings Network, Inc. |
7,300 |
8,669 |
|
|
Getty Images, Inc. (a) |
8,300 |
348,600 |
|
|
HA-LO Industries, Inc. (a) |
4,700 |
23,500 |
|
|
Interep National Radio Sales, Inc. |
3,100 |
19,763 |
|
|
Key3Media Group, Inc. (a) |
5,800 |
43,862 |
|
|
L90, Inc. |
5,900 |
45,356 |
|
|
Lamar Advertising Co. Class A (a) |
11,000 |
510,813 |
|
|
Leapnet, Inc. (a) |
5,788 |
18,088 |
|
|
LifeMinders, Inc. |
3,900 |
117,000 |
|
|
Mediaplex, Inc. |
6,300 |
79,931 |
|
|
MyPoints.com, Inc. |
3,340 |
45,508 |
|
|
NetCreations, Inc. |
900 |
19,013 |
|
|
Newgen Results Corp. (a) |
1,600 |
27,800 |
|
|
Princeton Video Image, Inc. (a) |
3,000 |
12,563 |
|
|
R.H. Donnelley Corp. (a) |
8,100 |
170,100 |
|
|
Switchboard, Inc. |
4,000 |
36,250 |
|
|
TMP Worldwide, Inc. (a) |
11,900 |
823,331 |
|
|
Women.com Networks, Inc. |
7,900 |
26,169 |
|
|
YouthStream Media Networks, Inc. (a) |
1,300 |
5,931 |
|
|
|
3,197,438 |
||
|
Educational Services - 0.3% |
|||
|
Apollo Group, Inc. Class A (a) |
9,100 |
371,394 |
|
|
Career Education Corp. (a) |
2,200 |
87,863 |
|
|
|
|||
|
Shares |
Value (Note 1) |
||
|
Childrens Comprehensive |
100 |
$ 263 |
|
|
Corinthian Colleges, Inc. (a) |
400 |
21,600 |
|
|
Devry, Inc. (a) |
7,400 |
276,575 |
|
|
Edison Schools, Inc. |
3,900 |
120,900 |
|
|
Education Management Corp. (a) |
6,700 |
169,175 |
|
|
Educational Video Conferencing, Inc. (a) |
1,100 |
15,813 |
|
|
GP Strategies Corp. (a) |
100 |
431 |
|
|
ITT Educational Services, Inc. (a) |
4,300 |
98,900 |
|
|
New Horizons Worldwide, Inc. (a) |
400 |
8,525 |
|
|
Prosoft Training.com (a) |
3,300 |
44,138 |
|
|
Provant, Inc. (a) |
800 |
5,450 |
|
|
SkillSoft Corp. |
2,950 |
52,363 |
|
|
Strayer Education, Inc. |
2,000 |
45,906 |
|
|
Sylvan Learning Systems (a) |
6,350 |
91,678 |
|
|
Whitman Education Group, Inc. (a) |
100 |
213 |
|
|
|
1,411,187 |
||
|
Leasing & Rental - 0.3% |
|||
|
Aaron Rents, Inc. Class A |
100 |
1,500 |
|
|
AMERCO (a) |
1,900 |
37,288 |
|
|
ANC Rental Corp. (a) |
16,850 |
117,950 |
|
|
Avis Group Holdings, Inc. Class A (a) |
7,500 |
230,625 |
|
|
Blockbuster, Inc. Class A |
9,700 |
90,938 |
|
|
Budget Group, Inc. Class A (a) |
3,200 |
14,400 |
|
|
Central Parking Corp. |
4,850 |
93,969 |
|
|
Dollar Thrifty Automotive Group, Inc. (a) |
2,000 |
45,250 |
|
|
DVI, Inc. (a) |
600 |
11,025 |
|
|
GATX Corp. |
7,900 |
321,431 |
|
|
Hertz Corp. Class A |
7,800 |
238,875 |
|
|
Interpool, Inc. |
1,100 |
13,269 |
|
|
Laser Vision Centers, Inc. (a) |
2,000 |
12,313 |
|
|
McGrath RentCorp. |
700 |
11,944 |
|
|
Mitcham Industries, Inc. (a) |
400 |
2,275 |
|
|
National Auto Credit, Inc. (a) |
400 |
312 |
|
|
National Equipment Services, Inc. (a) |
700 |
3,675 |
|
|
Neff Corp. (a) |
1,800 |
8,775 |
|
|
Rent-A-Center, Inc. (a) |
6,300 |
207,506 |
|
|
Rent-Way, Inc. (a) |
1,811 |
44,370 |
|
|
United Rentals, Inc. (a) |
8,285 |
171,914 |
|
|
United Road Services, Inc. (a) |
60 |
150 |
|
|
Universal Compression Holdings, Inc. |
3,900 |
128,213 |
|
|
Vari-Lite International, Inc. (a) |
100 |
125 |
|
|
|
1,808,092 |
||
|
Printing - 0.1% |
|||
|
Bowne & Co., Inc. |
2,100 |
21,788 |
|
|
Cadmus Communications Corp. |
100 |
800 |
|
|
Champion Industries, Inc. |
100 |
313 |
|
|
Consolidated Graphics, Inc. (a) |
4,000 |
59,000 |
|
|
CSS Industries, Inc. (a) |
500 |
10,250 |
|
|
Cyrk, Inc. (a) |
3,600 |
16,425 |
|
|
Ennis Business Forms, Inc. |
100 |
788 |
|
|
ImageX.com, Inc. |
4,700 |
21,003 |
|
|
iPrint.com, Inc. |
3,300 |
11,550 |
|
|
Common Stocks - continued |
|||
|
Shares |
Value (Note 1) |
||
|
SERVICES - continued |
|||
|
Printing - continued |
|||
|
John H. Harland Co. |
1,000 |
$ 14,625 |
|
|
Nashua Corp. |
300 |
2,438 |
|
|
New England Business Service, Inc. |
400 |
7,875 |
|
|
Paxar Corp. (a) |
1,500 |
16,500 |
|
|
Reynolds & Reynolds Co. Class A |
14,800 |
268,250 |
|
|
Standard Register Co. |
800 |
10,250 |
|
|
Valassis Communications, Inc. (a) |
7,550 |
218,006 |
|
|
Vestcom International, Inc. (a) |
500 |
1,500 |
|
|
Wallace Computer Services, Inc. |
7,700 |
89,513 |
|
|
|
770,874 |
||
|
Services - 2.3% |
|||
|
ABM Industries, Inc. |
4,900 |
132,300 |
|
|
ACNielsen Corp. (a) |
10,800 |
259,875 |
|
|
Administaff, Inc. (a) |
1,200 |
97,800 |
|
|
AG Services of America, Inc. (a) |
400 |
7,100 |
|
|
AHL Services, Inc. (a) |
3,600 |
29,925 |
|
|
ALPNET, Inc. (a) |
7,800 |
18,038 |
|
|
Alterra Healthcare Corp. (a) |
600 |
1,463 |
|
|
American Retirement Corp. (a) |
600 |
3,150 |
|
|
Analytical Surveys, Inc. (a) |
2,400 |
4,200 |
|
|
Angelica Corp. |
400 |
3,275 |
|
|
APAC Teleservices, Inc. (a) |
6,300 |
50,006 |
|
|
Applied Analytical Industries, Inc. (a) |
900 |
8,100 |
|
|
Arena Pharmaceuticals, Inc. |
2,800 |
129,500 |
|
|
Assisted Living Concepts, Inc. (a) |
700 |
438 |
|
|
Audio Visual Services Corp. (a) |
700 |
525 |
|
|
Berlitz International, Inc. (a) |
300 |
3,038 |
|
|
Billing Information Concepts Corp. (a) |
5,500 |
17,875 |
|
|
Boron LePore & Associates, Inc. (a) |
500 |
4,938 |
|
|
Braun Consulting, Inc. |
2,300 |
37,375 |
|
|
Bright Horizons Family Solutions, Inc. (a) |
1,800 |
44,100 |
|
|
Brookdale Living Communities, Inc. (a) |
300 |
4,538 |
|
|
Burns International Services Corp. (a) |
1,000 |
21,500 |
|
|
Cadiz, Inc. (a) |
500 |
4,844 |
|
|
Capital Senior Living Corp. (a) |
600 |
1,913 |
|
|
Caremark Rx, Inc. (a) |
19,100 |
187,419 |
|
|
Carriage Services, Inc. Class A (a) |
2,100 |
6,169 |
|
|
Cash Technologies, Inc. (a) |
2,900 |
20,119 |
|
|
Castle Dental Centers, Inc. (a) |
100 |
263 |
|
|
Catalina Marketing Corp. (a) |
8,900 |
379,919 |
|
|
CDI Corp. (a) |
1,500 |
27,750 |
|
|
Century Business Services, Inc. (a) |
12,100 |
21,175 |
|
|
Charles River Associates, Inc. (a) |
1,200 |
13,500 |
|
|
CheckFree Corp. (a) |
6,700 |
347,144 |
|
|
Chemed Corp. |
2,400 |
73,500 |
|
|
Cintas Corp. |
22,262 |
925,264 |
|
|
Coast Dental Services, Inc. (a) |
100 |
188 |
|
|
Collectors Universe, Inc. |
5,300 |
18,550 |
|
|
COMFORCE Corp. (a) |
100 |
188 |
|
|
Computer Horizons Corp. (a) |
6,700 |
64,069 |
|
|
Cornell Companies, Inc. (a) |
100 |
831 |
|
|
|
|||
|
Shares |
Value (Note 1) |
||
|
Corporate Executive Board Co. (a) |
3,100 |
$ 220,100 |
|
|
Correctional Services Corp. (a) |
165 |
639 |
|
|
CPI Corp. |
1,360 |
33,150 |
|
|
Creditrust Corp. (a) |
5,100 |
6,694 |
|
|
Day Runner, Inc. (a) |
80 |
50 |
|
|
Diamond Technology Partners, Inc. |
2,050 |
130,816 |
|
|
DigitalThink, Inc. |
3,590 |
122,284 |
|
|
Digitas, Inc. |
6,500 |
89,375 |
|
|
Edgewater Technology, Inc. (a) |
2,000 |
12,500 |
|
|
eGlobe, Inc. (a) |
6,600 |
13,819 |
|
|
eLoyalty Corp. |
5,300 |
72,213 |
|
|
Employee Solutions, Inc. (a) |
400 |
98 |
|
|
Enherent Corp. (a) |
8,200 |
9,225 |
|
|
Expedia, Inc. Class A |
3,700 |
59,431 |
|
|
First Priority Group, Inc. (a) |
3,900 |
6,703 |
|
|
Fonar Corp. (a) |
21,000 |
52,500 |
|
|
Food Technology Service, Inc. (a) |
900 |
2,925 |
|
|
Forrester Research, Inc. (a) |
3,800 |
232,275 |
|
|
FreeMarkets, Inc. |
4,800 |
390,600 |
|
|
Frontline Capital Group (a) |
4,000 |
70,250 |
|
|
FYI, Inc. (a) |
4,000 |
156,000 |
|
|
G&K Services, Inc. Class A |
6,300 |
182,700 |
|
|
Gartner Group, Inc. Class B (a) |
6,400 |
72,000 |
|
|
General Magnaplate Corp. |
85 |
0 |
|
|
Greg Manning Auctions, Inc. (a) |
1,900 |
17,456 |
|
|
Grow Biz International, Inc. (a) |
500 |
2,156 |
|
|
Hagler Bailly, Inc. (a) |
900 |
4,584 |
|
|
Hall Kinion & Associates, Inc. (a) |
1,600 |
52,800 |
|
|
Headway Corporate Resources (a) |
400 |
975 |
|
|
Heidrick & Struggles |
2,700 |
156,938 |
|
|
I-Many, Inc. |
3,900 |
54,600 |
|
|
iBeam Broadcasting Corp. |
15,600 |
165,750 |
|
|
Insurance Auto Auctions, Inc. (a) |
600 |
9,900 |
|
|
Jenny Craig, Inc. (a) |
100 |
188 |
|
|
Kelly Services, Inc. Class A |
3,600 |
83,250 |
|
|
kforce.com, Inc. (a) |
6,040 |
27,558 |
|
|
Korn/Ferry International (a) |
3,700 |
112,619 |
|
|
Kroll-O'Gara Co. (a) |
4,600 |
23,575 |
|
|
Labor Ready, Inc. (a) |
3,775 |
14,628 |
|
|
Landauer, Inc. |
200 |
3,675 |
|
|
Lason, Inc. (a) |
11,700 |
27,788 |
|
|
Learning Tree International, Inc. (a) |
4,000 |
273,750 |
|
|
Mac-Gray Corp. (a) |
100 |
319 |
|
|
Mace Security International, Inc. (a) |
800 |
1,000 |
|
|
Macrovision Corp. (a) |
5,300 |
565,113 |
|
|
Magellan Health Services, Inc. (a) |
1,100 |
3,575 |
|
|
Manpower, Inc. |
12,100 |
437,869 |
|
|
MarchFirst, Inc. (a) |
16,838 |
326,236 |
|
|
Marketing Services Group, Inc. (a) |
1,400 |
7,175 |
|
|
Maximus, Inc. (a) |
700 |
15,488 |
|
|
Media Arts Group, Inc. (a) |
600 |
2,400 |
|
|
Media Metrix, Inc. (a) |
3,400 |
84,150 |
|
|
Common Stocks - continued |
|||
|
Shares |
Value (Note 1) |
||
|
SERVICES - continued |
|||
|
Services - continued |
|||
|
Medialink Worldwide, Inc. (a) |
200 |
$ 1,350 |
|
|
MemberWorks, Inc. (a) |
2,400 |
67,500 |
|
|
Modem Media . Poppe Tyson, Inc. (a) |
4,600 |
48,588 |
|
|
Modis Professional Services, Inc. (a) |
10,000 |
68,750 |
|
|
NAHC, Inc. (a) |
1,000 |
28 |
|
|
National Processing, Inc. (a) |
4,200 |
49,613 |
|
|
Navigant Consulting, Inc. (a) |
1,850 |
7,400 |
|
|
NCO Group, Inc. (a) |
4,648 |
80,759 |
|
|
NewsEdge Corp. (a) |
5,200 |
11,050 |
|
|
Nextera Enterprises, Inc. (a) |
3,600 |
13,500 |
|
|
NOVA Corp. (a) |
9,243 |
132,868 |
|
|
NovaMed Eyecare, Inc. |
5,200 |
21,288 |
|
|
Official Payments Corp. |
1,000 |
10,313 |
|
|
On Assignment, Inc. (a) |
5,600 |
167,300 |
|
|
Organic, Inc. |
7,820 |
56,206 |
|
|
Orthalliance, Inc. Class A (a) |
100 |
719 |
|
|
PeoplePC, Inc. |
15,200 |
129,580 |
|
|
Per-Se Technologies, Inc. (a) |
5,066 |
60,475 |
|
|
Personnel Group of America, Inc. (a) |
1,000 |
3,563 |
|
|
Photoworks, Inc. (a) |
8,700 |
26,644 |
|
|
Pittston Co. - Brinks Group |
5,890 |
91,663 |
|
|
Plastic Surgery Co. |
400 |
1,275 |
|
|
Pre-Paid Legal Services, Inc. (a) |
1,500 |
49,219 |
|
|
Prime Medical Services, Inc. (a) |
500 |
4,539 |
|
|
Probusiness Services, Inc. (a) |
3,550 |
78,100 |
|
|
Professional Detailing, Inc. (a) |
3,300 |
158,813 |
|
|
Profit Recovery Group |
9,300 |
83,991 |
|
|
Promedco Management Co. (a) |
6,200 |
7,169 |
|
|
Protection One, Inc. (a) |
2,800 |
4,900 |
|
|
PTEK Holdings, Inc. (a) |
13,133 |
46,786 |
|
|
Quintel Communications, Inc. (a) |
3,100 |
13,563 |
|
|
RCM Technologies, Inc. (a) |
5,700 |
27,075 |
|
|
Regis Corp. |
9,600 |
151,800 |
|
|
Register.com, Inc. |
1,900 |
26,600 |
|
|
RemedyTemp, Inc. Class A (a) |
6,500 |
78,406 |
|
|
Renaissance Worldwide, Inc. (a) |
4,200 |
6,563 |
|
|
ReSourcePhoenix.com, Inc. |
1,400 |
2,625 |
|
|
RMH Teleservices, Inc. (a) |
3,700 |
88,800 |
|
|
Robert Half International, Inc. (a) |
20,500 |
652,156 |
|
|
Rollins, Inc. |
2,500 |
37,500 |
|
|
RTW, Inc. (a) |
1,400 |
4,813 |
|
|
Rural/Metro Corp. (a) |
2,000 |
4,000 |
|
|
SCB Computer Technology, Inc. (a) |
800 |
363 |
|
|
Service Corp. International (SCI) |
30,500 |
70,531 |
|
|
ServiceMaster Co. |
45,150 |
437,391 |
|
|
SITEL Corp. (a) |
2,500 |
14,375 |
|
|
Snyder Communications, Inc. (SNC) |
6,000 |
164,250 |
|
|
SOS Staffing Services, Inc. (a) |
500 |
1,375 |
|
|
Sotheby's Holdings, Inc. Class A |
10,300 |
213,081 |
|
|
Source Information Management Co. (a) |
5,400 |
54,675 |
|
|
|
|||
|
Shares |
Value (Note 1) |
||
|
Spherion Corp. (a) |
10,420 |
$ 128,296 |
|
|
Staff Leasing, Inc. (a) |
400 |
1,600 |
|
|
StarTek, Inc. (a) |
1,500 |
58,781 |
|
|
Student Advantage, Inc. (a) |
100 |
938 |
|
|
Superior Consultant Holdings Corp. (a) |
2,800 |
8,225 |
|
|
Telespectrum Worldwide, Inc. (a) |
5,300 |
9,275 |
|
|
Teletech Holdings, Inc. (a) |
10,400 |
339,300 |
|
|
The Judge Group, Inc. (a) |
100 |
133 |
|
|
The Management Network Group, Inc. |
2,000 |
40,125 |
|
|
Total System Services, Inc. |
19,850 |
327,525 |
|
|
True North Communications |
8,100 |
375,638 |
|
|
Unifirst Corp. |
400 |
4,050 |
|
|
Universal Access, Inc. |
2,700 |
42,694 |
|
|
Veterinary Centers of America, Inc. (a) |
8,600 |
124,700 |
|
|
Viad Corp. |
14,800 |
433,825 |
|
|
Vicinity Corp. |
4,250 |
47,281 |
|
|
Vision Twenty-One, Inc. (a) |
2,000 |
313 |
|
|
Volt Information Sciences, Inc. (a) |
1,300 |
43,956 |
|
|
Wackenhut Corp. (a) |
1,800 |
25,538 |
|
|
Wackenhut Corrections Corp. (a) |
1,300 |
11,781 |
|
|
Westaff, Inc. |
550 |
2,063 |
|
|
York Research Corp. (a) |
200 |
219 |
|
|
|
12,943,873 |
||
|
TOTAL SERVICES |
20,131,464 |
||
|
TECHNOLOGY - 36.5% |
|||
|
Communications Equipment - 3.7% |
|||
|
3Com Corp. |
46,100 |
766,413 |
|
|
Accelerated Networks, Inc. |
6,300 |
149,231 |
|
|
Ace Communication Corp. (a) |
3,100 |
29,450 |
|
|
Active Voice Corp. (a) |
5,400 |
72,225 |
|
|
Advanced Fibre Communications, Inc. (a) |
9,200 |
486,306 |
|
|
AltiGen Communications, Inc. |
2,100 |
11,025 |
|
|
Applied Innovation, Inc. (a) |
4,200 |
96,600 |
|
|
Applied Signal Technology, Inc. |
4,500 |
44,438 |
|
|
Aspect Communications Corp. (a) |
4,700 |
106,044 |
|
|
Avanex Corp. |
900 |
136,322 |
|
|
Bogen Communications |
7,500 |
55,547 |
|
|
Brooktrout, Inc. (a) |
2,900 |
98,600 |
|
|
C-Phone Corp. (a) |
600 |
544 |
|
|
Cable Design Technologies Corp. (a) |
5,025 |
135,675 |
|
|
Carrier Access Corp. (a) |
2,200 |
105,325 |
|
|
CheckPoint Systems, Inc. (a) |
1,100 |
8,800 |
|
|
Ciena Corp. (a) |
18,400 |
4,079,050 |
|
|
Com21, Inc. (a) |
1,700 |
28,263 |
|
|
Comdial Corp. (a) |
5,000 |
11,406 |
|
|
Corvis Corp. |
22,600 |
2,346,163 |
|
|
Data Race, Inc. (a) |
10,800 |
62,775 |
|
|
Davox Corp. (a) |
6,000 |
75,750 |
|
|
Digital Island, Inc. |
8,000 |
237,500 |
|
|
Ditech Communications Corp. (a) |
3,000 |
177,000 |
|
|
Efficient Networks, Inc. (a) |
6,800 |
365,394 |
|
|
Common Stocks - continued |
|||
|
Shares |
Value (Note 1) |
||
|
TECHNOLOGY - continued |
|||
|
Communications Equipment - continued |
|||
|
Elcotel, Inc. (a) |
9,300 |
$ 13,369 |
|
|
General Datacomm Industries, Inc. (a) |
3,800 |
22,800 |
|
|
IFR Systems, Inc. (a) |
150 |
713 |
|
|
Integrated Telecom Express, Inc. |
5,500 |
172,906 |
|
|
Intelect Communications, Inc. (a) |
5,500 |
10,484 |
|
|
Inter-Tel, Inc. |
6,900 |
105,656 |
|
|
InterDigital Communication Corp. (a) |
5,400 |
96,525 |
|
|
Interlogix, Inc. (a) |
503 |
7,734 |
|
|
InterVoice-Brite, Inc. (a) |
8,896 |
110,644 |
|
|
Jabil Circuit, Inc. (a) |
23,900 |
1,525,119 |
|
|
Larscom, Inc. Class A (a) |
3,000 |
26,625 |
|
|
Lexent, Inc. |
5,300 |
177,881 |
|
|
LoJack Corp. (a) |
1,700 |
12,750 |
|
|
McDATA Corp. Class B |
3,400 |
365,713 |
|
|
MCK Communications, Inc. |
4,300 |
123,625 |
|
|
Metricom, Inc. (a) |
3,800 |
154,613 |
|
|
Microlog Corp. (a) |
100 |
138 |
|
|
Microtest, Inc. (a) |
7,000 |
57,750 |
|
|
Microwave Power Devices, Inc. (a) |
2,900 |
21,750 |
|
|
Natural MicroSystems Corp. (a) |
3,400 |
253,513 |
|
|
Network Equipment Technologies, Inc. (a) |
2,000 |
24,125 |
|
|
Next Level Communications, Inc. |
10,900 |
480,963 |
|
|
Norstan, Inc. (a) |
6,400 |
20,400 |
|
|
Numerex Corp. Class A (a) |
5,400 |
70,200 |
|
|
OSI Systems, Inc. (a) |
4,700 |
63,156 |
|
|
Osicom Technologies, Inc. (a) |
1,066 |
62,894 |
|
|
P-Com, Inc. (a) |
6,000 |
37,500 |
|
|
Panja, Inc. (a) |
2,500 |
29,375 |
|
|
Peco II, Inc. |
2,700 |
105,300 |
|
|
Perceptron, Inc. (a) |
200 |
650 |
|
|
PictureTel Corp. (a) |
11,100 |
107,878 |
|
|
Plantronics, Inc. (a) |
7,200 |
359,550 |
|
|
Pliant Systems, Inc. (a) |
2,900 |
12,869 |
|
|
Quentra Networks, Inc. (a) |
4,305 |
19,103 |
|
|
Science Dynamics Corp. (a) |
3,000 |
25,875 |
|
|
SSE Telecom, Inc. (a) |
3,100 |
12,400 |
|
|
Sycamore Networks, Inc. |
31,900 |
4,386,250 |
|
|
Symmetricom, Inc. (a) |
6,350 |
98,425 |
|
|
Syntellect, Inc. (a) |
7,300 |
67,069 |
|
|
Tekelec (a) |
6,200 |
244,900 |
|
|
Terayon Communication Systems, Inc. (a) |
7,500 |
416,250 |
|
|
Tollgrade Communications, Inc. (a) |
1,600 |
177,900 |
|
|
Turnstone Systems, Inc. |
1,820 |
107,153 |
|
|
Tut Systems, Inc. (a) |
2,000 |
201,250 |
|
|
Ultrak, Inc. (a) |
8,400 |
63,000 |
|
|
UTStarcom, Inc. |
1,200 |
28,650 |
|
|
Veramark Technologies, Inc. (a) |
1,700 |
5,525 |
|
|
Video Network Communication, Inc. (a) |
4,542 |
10,220 |
|
|
VTEL Corp. (a) |
10,200 |
31,875 |
|
|
Westell Technologies, Inc. Class A (a) |
3,680 |
58,880 |
|
|
Western Multiplex Corp. Class A |
6,900 |
137,569 |
|
|
|
|||
|
Shares |
Value (Note 1) |
||
|
XETA Technologies, Inc. (a) |
3,400 |
$ 57,163 |
|
|
Xircom, Inc. (a) |
2,500 |
77,188 |
|
|
ZixIt Corp. (a) |
1,200 |
58,500 |
|
|
Zoom Telephonics, Inc. (a) |
5,600 |
47,250 |
|
|
|
20,653,409 |
||
|
Computer Services & Software - 18.5% |
|||
|
24/7 Media, Inc. (a) |
3,420 |
49,376 |
|
|
4Front Technologies, Inc. (a) |
4,300 |
67,927 |
|
|
About.com, Inc. (a) |
2,300 |
100,338 |
|
|
Acclaim Entertainment, Inc. (a) |
12,600 |
23,625 |
|
|
Accrue Software, Inc. |
1,900 |
40,494 |
|
|
ActionPoint, Inc. (a) |
2,600 |
20,963 |
|
|
Activision, Inc. (a) |
7,200 |
100,800 |
|
|
Actuate Software Corp. (a) |
6,000 |
155,625 |
|
|
ACTV, Inc. (a) |
3,700 |
65,906 |
|
|
Acxiom Corp. (a) |
12,960 |
330,480 |
|
|
Adam.com, Inc. (a) |
2,800 |
12,075 |
|
|
Adept Technology, Inc. (a) |
2,300 |
114,856 |
|
|
Advantage Learning Systems, Inc. (a) |
5,100 |
149,813 |
|
|
Advent Software, Inc. (a) |
4,600 |
283,475 |
|
|
Aether Systems, Inc. |
4,600 |
637,100 |
|
|
Affiliated Computer Services, Inc. |
8,200 |
381,813 |
|
|
Affinity Technology Group, Inc. (a) |
12,100 |
9,453 |
|
|
Affymetrix, Inc. (a) |
6,400 |
505,600 |
|
|
AGENCY.COM Ltd. |
7,700 |
184,319 |
|
|
Agile Software Corp. |
5,200 |
361,075 |
|
|
AHT Corp. (a) |
1,200 |
600 |
|
|
Akamai Technologies, Inc. |
1,174 |
88,710 |
|
|
Allaire Corp. (a) |
2,600 |
88,238 |
|
|
AlphaNet Solutions, Inc. (a) |
300 |
1,238 |
|
|
Alternative Resources Corp. (a) |
600 |
675 |
|
|
Alysis Technologies, Inc. (a) |
2,700 |
6,581 |
|
|
Amazon.com, Inc. (a) |
45,500 |
1,888,250 |
|
|
American Management Systems, Inc. (a) |
8,400 |
156,975 |
|
|
American Software, Inc. Class A (a) |
11,800 |
50,150 |
|
|
Anacomp, Inc. (a) |
400 |
337 |
|
|
Analysts International Corp. |
8,150 |
67,747 |
|
|
Ansoft Corp. (a) |
400 |
5,600 |
|
|
AnswerThink Consulting Group, Inc. (a) |
5,010 |
85,796 |
|
|
Ansys, Inc. (a) |
6,700 |
70,769 |
|
|
Applied Microsystems Corp. (a) |
2,700 |
29,700 |
|
|
AppliedTheory Corp. (a) |
6,000 |
48,375 |
|
|
Applix, Inc. (a) |
3,500 |
16,188 |
|
|
AppNet Systems, Inc. (a) |
3,500 |
173,031 |
|
|
Apropos Technology, Inc. |
3,760 |
47,940 |
|
|
AremisSoft Corp. (a) |
3,800 |
103,550 |
|
|
ARI Network Services, Inc. (a) |
2,800 |
5,775 |
|
|
Ariba, Inc. |
30,500 |
4,799,938 |
|
|
ARIS Corp. (a) |
2,500 |
8,750 |
|
|
Art Technology Group, Inc. |
8,400 |
856,275 |
|
|
Artificial Life, Inc. (a) |
1,000 |
14,875 |
|
|
Artisoft, Inc. (a) |
6,400 |
68,800 |
|
|
Common Stocks - continued |
|||
|
Shares |
Value (Note 1) |
||
|
TECHNOLOGY - continued |
|||
|
Computer Services & Software - continued |
|||
|
ASD Systems, Inc. |
3,800 |
$ 5,700 |
|
|
Ask Jeeves, Inc. |
3,400 |
103,700 |
|
|
Aspen Technology, Inc. (a) |
4,300 |
197,531 |
|
|
At Home Corp. Series A (a) |
45,190 |
658,079 |
|
|
At Plan, Inc. |
2,300 |
13,944 |
|
|
Audiohighway.com (a) |
4,000 |
4,500 |
|
|
Autobytel.com, Inc. (a) |
8,600 |
43,538 |
|
|
Autoweb.Com, Inc. (a) |
3,400 |
5,844 |
|
|
Avant! Corp. (a) |
8,400 |
122,325 |
|
|
Avert, Inc. |
2,700 |
59,569 |
|
|
AVT Corp. (a) |
11,400 |
67,688 |
|
|
Aware, Inc. (a) |
1,900 |
85,144 |
|
|
Axent Technolgies, Inc. (a) |
4,680 |
111,150 |
|
|
Aztec Technology Partners, Inc. (a) |
6,900 |
10,781 |
|
|
b2bstores.com, Inc. |
7,600 |
15,200 |
|
|
barnesandnoble.com, Inc. Class A (a) |
8,500 |
34,000 |
|
|
Barra, Inc. (a) |
1,700 |
97,963 |
|
|
Base Ten Systems, Inc. Class A (a) |
160 |
125 |
|
|
Be Free, Inc. |
11,600 |
70,325 |
|
|
Be, Inc. |
9,400 |
43,769 |
|
|
BEA Systems, Inc. (a) |
31,800 |
2,164,388 |
|
|
Bell & Howell Co. (a) |
3,200 |
71,200 |
|
|
Bell Industries, Inc. |
7,800 |
19,988 |
|
|
BindView Development Corp. (a) |
4,200 |
41,213 |
|
|
Bitstream, Inc. (a) |
8,100 |
33,919 |
|
|
Bitwise Designs, Inc. (a) |
2,300 |
10,853 |
|
|
Black Box Corp. (a) |
2,600 |
154,700 |
|
|
Blaze Software, Inc. |
5,500 |
103,813 |
|
|
Blue Martini Software, Inc. |
9,100 |
632,450 |
|
|
Bluestone Software, Inc. |
1,400 |
32,725 |
|
|
Bottomline Technologies, Inc. (a) |
1,400 |
44,363 |
|
|
Breakaway Solutions, Inc. |
3,200 |
47,600 |
|
|
BrightStar Information Technology |
4,500 |
11,250 |
|
|
Brio Technology, Inc. (a) |
1,800 |
16,650 |
|
|
Broadbase Software, Inc. |
4,800 |
100,500 |
|
|
BroadVision, Inc. (a) |
31,951 |
1,102,310 |
|
|
BSQUARE Corp. |
1,900 |
32,300 |
|
|
BTG, Inc. (a) |
100 |
831 |
|
|
C-bridge Internet Solutions, Inc. |
2,600 |
43,875 |
|
|
CACI International, Inc. Class A (a) |
3,700 |
83,250 |
|
|
Cadence Design Systems, Inc. (a) |
29,444 |
625,685 |
|
|
Caldera Systems, Inc. |
7,100 |
55,025 |
|
|
Calico Commerce, Inc. |
2,388 |
24,104 |
|
|
CAM Commerce Solutions, Inc. (a) |
2,100 |
13,059 |
|
|
Cambio, Inc. (a) |
11,500 |
2,990 |
|
|
Cambridge Technology Partners, Inc. (a) |
3,300 |
20,316 |
|
|
CareInsite, Inc. (a) |
8,500 |
190,188 |
|
|
Carreker-Antinori, Inc. (a) |
5,200 |
73,775 |
|
|
Casino Data Systems (a) |
4,100 |
30,750 |
|
|
Cavion Technologies, Inc. |
2,000 |
9,125 |
|
|
|
|||
|
Shares |
Value (Note 1) |
||
|
CCC Information Services Group, Inc. (a) |
4,100 |
$ 40,167 |
|
|
CE Software, Inc. (a) |
100 |
0 |
|
|
CenterSpan Communications Corp. (a) |
1,200 |
19,125 |
|
|
Centra Software, Inc. |
2,310 |
21,223 |
|
|
Centura Software Corp. (a) |
3,500 |
11,922 |
|
|
Cerner Corp. (a) |
5,600 |
213,150 |
|
|
Chequemate International, Inc. (a) |
2,400 |
3,900 |
|
|
Chordiant Software, Inc. |
3,450 |
41,616 |
|
|
Ciber, Inc. (a) |
4,200 |
43,313 |
|
|
Clarent Corp. |
4,689 |
223,900 |
|
|
Clarus Corp. (a) |
1,900 |
114,950 |
|
|
Click Communication, Inc. |
4,700 |
141,000 |
|
|
Click2learn.com, Inc. (a) |
3,900 |
59,231 |
|
|
ClickAction, Inc. (a) |
2,800 |
36,400 |
|
|
CMGI, Inc. (a) |
37,964 |
1,698,889 |
|
|
CNET Networks, Inc. (a) |
9,700 |
324,950 |
|
|
Cobalt Networks, Inc. |
2,700 |
133,988 |
|
|
Cognizant Technology Solutions Corp. (a) |
2,300 |
98,325 |
|
|
Command Systems, Inc. (a) |
500 |
1,156 |
|
|
Commerce One, Inc. |
19,800 |
1,238,119 |
|
|
Complete Business Solutions, Inc. (a) |
2,432 |
32,832 |
|
|
CompuCom Systems, Inc. (a) |
12,900 |
45,150 |
|
|
Computer Concepts Corp. |
800 |
700 |
|
|
Computer Learning Centers, Inc. (a) |
628 |
903 |
|
|
Computer Task Group, Inc. |
700 |
2,450 |
|
|
Computron Software, Inc. (a) |
6,000 |
9,000 |
|
|
Comshare, Inc. (a) |
100 |
475 |
|
|
Concero, Inc. (a) |
1,800 |
14,850 |
|
|
Concord Communications, Inc. (a) |
1,800 |
43,200 |
|
|
Concur Technologies, Inc. (a) |
1,700 |
5,206 |
|
|
Continuus Software Corp. |
4,300 |
9,675 |
|
|
Convergent Communications, Inc. |
6,700 |
26,591 |
|
|
Corillian Corp. |
6,000 |
46,875 |
|
|
Corio, Inc. |
6,200 |
80,213 |
|
|
Cornerstone Internet Solutions Co. (a) |
8,300 |
7,781 |
|
|
Corsair Communictions, Inc. (a) |
4,600 |
50,600 |
|
|
CoStar Group, Inc. (a) |
2,469 |
68,206 |
|
|
Cotelligent, Inc. (a) |
600 |
2,400 |
|
|
Covad Communications Group, Inc. (a) |
17,450 |
284,653 |
|
|
Critical Path, Inc. (a) |
7,576 |
585,246 |
|
|
Crosswalk.com, Inc. (a) |
300 |
619 |
|
|
Crossworlds Software, Inc. |
3,200 |
70,400 |
|
|
CSG Systems International, Inc. (a) |
8,100 |
366,019 |
|
|
CSP, Inc. (a) |
3,800 |
19,950 |
|
|
CUseeMe Networks, Inc. (a) |
2,000 |
14,625 |
|
|
CyBear, Inc. (a) |
3,700 |
10,175 |
|
|
Cybercash, Inc. (a) |
7,200 |
39,150 |
|
|
CyberOptics Corp. (a) |
2,500 |
72,500 |
|
|
CyberSource Corp. (a) |
5,700 |
70,538 |
|
|
Cylink Corp. (a) |
7,000 |
99,750 |
|
|
Cysive, Inc. |
1,600 |
13,300 |
|
|
DAOU Systems, Inc. (a) |
200 |
400 |
|
|
Data Broadcasting Corp. (a) |
1,100 |
4,400 |
|
|
Data Dimensions, Inc. (a) |
6,700 |
9,213 |
|
|
Common Stocks - continued |
|||
|
Shares |
Value (Note 1) |
||
|
TECHNOLOGY - continued |
|||
|
Computer Services & Software - continued |
|||
|
Data Return Corp. |
4,200 |
$ 83,672 |
|
|
Datalink Corp. |
2,200 |
34,238 |
|
|
Datastream Systems, Inc. (a) |
2,300 |
20,988 |
|
|
Datatec Systems, Inc. (a) |
11,700 |
56,306 |
|
|
Dataware Technologies, Inc. (a) |
2,700 |
10,800 |
|
|
Deltek Systems, Inc. (a) |
5,200 |
38,675 |
|
|
Dendrite International, Inc. (a) |
6,900 |
183,281 |
|
|
Digex, Inc. Class A |
2,700 |
228,656 |
|
|
Digi International, Inc. (a) |
3,300 |
25,575 |
|
|
Digital Courier Technologies, Inc. (a) |
2,800 |
11,988 |
|
|
Digital Insight Corp. |
2,000 |
53,000 |
|
|
Divine Interventures, Inc. |
14,300 |
129,594 |
|
|
DocuCorp International, Inc. (a) |
180 |
686 |
|
|
Documentum, Inc. (a) |
1,600 |
114,500 |
|
|
drkoop.com, Inc. (a) |
3,900 |
5,850 |
|
|
DSET Corp. (a) |
2,000 |
54,125 |
|
|
DSL.net, Inc. |
7,300 |
44,713 |
|
|
DST Systems, Inc. (a) |
8,986 |
844,684 |
|
|
E.piphany, Inc. |
3,900 |
405,600 |
|
|
EarthLink, Inc. (a) |
13,068 |
147,015 |
|
|
EarthWeb, Inc. (a) |
3,100 |
42,238 |
|
|
eBay, Inc. (a) |
34,100 |
2,114,200 |
|
|
ebenX, Inc. |
3,200 |
67,200 |
|
|
ebix.com, Inc. (a) |
3,600 |
16,425 |
|
|
EBT International, Inc. (a) |
7,900 |
47,894 |
|
|
Eclipsys Corp. (a) |
2,510 |
36,081 |
|
|
eCollege.com |
4,200 |
27,825 |
|
|
EDGAR Online, Inc. (a) |
4,100 |
17,938 |
|
|
eFax.com, Inc. (a) |
5,700 |
2,316 |
|
|
eFunds Corp. |
5,900 |
52,731 |
|
|
eGain Communications Corp. |
5,663 |
73,973 |
|
|
Electric Lightwave, Inc. Class A (a) |
3,600 |
46,800 |
|
|
Electronic Arts, Inc. (a) |
7,600 |
820,325 |
|
|
Electronic Retailing Systems International (a) |
100 |
81 |
|
|
Electronics for Imaging, Inc. (a) |
5,500 |
143,000 |
|
|
Elite Information Group, Inc. (a) |
100 |
575 |
|
|
Eloquent, Inc. |
3,080 |
15,111 |
|
|
eLOT, Inc. (a) |
5,600 |
10,150 |
|
|
Engage, Inc. |
19,800 |
280,913 |
|
|
Engineering Animation, Inc. (a) |
3,900 |
42,900 |
|
|
Enlighten Software Solutions, Inc. (a) |
3,000 |
5,813 |
|
|
Entrade, Inc. (a) |
1,300 |
6,500 |
|
|
Entrust Technologies, Inc. (a) |
6,000 |
178,500 |
|
|
Epicor Software Corp. (a) |
6,635 |
26,747 |
|
|
ePresence, Inc. (a) |
6,000 |
45,000 |
|
|
Eprise Corp. |
4,700 |
73,144 |
|
|
eShare Technologies, Inc. (a) |
2,700 |
10,800 |
|
|
eSoft, Inc. (a) |
4,200 |
31,500 |
|
|
ESPS, Inc. (a) |
6,200 |
18,213 |
|
|
Etinuum, Inc. |
6,500 |
31,688 |
|
|
|
|||
|
Shares |
Value (Note 1) |
||
|
EuroWeb International Corp. (a) |
3,700 |
$ 13,413 |
|
|
Evoke Communications, Inc. |
8,200 |
90,200 |
|
|
Evolve Software, Inc. |
4,900 |
104,860 |
|
|
Evolving Systems, Inc. (a) |
2,100 |
12,600 |
|
|
Excalibur Technologies Corp. (a) |
2,900 |
137,750 |
|
|
eXcelon Corp. (a) |
9,100 |
73,369 |
|
|
Exchange Applications, Inc. (a) |
3,100 |
76,144 |
|
|
EXE Technologies, Inc. |
5,500 |
98,656 |
|
|
Exodus Communications, Inc. (a) |
53,500 |
3,661,406 |
|
|
Extensity, Inc. |
1,900 |
42,750 |
|
|
F5 Networks, Inc. (a) |
2,700 |
156,600 |
|
|
FactSet Research Systems, Inc. |
1,800 |
61,538 |
|
|
Fair, Isaac & Co., Inc. |
300 |
13,781 |
|
|
FairMarket, Inc. |
5,600 |
24,150 |
|
|
Fastnet Corp. |
5,500 |
12,031 |
|
|
Firearms Training Systems, Inc. |
200 |
60 |
|
|
FirePond, Inc. |
3,650 |
76,194 |
|
|
First Consulting Group, Inc. (a) |
2,700 |
18,900 |
|
|
Firstwave Technologies, Inc. (a) |
3,600 |
15,975 |
|
|
Fiserv, Inc. (a) |
17,050 |
923,897 |
|
|
Fonix corp (a) |
23,800 |
25,288 |
|
|
Fortel, Inc. (a) |
9,900 |
16,706 |
|
|
Foundry Networks, Inc. |
14,700 |
1,368,019 |
|
|
Franklin Electronic Publishers (a) |
2,500 |
26,875 |
|
|
Frontline Communications Corp. (a) |
600 |
750 |
|
|
Galileo International, Inc. |
8,500 |
158,313 |
|
|
General Magic, Inc. (a) |
6,600 |
46,406 |
|
|
Gensym Corp. (a) |
4,300 |
15,588 |
|
|
Genuity, Inc. |
25,800 |
221,558 |
|
|
Geoworks Corp. (a) |
1,600 |
18,300 |
|
|
Gerber Scientific, Inc. |
900 |
8,775 |
|
|
Go2Net, Inc. (a) |
3,600 |
248,400 |
|
|
GoTo.com, Inc. (a) |
6,500 |
121,063 |
|
|
GraphOn Corp. (a) |
7,300 |
45,625 |
|
|
Great Plains Software, Inc. (a) |
4,300 |
116,906 |
|
|
GRIC Communications, Inc. |
4,500 |
47,391 |
|
|
H.T.E., Inc. (a) |
7,500 |
10,664 |
|
|
Headhunter.net, Inc. |
3,200 |
19,200 |
|
|
Health Management Systems, Inc. (a) |
6,600 |
18,356 |
|
|
Healthcare.com Corp. (a) |
6,300 |
20,081 |
|
|
HealthCentral.com |
5,700 |
25,294 |
|
|
Healtheon/WebMD Corp. (a) |
21,949 |
386,851 |
|
|
HealthGate Data Corp. |
5,200 |
6,500 |
|
|
HearMe, Inc. (a) |
4,800 |
41,700 |
|
|
High Speed Access Corp. (a) |
11,300 |
64,975 |
|
|
HNC Software, Inc. |
2,300 |
125,134 |
|
|
Homeseekers.com, Inc. (a) |
4,100 |
11,019 |
|
|
Homestore.com, Inc. |
9,400 |
509,363 |
|
|
Hoover's, Inc. (a) |
4,700 |
32,900 |
|
|
HotJobs.com Ltd. |
5,300 |
101,031 |
|
|
Hyperion Solutions Corp. (a) |
2,790 |
88,234 |
|
|
i2 Technologies, Inc. (a) |
25,195 |
4,262,679 |
|
|
IDT Corp. (a) |
4,000 |
159,000 |
|
|
Common Stocks - continued |
|||
|
Shares |
Value (Note 1) |
||
|
TECHNOLOGY - continued |
|||
|
Computer Services & Software - continued |
|||
|
IDX Systems Corp. (a) |
3,600 |
$ 61,200 |
|
|
Ikos Systems, Inc. (a) |
5,100 |
64,388 |
|
|
ImageMax, Inc. (a) |
700 |
1,225 |
|
|
ImaginOn, Inc. (a) |
5,900 |
4,794 |
|
|
iManage, Inc. |
4,900 |
53,900 |
|
|
Improvenet, Inc. |
9,700 |
18,794 |
|
|
IMR Global Corp. (a) |
2,050 |
24,344 |
|
|
Indus International, Inc. (a) |
4,400 |
33,962 |
|
|
Industri-Matematik International Corp. (a) |
5,900 |
20,650 |
|
|
Inet Technologies, Inc. (a) |
6,500 |
262,438 |
|
|
Infinium Software, Inc. (a) |
3,400 |
9,775 |
|
|
Infocrossing, Inc. (a) |
1,200 |
25,800 |
|
|
InfoCure Corp. (a) |
10,500 |
41,836 |
|
|
Infogrames, Inc. (a) |
2,200 |
16,363 |
|
|
Infonautics, Inc. (a) |
6,900 |
22,425 |
|
|
Infonet Services Corp. Class B |
36,600 |
478,088 |
|
|
Informatica Corp. (a) |
4,500 |
450,000 |
|
|
Information Architects Corp. (a) |
8,800 |
56,100 |
|
|
Information Management |
3,900 |
61 |
|
|
Information Resources, Inc. (a) |
1,000 |
6,813 |
|
|
Informix Corp. (a) |
28,970 |
177,441 |
|
|
Inforte Corp. |
1,160 |
41,688 |
|
|
InfoSpace.com, Inc. (a) |
29,200 |
1,138,800 |
|
|
InfoUSA, Inc. (a) |
6,300 |
38,981 |
|
|
Inktomi Corp. (a) |
14,300 |
1,864,363 |
|
|
Innodata Corp. (a) |
1,800 |
18,338 |
|
|
Innoveda, Inc. (a) |
6,700 |
26,800 |
|
|
Inprise Corp. (a) |
3,281 |
19,173 |
|
|
insci-statements.com Corp. (a) |
7,200 |
20,250 |
|
|
InsWeb Corp. |
1,200 |
2,625 |
|
|
Integral Systems, Inc. (a) |
4,100 |
62,013 |
|
|
Integrated Information Systems, Inc. |
2,300 |
13,836 |
|
|
InteliData Technologies Corp. (a) |
3,900 |
27,056 |
|
|
IntelliCorp, Inc. (a) |
7,700 |
10,588 |
|
|
Intelligroup, Inc. |
4,900 |
11,331 |
|
|
Interact Commerce Corp. (a) |
1,400 |
14,525 |
|
|
Interactive Intelligence, Inc. |
1,300 |
57,606 |
|
|
InterCept Group, Inc. (a) |
2,200 |
51,150 |
|
|
Intercontinental Telecom Corp. warrants 4/30/02 (a) |
110 |
0 |
|
|
Interface Systems, Inc. (a) |
3,500 |
56,875 |
|
|
Interliant, Inc. |
3,500 |
46,375 |
|
|
Internap Network Services Corp. |
16,700 |
601,200 |
|
|
Internet America, Inc. (a) |
6,500 |
24,375 |
|
|
Internet Capital Group, Inc. |
3,700 |
129,038 |
|
|
Internet Commerce Corp. (a) |
3,400 |
52,275 |
|
|
Internet Security Systems, Inc. (a) |
5,400 |
437,400 |
|
|
Internet.com Corp. (a) |
1,800 |
56,700 |
|
|
Intertrust Technologies Corp. |
10,900 |
175,081 |
|
|
|
|||
|
Shares |
Value (Note 1) |
||
|
InterWorld Corp. |
4,800 |
$ 96,600 |
|
|
Interwoven, Inc. |
5,800 |
556,800 |
|
|
IntraNet Solutions, Inc. (a) |
3,200 |
145,000 |
|
|
Intuit, Inc. (a) |
25,511 |
1,527,471 |
|
|
iVillage, Inc. (a) |
7,000 |
46,813 |
|
|
iXL Enterprises, Inc. (a) |
11,700 |
111,881 |
|
|
J.D. Edwards & Co. (a) |
12,900 |
320,081 |
|
|
Jack Henry & Associates, Inc. |
6,700 |
297,313 |
|
|
JDA Software Group, Inc. (a) |
3,500 |
45,281 |
|
|
Juno Online Services, Inc. (a) |
3,700 |
23,125 |
|
|
Kana Communications, Inc. |
10,956 |
439,610 |
|
|
Keane, Inc. (a) |
5,900 |
102,144 |
|
|
Keynote Systems, Inc. |
2,700 |
81,675 |
|
|
Landacorp, Inc. |
4,600 |
10,925 |
|
|
Lante Corp. |
3,730 |
34,969 |
|
|
Latitude Communications, Inc. (a) |
8,100 |
72,647 |
|
|
Launch Media, Inc. (a) |
2,100 |
15,881 |
|
|
Learn2.com, Inc. (a) |
7,700 |
19,250 |
|
|
Legato Systems, Inc. (a) |
8,452 |
102,481 |
|
|
Level 8 Systems, Inc. (a) |
3,582 |
71,640 |
|
|
Liberate Technologies |
11,600 |
356,700 |
|
|
Lightning Rod Software, Inc. |
100 |
300 |
|
|
Lightspan, Inc. |
7,090 |
25,147 |
|
|
Lionbridge Technologies, Inc. |
2,600 |
24,538 |
|
|
Liquid Audio, Inc. |
6,200 |
43,206 |
|
|
Litronic, Inc. (a) |
2,900 |
15,406 |
|
|
Litton Industries, Inc. (a) |
6,800 |
376,125 |
|
|
Log On America, Inc. (a) |
2,000 |
6,625 |
|
|
Logility, Inc. (a) |
1,700 |
6,588 |
|
|
LookSmart Ltd. |
11,900 |
199,325 |
|
|
Loudeye Technologies, Inc. |
4,000 |
44,000 |
|
|
Lycos, Inc. (a) |
13,900 |
986,900 |
|
|
Macromedia, Inc. (a) |
6,300 |
435,389 |
|
|
Mail.com, Inc. Class A (a) |
9,579 |
60,467 |
|
|
Manhattan Associates, Inc. (a) |
2,300 |
106,663 |
|
|
Manugistics Group, Inc. (a) |
2,900 |
254,475 |
|
|
Mapics, Inc. (a) |
9,000 |
54,000 |
|
|
MapInfo Corp. (a) |
2,250 |
93,375 |
|
|
Marimba, Inc. (a) |
4,300 |
72,563 |
|
|
Marketwatch.com, Inc. (a) |
2,800 |
32,900 |
|
|
MatrixOne, Inc. |
4,700 |
162,150 |
|
|
McAfee.com Corp. |
3,000 |
78,938 |
|
|
MedCom USA, Inc. (a) |
11,300 |
21,541 |
|
|
Media 100, Inc. (a) |
5,059 |
92,959 |
|
|
MedicaLogic, Inc. |
3,800 |
25,413 |
|
|
Mentor Graphics Corp. (a) |
10,500 |
198,188 |
|
|
Mercator Software, Inc. (a) |
3,400 |
53,125 |
|
|
Mercury Computer Systems, Inc. (a) |
2,500 |
70,859 |
|
|
MessageMedia, Inc. (a) |
13,400 |
48,156 |
|
|
Meta Group, Inc. (a) |
4,400 |
63,800 |
|
|
MetaCreations Corp. (a) |
2,500 |
20,938 |
|
|
Metasolv Software, Inc. |
3,500 |
143,063 |
|
|
Metro Information Services, Inc. (a) |
600 |
4,425 |
|
|
MicroAge, Inc. (a) |
7,500 |
938 |
|
|
Common Stocks - continued |
|||
|
Shares |
Value (Note 1) |
||
|
TECHNOLOGY - continued |
|||
|
Computer Services & Software - continued |
|||
|
Micrografx, Inc. (a) |
200 |
$ 338 |
|
|
Micromuse, Inc. (a) |
4,200 |
637,875 |
|
|
MicroStrategy, Inc. Class A (a) |
2,800 |
78,050 |
|
|
Microware Systems Corp. (a) |
5,900 |
11,063 |
|
|
Midway Games, Inc. (a) |
1,598 |
13,783 |
|
|
MP3.com, Inc. |
8,000 |
66,000 |
|
|
MSC Software Corp. (a) |
100 |
955 |
|
|
Multex.com, Inc. (a) |
2,200 |
47,850 |
|
|
MyTurn.com, Inc. (a) |
4,400 |
46,750 |
|
|
National Computer Systems, Inc. |
4,700 |
341,338 |
|
|
National Data Corp. |
2,543 |
74,701 |
|
|
National Information Consortium, Inc. |
4,800 |
45,600 |
|
|
National Instrument Corp. (a) |
7,525 |
324,986 |
|
|
National Techteam, Inc. (a) |
200 |
750 |
|
|
Navidec, Inc. (a) |
4,200 |
34,913 |
|
|
NaviSite, Inc. |
7,200 |
346,500 |
|
|
Neoforma.com, Inc. |
5,800 |
17,038 |
|
|
Neomedia Technologies, Inc. (a) |
5,500 |
24,406 |
|
|
NEON Systems, Inc. (a) |
1,200 |
20,175 |
|
|
Net Perceptions, Inc. (a) |
5,200 |
73,775 |
|
|
Netcentives, Inc. |
2,500 |
24,063 |
|
|
Netegrity, Inc. (a) |
2,800 |
246,400 |
|
|
Netgateway, Inc. (a) |
11,100 |
12,834 |
|
|
Netguru, Inc. (a) |
1,800 |
32,175 |
|
|
NetIQ Corp. |
2,282 |
128,933 |
|
|
NetManage, Inc. (a) |
9,427 |
26,808 |
|
|
NetObjects, Inc. (a) |
8,600 |
31,175 |
|
|
Netplex Group, Inc. (a) |
3,800 |
4,988 |
|
|
NETRIX Corp. (a) |
1,200 |
8,700 |
|
|
NetScout Systems, Inc. |
700 |
10,281 |
|
|
NetSolve, Inc. |
1,700 |
15,088 |
|
|
NetSpeak Corp. (a) |
3,700 |
44,400 |
|
|
Network Engines, Inc. |
4,200 |
164,325 |
|
|
Network Peripherals, Inc. (a) |
5,400 |
77,625 |
|
|
Network-1 Security Solutions, Inc. (a) |
2,300 |
15,813 |
|
|
Networks Associates, Inc. (a) |
14,918 |
386,003 |
|
|
Netzee, Inc. |
3,600 |
19,800 |
|
|
NetZero, Inc. |
9,000 |
37,969 |
|
|
New Era of Networks, Inc. (a) |
3,300 |
115,706 |
|
|
NHancement Technologies, Inc. (a) |
3,900 |
55,575 |
|
|
Niku Corp. |
2,000 |
54,125 |
|
|
Novadigm, Inc. (a) |
5,000 |
54,063 |
|
|
nStor Technologies, Inc. (a) |
7,900 |
17,775 |
|
|
Nuance Communications, Inc. |
3,800 |
500,175 |
|
|
Numerical Technologies, Inc. |
2,700 |
105,638 |
|
|
NYFIX, Inc. (a) |
4,925 |
184,688 |
|
|
O2Wireless Solutions, Inc. |
3,000 |
65,250 |
|
|
OAO Technology Solutions, Inc. (a) |
4,000 |
19,750 |
|
|
Objective Systems Integrators, Inc. (a) |
7,900 |
106,156 |
|
|
Omega Research, Inc. (a) |
900 |
2,700 |
|
|
Omtool Ltd. (a) |
700 |
1,575 |
|
|
|
|||
|
Shares |
Value (Note 1) |
||
|
ON Technology Corp. (a) |
4,000 |
$ 10,250 |
|
|
OneMain.com, Inc. (a) |
5,500 |
54,227 |
|
|
OneSource Information Services, Inc. (a) |
2,700 |
32,063 |
|
|
OnHealth Network Co. (a) |
2,400 |
7,575 |
|
|
Ontrack Data International, Inc. (a) |
4,600 |
53,763 |
|
|
Onvia.com, Inc. |
4,400 |
30,800 |
|
|
ONYX Software Corp. (a) |
4,200 |
95,288 |
|
|
Open Market, Inc. (a) |
5,900 |
49,781 |
|
|
Opnet Technologies, Inc. |
2,300 |
69,000 |
|
|
Optika, Inc. (a) |
5,100 |
21,038 |
|
|
Optio Software, Inc. |
3,200 |
10,000 |
|
|
Osage Systems Group, Inc. (a) |
5,200 |
7,150 |
|
|
OTG Software, Inc. |
2,900 |
64,888 |
|
|
Packeteer, Inc. |
3,600 |
173,250 |
|
|
PASW, Inc. |
3,300 |
12,581 |
|
|
PC-Tel, Inc. |
1,100 |
30,800 |
|
|
pcOrder.com, Inc. (a) |
5,100 |
26,934 |
|
|
Peerless Systems Corp. (a) |
6,900 |
9,056 |
|
|
Pegasus Solutions, Inc. (a) |
7,300 |
145,088 |
|
|
Pegasystems, Inc. (a) |
1,000 |
4,375 |
|
|
Peregrine Systems, Inc. (a) |
16,650 |
531,759 |
|
|
Peritus Software Services, Inc. (a) |
1,100 |
187 |
|
|
Perot Systems Corp. (a) |
7,600 |
78,850 |
|
|
Persistence Software, Inc. (a) |
3,900 |
66,300 |
|
|
Pervasive Software, Inc. (a) |
4,000 |
13,125 |
|
|
Pfsweb, Inc. |
11,853 |
32,596 |
|
|
Pharmacopeia, Inc. (a) |
2,300 |
96,456 |
|
|
Phoenix International, Inc. (a) |
150 |
450 |
|
|
Phoenix Technologies Ltd. (a) |
6,190 |
106,778 |
|
|
Phone.com, Inc. (a) |
9,900 |
915,131 |
|
|
Physician Computer Network, Inc. (a) |
200 |
2 |
|
|
Pilot Network Services, Inc. (a) |
3,500 |
46,375 |
|
|
Policy Management Systems Corp. (a) |
5,300 |
71,550 |
|
|
Polycom, Inc. (a) |
4,100 |
460,738 |
|
|
Portal Software, Inc. (a) |
21,300 |
1,176,825 |
|
|
PowerCerv Corp. (a) |
4,700 |
5,728 |
|
|
Predictive Systems, Inc. |
2,000 |
39,750 |
|
|
Preview Systems, Inc. |
1,000 |
8,688 |
|
|
Previo, Inc. (a) |
75 |
488 |
|
|
Priceline.com, Inc. (a) |
21,100 |
573,656 |
|
|
Primix Solutions, Inc. (a) |
2,700 |
7,425 |
|
|
Primus Knowledge Solutions, Inc. |
3,200 |
75,400 |
|
|
Private Business, Inc. (a) |
4,700 |
7,931 |
|
|
ProcureNet, Inc. (a) |
800 |
120 |
|
|
Prodigy Communications Corp. |
11,750 |
88,492 |
|
|
Progress Software Corp. (a) |
8,100 |
110,869 |
|
|
Project Software & Development, Inc. (a) |
2,500 |
45,000 |
|
|
Promotions.com, Inc. |
2,500 |
9,688 |
|
|
Proxicom, Inc. (a) |
7,600 |
183,825 |
|
|
ProxyMed, Inc. (a) |
4,500 |
6,047 |
|
|
PSINet, Inc. (a) |
22,574 |
396,456 |
|
|
Puma Technology, Inc. (a) |
4,000 |
97,250 |
|
|
PurchasePro.com, Inc. |
3,100 |
179,122 |
|
|
Common Stocks - continued |
|||
|
Shares |
Value (Note 1) |
||
|
TECHNOLOGY - continued |
|||
|
Computer Services & Software - continued |
|||
|
QAD, Inc. (a) |
3,600 |
$ 12,600 |
|
|
QRS Corp. (a) |
3,750 |
68,672 |
|
|
Quadramed Corp. (a) |
5,700 |
9,619 |
|
|
quepasa.com, Inc. (a) |
10,500 |
12,469 |
|
|
Quest Software, Inc. |
10,300 |
531,738 |
|
|
Quintus Corp. |
3,806 |
49,716 |
|
|
Radiant Systems, Inc. (a) |
2,900 |
49,663 |
|
|
Rainbow Technologies, Inc. (a) |
3,050 |
120,856 |
|
|
Ramp Networks, Inc. (a) |
7,100 |
36,388 |
|
|
Rare Medium Group, Inc. (a) |
4,700 |
47,000 |
|
|
Rational Software Corp. (a) |
11,800 |
1,518,513 |
|
|
RAVISENT Technologies, Inc. |
3,800 |
16,625 |
|
|
Razorfish, Inc. Class A (a) |
12,474 |
157,484 |
|
|
RealNetworks, Inc. (a) |
19,600 |
954,275 |
|
|
Red Hat, Inc. |
19,100 |
479,888 |
|
|
Redback Networks, Inc. (a) |
19,100 |
2,853,063 |
|
|
Registry Magic, Inc. (a) |
1,000 |
1,156 |
|
|
Remedy Corp. (a) |
2,800 |
65,450 |
|
|
Resonate, Inc. |
3,600 |
158,625 |
|
|
Retek, Inc. |
4,400 |
151,525 |
|
|
RMI.NET, Inc. (a) |
2,800 |
7,000 |
|
|
Rogue Wave Software, Inc. (a) |
8,300 |
56,025 |
|
|
Ross Systems, Inc. (a) |
11,900 |
14,875 |
|
|
RWD Technologies, Inc. (a) |
400 |
3,225 |
|
|
S1 Corp. (a) |
5,830 |
101,661 |
|
|
Saba Software, Inc. |
4,800 |
137,400 |
|
|
SAFLINK Corp. (a) |
7,100 |
15,531 |
|
|
SAGA Systems, Inc. (a) |
1,900 |
23,988 |
|
|
Sagent Technology, Inc. (a) |
3,500 |
37,188 |
|
|
Salon.com, Inc. (a) |
4,600 |
9,056 |
|
|
Sanchez Computer Associates, Inc. (a) |
3,100 |
66,263 |
|
|
Santa Cruz Operation, Inc. (a) |
14,600 |
67,525 |
|
|
Savvis Communications Corp. |
8,580 |
75,611 |
|
|
SCC Communications Corp. (a) |
5,700 |
34,556 |
|
|
Scient Corp. |
9,400 |
254,388 |
|
|
SciQuest.com, Inc. |
6,100 |
58,713 |
|
|
Screaming Media.com, Inc. (a) |
5,000 |
57,938 |
|
|
SeaChange International, Inc. (a) |
4,450 |
133,500 |
|
|
Secure Computing Corp. (a) |
6,000 |
149,625 |
|
|
Segue Software, Inc. (a) |
2,900 |
23,744 |
|
|
SEI Investments Co. |
8,100 |
514,350 |
|
|
Selectica, Inc. |
1,000 |
47,688 |
|
|
Sequoia Software Corp. |
6,000 |
67,500 |
|
|
Seranova, Inc. (a) |
2,300 |
19,694 |
|
|
SERENA Software, Inc. (a) |
6,100 |
268,400 |
|
|
ShowCase Corp. |
3,200 |
23,200 |
|
|
SignalSoft Corp. |
3,100 |
153,644 |
|
|
SilverStream Software, Inc. |
1,700 |
59,075 |
|
|
Simione Central Holdings, Inc. (a) |
20 |
55 |
|
|
Simione Central Holdings, Inc. |
17 |
0 |
|
|
|
|||
|
Shares |
Value (Note 1) |
||
|
SmarterKids.com, Inc. |
5,800 |
$ 8,700 |
|
|
SmartServ Online, Inc. (a) |
1,400 |
51,538 |
|
|
Smith Micro Software, Inc. (a) |
1,800 |
8,550 |
|
|
Smith-Gardner & Assocs, Inc. (a) |
10,200 |
40,800 |
|
|
Snowball.com, Inc. |
4,300 |
11,556 |
|
|
SoftNet Systems, Inc. (a) |
1,300 |
9,019 |
|
|
Software Spectrum, Inc. (a) |
3,200 |
41,600 |
|
|
Software Technologies Corp. |
7,200 |
140,400 |
|
|
Software.com, Inc. (a) |
6,300 |
917,044 |
|
|
Sonic Foundry, Inc. (a) |
1,400 |
13,038 |
|
|
Sonic Solutions, Inc. (a) |
4,600 |
13,225 |
|
|
Sonus Networks, Inc. |
400 |
66,550 |
|
|
Spatial Technology, Inc. (a) |
4,900 |
13,781 |
|
|
SpeedUs.com (a) |
1,900 |
6,709 |
|
|
Sportsline.com, Inc. (a) |
4,600 |
81,363 |
|
|
SPSS, Inc. (a) |
1,300 |
36,238 |
|
|
SS&C Technologies, Inc. (a) |
600 |
3,825 |
|
|
StarBase Corp. (a) |
3,000 |
20,250 |
|
|
StarMedia Network, Inc. (a) |
11,100 |
94,350 |
|
|
StorageNetworks, Inc. |
3,300 |
334,950 |
|
|
Structural Dynamics Research Corp. (a) |
7,600 |
122,550 |
|
|
SunGard Data Systems, Inc. (a) |
17,836 |
642,096 |
|
|
Sunquest Information Systems, Inc. (a) |
200 |
2,625 |
|
|
Support.com, Inc. |
4,200 |
130,266 |
|
|
Sybase, Inc. (a) |
13,300 |
364,919 |
|
|
Sykes Enterprises, Inc. (a) |
4,700 |
66,094 |
|
|
Symantec Corp. (a) |
6,600 |
322,163 |
|
|
Symix Systems, Inc. (a) |
2,600 |
18,525 |
|
|
Synopsys, Inc. (a) |
7,265 |
269,259 |
|
|
Syntel, Inc. (a) |
1,400 |
13,125 |
|
|
System Software Associates, Inc. (a) |
400 |
16 |
|
|
Systems & Computer Technology Corp. (a) |
6,300 |
113,006 |
|
|
Take-Two Interactive Software, Inc. (a) |
8,600 |
119,191 |
|
|
Talarian Corp. |
5,600 |
102,900 |
|
|
Talk City, Inc. |
1,800 |
2,813 |
|
|
Talk Visual Corp. (a) |
10,800 |
4,968 |
|
|
TALX Corp. (a) |
3,400 |
57,800 |
|
|
Tangram Enterprise Solutions, Inc. (a) |
2,900 |
4,531 |
|
|
Tanning Technology Corp. |
1,300 |
21,206 |
|
|
TCSI Corp. (a) |
8,600 |
15,588 |
|
|
Technology Solutions, Inc. |
9,500 |
29,391 |
|
|
TekInsight.com, Inc. (a) |
8,600 |
22,575 |
|
|
Telemate.Net Software, Inc. |
4,500 |
13,219 |
|
|
Telescan, Inc. (a) |
6,800 |
32,725 |
|
|
TenFold Corp. (a) |
7,200 |
48,600 |
|
|
The 3DO Co. (a) |
10,200 |
93,713 |
|
|
The Bisys Group (a) |
5,400 |
406,688 |
|
|
The Cobalt Group, Inc. |
3,400 |
17,638 |
|
|
The TriZetto Group, Inc. |
1,400 |
14,350 |
|
|
The viaLink Co. (a) |
3,000 |
28,500 |
|
|
theglobe.com, Inc. (a) |
7,600 |
10,569 |
|
|
TheStreet.Com, Inc. (a) |
5,900 |
52,363 |
|
|
Thinking Tools, Inc. (a) |
100 |
56 |
|
|
Common Stocks - continued |
|||
|
Shares |
Value (Note 1) |
||
|
TECHNOLOGY - continued |
|||
|
Computer Services & Software - continued |
|||
|
TIBCO Software, Inc. |
24,900 |
$ 2,538,244 |
|
|
Tier Technologies, Inc. (a) |
5,700 |
37,050 |
|
|
Timberline Software Corp. |
2,800 |
17,500 |
|
|
Titan Corp. (a) |
5,233 |
128,863 |
|
|
Towne Services, Inc. (a) |
2,600 |
2,356 |
|
|
Track Data Corp. (a) |
4,700 |
8,959 |
|
|
Transaction Systems Architects, Inc. |
2,300 |
42,263 |
|
|
Travelocity.com, Inc. (a) |
3,900 |
53,625 |
|
|
TREEV, Inc. (a) |
6,000 |
40,500 |
|
|
Troy Group, Inc. |
2,300 |
19,981 |
|
|
TSR, Inc. (a) |
300 |
1,594 |
|
|
Tumbleweed Communications Corp. |
3,276 |
205,160 |
|
|
Tyler Technologies, Inc. (a) |
300 |
656 |
|
|
UBICS, Inc. (a) |
4,000 |
11,250 |
|
|
Ulticom, Inc. |
3,900 |
231,075 |
|
|
Ultimate Software Group, Inc. (a) |
2,500 |
24,688 |
|
|
Unicomp, Inc. (a) |
4,400 |
6,050 |
|
|
Unify Corp. (a) |
7,800 |
30,713 |
|
|
Unigraphics Solutions, Inc. Class A (a) |
700 |
14,394 |
|
|
Uproar, Inc. |
3,500 |
22,750 |
|
|
US Interactive, Inc. |
2,400 |
18,750 |
|
|
USDATA Corp. (a) |
1,100 |
5,844 |
|
|
Usinternetworking, Inc. (a) |
12,000 |
123,750 |
|
|
USSEARCH.com, Inc. (a) |
4,300 |
7,391 |
|
|
V-One Corp. (a) |
6,600 |
18,975 |
|
|
VA Linux Systems, Inc. |
5,845 |
321,475 |
|
|
VelocityHSI, Inc. (a) |
2,020 |
7,070 |
|
|
Verilink Corp. (a) |
5,400 |
42,863 |
|
|
VeriSign, Inc. (a) |
24,975 |
4,966,903 |
|
|
Verity, Inc. (a) |
3,900 |
178,425 |
|
|
Versant Corp. (a) |
3,300 |
16,706 |
|
|
Versata, Inc. |
1,500 |
37,406 |
|
|
Vertel Corp. (a) |
5,700 |
73,388 |
|
|
VerticalNet, Inc. (a) |
9,900 |
527,175 |
|
|
Via Net.Works, Inc. |
5,060 |
65,464 |
|
|
Viador, Inc. |
4,500 |
41,625 |
|
|
Viant Corp. (a) |
4,900 |
67,988 |
|
|
Vignette Corp. (a) |
29,856 |
1,138,260 |
|
|
Viisage Technology, Inc. (a) |
3,700 |
11,794 |
|
|
Virage, Inc. |
4,300 |
58,319 |
|
|
VirtualFund.com, Inc. (a) |
5,600 |
11,550 |
|
|
Visual Data Corp. (a) |
3,000 |
10,125 |
|
|
Visual Networks, Inc. (a) |
2,100 |
16,931 |
|
|
Vitria Technology, Inc. |
15,800 |
742,600 |
|
|
Vizacom, Inc. (a) |
5,000 |
8,906 |
|
|
Voyager.net, Inc. |
6,600 |
45,788 |
|
|
Walker Interactive Systems, Inc. (a) |
5,100 |
19,763 |
|
|
WatchGuard Technologies, Inc. |
2,300 |
112,988 |
|
|
Wave Systems Corp. Class A (a) |
3,900 |
80,438 |
|
|
Wavo Corp. (a) |
7,500 |
5,391 |
|
|
|
|||
|
Shares |
Value (Note 1) |
||
|
Webb Interactive Services, Inc. (a) |
3,700 |
$ 34,688 |
|
|
WebEx Communications, Inc. |
4,800 |
265,800 |
|
|
Webhire, Inc. (a) |
2,200 |
11,825 |
|
|
webMethods, Inc. |
4,465 |
479,708 |
|
|
WebTrends Corp. (a) |
2,300 |
86,645 |
|
|
WidePoint Corp. (a) |
5,600 |
3,500 |
|
|
Wind River Systems, Inc. (a) |
7,720 |
314,590 |
|
|
Wink Communications, Inc. |
2,200 |
36,575 |
|
|
Witness Systems, Inc. |
4,110 |
81,686 |
|
|
WorldGate Communications, Inc. (a) |
4,000 |
79,000 |
|
|
XCare.net, Inc. |
5,620 |
28,100 |
|
|
Xceed, Inc. (a) |
1,800 |
13,725 |
|
|
Xpedior, Inc. |
4,000 |
43,000 |
|
|
Xybernaut Corp. (a) |
8,000 |
62,000 |
|
|
Youbet.com, Inc. (a) |
6,300 |
12,206 |
|
|
Zamba Corp. (a) |
2,200 |
13,200 |
|
|
ZapMe! Corp. |
3,500 |
8,531 |
|
|
ZeroPlus.com, Inc. (a) |
3,500 |
7,656 |
|
|
ZipLink, Inc. (a) |
5,700 |
31,706 |
|
|
|
102,099,257 |
||
|
Computers & Office Equipment - 5.4% |
|||
|
A.T. Cross & Co. Class A (a) |
200 |
1,100 |
|
|
Advanced Digital Information Corp. (a) |
4,500 |
76,500 |
|
|
Alpha Microsystems (a) |
8,200 |
32,800 |
|
|
Alteon Websystems, Inc. |
5,100 |
754,800 |
|
|
Amplicon, Inc. |
200 |
1,825 |
|
|
Applied Digital Solutions, Inc. (a) |
4,500 |
18,281 |
|
|
Ariel Corp. (a) |
10,900 |
33,722 |
|
|
Aspeon, Inc. (a) |
4,200 |
14,963 |
|
|
ATEC Group, Inc. (a) |
300 |
600 |
|
|
Auspex Systems, Inc. |
2,700 |
23,625 |
|
|
Avici Systems, Inc. |
7,400 |
1,108,613 |
|
|
Avocent Corp. (a) |
4,200 |
204,225 |
|
|
Boca Research, Inc. (a) |
1,300 |
4,306 |
|
|
Boundless Corp. (a) |
400 |
2,225 |
|
|
Brocade Communications |
14,200 |
3,206,538 |
|
|
CacheFlow, Inc. |
4,600 |
503,125 |
|
|
CDW Computer Centers, Inc. (a) |
10,900 |
801,150 |
|
|
Coinstar, Inc. (a) |
2,500 |
28,750 |
|
|
Comdisco, Inc. |
20,200 |
484,800 |
|
|
Communication Intelligence Corp. (a) |
7,900 |
26,663 |
|
|
Computer Network Technology Corp. (a) |
2,300 |
46,000 |
|
|
Concurrent Computer Corp. (a) |
3,000 |
51,375 |
|
|
Copper Mountain Networks, Inc. (a) |
7,300 |
437,544 |
|
|
CopyTele, Inc. (a) |
17,800 |
28,369 |
|
|
Cray, Inc. (a) |
8,300 |
49,022 |
|
|
Crossroads Systems, Inc. |
7,700 |
86,625 |
|
|
Dataram Corp. (a) |
2,900 |
94,613 |
|
|
Datawatch Corp. (a) |
7,500 |
13,594 |
|
|
Diebold, Inc. |
11,500 |
324,875 |
|
|
Digital Biometrics, Inc. (a) |
6,200 |
30,613 |
|
|
Digital Lightwave, Inc. (a) |
3,635 |
318,971 |
|
|
Common Stocks - continued |
|||
|
Shares |
Value (Note 1) |
||
|
TECHNOLOGY - continued |
|||
|
Computers & Office Equipment - continued |
|||
|
Digital River, Inc. (a) |
3,400 |
$ 23,375 |
|
|
Dot Hill Systems Corp. (a) |
500 |
4,438 |
|
|
Drexler Technology Corp. (a) |
100 |
1,869 |
|
|
Dunn Computer Corp. (a) |
5,100 |
6,534 |
|
|
ECCS, Inc. (a) |
3,000 |
11,063 |
|
|
Echelon Corp. (a) |
3,700 |
174,131 |
|
|
Eltrax Systems, Inc. (a) |
5,000 |
25,000 |
|
|
Emachines ltd. |
16,600 |
33,200 |
|
|
Emulex Corp. (a) |
4,300 |
450,156 |
|
|
En Pointe Technologies, Inc. (a) |
3,200 |
24,000 |
|
|
Encad, Inc. (a) |
400 |
1,250 |
|
|
Equinox Systems, Inc. (a) |
3,050 |
16,870 |
|
|
Evans & Sutherland Computer Corp. (a) |
600 |
4,050 |
|
|
Exabyte Corp. (a) |
3,900 |
23,400 |
|
|
Extended Systems, Inc. (a) |
1,100 |
50,463 |
|
|
Extreme Networks, Inc. (a) |
13,400 |
1,247,038 |
|
|
Fargo Electronics, Inc. |
8,000 |
46,000 |
|
|
FileNET Corp. (a) |
3,200 |
61,600 |
|
|
Finisar Corp. |
18,400 |
853,300 |
|
|
FOCUS Enhancements, Inc. (a) |
8,200 |
13,325 |
|
|
FVC.com, Inc. (a) |
400 |
2,825 |
|
|
Gadzoox Networks, Inc. |
6,400 |
58,000 |
|
|
General Binding Corp. |
400 |
3,550 |
|
|
Globix Corp. (a) |
3,400 |
91,163 |
|
|
GoAmerica, Inc. (a) |
8,000 |
87,500 |
|
|
GTSI Corp. (a) |
6,400 |
32,800 |
|
|
Hauppauge Digital, Inc. (a) |
4,400 |
41,800 |
|
|
HMT Technology Corp. (a) |
22,700 |
56,041 |
|
|
Hunt Corp. |
300 |
2,700 |
|
|
Hutchinson Technology, Inc. (a) |
900 |
21,375 |
|
|
Identix, Inc. (a) |
3,100 |
44,950 |
|
|
Imation Corp. (a) |
5,700 |
126,825 |
|
|
Immersion Corp. |
700 |
11,988 |
|
|
Ingram Micro, Inc. Class A (a) |
8,500 |
127,500 |
|
|
Insight Enterprises, Inc. (a) |
2,750 |
138,188 |
|
|
Intergraph Corp. (a) |
5,100 |
30,600 |
|
|
Interlink Electronics, Inc. (a) |
900 |
23,288 |
|
|
Interphase Corp. (a) |
3,500 |
72,188 |
|
|
Interspeed, Inc. |
2,800 |
32,025 |
|
|
Intraware, Inc. (a) |
4,700 |
49,350 |
|
|
Intrusion.com, Inc. (a) |
6,700 |
99,663 |
|
|
Iomega Corp. (a) |
21,600 |
89,100 |
|
|
ION Networks, Inc. (a) |
12,500 |
46,875 |
|
|
Itron, Inc. (a) |
500 |
3,000 |
|
|
JNI Corp. |
2,100 |
140,963 |
|
|
Juniper Networks, Inc. (a) |
40,600 |
8,678,250 |
|
|
Komag, Inc. (a) |
13,600 |
36,550 |
|
|
Kronos, Inc. (a) |
3,400 |
127,075 |
|
|
Manchester Equipment Co., Inc. (a) |
1,900 |
9,500 |
|
|
Maxtor Corp. (a) |
9,900 |
77,653 |
|
|
|
|||
|
Shares |
Value (Note 1) |
||
|
Micron Electronics, Inc. (a) |
17,400 |
$ 240,338 |
|
|
MICROS Systems, Inc. (a) |
4,300 |
75,519 |
|
|
Micros-To-Mainframes, Inc. (a) |
1,200 |
6,300 |
|
|
Microtouch Systems, Inc. (a) |
100 |
697 |
|
|
Mitek Systems, Inc. (a) |
7,300 |
44,256 |
|
|
MMC Networks, Inc. (a) |
3,700 |
450,706 |
|
|
MRV Communications, Inc. (a) |
6,900 |
531,731 |
|
|
MTI Technology Corp. (a) |
13,700 |
86,481 |
|
|
Neoware Systems, Inc. (a) |
11,100 |
40,931 |
|
|
Netopia, Inc. (a) |
1,800 |
65,925 |
|
|
Netpliance, Inc. |
6,800 |
36,125 |
|
|
Network Computing Devices, Inc. (a) |
4,500 |
5,625 |
|
|
Oak Technology, Inc. (a) |
4,648 |
135,373 |
|
|
ObjectSoft Corp. (a) |
316 |
365 |
|
|
Overland Data, Inc. (a) |
5,200 |
53,950 |
|
|
Par Technology Corp. (a) |
100 |
319 |
|
|
Paradyne Networks, Inc. |
2,500 |
53,594 |
|
|
Performance Technologies, Inc. (a) |
6,100 |
84,638 |
|
|
Planar Systems, Inc. (a) |
4,200 |
77,700 |
|
|
Pomeroy Computer Resources, Inc. (a) |
2,900 |
67,425 |
|
|
Printronix, Inc. (a) |
100 |
1,141 |
|
|
Procom Technology, Inc. (a) |
2,300 |
110,975 |
|
|
Proxim, Inc. (a) |
2,400 |
144,150 |
|
|
PSC, Inc. (a) |
7,300 |
29,656 |
|
|
Quantum Corp.: |
|
|
|
|
DLT & Storage Systems Group (a) |
15,312 |
207,669 |
|
|
Hard Disk Drive Group (a) |
9,906 |
96,584 |
|
|
RadiSys Corp. (a) |
2,253 |
126,027 |
|
|
Read-Rite Corp. (a) |
12,500 |
112,891 |
|
|
RSA Security, Inc. (a) |
4,300 |
253,969 |
|
|
Safeguard Scientifics, Inc. (a) |
13,800 |
394,163 |
|
|
SanDisk Corp. (a) |
8,000 |
668,000 |
|
|
SBS Technologies, Inc. (a) |
1,800 |
92,813 |
|
|
Scan-Optics, Inc. (a) |
300 |
253 |
|
|
ScanSoft, Inc. (a) |
9,048 |
22,055 |
|
|
ScanSource, Inc. (a) |
1,900 |
113,881 |
|
|
SCI Systems, Inc. (a) |
17,900 |
1,105,325 |
|
|
SCM Microsystems, Inc. (a) |
1,700 |
92,544 |
|
|
SED International Holdings, Inc. (a) |
100 |
325 |
|
|
Silicon Graphics, Inc. |
12,100 |
56,719 |
|
|
Splash Technology Holdings, Inc. (a) |
8,000 |
72,250 |
|
|
Storage Computer Corp. (a) |
100 |
1,344 |
|
|
Symbol Technologies, Inc. |
18,137 |
750,418 |
|
|
Syquest Technology, Inc. (a) |
1,700 |
3 |
|
|
Tanisys Technology, Inc. (a) |
7,800 |
9,506 |
|
|
Tech Data Corp. (a) |
6,400 |
330,400 |
|
|
Telxon Corp. (a) |
5,500 |
108,625 |
|
|
The Sedona Corp. (a) |
8,300 |
20,750 |
|
|
Tidel Technologies, Inc. (a) |
7,400 |
58,738 |
|
|
Transact Technologies, Inc. (a) |
100 |
756 |
|
|
Tricord Systems, Inc. (a) |
5,400 |
75,600 |
|
|
Trident Microsystems, Inc. (a) |
4,800 |
56,100 |
|
|
UniView Technologies Corp. (a) |
12,000 |
39,000 |
|
|
Valence Technology, Inc. (a) |
2,400 |
40,650 |
|
|
Common Stocks - continued |
|||
|
Shares |
Value (Note 1) |
||
|
TECHNOLOGY - continued |
|||
|
Computers & Office Equipment - continued |
|||
|
Vertex Interactive, Inc. (a) |
300 |
$ 3,619 |
|
|
Vitech America, Inc. (a) |
110 |
495 |
|
|
Western Digital Corp. (a) |
10,100 |
59,338 |
|
|
Zebra Technologies Corp.: |
|
|
|
|
Class A (a) |
5,300 |
286,200 |
|
|
Class B |
270 |
14,580 |
|
|
|
29,860,069 |
||
|
Electronic Instruments - 1.6% |
|||
|
Aclara Biosciences, Inc. |
3,600 |
140,400 |
|
|
ADE Corp. (a) |
1,400 |
31,500 |
|
|
Aeroflex, Inc. (a) |
3,375 |
124,031 |
|
|
Aetrium, Inc. (a) |
100 |
613 |
|
|
Anadigics, Inc. (a) |
2,600 |
93,600 |
|
|
Analogic Corp. |
1,200 |
45,000 |
|
|
APA Optics, Inc. (a) |
4,100 |
73,800 |
|
|
Applied Imaging Corp. (a) |
7,900 |
36,538 |
|
|
Aurora Biosciences Corp. (a) |
2,100 |
143,588 |
|
|
Axsys Technologies, Inc. (a) |
2,800 |
65,450 |
|
|
Barringer Technologies, Inc. (a) |
300 |
2,813 |
|
|
Beckman Coulter, Inc. |
4,500 |
342,563 |
|
|
Bruker Daltonics, Inc. |
7,200 |
361,800 |
|
|
BTU International, Inc. (a) |
5,700 |
71,250 |
|
|
Caliper Technologies Corp. |
1,900 |
118,038 |
|
|
Catapult Communications Corp. (a) |
4,700 |
84,600 |
|
|
Cepheid, Inc. |
3,200 |
38,800 |
|
|
Cerprobe Corp. (a) |
4,400 |
74,800 |
|
|
Cholestech Corp. (a) |
100 |
744 |
|
|
Chromatics Color Sciences |
1,050 |
1,903 |
|
|
Chromavision Medical Systems, Inc. (a) |
1,700 |
21,250 |
|
|
Cognex Corp. (a) |
6,800 |
272,000 |
|
|
Cohu, Inc. |
6,300 |
129,150 |
|
|
Credence Systems Corp. (a) |
5,500 |
322,094 |
|
|
Electro Scientific Industries, Inc. (a) |
3,200 |
131,800 |
|
|
FARO Technologies, Inc. (a) |
100 |
356 |
|
|
FEI Co. (a) |
5,300 |
159,663 |
|
|
Fisher Scientific International, Inc. (a) |
3,600 |
78,975 |
|
|
Genomic Solutions, Inc. |
5,500 |
87,656 |
|
|
GenRad, Inc. (a) |
1,100 |
9,694 |
|
|
Hathaway Corp. (a) |
3,800 |
28,500 |
|
|
Helix Technology, Inc. |
4,500 |
170,438 |
|
|
Hurco Companies, Inc. (a) |
100 |
425 |
|
|
II-VI, Inc. (a) |
1,861 |
100,029 |
|
|
Illumina, Inc. |
4,200 |
187,950 |
|
|
Integral Vision, Inc. (a) |
100 |
156 |
|
|
Isco, Inc. (a) |
100 |
425 |
|
|
Keithley Instruments, Inc. |
2,100 |
159,469 |
|
|
Kulicke & Soffa Industries, Inc. (a) |
4,000 |
72,750 |
|
|
LAM Research Corp. (a) |
14,100 |
424,763 |
|
|
LeCroy Corp. (a) |
500 |
7,563 |
|
|
LTX Corp. (a) |
4,300 |
109,919 |
|
|
|
|||
|
Shares |
Value (Note 1) |
||
|
Luminex Corp. |
2,800 |
$ 112,000 |
|
|
Meade Instruments Corp. (a) |
4,300 |
103,200 |
|
|
Measurement Specialties, Inc. (a) |
2,600 |
101,238 |
|
|
Mechanical Technology, Inc. (a) |
5,700 |
64,481 |
|
|
Mesa Laboratories, Inc. (a) |
100 |
531 |
|
|
Micro Component Technology, Inc. (a) |
7,100 |
64,788 |
|
|
MKS Instruments, Inc. (a) |
4,700 |
165,088 |
|
|
Molecular Devices Corp. (a) |
3,270 |
270,797 |
|
|
Nanometrics, Inc. (a) |
2,500 |
124,375 |
|
|
Newport Corp. |
3,400 |
540,600 |
|
|
Packard BioScience Co. |
6,300 |
125,213 |
|
|
Photon Dynamics, Inc. (a) |
1,400 |
65,713 |
|
|
PPT Vision, Inc. (a) |
100 |
588 |
|
|
Precision Optics Corp., Inc. (a) |
5,100 |
63,750 |
|
|
Quad Systems Corp. (a) |
100 |
150 |
|
|
Rheometrics Scientific, Inc. (a) |
5,900 |
28,394 |
|
|
Rudolph Technologies, Inc. |
2,000 |
80,000 |
|
|
Sawtek, Inc. (a) |
4,500 |
226,969 |
|
|
Schmitt Industries, Inc. (a) |
100 |
241 |
|
|
Sequenom, Inc. |
3,130 |
94,291 |
|
|
Silicon Valley Group, Inc. (a) |
7,700 |
214,638 |
|
|
Stocker & Yale, Inc. (a) |
2,200 |
64,075 |
|
|
Strategic Diagnostics, Inc. (a) |
4,000 |
11,000 |
|
|
Sunrise Telecom, Inc. |
6,300 |
283,106 |
|
|
Therma-Wave, Inc. |
4,170 |
113,111 |
|
|
Transgenomic, Inc. |
4,700 |
98,700 |
|
|
Trimble Navigation Ltd. (a) |
2,800 |
116,375 |
|
|
Tripath Imaging, Inc. (a) |
732 |
6,039 |
|
|
Varian, Inc. (a) |
4,500 |
219,375 |
|
|
Waters Corp. (a) |
15,400 |
1,225,263 |
|
|
Wireless Telecom Group, Inc. (a) |
200 |
663 |
|
|
X-Rite, Inc. |
700 |
6,738 |
|
|
Zygo Corp. (a) |
2,500 |
198,438 |
|
|
|
9,116,784 |
||
|
Electronics - 7.2% |
|||
|
3Dfx Interactive, Inc. (a) |
7,285 |
33,238 |
|
|
Act Manufacturing, Inc. (a) |
2,050 |
104,422 |
|
|
Actel Corp. (a) |
3,100 |
136,400 |
|
|
Advanced Energy Industries, Inc. (a) |
3,800 |
217,075 |
|
|
ALL American Semiconductor, Inc. (a) |
3,400 |
62,900 |
|
|
Alliance Semiconductor Corp. (a) |
5,400 |
142,088 |
|
|
Alpine Group, Inc. (a) |
500 |
2,906 |
|
|
American Technical Ceramics Corp. (a) |
2,900 |
66,338 |
|
|
Amkor Technology, Inc. (a) |
20,200 |
689,325 |
|
|
Amphenol Corp. Class A (a) |
5,200 |
332,800 |
|
|
Applied Micro Circuits Corp. (a) |
16,100 |
3,267,294 |
|
|
Applied Science & Technology, Inc. (a) |
5,750 |
88,766 |
|
|
Arrow Electronics, Inc. (a) |
12,900 |
469,238 |
|
|
Artesyn Technologies, Inc. (a) |
4,900 |
203,656 |
|
|
Artisan Components, Inc. (a) |
1,900 |
21,850 |
|
|
AstroPower, Inc. (a) |
3,500 |
120,313 |
|
|
Atmel Corp. (a) |
54,800 |
1,096,000 |
|
|
Audiovox Corp. Class A (a) |
6,130 |
111,106 |
|
|
Common Stocks - continued |
|||
|
Shares |
Value (Note 1) |
||
|
TECHNOLOGY - continued |
|||
|
Electronics - continued |
|||
|
Avnet, Inc. |
5,873 |
$ 351,646 |
|
|
AVX Corp. |
23,000 |
688,563 |
|
|
AXT, Inc. (a) |
1,900 |
73,388 |
|
|
BEI Technologies, Inc. |
1,900 |
108,656 |
|
|
Bel Fuse, Inc. Class A (a) |
200 |
6,950 |
|
|
Bell Microproducts, Inc. (a) |
4,600 |
152,950 |
|
|
Benchmark Electronics, Inc. (a) |
1,300 |
67,681 |
|
|
Blue Wave Systems, Inc. (a) |
7,800 |
48,263 |
|
|
Brightpoint, Inc. (a) |
2,700 |
17,044 |
|
|
C.P. Clare Corp. (a) |
2,300 |
12,722 |
|
|
California Micro Devices Corp. (a) |
3,500 |
88,375 |
|
|
Catalyst Semiconductor, Inc. (a) |
8,900 |
109,025 |
|
|
Celeritek, Inc. (a) |
1,700 |
76,288 |
|
|
Centillium Communications, Inc. |
3,500 |
260,750 |
|
|
CFM Technologies, Inc. (a) |
6,600 |
67,238 |
|
|
ChipPac, Inc. |
8,700 |
158,775 |
|
|
Cidco, Inc. (a) |
6,400 |
22,600 |
|
|
Cirrus Logic, Inc. (a) |
12,100 |
366,025 |
|
|
Conductus, Inc. (a) |
3,800 |
73,684 |
|
|
Conolog Corp. (a) |
6,800 |
10,200 |
|
|
Cree, Inc. (a) |
3,800 |
523,450 |
|
|
CTS Corp. |
2,200 |
112,888 |
|
|
Cypress Semiconductor Corp. (a) |
14,100 |
697,069 |
|
|
Dallas Semiconductor Corp. |
7,100 |
293,763 |
|
|
DDi Corp. |
3,800 |
144,875 |
|
|
Dense-Pac Microsystems, Inc (a) |
7,600 |
49,400 |
|
|
Diodes, Inc. (a) |
3,600 |
76,950 |
|
|
DMC Stratex Networks, Inc. (a) |
11,530 |
294,736 |
|
|
EFTC Corp. (a) |
795 |
2,087 |
|
|
Elantec Semiconductor, Inc. (a) |
2,500 |
221,250 |
|
|
Electroglas, Inc. (a) |
6,400 |
143,600 |
|
|
ESS Technology, Inc. (a) |
9,300 |
161,006 |
|
|
Esterline Technologies Corp. (a) |
500 |
9,688 |
|
|
Exar Corp. |
2,100 |
253,313 |
|
|
Ezenia!, Inc. (a) |
2,900 |
11,238 |
|
|
Fairchild Semiconduct International, Inc. Class A |
8,700 |
345,825 |
|
|
Gatefield Corp. (a) |
30 |
143 |
|
|
General Semiconductor, Inc. (a) |
4,900 |
71,356 |
|
|
Genus, Inc. (a) |
5,200 |
36,075 |
|
|
GlobeSpan, Inc. (a) |
9,300 |
1,120,069 |
|
|
Griffon Corp. (a) |
1,000 |
7,750 |
|
|
Harmonic, Inc. (a) |
6,170 |
206,695 |
|
|
Hi/fn, Inc. |
2,576 |
163,576 |
|
|
Hytek Microsystems, Inc. (a) |
3,100 |
41,269 |
|
|
Illinois Superconductor Corp. (a) |
8,300 |
25,938 |
|
|
Ingenuus Corp. (a) |
7,600 |
13,063 |
|
|
Innotrac Corp. (a) |
3,400 |
17,850 |
|
|
Innovex, Inc. |
2,400 |
36,000 |
|
|
Insilicon Corp. |
4,900 |
99,838 |
|
|
Integrated Circuit Systems, Inc. |
6,000 |
165,000 |
|
|
|
|||
|
Shares |
Value (Note 1) |
||
|
Integrated Device Technology, Inc. (a) |
11,337 |
$ 994,822 |
|
|
Integrated Silicon Solution (a) |
3,300 |
96,938 |
|
|
International Rectifier Corp. (a) |
6,800 |
427,975 |
|
|
Intersil Holding Corp. Class A |
4,240 |
228,960 |
|
|
Intevac, Inc. (a) |
100 |
525 |
|
|
Invision Technologies, Inc. (a) |
1,300 |
5,281 |
|
|
Irvine Sensors Corp. (a) |
7,800 |
24,619 |
|
|
IXYS Corp. (a) |
4,600 |
185,150 |
|
|
Jaco Electronics, Inc. (a) |
3,500 |
63,930 |
|
|
KEMET Corp. (a) |
8,800 |
264,000 |
|
|
Kent Electronics Corp. (a) |
1,300 |
38,025 |
|
|
Kopin Corp. (a) |
7,000 |
234,063 |
|
|
Lattice Semiconductor Corp. (a) |
5,300 |
412,738 |
|
|
Logic Devices, Inc. (a) |
9,600 |
25,200 |
|
|
Manufacturers Services Ltd. |
3,900 |
99,450 |
|
|
Maxwell Technologies, Inc. (a) |
3,400 |
55,675 |
|
|
MEMC Electronic Materials, Inc. (a) |
5,500 |
99,000 |
|
|
Merix Corp. (a) |
2,350 |
113,975 |
|
|
Methode Electronics, Inc. Class A |
4,300 |
258,538 |
|
|
Micrel, Inc. (a) |
11,200 |
856,100 |
|
|
Micro Linear Corp. (a) |
8,200 |
43,050 |
|
|
Microchip Technology, Inc. (a) |
9,000 |
612,562 |
|
|
Micronetics Wireless, Inc. (a) |
4,000 |
38,500 |
|
|
Microsemi Corp. (a) |
3,900 |
164,775 |
|
|
Microwave Filter Co., Inc. |
4,100 |
9,225 |
|
|
MIPS Technologies, Inc. Class A (a) |
1,500 |
85,875 |
|
|
NeoMagic Corp. (a) |
18,300 |
65,766 |
|
|
Netergy Networks, Inc. (a) |
1,900 |
22,563 |
|
|
NETsilicon, Inc. |
2,500 |
64,688 |
|
|
Network Access Solutions Corp. (a) |
3,800 |
30,163 |
|
|
New Focus, Inc. |
600 |
82,838 |
|
|
NU Horizons Electronics Corp. |
4,300 |
112,875 |
|
|
NVIDIA Corp. (a) |
8,100 |
642,938 |
|
|
Omnivision Technologies, Inc. |
4,400 |
198,000 |
|
|
On Semiconductor Corp. (a) |
18,300 |
311,100 |
|
|
Opti, Inc. |
3,000 |
11,625 |
|
|
Pacific Aerospace & Electronics, Inc. (a) |
22,500 |
26,016 |
|
|
Panda Project, Inc. (a) |
100 |
7 |
|
|
Parlex Corp. (a) |
2,200 |
83,875 |
|
|
PEMSTAR, Inc. |
3,600 |
66,915 |
|
|
Pericom Semiconductor Corp. (a) |
2,600 |
192,400 |
|
|
Photronics, Inc. (a) |
3,335 |
97,757 |
|
|
Pioneer Standard Electronics, Inc. |
7,300 |
99,919 |
|
|
Pixelworks, Inc. (a) |
4,700 |
127,488 |
|
|
Plexus Corp. (a) |
2,160 |
334,260 |
|
|
PLX Technology, Inc. (a) |
4,100 |
128,381 |
|
|
Power Integrations, Inc. (a) |
1,700 |
28,900 |
|
|
Power-One, Inc. (a) |
5,050 |
800,109 |
|
|
QLogic Corp. (a) |
9,929 |
1,126,942 |
|
|
QuickLogic Corp. |
900 |
20,475 |
|
|
Rambus, Inc. (a) |
12,500 |
1,021,094 |
|
|
Ramtron International Corp. (a) |
5,160 |
76,755 |
|
|
Reptron Electronics, Inc. (a) |
100 |
1,431 |
|
|
Research Frontiers, Inc. (a) |
2,400 |
45,900 |
|
|
Common Stocks - continued |
|||
|
Shares |
Value (Note 1) |
||
|
TECHNOLOGY - continued |
|||
|
Electronics - continued |
|||
|
RF Industries Ltd. (a) |
2,500 |
$ 15,781 |
|
|
RF Micro Devices, Inc. (a) |
19,800 |
883,575 |
|
|
RF Monolithics, Inc. (a) |
3,700 |
31,450 |
|
|
Richardson Electronics Ltd. |
5,900 |
89,791 |
|
|
S3, Inc. (a) |
8,368 |
98,847 |
|
|
Sage, Inc. |
1,871 |
16,839 |
|
|
SDL, Inc. (a) |
10,000 |
3,973,125 |
|
|
Semtech Corp. (a) |
3,600 |
426,375 |
|
|
Sheldahl, Inc. (a) |
200 |
663 |
|
|
Sigma Designs, Inc. (a) |
9,200 |
37,950 |
|
|
Signal Technology Corp. (a) |
3,100 |
58,900 |
|
|
Silicon Image, Inc. |
6,000 |
220,500 |
|
|
Silicon Laboratories, Inc. |
1,300 |
78,488 |
|
|
Silicon Storage Technology, Inc. (a) |
11,700 |
383,906 |
|
|
Siliconix, Inc. (a) |
5,300 |
296,138 |
|
|
Sipex Corp. (a) |
4,100 |
176,556 |
|
|
Somera Communications, Inc. |
2,200 |
29,288 |
|
|
Standard Microsystems Corp. (a) |
2,700 |
51,300 |
|
|
Stanford Microdevices, Inc. |
3,200 |
154,800 |
|
|
Storage Technology Corp. (a) |
7,600 |
120,175 |
|
|
Stratos Lightwave, Inc. |
8,000 |
376,000 |
|
|
Superconductor Technologies, Inc. (a) |
3,800 |
84,075 |
|
|
Supertex, Inc. (a) |
3,300 |
152,934 |
|
|
Tech-Sym Corp. (a) |
600 |
17,850 |
|
|
Technitrol, Inc. |
2,200 |
280,500 |
|
|
Tegal Corp. (a) |
11,400 |
52,725 |
|
|
Telcom Semiconductor, Inc. (a) |
2,300 |
40,106 |
|
|
Three-Five Systems, Inc. (a) |
1,948 |
64,771 |
|
|
TII Industries, Inc. (a) |
200 |
488 |
|
|
Transwitch Corp. (a) |
9,450 |
568,772 |
|
|
TriQuint Semiconductor, Inc. |
8,800 |
486,750 |
|
|
Triumph Group, Inc. (a) |
1,400 |
42,963 |
|
|
Unique Mobility, Inc. (a) |
100 |
813 |
|
|
Universal Display Corp. (a) |
3,900 |
97,013 |
|
|
US Technologies, Inc. (a) |
9,300 |
8,719 |
|
|
Vari-L, Inc. (a) |
5,200 |
62,400 |
|
|
Viasystems Group, Inc. |
5,200 |
85,800 |
|
|
Virata Corp. |
5,800 |
398,750 |
|
|
Vishay Intertechnology, Inc. (a) |
16,312 |
657,578 |
|
|
Vitesse Semiconductor Corp. (a) |
24,000 |
2,131,500 |
|
|
Vixel Corp. |
6,100 |
50,325 |
|
|
Voxware, Inc. (a) |
6,500 |
22,344 |
|
|
White Electronic Designs Corp. (a) |
7,000 |
112,000 |
|
|
Wire One Technologies, Inc. (a) |
8,300 |
64,325 |
|
|
Woodhead Industries, Inc. |
100 |
1,975 |
|
|
World Access, Inc. (a) |
9,255 |
83,873 |
|
|
Xicor, Inc. (a) |
9,700 |
115,794 |
|
|
Zoran Corp. (a) |
1,700 |
105,081 |
|
|
|
39,843,100 |
||
|
Photographic Equipment - 0.1% |
|||
|
3D Systems Corp. (a) |
4,200 |
84,000 |
|
|
|
|||
|
Shares |
Value (Note 1) |
||
|
Concord Camera Corp. (a) |
5,600 |
$ 123,200 |
|
|
InFocus Corp. (a) |
3,300 |
159,638 |
|
|
Lanier Worldwide, Inc. (a) |
15,900 |
15,900 |
|
|
Lexar Media, Inc. |
7,900 |
120,426 |
|
|
Panavision, Inc. (a) |
205 |
1,602 |
|
|
|
504,766 |
||
|
TOTAL TECHNOLOGY |
202,077,385 |
||
|
TRANSPORTATION - 1.2% |
|||
|
Air Transportation - 0.4% |
|||
|
800 Travel Systems, Inc. (a) |
900 |
1,575 |
|
|
AirTran Holdings, Inc. (a) |
11,500 |
47,438 |
|
|
Alaska Air Group, Inc. (a) |
3,300 |
85,800 |
|
|
America West Holding Corp. Class B (a) |
4,400 |
64,350 |
|
|
Atlantic Coast Airlines Holdings, Inc. (a) |
4,900 |
155,575 |
|
|
Atlas Air, Inc. (a) |
3,000 |
129,750 |
|
|
Cheap Tickets, Inc. (a) |
7,100 |
75,438 |
|
|
Continental Airlines, Inc. Class B (a) |
8,300 |
399,438 |
|
|
Cyber-Care, Inc. (a) |
3,500 |
20,781 |
|
|
Frontier Airlines, Inc. (a) |
7,100 |
121,588 |
|
|
GetThere.com, Inc. |
2,400 |
41,700 |
|
|
Hotel Reservations Network, Inc. |
2,700 |
95,006 |
|
|
Mercury Air Group, Inc. (a) |
100 |
700 |
|
|
Mesa Air Group, Inc. (a) |
9,500 |
52,844 |
|
|
Mesaba Holdings, Inc. (a) |
2,600 |
28,275 |
|
|
Midway Airlines Corp. (a) |
300 |
1,688 |
|
|
Midwest Express Holdings, Inc. (a) |
1,550 |
35,069 |
|
|
Navigant International, Inc. (a) |
3,600 |
37,800 |
|
|
Northwest Airlines Corp. Class A (a) |
11,000 |
344,438 |
|
|
SkyWest, Inc. |
8,470 |
420,853 |
|
|
Transportation World Airlines, Inc. (a) |
6,600 |
13,613 |
|
|
UAL Corp. |
5,300 |
253,075 |
|
|
World Airways, Inc. (a) |
800 |
550 |
|
|
World Fuel Services Corp. |
150 |
1,153 |
|
|
|
2,428,497 |
||
|
Railroads - 0.1% |
|||
|
ABC Rail Products Corp. (a) |
100 |
650 |
|
|
Florida East Coast Industries |
2,200 |
95,975 |
|
|
Kansas City Southern Industries, Inc. |
2,400 |
22,200 |
|
|
RailAmerica, Inc. (a) |
14,300 |
92,056 |
|
|
Trinity Industries, Inc. |
9,100 |
176,313 |
|
|
Wabtec Corp. |
2,283 |
23,686 |
|
|
Wisconsin Central Transportation Corp. (a) |
13,800 |
184,575 |
|
|
|
595,455 |
||
|
Shipping - 0.0% |
|||
|
Alexander & Baldwin, Inc. |
6,800 |
178,925 |
|
|
Gulfmark Offshore, Inc. (a) |
100 |
2,400 |
|
|
International Shipholding Corp. |
100 |
719 |
|
|
Kirby Corp. (a) |
1,175 |
27,686 |
|
|
Marine Transport Corp. (a) |
30 |
66 |
|
|
Common Stocks - continued |
|||
|
Shares |
Value (Note 1) |
||
|
TRANSPORTATION - continued |
|||
|
Shipping - continued |
|||
|
OMI Corp. (a) |
300 |
$ 2,250 |
|
|
Trico Marine Services, Inc. (a) |
3,200 |
46,400 |
|
|
|
258,446 |
||
|
Trucking & Freight - 0.7% |
|||
|
Airborne Freight Corp. |
2,100 |
31,369 |
|
|
AirNet Systems, Inc. (a) |
400 |
1,850 |
|
|
American Freightways Corp. (a) |
7,400 |
121,638 |
|
|
Arkansas Best Corp. (a) |
8,300 |
125,019 |
|
|
Arnold Industries, Inc. |
800 |
12,450 |
|
|
C.H. Robinson Worldwide, Inc. |
7,600 |
449,825 |
|
|
Carey International, Inc. (a) |
4,400 |
79,750 |
|
|
Celadon Group, Inc. (a) |
3,800 |
43,225 |
|
|
Circle International Group, Inc. |
5,100 |
182,644 |
|
|
CNF Transportation, Inc. |
3,100 |
75,950 |
|
|
Consolidated Freightways Corp. (a) |
3,100 |
14,192 |
|
|
Covenant Transport, Inc. Class A (a) |
9,300 |
97,650 |
|
|
EGL, Inc. (a) |
3,100 |
111,406 |
|
|
Expeditors International of |
7,400 |
362,600 |
|
|
Forward Air Corp. (a) |
4,800 |
220,200 |
|
|
Fritz Companies, Inc. (a) |
1,100 |
16,294 |
|
|
Frozen Food Express Industries, Inc. |
100 |
256 |
|
|
Heartland Express, Inc. (a) |
900 |
15,750 |
|
|
Hub Group, Inc. Class A (a) |
200 |
2,700 |
|
|
J.B. Hunt Transport Services, Inc. |
1,100 |
14,850 |
|
|
Knights Transportation, Inc. (a) |
2,150 |
36,550 |
|
|
Landstar System, Inc. (a) |
2,500 |
127,500 |
|
|
M.S. Carriers, Inc. (a) |
400 |
7,375 |
|
|
Old Dominion Freight Lines, Inc. (a) |
100 |
925 |
|
|
Roadway Express, Inc. |
2,200 |
50,600 |
|
|
Rollins Truck Leasing Corp. |
5,150 |
34,763 |
|
|
Simon Transportation Services, Inc. |
3,300 |
21,038 |
|
|
Swift Transportation Co., Inc. (a) |
6,850 |
116,878 |
|
|
Trailer Bridge, Inc. (a) |
100 |
213 |
|
|
Transit Group, Inc. (a) |
100 |
53 |
|
|
United Parcel Service, Inc. Class B |
14,500 |
803,844 |
|
|
United Shipping & Technology, Inc. (a) |
2,400 |
15,900 |
|
|
US Xpress Enterprises, Inc. (a) |
2,100 |
16,275 |
|
|
USA Truck, Inc. (a) |
100 |
650 |
|
|
USFreightways Corp. |
5,600 |
174,650 |
|
|
Werner Enterprises, Inc. |
1,475 |
19,913 |
|
|
XTRA Corp. (a) |
1,100 |
48,813 |
|
|
Yellow Corp. (a) |
9,600 |
146,400 |
|
|
|
3,601,958 |
||
|
TOTAL TRANSPORTATION |
6,884,356 |
||
|
UTILITIES - 8.1% |
|||
|
Cellular - 1.8% |
|||
|
@Track Communications, Inc. (a) |
5,800 |
8,338 |
|
|
|
|||
|
Shares |
Value (Note 1) |
||
|
Advanced Radio Telecom Corp. (a) |
1,400 |
$ 14,350 |
|
|
AirGate PCS, Inc. |
1,600 |
108,900 |
|
|
Alamosa PCS Holdings, Inc. |
5,870 |
146,016 |
|
|
Aquis Communication Group, Inc. (a) |
8,500 |
4,781 |
|
|
Arch Communications Group, Inc. (a) |
5,133 |
26,627 |
|
|
Arch Communications Group, Inc. warrants 9/1/03 (a) |
172 |
102 |
|
|
Boston Communications Group, Inc. (a) |
3,900 |
56,063 |
|
|
Cellnet Data Systems, Inc. (a) |
6,800 |
102 |
|
|
Centennial Cellular Corp. (a) |
7,900 |
127,881 |
|
|
Crown Castle International Corp. (a) |
24,000 |
832,500 |
|
|
Dobson Communications Corp. Class A |
9,320 |
200,963 |
|
|
General Communications, Inc. |
9,400 |
75,200 |
|
|
LCC International, Inc. (a) |
1,900 |
41,681 |
|
|
Leap Wireless International, Inc. (a) |
2,750 |
218,281 |
|
|
Lightbridge, Inc. (a) |
4,000 |
70,000 |
|
|
Metrocall, Inc. (a) |
6,100 |
25,544 |
|
|
Nextel Partners, Inc. Class A |
22,100 |
667,144 |
|
|
Powertel, Inc. (a) |
5,100 |
397,800 |
|
|
Price Communications Corp. |
8,215 |
168,408 |
|
|
Rural Cellular Corp. Class A (a) |
2,400 |
182,400 |
|
|
SBA Communications Corp. Class A (a) |
5,900 |
263,288 |
|
|
Sensar Corp. (a) |
2,300 |
52,038 |
|
|
SpectraLink Corp. (a) |
5,300 |
68,900 |
|
|
TeleCorp PCS, Inc. Class A |
9,900 |
348,975 |
|
|
Telephone & Data Systems, Inc. |
9,300 |
1,078,800 |
|
|
Tritel, Inc. Class A |
10,400 |
271,700 |
|
|
Triton PCS Holdings, Inc. Class A |
5,600 |
310,100 |
|
|
Ubiquitel, Inc. |
8,200 |
93,275 |
|
|
United States Cellular Corp. (a) |
13,200 |
971,025 |
|
|
USCI, Inc. (a) |
100 |
11 |
|
|
VoiceStream Wireless Corp. (a) |
21,775 |
2,451,048 |
|
|
WebLink Wireless, Inc. Class A (a) |
10,300 |
102,034 |
|
|
Western Wireless Corp. Class A (a) |
11,600 |
593,050 |
|
|
|
9,977,325 |
||
|
Electric Utility - 2.3% |
|||
|
Allegheny Energy, Inc. |
17,300 |
620,638 |
|
|
Alliant Energy Corp. |
13,439 |
393,091 |
|
|
Avista Corp. |
3,500 |
64,531 |
|
|
Bangor Hydro-Electric Co. |
200 |
4,825 |
|
|
Black Hills Corp. |
650 |
16,575 |
|
|
Calpine Corp. (a) |
15,700 |
1,554,300 |
|
|
Central Vermont Public Service Corp. |
300 |
3,600 |
|
|
CH Energy Group, Inc. |
500 |
18,875 |
|
|
Citizens Communications Co. (a) |
37,366 |
609,533 |
|
|
Cleco Corp. |
700 |
29,225 |
|
|
CMP Group, Inc. |
2,100 |
61,688 |
|
|
Conectiv, Inc. |
16,700 |
296,425 |
|
|
DPL, Inc. |
13,933 |
380,545 |
|
|
DQE, Inc. |
11,600 |
466,175 |
|
|
El Paso Electric Co. (a) |
2,000 |
26,875 |
|
|
Empire District Electric Co. |
500 |
12,969 |
|
|
Energy East Corp. |
20,561 |
466,478 |
|
|
Common Stocks - continued |
|||
|
Shares |
Value (Note 1) |
||
|
UTILITIES - continued |
|||
|
Electric Utility - continued |
|||
|
Hawaiian Electric Industries, Inc. |
7,200 |
$ 235,800 |
|
|
IDACORP, Inc. |
6,900 |
272,119 |
|
|
IPALCO Enterprises, Inc. |
6,600 |
153,863 |
|
|
Kansas City Power & Light Co. |
12,500 |
335,938 |
|
|
LG&E Energy Corp. |
20,302 |
497,399 |
|
|
Madison Gas & Electric Co. |
500 |
9,938 |
|
|
Minnesota Power, Inc. |
5,500 |
122,031 |
|
|
Montana Power Co. |
14,000 |
504,875 |
|
|
NiSource, Inc. |
21,200 |
507,475 |
|
|
Northeast Utilities |
21,200 |
482,300 |
|
|
Northwestern Corp. |
800 |
17,400 |
|
|
NRG Energy, Inc. |
7,600 |
199,500 |
|
|
NSTAR Companies |
8,424 |
354,335 |
|
|
Ogden Corp. (a) |
4,600 |
79,925 |
|
|
OGE Energy Corp. |
15,600 |
333,450 |
|
|
Otter Tail Power Co. |
200 |
4,175 |
|
|
Potomac Electric Power Co. |
19,100 |
481,081 |
|
|
Public Service Co. of New Mexico |
9,600 |
205,200 |
|
|
Puget Sound Power & Light Co. |
12,500 |
292,188 |
|
|
RGS Energy Group, Inc. |
7,000 |
174,125 |
|
|
SCANA Corp. |
19,535 |
534,771 |
|
|
Sierra Pacific Resources |
11,754 |
207,899 |
|
|
TECO Energy, Inc. |
20,500 |
503,531 |
|
|
UIL Holdings Corp. |
600 |
30,188 |
|
|
Unisource Energy Corp. |
1,000 |
15,563 |
|
|
Utilicorp United, Inc. |
17,150 |
408,384 |
|
|
Wisconsin Energy Corp. |
20,000 |
425,000 |
|
|
WPS Resources Corp. |
800 |
24,050 |
|
|
|
12,438,851 |
||
|
Gas - 1.1% |
|||
|
AGL Resources, Inc. |
12,200 |
231,038 |
|
|
Atmos Energy Corp. |
1,000 |
20,750 |
|
|
Berkshire Energy Resources |
1,200 |
45,225 |
|
|
Cascade Natural Gas Corp. |
100 |
1,700 |
|
|
Contour Energy Co. (a) |
500 |
1,297 |
|
|
CTG Resources, Inc. |
200 |
8,100 |
|
|
Dynegy, Inc. Class A |
40,504 |
1,822,680 |
|
|
Energen Corp. |
900 |
23,344 |
|
|
Equitable Resources, Inc. |
7,100 |
399,819 |
|
|
Kinder Morgan, Inc. |
18,650 |
686,553 |
|
|
Laclede Gas Co. |
500 |
10,781 |
|
|
MCN Energy Group, Inc. |
15,300 |
367,200 |
|
|
MDU Resources Group, Inc. |
4,450 |
111,250 |
|
|
Midcoast Energy Resources, Inc. |
1,300 |
24,213 |
|
|
Mitchell Energy & Development Corp. Class A |
3,400 |
136,000 |
|
|
National Fuel Gas Co. |
7,800 |
409,013 |
|
|
New Jersey Resources Corp. |
900 |
36,000 |
|
|
Northwest Natural Gas Co. |
5,000 |
115,000 |
|
|
NUI Corp. |
100 |
3,006 |
|
|
Piedmont Natural Gas Co., Inc. |
9,000 |
249,188 |
|
|
|
|||
|
Shares |
Value (Note 1) |
||
|
Providence Energy Corp. |
1,300 |
$ 55,088 |
|
|
Questar Corp. |
18,100 |
392,544 |
|
|
SEMCO Energy, Inc. |
105 |
1,575 |
|
|
South Jersey Industries, Inc. |
300 |
8,100 |
|
|
Southern Union Co. |
1,508 |
27,050 |
|
|
Southwest Gas Corp. |
3,100 |
58,513 |
|
|
Southwestern Energy Co. |
800 |
6,200 |
|
|
UGI Corp. |
2,600 |
59,313 |
|
|
Vectren Corp. |
1,832 |
34,808 |
|
|
Washington Gas Light Co. |
11,800 |
298,688 |
|
|
Western Resources, Inc. |
15,800 |
316,000 |
|
|
|
5,960,036 |
||
|
Telephone Services - 2.8% |
|||
|
Adelphia Business Solution, Inc. |
7,800 |
116,513 |
|
|
Alaska Communication Systems |
4,300 |
34,803 |
|
|
Allegiance Telecom, Inc. (a) |
14,350 |
714,809 |
|
|
Allied Riser Communications Corp. |
10,700 |
86,938 |
|
|
AT&T Latin America Corp. (a) |
8,100 |
113,400 |
|
|
Atlantic Tele-Network, Inc. |
140 |
1,628 |
|
|
BroadWing, Inc. |
28,456 |
794,990 |
|
|
Caprock Communications Corp. (a) |
12,200 |
72,438 |
|
|
CFW Communications Co. |
1,800 |
61,200 |
|
|
Choice One Communications, Inc. |
2,970 |
47,520 |
|
|
Commonwealth Telephone |
4,200 |
162,225 |
|
|
Cypress Communications, Inc. |
8,050 |
42,263 |
|
|
Deltathree.com, Inc. |
4,700 |
29,963 |
|
|
e.spire Communications, Inc. (a) |
4,600 |
18,688 |
|
|
eLECTRIC Communications Corp. (a) |
14,200 |
30,619 |
|
|
eOn Communications Corp. |
3,220 |
11,069 |
|
|
Equinix, Inc. |
9,900 |
159,885 |
|
|
Focal Communications Corp. |
9,700 |
300,094 |
|
|
Global TeleSystems Group, Inc. (a) |
21,300 |
183,713 |
|
|
I-Link Corp. (a) |
5,500 |
19,250 |
|
|
iBasis, Inc. |
4,400 |
91,300 |
|
|
ICG Communications, Inc. (a) |
4,000 |
23,875 |
|
|
iGate Capital Corp. (a) |
6,000 |
43,687 |
|
|
Illuminet Holdings, Inc. |
3,700 |
147,075 |
|
|
Intermedia Communications, Inc. (a) |
6,500 |
134,875 |
|
|
ITC DeltaCom, Inc. (a) |
11,000 |
155,375 |
|
|
ITXC Corp. |
5,100 |
102,000 |
|
|
Level 3 Communications, Inc. (a) |
47,700 |
4,161,080 |
|
|
McLeodUSA, Inc. Class A (a) |
76,903 |
1,216,029 |
|
|
Metromedia Fiber Network, Inc. |
61,884 |
2,471,492 |
|
|
Mpower Communications Corp. (a) |
5,700 |
105,094 |
|
|
Net2000 Communications, Inc. |
8,600 |
75,250 |
|
|
Net2Phone, Inc. |
4,000 |
118,250 |
|
|
Network Plus Corp. |
12,000 |
137,250 |
|
|
NEXTLINK Communications, Inc. |
29,648 |
1,039,533 |
|
|
North Pittsburgh Systems, Inc. |
100 |
1,413 |
|
|
Common Stocks - continued |
|||
|
Shares |
Value (Note 1) |
||
|
UTILITIES - continued |
|||
|
Telephone Services - continued |
|||
|
NorthEast Optic Network, Inc. (a) |
3,300 |
$ 146,644 |
|
|
Pac-West Telecomm, Inc. |
5,120 |
72,320 |
|
|
Pacific Gateway Exchange, Inc. (a) |
10,800 |
24,300 |
|
|
PNV, Inc. |
1,000 |
1,500 |
|
|
Primus Telecommunications |
6,261 |
99,785 |
|
|
RCN Corp. |
12,500 |
303,125 |
|
|
Rhythms NetConnections, Inc. (a) |
10,100 |
90,900 |
|
|
Source Media, Inc. (a) |
2,800 |
17,150 |
|
|
STAR Telecommunications, Inc. (a) |
24,715 |
78,779 |
|
|
Startec Global Communications Corp. (a) |
1,600 |
19,800 |
|
|
TALK.com, Inc. (a) |
14,700 |
105,656 |
|
|
TeleCommunication Systems, Inc. |
3,100 |
88,931 |
|
|
Teligent, Inc. Class A (a) |
8,700 |
148,444 |
|
|
Time Warner Telecom, Inc. Class A (a) |
4,400 |
285,725 |
|
|
U.S. LEC Corp. Class A (a) |
5,000 |
52,500 |
|
|
Ursus Telecom Corp. (a) |
4,400 |
19,800 |
|
|
USN Communications, Inc. (a) |
700 |
18 |
|
|
Viatel, Inc. (a) |
4,990 |
68,301 |
|
|
West Teleservices Corp. (a) |
5,400 |
128,250 |
|
|
Williams Communications Group, Inc. |
8,800 |
258,500 |
|
|
WinStar Communications, Inc. (a) |
10,000 |
268,750 |
|
|
WorldPort Communications, Inc. (a) |
14,900 |
67,516 |
|
|
Z-Tel Technologies, Inc. |
8,000 |
65,000 |
|
|
|
15,437,280 |
||
|
Water - 0.1% |
|||
|
American States Water Co. |
200 |
5,213 |
|
|
American Water Works, Inc. |
18,800 |
460,600 |
|
|
Azurix Corp. (a) |
19,100 |
90,725 |
|
|
E Town Corp. |
1,800 |
120,938 |
|
|
Philadelphia Suburban Corp. |
4,476 |
104,906 |
|
|
|
782,382 |
||
|
TOTAL UTILITIES |
44,595,874 |
||
|
TOTAL COMMON STOCKS (Cost $508,435,027) |
548,267,211 |
||
|
Preferred Stocks - 0.0% |
|||
|
|
|
|
|
|
Convertible Preferred Stocks - 0.0% |
|||
|
CONSTRUCTION & REAL ESTATE - 0.0% |
|||
|
Real Estate Investment Trusts - 0.0% |
|||
|
Kimco Realty Corp. Series D $1.875 |
108 |
2,747 |
|
|
Prime Retail, Inc. Series B, $2.13 |
60 |
255 |
|
|
|
3,002 |
||
|
|
|||
|
Shares |
Value (Note 1) |
||
|
Nonconvertible Preferred Stocks - 0.0% |
|||
|
HEALTH - 0.0% |
|||
|
Medical Equipment & Supplies - 0.0% |
|||
|
Mediq, Inc. Series A, $1.30 (a) |
7 |
$ 0 |
|
|
TOTAL PREFERRED STOCKS (Cost $3,957) |
3,002 |
||
|
Corporate Bonds - 0.0% |
|||||
|
Moody's Ratings (unaudited) |
Principal Amount |
|
|||
|
Convertible Bonds - 0.0% |
|||||
|
CONSTRUCTION & REAL ESTATE - 0.0% |
|||||
|
Real Estate - 0.0% |
|||||
|
Excel Legacy Corp. 9% 11/4/04 |
- |
|
$ 2,000 |
1,620 |
|
|
Nonconvertible Bonds - 0.0% |
|||||
|
CONSTRUCTION & REAL ESTATE - 0.0% |
|||||
|
Real Estate - 0.0% |
|||||
|
Excel Legacy Corp. 10% 11/4/04 |
- |
|
1,000 |
808 |
|
|
TOTAL CORPORATE BONDS (Cost $2,646) |
2,428 |
||||
|
U.S. Treasury Obligations - 1.6% |
|||||
|
|
|||||
|
U.S. Treasury Bills, yield at date of purchase 6.02% to 6.19% 9/28/00 to 11/16/00 (c) |
|
|
9,161,000 |
9,074,043 |
|
|
Cash Equivalents - 13.3% |
|||
|
Shares |
|
||
|
Bankers Trust Institutional Daily |
73,419,775 |
73,419,775 |
|
|
TOTAL INVESTMENT PORTFOLIO - 114.1% (Cost $590,935,087) |
630,766,459 |
||
|
NET OTHER ASSETS - (14.1)% |
(77,780,839) |
||
|
NET ASSETS - 100% |
$ 552,985,620 |
||
|
Futures Contracts |
|||||
|
|
Expiration Date |
Underlying Face Amount at Value |
Unrealized Gain/(Loss) |
||
|
Purchased |
|||||
|
2 Nasdaq 100 Index Contracts |
Sept. 2000 |
$ 818,800 |
$ 113,388 |
||
|
10 Russell 2000 Index Contracts |
Sept. 2000 |
2,685,250 |
164,440 |
||
|
3 S&P 400 Midcap Index Contracts |
Sept. 2000 |
814,875 |
76,607 |
||
|
|
|
$ 4,318,925 |
$ 354,435 |
||
|
|
|
The face value of futures purchased as a percentage of net assets - 0.7% |
|
Legend |
|
(a) Non-income producing |
|
(b) The rate quoted is the annualized seven-day yield of the fund at |
|
(c) Security or a portion of the security was pledged to cover margin requirements for futures contracts. At the period end, the value of securities pledged amounted to $144,775. |
|
Other Information |
|
Purchases and sales of securities, other than short-term securities, aggregated $266,482,279 and $136,684,283, respectively. |
|
The market value of futures contracts opened and closed during the period amounted to $239,766,144 and $243,174,562, respectively. |
|
The fund placed a portion of its portfolio transactions with brokerage firms which are affiliates of Bankers Trust. The commissions paid to these affiliated firms were $10,368 for the period. |
|
The fund participated in the security lending program. At period end, the value of securities loaned amounted to $71,813,656. The fund received cash collateral of $73,419,775 which was invested in the Bankers Trust Institutional Daily Asset Fund. The fund also received non-cash collateral of $504,576 which represents U.S. Treasury obligations. |
|
Income Tax Information |
|
At August 31, 2000, the aggregate cost of investment securities for income tax purposes was $595,869,392. Net unrealized appreciation aggregated $34,897,067, of which $131,288,751 related to appreciated investment securities and $96,391,684 related to depreciated investment securities. |
See accompanying notes which are an integral part of the financial statements.
Semiannual Report
Statement of Assets and Liabilities
|
|
August 31, 2000 |
|
|
Assets |
|
|
|
Investment in securities, at value |
|
$ 630,766,459 |
|
Receivable for investments sold |
|
10,729,056 |
|
Receivable for fund shares sold |
|
1,295,244 |
|
Dividends receivable |
|
225,485 |
|
Redemption fees receivable |
|
596 |
|
Receivable for daily variation |
|
144,775 |
|
Other receivables |
|
49,923 |
|
Total assets |
|
643,211,538 |
|
Liabilities |
|
|
|
Payable to custodian bank |
$ 68,993 |
|
|
Payable for investments purchased |
15,550,829 |
|
|
Payable for fund shares redeemed |
1,022,348 |
|
|
Accrued management fee |
46,596 |
|
|
Other payables and |
117,377 |
|
|
Collateral on securities loaned, |
73,419,775 |
|
|
Total liabilities |
|
90,225,918 |
|
Net Assets |
|
$ 552,985,620 |
|
Net Assets consist of: |
|
|
|
Paid in capital |
|
$ 499,043,788 |
|
Undistributed net investment income |
|
2,190,089 |
|
Accumulated undistributed net realized gain (loss) on investments and foreign currency transactions |
|
11,565,934 |
|
Net unrealized appreciation (depreciation) on investments |
|
40,185,809 |
|
Net Assets, for 15,506,050 |
|
$ 552,985,620 |
|
Net Asset Value, offering price |
|
$35.66 |
Statement of Operations
|
|
Six months ended August 31, 2000 |
|
|
Investment Income Dividends |
|
$ 1,993,205 |
|
Interest |
|
341,436 |
|
Security lending |
|
313,801 |
|
Total income |
|
2,648,442 |
|
Expenses |
|
|
|
Management fee and |
$ 590,335 |
|
|
Transfer agent fees |
330,573 |
|
|
Accounting fees |
90,070 |
|
|
Non-interested trustees' compensation |
742 |
|
|
Registration fees |
84,493 |
|
|
Audit |
13,824 |
|
|
Legal |
928 |
|
|
Miscellaneous |
2,792 |
|
|
Total expenses before reductions |
1,113,757 |
|
|
Expense reductions |
(491,015) |
622,742 |
|
Net investment income |
|
2,025,700 |
|
Realized and Unrealized Gain (Loss) Net realized gain (loss) on: |
|
|
|
Investment securities |
17,458,417 |
|
|
Foreign currency transactions |
20 |
|
|
Futures contracts |
(3,575,350) |
13,883,087 |
|
Change in net unrealized appreciation (depreciation) on: |
|
|
|
Investment securities |
(44,578,173) |
|
|
Assets and liabilities in |
2 |
|
|
Futures contracts |
(245,132) |
(44,823,303) |
|
Net gain (loss) |
|
(30,940,216) |
|
Net increase (decrease) in net assets resulting from operations |
|
$ (28,914,516) |
See accompanying notes which are an integral part of the financial statements.
Semiannual Report
Spartan Extended Market Index Portfolio
Financial Statements - continued
Statement of Changes in Net Assets
|
Increase (Decrease) in Net Assets |
Six months ended |
Year ended |
|
Operations |
$ 2,025,700 |
$ 1,972,267 |
|
Net realized gain (loss) |
13,883,087 |
10,426,981 |
|
Change in net unrealized appreciation (depreciation) |
(44,823,303) |
87,157,186 |
|
Net increase (decrease) in net assets resulting from operations |
(28,914,516) |
99,556,434 |
|
Distributions to shareholders |
(424,764) |
(1,479,202) |
|
From net realized gain |
(9,569,601) |
(4,334,759) |
|
Total distributions |
(9,994,365) |
(5,813,961) |
|
Share transactions |
230,060,648 |
351,204,809 |
|
Reinvestment of distributions |
9,544,291 |
5,500,037 |
|
Cost of shares redeemed |
(106,715,876) |
(54,328,544) |
|
Net increase (decrease) in net assets resulting from share transactions |
132,889,063 |
302,376,302 |
|
Trading fees |
223,822 |
188,143 |
|
Total increase (decrease) in net assets |
94,204,004 |
396,306,918 |
|
Net Assets |
|
|
|
Beginning of period |
458,781,616 |
62,474,698 |
|
End of period (including undistributed net investment income of $2,190,089 and $615,835, respectively) |
$ 552,985,620 |
$ 458,781,616 |
|
Other Information Shares |
|
|
|
Sold |
6,525,474 |
11,106,135 |
|
Issued in reinvestment of distributions |
268,489 |
186,148 |
|
Redeemed |
(3,204,264) |
(1,809,769) |
|
Net increase (decrease) |
3,589,699 |
9,482,514 |
Financial Highlights
|
|
Six months ended |
Years ended February 28, |
||
|
Selected Per-Share Data |
(Unaudited) |
2000 G |
1999 |
1998 E |
|
Net asset value, beginning of period |
$ 38.50 |
$ 25.67 |
$ 26.77 |
$ 25.00 |
|
Income from Investment Operations |
|
|
|
|
|
Net investment income D |
.14 |
.37 |
.32 |
.11 |
|
Net realized and unrealized gain (loss) |
(2.29) |
13.78 |
(.92) |
1.43 |
|
Total from investment operations |
(2.15) |
14.15 |
(.60) |
1.54 |
|
Less Distributions |
|
|
|
|
|
From net investment income |
(.03) |
(.24) |
(.22) |
(.07) |
|
From net realized gain |
(.68) |
(1.12) |
(.52) |
- |
|
Total distributions |
(.71) |
(1.36) |
(.74) |
(.07) |
|
Trading fees added to paid in capital |
.02 |
.04 |
.24 |
.30 |
|
Net asset value, end of period |
$ 35.66 |
$ 38.50 |
$ 25.67 |
$ 26.77 |
|
Total Return B, C |
(5.53)% |
57.35% |
(1.33)% |
7.39% |
|
Ratios and Supplemental Data |
|
|
|
|
|
Net assets, end of period (000 omitted) |
$ 552,986 |
$ 458,782 |
$ 62,475 |
$ 35,255 |
|
Ratio of expenses to average net assets |
.25% A, F |
.27% F |
.31% F |
.26% A, F |
|
Ratio of net investment income to average net assets |
.80% A |
1.24% |
1.25% |
1.44% A |
|
Portfolio turnover rate |
56% A |
33% |
29% |
40% A |
|
A Annualized B Total returns for periods of less than one year are not annualized. C The total returns would have been lower had certain expenses not been reduced during the periods shown. D Net investment income per share has been calculated based on average shares outstanding during the period. E For the period November 5, 1997 (commencement of operations) to February 28, 1998. F FMR agreed to reimburse a portion of the fund's expenses during the period. Without this reimbursement, the fund's expense ratio would have been higher. G For the year ended February 29 |
||||
See accompanying notes which are an integral part of the financial statements.
Semiannual Report
There are several ways to evaluate a fund's historical performance. You can look at the total percentage change in value, the average annual percentage change or the growth of a hypothetical $10,000 investment. Total return reflects the change in the value of an investment, assuming reinvestment of the fund's dividend income and capital gains (the profits earned upon the sale of securities that have grown in value). If Fidelity had not reimbursed certain fund expenses, the total returns would have been lower.
Cumulative Total Returns
|
Periods ended August 31, 2000 |
Past 6 |
Past 1 |
Life of |
|
Spartan International Index |
-3.99% |
9.93% |
44.12% |
|
MSCI EAFE® |
-3.50% |
9.76% |
40.30% |
|
International Funds Average |
-6.41% |
17.85% |
n/a* |
Cumulative total returns show the fund's performance in percentage terms over a set period - in this case, six months, one year or since the fund started on November 5, 1997. For example, if you had invested $1,000 in a fund that had a 5% return over the past year, the value of your investment would be $1,050. You can compare the fund's returns to the performance of the Morgan Stanley Capital International Europe, Australasia, Far East (MSCI EAFE ®) Index - a market capitalization-weighted index that is designed to represent the performance of developed stock markets outside the United States and Canada. As of August 31, 2000, the index included over 963 equity securities of companies domiciled in 20 countries. To measure how the fund's performance stacked up against its peers, you can compare it to the international funds average, which reflects the performance of mutual funds with similar objectives tracked by Lipper Inc. The past six months average represents a peer group of 709 mutual funds. These benchmarks include reinvested dividends and capital gains, if any, and exclude the effect of sales charges.
Average Annual Total Returns
|
Periods ended August 31, 2000 |
Past 1 |
Life of |
|
Spartan International Index |
9.93% |
13.83% |
|
MSCI EAFE |
9.76% |
12.75% |
|
International Funds Average |
17.85% |
n/a* |
Average annual total returns take the fund's cumulative return and show you what would have happened if the fund had performed at a constant rate each year.
* Not available
$10,000 Over Life of Fund
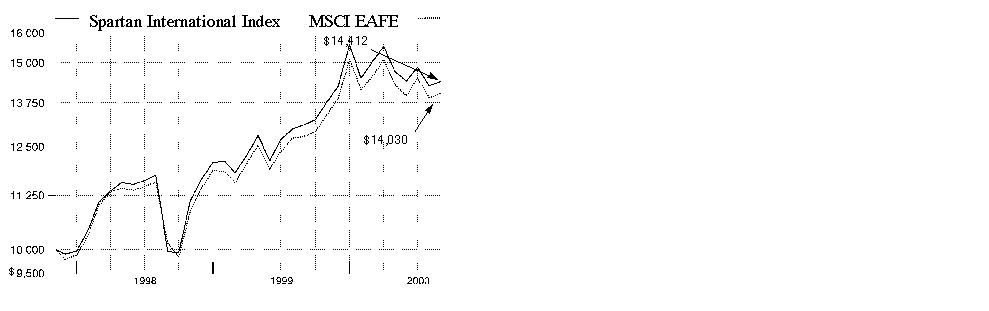
$10,000 Over Life of Fund: Let's say hypothetically that $10,000 was invested in Spartan International Index Fund on November 5, 1997, when the
fund started. As the chart shows, by August 31, 2000, the value of the investment would have been $14,412 - a 44.12% increase on the initial
investment. For comparison, look at how the MSCI EAFE Index did over the same period. With dividends and capital gains, if any, reinvested, the
same $10,000 investment would have grown to $14,030 - a 40.30% increase. How a fund did yesterday is no guarantee of how
it will do tomorrow. The stock market, for example,
has a history of long-term growth and short-term
volatility. In turn, the share price and return of a
fund that invests in stocks will vary. That means if
you sell your shares during a market downturn,
you might lose money. But if you can ride out the
market's ups and downs, you may have a gain.
Understanding Performance
Semiannual Report
(Portfolio Manager photograph)
An interview with
Dean Barr, who oversees the Spartan International
Index Fund's investment management personnel
as Managing Director for Bankers Trust, sub-adviser of the fund
Q. How did the fund perform, Dean?
A. For the six months that ended August 31, 2000, the fund returned -3.99%. In comparison, the Morgan Stanley Capital International Europe,
Australasia, Far East (MSCI EAFE) Index returned -3.50, while the international funds average tracked
by Lipper Inc. returned -6.41%. For the 12 months that ended August 31, 2000, the fund returned 9.93%, while the EAFE index
and Lipper average returned 9.76% and 17.85%, respectively.
Q. What factors drove the foreign equity markets during the six-month period?
A. A sudden loss of confidence in the valuation levels of technology stocks in the U.S. sparked a sharp sell-off that spread like wildfire, engulfing international markets during the spring. In essence, it was a reversal of fortune for the so-called TMT - or technology, media and telecommunications - stocks, which had enjoyed a leadership position for much of the prior six months. Similar to conditions in the U.S., rising interest rates remained a cloud over stock markets in the U.K. and continental Europe, as central bankers fought to tame economic growth in order to keep inflation under wraps. Continuing weakness in the euro and persistently high oil prices threatened to push wages and prices higher in Europe, prompting pre-emptive rate action. Investors proceeded with caution in this environment, seeking out safer havens elsewhere in the market - most notably within the health, finance and energy sectors. In Japan, despite an improving macroeconomic outlook and upward revisions of corporate earnings growth, many foreign investors opted out of its equity market altogether due to a lack of confidence in its economic recovery.
Q. What regions felt the brunt of the correction?
A. Telecom stocks declined sharply in Europe, with Germany, Finland and Sweden taking the brunt of the hit, followed by Italy and Spain. Shares of traditional telephone service providers, such as Deutsche Telekom, plunged in response to increased competition and growing resistance from government regulators to proposed merger activity. Other laggards in this space included France Telecom, Dutch-based KPN, British Telecom and Spain's Telefonica. Wireless stocks also stumbled, drifting lower on declining near-term growth rates in the industry. Nokia and Ericsson headed south, as did Vodafone, Sonera and Telecom Italia Mobile. Japan's Nippon Telegraph & Telephone also declined during the period. Softbank, an Internet venture-capital firm, was the top detractor within this region.
Q. What factors helped limit the fund's decline?
A. There were pockets of strength in the telecom industry, with equipment makers such as Alcatel benefiting from increased spending by traditional carriers racing to upgrade their networks. Energy stocks also performed well thanks to spiking oil prices. Historically low supply levels, teamed with increasing global demand, boosted the bottom lines and share prices of oil producers such as Royal Dutch Petroleum and BP Amoco. Investors, growing increasingly risk-averse, flocked to the perceived defensive nature of drug stocks, a group expected to perform well in the event of a rate-induced slowdown. Strong product pipelines further supported the advances of firms such as AstraZeneca, Novartis, Glaxo Wellcome and Aventis. Weakness in rate-sensitive banking issues was offset by the strong performance of investment management and insurance stocks such as HSBC and ING Groep, respectively. Overall, the U.K., Switzerland, France and the Netherlands were positive contributors to performance.
Q. What's your outlook?
A. A lot depends on the health of the U.S. stock markets and whether or not interest rates here have already peaked. I'm not sure what will happen, but I expect we'll see continued volatility and further broadening of the market as investors look to find solid ground amid a sea of mixed signals concerning the economy. Continental Europe remains the most attractive region on a global scale, as economic growth continues to expand at a feverish pace, thanks to booming domestic demand and rising exports benefiting from a weak euro. Another reason to be bullish is that earnings growth in the region has eclipsed that of the U.S. and U.K., while valuations remain below those in the U.S. Concerns about inflation temper my outlook a bit, as further rate hikes in Europe appear imminent. Investors also are on the rate watch in Japan, although no signs of inflation are evident at this time. Interest in the market is expected to remain a concern going forward, as economic recovery remains fragile, which may keep many investors on the sidelines for the time being.
The views expressed in this report reflect those of Bankers Trust only through the end of the period of the report as stated on the cover. Any such views are subject to change at any time based on market or other conditions. For more information, see page 2.
Fund Facts
Goal: seeks to provide investment results that correspond to the total return of foreign stock markets
Fund number: 399
Trading symbol: FSIIX
Start date: November 5, 1997
Size: as of August 31, 2000, more than $369 million
Sub-adviser: Bankers Trust, since inception
3Semiannual Report
Spartan International Index Fund
|
Top Ten Stocks as of August 31, 2000 |
||
|
|
% of fund's |
% of fund's net assets |
|
Vodafone Group PLC |
2.5 |
3.0 |
|
Nokia AB |
2.3 |
2.4 |
|
BP Amoco PLC |
2.0 |
1.4 |
|
Telefonaktiebolaget LM Ericsson |
1.7 |
1.9 |
|
Toyota Motor Corp. |
1.6 |
1.4 |
|
Nippon Telegraph & |
1.5 |
1.6 |
|
Royal Dutch Petroleum Co. |
1.4 |
1.1 |
|
HSBC Holdings PLC (Reg.) |
1.3 |
0.9 |
|
France Telecom SA |
1.2 |
1.5 |
|
Novartis AG (Reg.) |
1.2 |
0.9 |
|
|
16.7 |
16.1 |
|
Top Ten Market Sectors as of August 31, 2000 |
||
|
|
% of fund's |
% of fund's net assets |
|
Finance |
20.8 |
16.0 |
|
Utilities |
14.0 |
17.4 |
|
Technology |
12.4 |
13.1 |
|
Health |
7.4 |
6.0 |
|
Durables |
6.4 |
5.9 |
|
Industrial Machinery |
5.8 |
4.8 |
|
Energy |
5.6 |
4.0 |
|
Nondurables |
4.5 |
3.9 |
|
Basic Industries |
3.7 |
3.3 |
|
Retail & Wholesale |
3.2 |
3.1 |
Geographic Diversification (% of net assets)
As of August 31, 2000 
As of February 29, 2000 
Semiannual Report
Spartan International Index Fund
(Unaudited)
Showing Percentage of Net Assets
|
Common Stocks - 93.3% |
|||
|
Shares |
Value (Note 1) |
||
|
Australia - 2.3% |
|||
|
Amcor Ltd. |
27,375 |
$ 87,111 |
|
|
AMP Ltd. |
40,250 |
413,856 |
|
|
Aristocrat Leisure Ltd. |
16,796 |
60,667 |
|
|
Australian Gas Light Co. |
13,463 |
81,566 |
|
|
Boral Ltd. |
14,665 |
18,015 |
|
|
Brambles Industries Ltd. |
8,626 |
244,918 |
|
|
British American Tobacco Australasia Ltd. |
1,051 |
7,338 |
|
|
Broken Hill Proprietary Co. Ltd. |
66,569 |
728,528 |
|
|
Coca-Cola Amatil Ltd. |
46,088 |
104,776 |
|
|
Cochlear Ltd. |
2,339 |
38,796 |
|
|
Coles Myer Ltd. |
45,647 |
190,163 |
|
|
Commonwealth Bank of Australia |
47,254 |
754,792 |
|
|
Computershare Ltd. |
22,625 |
107,048 |
|
|
CSL Ltd. |
6,175 |
126,582 |
|
|
CSR Ltd. |
43,414 |
110,219 |
|
|
ERG Ltd. |
7,916 |
46,799 |
|
|
Fosters Brewing Group Ltd. |
67,680 |
160,111 |
|
|
Futuris Corp. Ltd. |
31,748 |
29,859 |
|
|
General Property Trust |
70,848 |
107,104 |
|
|
Goodman Fielder Ltd. |
21,051 |
15,013 |
|
|
Howard Smith Ltd. |
4,155 |
18,940 |
|
|
James Hardie Industries Ltd. |
9,374 |
19,829 |
|
|
Leighton Holdings Ltd. |
6,930 |
25,671 |
|
|
Lend Lease Corp. Ltd. |
19,429 |
229,267 |
|
|
M.I.M. Holdings Ltd. |
44,082 |
28,996 |
|
|
Mirvac Group |
29,000 |
60,908 |
|
|
National Australia Bank Ltd. |
54,675 |
801,306 |
|
|
Newcrest Mining Ltd. |
7,378 |
17,271 |
|
|
News Corp. Ltd. |
74,612 |
981,614 |
|
|
Normandy Mining Ltd. |
86,041 |
50,639 |
|
|
Orica Ltd. |
7,698 |
27,672 |
|
|
Pacific Dunlop Ltd. |
10,198 |
9,179 |
|
|
Paperlinx Ltd. |
4,478 |
9,302 |
|
|
QBE Insurance Group Ltd. |
17,576 |
87,723 |
|
|
Rio Tinto Ltd. |
12,144 |
187,320 |
|
|
Santos Ltd. |
18,198 |
61,426 |
|
|
Southcorp Holdings Ltd. |
28,591 |
75,358 |
|
|
Stockland Trust Group |
15,739 |
33,964 |
|
|
Suncorp-Metway Ltd. |
13,689 |
70,139 |
|
|
Tabcorp Holdings Ltd. |
14,725 |
83,689 |
|
|
Telstra Corp. Ltd. |
286,464 |
1,042,978 |
|
|
Transurban Group |
18,306 |
36,008 |
|
|
Wesfarmers Ltd. |
11,883 |
96,917 |
|
|
Westfield Trust |
2,458 |
4,630 |
|
|
Westfield Trust Unit |
71,473 |
131,143 |
|
|
Westpac Banking Corp. |
67,524 |
492,822 |
|
|
WMC Ltd. |
44,351 |
208,793 |
|
|
Woolworths Ltd. |
41,339 |
163,390 |
|
|
TOTAL AUSTRALIA |
8,490,155 |
||
|
Austria - 0.2% |
|||
|
Austria Tabak AG |
1,010 |
38,792 |
|
|
|
|||
|
Shares |
Value (Note 1) |
||
|
Bank Austria AG |
4,489 |
$ 240,383 |
|
|
Boehler-Uddeholm AG (a) |
50 |
1,594 |
|
|
BWT AG |
500 |
16,784 |
|
|
Flughafen Wien AG |
1,170 |
40,117 |
|
|
Generali Holding Vienna AG |
330 |
53,043 |
|
|
Mayr Melnhof Karton AG |
400 |
18,116 |
|
|
Oesterreichische Elektrizitaetswirtschafts AG (verbund) |
1,240 |
115,624 |
|
|
OMV AG |
1,010 |
74,903 |
|
|
RHI AG |
250 |
5,306 |
|
|
VA Technologie AG |
690 |
33,536 |
|
|
Wienerberger Baustoffind AG |
2,750 |
58,611 |
|
|
TOTAL AUSTRIA |
696,809 |
||
|
Belgium - 0.8% |
|||
|
Barco Industries NV |
359 |
45,207 |
|
|
Bekaert SA |
682 |
30,888 |
|
|
Colruyt NV |
1,698 |
66,574 |
|
|
Compagnie Maritime Belge SA (CMB) |
187 |
11,209 |
|
|
D'ieteren SA |
133 |
32,492 |
|
|
Delhaize Freres & Compagnie Le Lion |
1,926 |
107,583 |
|
|
Electrabel SA |
2,119 |
452,568 |
|
|
Fortis B |
28,264 |
858,666 |
|
|
Fortis B (strip VVRP) (a) |
1,764 |
16 |
|
|
Glaverbel SA |
149 |
10,718 |
|
|
Groupe Bruxelles Lambert SA |
964 |
250,403 |
|
|
KBC Bancassurance Holding NV |
11,518 |
526,771 |
|
|
Solvay SA |
3,341 |
217,479 |
|
|
Ucb Corp. |
5,519 |
210,161 |
|
|
Union Miniere SA |
638 |
22,572 |
|
|
TOTAL BELGIUM |
2,843,307 |
||
|
Denmark - 0.8% |
|||
|
Carlsberg AS: |
|
|
|
|
Series A |
1,400 |
46,681 |
|
|
Series B |
1,000 |
36,082 |
|
|
D/S 1912 Series B |
42 |
500,149 |
|
|
D/S Svenborg Series B |
28 |
465,138 |
|
|
Danisco AS |
2,243 |
73,186 |
|
|
Den Danske Bank Group AS |
2,100 |
262,578 |
|
|
Fls Industries (a) |
759 |
11,479 |
|
|
Group 4 Falck AS |
822 |
128,720 |
|
|
ISS AS (a) |
1,573 |
106,771 |
|
|
Navision Software (a) |
811 |
28,393 |
|
|
NKT Holding AS |
300 |
75,022 |
|
|
Novo-Nordisk AS (B Shares) (a) |
2,751 |
558,554 |
|
|
Tele Danmark AS (B Shares) |
8,397 |
504,970 |
|
|
Topdanmark AS (a) |
523 |
9,840 |
|
|
Vestas Wind Systems AS |
4,053 |
180,026 |
|
|
William Demant Holding AS |
3,054 |
140,017 |
|
|
TOTAL DENMARK |
3,127,606 |
||
|
Finland - 2.8% |
|||
|
Amer Group PLC Class A |
700 |
15,945 |
|
|
Common Stocks - continued |
|||
|
Shares |
Value (Note 1) |
||
|
Finland - continued |
|||
|
Hartwall Oyj Abp Series A |
3,000 |
$ 53,283 |
|
|
Instrumentarium Oyj (a) |
819 |
19,601 |
|
|
Kemira Oyj |
500 |
2,660 |
|
|
Kesko Oyj (a) |
3,900 |
35,673 |
|
|
Kone Corp. |
900 |
58,505 |
|
|
Metra Oyj Series B |
2,100 |
39,163 |
|
|
Metso Oyj |
6,200 |
74,880 |
|
|
Nokia AB |
187,200 |
8,412,299 |
|
|
Outokumpu Oyj (A Shares) |
5,200 |
51,720 |
|
|
Pohjola Group Insurance Corp.: |
|
|
|
|
Class A |
700 |
26,419 |
|
|
Class B |
1,100 |
41,565 |
|
|
Raisio Group PLC |
2,900 |
4,687 |
|
|
Rautaruukki Oyj (K Shares) |
4,100 |
16,749 |
|
|
Sampo Insurance Co. Ltd. |
2,400 |
97,508 |
|
|
Sonera Corp. |
28,800 |
961,652 |
|
|
Stockmann Oyj Series A |
300 |
4,529 |
|
|
TietoEnator Oyj |
3,100 |
100,896 |
|
|
UPM-Kymmene Corp. |
10,400 |
262,756 |
|
|
TOTAL FINLAND |
10,280,490 |
||
|
France - 10.1% |
|||
|
Accor SA |
7,372 |
317,515 |
|
|
Alcatel SA (RFD) (a) |
41,464 |
3,436,329 |
|
|
Aventis SA |
28,759 |
2,149,735 |
|
|
AXA SA de CV |
14,432 |
2,054,459 |
|
|
BIC Ste |
1,544 |
72,739 |
|
|
BNP Paribas SA |
16,383 |
1,505,814 |
|
|
Bouygues SA |
12,178 |
765,138 |
|
|
Canal Plus SA |
4,659 |
760,872 |
|
|
Cap Gemini SA |
4,521 |
943,495 |
|
|
Carrefour SA (a) |
25,074 |
1,828,118 |
|
|
Casino Guichard Perrachon |
3,285 |
328,190 |
|
|
Club Mediterranee SA |
520 |
67,836 |
|
|
Coflexip SA |
567 |
68,983 |
|
|
Compagnie de St. Gobain |
3,200 |
425,696 |
|
|
Dassault Systemes SA |
4,050 |
348,151 |
|
|
Eridania Beghin Say Group (a) |
689 |
61,187 |
|
|
Essilor International SA |
200 |
55,414 |
|
|
Eurafrance (Societe) |
159 |
81,896 |
|
|
France Telecom SA |
37,548 |
4,284,768 |
|
|
Gecina SA |
868 |
79,704 |
|
|
Groupe Danone (a) |
5,562 |
759,670 |
|
|
Groupe GTM |
327 |
38,884 |
|
|
Imerys |
591 |
68,229 |
|
|
L'Air Liquide (a) |
3,490 |
444,749 |
|
|
L'Oreal SA (a) |
24,937 |
1,802,628 |
|
|
Lafarge SA |
4,060 |
300,697 |
|
|
Lagardere S.C.A. (Reg.) |
5,128 |
365,452 |
|
|
Louis Vuitton Moet Hennessy (LVMH) |
18,105 |
1,405,230 |
|
|
Michelin SA (Compagnie Generale des Etablissements) Series B |
5,226 |
153,151 |
|
|
|
|||
|
Shares |
Value (Note 1) |
||
|
Pechiney SA Series A |
3,167 |
$ 144,841 |
|
|
Pernod-Ricard |
1,910 |
100,244 |
|
|
Peugeot SA |
1,704 |
314,602 |
|
|
Pinault Printemps SA |
4,439 |
839,263 |
|
|
Promodes (a) |
113 |
88,408 |
|
|
Publicis SA |
287 |
112,398 |
|
|
Sagem SA |
1,414 |
389,393 |
|
|
Sanofi-Synthelabo SA |
27,067 |
1,319,623 |
|
|
Schneider SA (a) |
5,934 |
437,384 |
|
|
SEB SA |
324 |
18,041 |
|
|
Sidel SA |
1,334 |
90,863 |
|
|
Simco SA (Reg.) |
124 |
8,419 |
|
|
Societe Generale Class A (a) |
15,334 |
908,278 |
|
|
Sodexho Alliance SA |
1,124 |
176,077 |
|
|
Suez Lyonnaise des Eaux: |
|
|
|
|
(Belgium) |
998 |
147,387 |
|
|
(France) |
6,362 |
942,947 |
|
|
Technip SA |
390 |
50,600 |
|
|
Thomson CSF |
6,355 |
262,990 |
|
|
TotalFinaElf SA (a) |
774 |
7 |
|
|
TotalFinaElf SA Class B |
27,224 |
4,056,376 |
|
|
Unibail |
596 |
90,507 |
|
|
Usinor |
7,871 |
84,228 |
|
|
Valeo SA |
3,003 |
161,076 |
|
|
Vivendi SA |
22,264 |
1,818,982 |
|
|
Zodiac SA |
67 |
14,399 |
|
|
TOTAL FRANCE |
37,552,062 |
||
|
Germany - 7.5% |
|||
|
Adidas-Salomon AG |
1,550 |
83,442 |
|
|
Allianz AG (Reg.) (a) |
8,873 |
2,990,334 |
|
|
BASF AG |
22,050 |
817,919 |
|
|
Bayer AG |
26,700 |
1,126,269 |
|
|
Bayerische Hypo-und Vereinsbank AG |
15,425 |
898,600 |
|
|
Beiersdorf AG |
3,100 |
278,048 |
|
|
Bilfinger & Berger Bau AG |
800 |
10,053 |
|
|
Buderus AG |
3,250 |
53,250 |
|
|
Continental Gummi-Werke AG |
5,300 |
96,298 |
|
|
DaimlerChrysler AG (Reg.) |
36,492 |
1,899,865 |
|
|
Deutsche Bank AG |
22,261 |
1,937,350 |
|
|
Deutsche Lufthansa AG (Reg.) |
14,050 |
310,929 |
|
|
Deutsche Telekom AG |
109,856 |
4,219,367 |
|
|
Douglas Holding AG |
1,100 |
35,655 |
|
|
Dresdner Bank AG (a) |
18,550 |
830,915 |
|
|
E.On AG |
27,430 |
1,314,423 |
|
|
EM.TV & Merchandising AG |
4,500 |
223,789 |
|
|
Fresenius Medical Care AG |
3,250 |
281,401 |
|
|
Gehe AG |
1,700 |
61,323 |
|
|
Heidelberger Zement AG: |
|
|
|
|
(strip VVRP) (a) |
230 |
2 |
|
|
(Brussels) |
230 |
12,664 |
|
|
(Frankfurt) |
2,215 |
119,989 |
|
|
Hochtief AG |
2,550 |
63,814 |
|
|
Kamps AG (a) |
3,000 |
64,765 |
|
|
Common Stocks - continued |
|||
|
Shares |
Value (Note 1) |
||
|
Germany - continued |
|||
|
Karstadt Quelle AG |
4,700 |
$ 143,789 |
|
|
Linde AG |
4,483 |
188,705 |
|
|
MAN AG |
4,400 |
122,615 |
|
|
Merck Kgaa |
6,450 |
207,408 |
|
|
Metro AG |
11,280 |
429,638 |
|
|
Muenchener Ruckversicherungs-Gesellschaft AG (Reg.) |
6,382 |
1,750,645 |
|
|
Preussag AG |
6,193 |
208,438 |
|
|
Rheinmetal AG |
650 |
7,568 |
|
|
RWE AG |
17,450 |
649,302 |
|
|
SAP AG (a) |
6,700 |
1,308,986 |
|
|
Schering AG (a) |
7,550 |
402,018 |
|
|
SGL Carbon AG (a) |
650 |
44,736 |
|
|
Siemens AG |
21,550 |
3,454,315 |
|
|
Thyssen Krupp AG |
18,950 |
287,768 |
|
|
Volkswagen AG |
11,550 |
505,054 |
|
|
WCM Beteiligungs-und Grundbesitz AG |
6,500 |
160,471 |
|
|
TOTAL GERMANY |
27,601,920 |
||
|
Hong Kong - 1.9% |
|||
|
ASM Pacific Technology Ltd. |
13,000 |
41,337 |
|
|
Bank of East Asia Ltd. |
43,668 |
101,902 |
|
|
Cathay Pacific Airways Ltd. |
107,000 |
207,847 |
|
|
CLP Holdings Ltd. |
70,500 |
316,377 |
|
|
Esprit Holdings Ltd. |
22,000 |
17,207 |
|
|
Giordano International Ltd. |
48,662 |
26,517 |
|
|
Hang Lung Development Co. Ltd. |
21,000 |
19,521 |
|
|
Hang Seng Bank Ltd. |
63,500 |
681,876 |
|
|
Henderson Land Development Co. Ltd. |
47,000 |
260,935 |
|
|
Hong Kong & China Gas Co. Ltd. |
165,630 |
205,996 |
|
|
Hong Kong & Shanghai Hotels Ltd. (The) |
18,000 |
11,309 |
|
|
Hopewell Holdings Ltd. |
2,200 |
1,030 |
|
|
Hutchison Whampoa Ltd. |
140,200 |
1,977,370 |
|
|
Hysan Development Ltd. |
35,038 |
49,193 |
|
|
Johnson Electric Holdings Ltd. |
124,000 |
259,948 |
|
|
Li & Fung Ltd. |
44,000 |
191,813 |
|
|
New World Development Co. Ltd. |
66,868 |
109,314 |
|
|
Pacific Century Cyberworks Ltd. |
484,162 |
900,131 |
|
|
QPL International Holdings Ltd. (a) |
8,000 |
7,437 |
|
|
Shangri-La Asia Ltd. |
72,000 |
72,930 |
|
|
Sino Land Co. |
125,320 |
67,085 |
|
|
South China Morning Post (Holdings) Ltd. |
58,000 |
43,504 |
|
|
Sun Hung Kai Properties Ltd. |
80,215 |
763,659 |
|
|
Swire Pacific Ltd. Class A |
52,000 |
356,701 |
|
|
Television Broadcasts Ltd. |
15,000 |
84,816 |
|
|
Varitronix International Ltd. |
5,000 |
10,418 |
|
|
Wharf Holdings Ltd. |
73,228 |
174,168 |
|
|
TOTAL HONG KONG |
6,960,341 |
||
|
Ireland - 0.3% |
|||
|
Allied Irish Banks PLC |
34,653 |
286,502 |
|
|
|
|||
|
Shares |
Value (Note 1) |
||
|
CRH PLC |
15,710 |
$ 262,563 |
|
|
DCC PLC |
2,175 |
20,860 |
|
|
eircom PLC |
89,624 |
188,630 |
|
|
Fyffes PLC |
8,415 |
7,249 |
|
|
Greencore Group PLC |
2,355 |
6,170 |
|
|
Independent Newspapers PLC |
16,856 |
58,379 |
|
|
Irish Life & Permanent PLC |
12,859 |
110,769 |
|
|
Jefferson Smurfit Group PLC |
46,861 |
90,720 |
|
|
Jurys Doyle Hotel Group PLC |
701 |
4,980 |
|
|
Kerry Group PLC Class A |
6,841 |
91,431 |
|
|
Ryanair Holdings PLC (a) |
15,430 |
113,732 |
|
|
Waterford Wedgwood PLC unit |
17,715 |
20,294 |
|
|
TOTAL IRELAND |
1,262,279 |
||
|
Italy - 3.4% |
|||
|
Alitalia Linee Aeree Ital Class A |
51,102 |
94,574 |
|
|
Assicurazioni Generali Spa |
40,419 |
1,239,064 |
|
|
Autogrill Spa |
8,499 |
95,318 |
|
|
Banca di Roma Spa |
179,030 |
221,788 |
|
|
Banca Intesa Spa |
153,665 |
655,019 |
|
|
Banca Popolare di Milano |
9,382 |
65,937 |
|
|
Benetton Group Spa (a) |
64,554 |
119,699 |
|
|
Bulgari Spa |
9,562 |
106,857 |
|
|
Cementir Spa |
7,847 |
11,965 |
|
|
Enel Spa |
235,592 |
936,667 |
|
|
Eni Spa |
256,733 |
1,489,698 |
|
|
Fiat Spa |
11,973 |
295,693 |
|
|
Italcementi Spa |
6,552 |
61,088 |
|
|
Italgas Spa |
20,740 |
94,835 |
|
|
La Rinascente Spa |
9,627 |
57,938 |
|
|
Marzotto Spa |
1,225 |
10,591 |
|
|
Mediaset Spa |
38,439 |
684,763 |
|
|
Mediobanca Spa |
19,716 |
211,944 |
|
|
Mondadori Spa |
7,787 |
106,149 |
|
|
Olivetti Spa |
155,122 |
486,279 |
|
|
Parmalat Finanziaria Spa |
47,331 |
64,393 |
|
|
Pirelli Spa |
64,676 |
174,547 |
|
|
Riunione Adriatica di Sicurta (RAS) Spa |
24,021 |
279,981 |
|
|
San Paolo IMI Spa |
45,576 |
804,173 |
|
|
Sirti Spa |
8,823 |
12,866 |
|
|
Snia Spa |
22,392 |
24,936 |
|
|
Societa Assicuratrice Industriale (SAI) |
903 |
15,704 |
|
|
Telecom Italia Mobile Spa (a) |
213,391 |
1,838,547 |
|
|
Telecom Italia Spa |
118,819 |
1,476,326 |
|
|
Unicredito Italiano Spa |
162,908 |
839,233 |
|
|
TOTAL ITALY |
12,576,572 |
||
|
Japan - 24.6% |
|||
|
77 Bank Ltd. |
15,000 |
116,715 |
|
|
Acom Co. Ltd. |
5,400 |
460,167 |
|
|
Advantest Corp. |
3,700 |
754,430 |
|
|
Ajinomoto Co., Inc. |
24,000 |
260,092 |
|
|
Alps Electric Co. Ltd. |
7,000 |
147,652 |
|
|
Amada Co. Ltd. |
13,000 |
111,512 |
|
|
Common Stocks - continued |
|||
|
Shares |
Value (Note 1) |
||
|
Japan - continued |
|||
|
Amano Corp. |
2,000 |
$ 20,718 |
|
|
Aoyama Trading Co. Ltd. |
3,100 |
41,151 |
|
|
Asahi Bank Ltd. |
105,000 |
413,425 |
|
|
Asahi Breweries Ltd. |
18,000 |
164,526 |
|
|
Asahi Chemical Industry Co. Ltd. (a) |
54,000 |
337,658 |
|
|
Asahi Glass Co. Ltd. |
44,000 |
411,250 |
|
|
Asatsu-DK, Inc. |
2,000 |
74,810 |
|
|
Autobacs Seven Co. Ltd. |
2,000 |
57,561 |
|
|
Bank of Fukuoka Ltd. |
25,000 |
159,136 |
|
|
Bank of Tokyo-Mitsubishi Ltd. |
170,000 |
2,082,500 |
|
|
Bank of Yokohama Ltd. |
44,000 |
193,456 |
|
|
Benesse Corp. |
4,000 |
238,118 |
|
|
Bridgestone Corp. |
32,000 |
413,987 |
|
|
Canon, Inc. |
32,000 |
1,448,000 |
|
|
Casio Computer Co. Ltd. |
10,000 |
116,434 |
|
|
Central Japan Railway Co. |
83 |
480,866 |
|
|
Chugai Pharmaceutical Co. Ltd. |
10,000 |
178,119 |
|
|
Chuo Mitsui Trust & Banking Co. Ltd. |
33,000 |
126,840 |
|
|
Citizen Watch Co. Ltd. |
12,000 |
130,946 |
|
|
Cosmo Oil Co. Ltd. |
14,000 |
28,218 |
|
|
Credit Saison Co. Ltd. |
6,300 |
152,081 |
|
|
CSK Corp. |
2,900 |
78,298 |
|
|
Dai Ei, Inc. |
27,000 |
77,454 |
|
|
Dai Nippon Printing Co. Ltd. |
28,000 |
440,724 |
|
|
Daicel Chemical Industries Ltd. |
17,000 |
47,970 |
|
|
Daifuku Co. Ltd. |
5,000 |
53,998 |
|
|
Daiichi Pharmaceutical Co. Ltd. |
10,000 |
236,243 |
|
|
Daikin Industries Ltd. |
10,000 |
201,087 |
|
|
Dainippon Ink & Chemicals, Inc. |
30,000 |
105,465 |
|
|
Daito Trust Construction Co. |
5,000 |
83,904 |
|
|
Daiwa Bank Ltd. |
74,000 |
185,919 |
|
|
Daiwa House Industry Co. Ltd. |
20,000 |
131,246 |
|
|
Daiwa Securities Group, Inc. |
49,000 |
610,950 |
|
|
Denki Kagaku Kogyo Kabushiki Kaisha |
19,000 |
76,591 |
|
|
Denso Corp. |
34,000 |
806,412 |
|
|
East Japan Railway Co. |
147 |
799,288 |
|
|
Ebara Corp. |
11,000 |
160,870 |
|
|
Eisai Co. Ltd. |
11,000 |
332,052 |
|
|
Fanuc Ltd. |
8,800 |
956,970 |
|
|
Fuji Bank Ltd. |
126,000 |
957,964 |
|
|
Fuji Machine Manufacturing Co. Ltd. |
2,000 |
93,185 |
|
|
Fuji Photo Film Co. Ltd. |
19,000 |
680,416 |
|
|
Fuji Soft ABC, Inc. |
1,300 |
99,569 |
|
|
Fuji Television Network, Inc. |
15 |
209,525 |
|
|
Fujikura Ltd. |
15,000 |
129,371 |
|
|
Fujitsu Ltd. |
72,000 |
2,085,685 |
|
|
Furukawa Electric Co. Ltd. |
24,000 |
771,726 |
|
|
Gunma Bank Ltd. |
15,000 |
77,341 |
|
|
Hankyu Department Stores, Inc. |
7,000 |
36,749 |
|
|
Hirose Electric Co. Ltd. (a) |
1,500 |
217,399 |
|
|
Hitachi Ltd. |
122,000 |
1,469,338 |
|
|
Hitachi Zosen Corp. (a) |
44,000 |
38,774 |
|
|
|
|||
|
Shares |
Value (Note 1) |
||
|
Honda Motor Co. Ltd. (a) |
35,000 |
$ 1,268,750 |
|
|
House Foods Corp. |
5,000 |
68,904 |
|
|
Hoya Corp. |
4,000 |
382,488 |
|
|
Inax Corp. |
8,000 |
43,274 |
|
|
Industrial Bank of Japan Ltd. (IBJ) (a) |
97,000 |
735,661 |
|
|
Isetan Co. Ltd. |
9,000 |
81,082 |
|
|
Ishikawajima-Harima Heavy Industries Co. Ltd. (a) |
53,000 |
77,510 |
|
|
Ito-Yokado Co. Ltd. |
15,000 |
745,289 |
|
|
Itochu Corp. |
51,000 |
224,712 |
|
|
Japan Airlines Co. Ltd. |
67,000 |
240,564 |
|
|
Japan Energy Corp. |
35,000 |
37,733 |
|
|
Japan Tobacco, Inc. |
74 |
567,470 |
|
|
JGC Corp. |
6,000 |
28,687 |
|
|
Joyo Bank Ltd. |
34,000 |
122,715 |
|
|
Jusco Co. Ltd. |
12,000 |
225,555 |
|
|
Kadokawa Shoten Publishing Co. Ltd. |
300 |
26,915 |
|
|
Kajima Corp. (a) |
37,000 |
109,956 |
|
|
Kaneka Corp. |
13,000 |
143,321 |
|
|
Kansai Electric Power Co., Inc. |
36,000 |
590,607 |
|
|
Kao Corp. |
23,000 |
631,761 |
|
|
Katokichi Co. Ltd. |
1,000 |
24,843 |
|
|
Kawasaki Heavy Industries Ltd. (a) |
50,000 |
57,654 |
|
|
Kawasaki Kisen Kaisha Ltd. |
11,000 |
20,418 |
|
|
Kawasaki Steel Corp. |
118,000 |
149,339 |
|
|
Keihin Electric Express Railway Co. Ltd. |
18,000 |
67,498 |
|
|
Kikkoman Corp. |
8,000 |
58,948 |
|
|
Kinden Corp. |
11,000 |
70,638 |
|
|
Kinki Nippon Railway Co. Ltd. |
61,000 |
268,201 |
|
|
Kirin Brewery Co. Ltd. |
37,000 |
405,831 |
|
|
Kokuyo Co. Ltd. |
5,000 |
86,294 |
|
|
Komatsu Ltd. |
37,000 |
238,989 |
|
|
Komori Corp. |
3,000 |
41,314 |
|
|
Konami Co. Ltd. |
4,300 |
355,545 |
|
|
Konica Corp. (a) |
14,000 |
111,559 |
|
|
Koyo Seiko Co. Ltd. |
7,000 |
53,680 |
|
|
Kubota Corp. |
52,000 |
167,695 |
|
|
Kuraray Co. Ltd. |
15,000 |
130,918 |
|
|
Kurita Water Industries Ltd. |
5,000 |
104,059 |
|
|
Kyocera Corp. |
7,000 |
1,273,125 |
|
|
Kyowa Exeo Corp. |
4,000 |
44,999 |
|
|
Kyowa Hakko Kogyo Co. Ltd. |
15,000 |
123,184 |
|
|
Makino Milling Machine Co. Ltd. |
4,000 |
33,936 |
|
|
Makita Corp. |
1,000 |
8,062 |
|
|
Marubeni Corp. (a) |
48,000 |
132,746 |
|
|
Marui Co. Ltd. |
14,000 |
220,624 |
|
|
Matsushita Electric Industrial Co. Ltd. |
76,000 |
2,080,435 |
|
|
Meiji Milk Products Co. Ltd. |
10,000 |
43,967 |
|
|
Meiji Seika Kaisha Ltd. (a) |
15,000 |
86,060 |
|
|
Meitec Corp. |
2,000 |
92,435 |
|
|
Minebea Co. Ltd. |
15,000 |
194,056 |
|
|
Mitsubishi Chemical Corp. |
81,000 |
266,532 |
|
|
Mitsubishi Corp. |
58,000 |
424,112 |
|
|
Mitsubishi Electric Corp. |
79,000 |
736,899 |
|
|
Common Stocks - continued |
|||
|
Shares |
Value (Note 1) |
||
|
Japan - continued |
|||
|
Mitsubishi Estate Co. Ltd. (a) |
48,000 |
$ 472,485 |
|
|
Mitsubishi Gas Chemical Co., Inc. |
21,000 |
63,982 |
|
|
Mitsubishi Heavy Industries Ltd. |
125,000 |
439,439 |
|
|
Mitsubishi Logistics Corp. |
1,000 |
7,894 |
|
|
Mitsubishi Materials Corp. |
41,000 |
128,762 |
|
|
Mitsubishi Rayon Co. Ltd. |
26,000 |
68,492 |
|
|
Mitsubishi Trust & Banking Corp. |
49,000 |
376,676 |
|
|
Mitsui & Co. Ltd. |
59,000 |
396,578 |
|
|
Mitsui Fudosan Co. Ltd. |
29,000 |
314,006 |
|
|
Mitsui Marine & Fire Insurance Co. Ltd. |
29,000 |
144,361 |
|
|
Mitsui Mining & Smelting Co. Ltd. |
21,000 |
166,354 |
|
|
Mitsukoshi Ltd. |
19,000 |
65,370 |
|
|
Mori Seiki Co. Ltd. |
4,000 |
53,248 |
|
|
Murata Manufacturing Co. Ltd. |
8,800 |
1,347,183 |
|
|
Mycal Corp. |
3,000 |
8,718 |
|
|
Namco Ltd. |
2,200 |
61,461 |
|
|
NEC Corp. |
60,000 |
1,715,571 |
|
|
NGK Insulators Ltd. |
13,000 |
178,541 |
|
|
NGK Spark Plug Co. Ltd. |
9,000 |
162,754 |
|
|
Nichiei Co. Ltd. |
1,700 |
19,921 |
|
|
Nidec Corp. |
2,300 |
202,250 |
|
|
Nikon Corp. |
14,000 |
429,174 |
|
|
Nintendo Co. Ltd. |
5,200 |
898,922 |
|
|
Nippon Computer Systems Corp. |
5,000 |
93,513 |
|
|
Nippon Express Co. Ltd. |
39,000 |
219,003 |
|
|
Nippon Meat Packers, Inc. |
9,000 |
114,578 |
|
|
Nippon Mitsubishi Oil Corp. |
53,000 |
301,097 |
|
|
Nippon Paper Industries Co. Ltd. |
36,000 |
236,580 |
|
|
Nippon Sheet Glass Co. Ltd. |
16,000 |
290,691 |
|
|
Nippon Shokubai Co. Ltd. |
3,000 |
15,159 |
|
|
Nippon Steel Corp. |
251,000 |
470,610 |
|
|
Nippon Telegraph & Telephone Corp. |
460 |
5,476,704 |
|
|
Nippon Yusen Kabushiki Kaisha (a) |
44,000 |
194,694 |
|
|
Nishimatsu Construction |
12,000 |
38,924 |
|
|
Nissan Motor Co. Ltd. (a) |
146,000 |
733,627 |
|
|
Nisshin Flour Milling Co. Ltd. |
9,000 |
85,216 |
|
|
Nisshinbo Industries, Inc. |
10,000 |
46,499 |
|
|
Nissin Food Products Co. Ltd. |
5,000 |
130,308 |
|
|
Nitto Denko Corp. |
6,000 |
242,992 |
|
|
Nomura Securities Co. Ltd. |
72,000 |
1,684,072 |
|
|
NSK Ltd. |
21,000 |
161,236 |
|
|
NTN Corp. |
9,000 |
37,968 |
|
|
Obayashi Corp. |
28,000 |
111,822 |
|
|
Oji Paper Co. Ltd. |
39,000 |
259,220 |
|
|
Okumura Corp. |
12,000 |
39,936 |
|
|
Olympus Optical Co. Ltd. |
10,000 |
175,307 |
|
|
Omron Corp. |
10,000 |
248,430 |
|
|
Onward Kashiyama Co. Ltd. |
7,000 |
68,707 |
|
|
Orient Corp. |
9,000 |
36,618 |
|
|
Oriental Land Co. Ltd. |
3,800 |
349,827 |
|
|
ORIX Corp. |
3,000 |
399,363 |
|
|
Osaka Gas Co. Ltd. |
93,000 |
233,655 |
|
|
|
|||
|
Shares |
Value (Note 1) |
||
|
Pioneer Corp. |
6,000 |
$ 253,117 |
|
|
Promise Co. Ltd. |
4,900 |
341,305 |
|
|
Rohm Co. Ltd. |
4,400 |
1,251,898 |
|
|
Sakura Bank Ltd. |
151,000 |
1,123,971 |
|
|
Sankyo Co. Ltd. |
17,000 |
393,644 |
|
|
Sanrio Co. Ltd. |
3,000 |
69,888 |
|
|
Sanwa Shutter Corp. |
1,000 |
3,056 |
|
|
Sanyo Electric Co. Ltd. |
69,000 |
585,404 |
|
|
Sapporo Breweries Ltd. |
1,000 |
3,366 |
|
|
Secom Co. Ltd. |
9,000 |
655,573 |
|
|
Sega Enterprises (a) |
4,700 |
53,975 |
|
|
Seiyu Ltd. (a) |
13,000 |
51,308 |
|
|
Sekisui Chemical Co. Ltd. |
20,000 |
69,935 |
|
|
Sekisui House Ltd. |
26,000 |
263,729 |
|
|
Sharp Corp. |
42,000 |
668,960 |
|
|
Shimamura Co. Ltd. |
1,400 |
107,359 |
|
|
SHIMANO, INC. |
5,000 |
103,356 |
|
|
Shimizu Construction Co. Ltd. |
31,000 |
91,544 |
|
|
Shin-Etsu Chemical Co. Ltd. |
16,000 |
785,975 |
|
|
Shionogi & Co. Ltd. |
13,000 |
229,118 |
|
|
Shiseido Co. Ltd. |
16,000 |
188,994 |
|
|
Shizuoka Bank Ltd. |
29,000 |
241,417 |
|
|
Showa Denko KK (a) |
39,000 |
54,842 |
|
|
Showa Shell Sekiyu K.K. Co. |
16,000 |
78,898 |
|
|
Skylark Co. Ltd. |
4,000 |
146,245 |
|
|
SMC Corp. |
2,600 |
460,673 |
|
|
Snow Brand Milk Products Co. Ltd. (a) |
12,000 |
45,449 |
|
|
Softbank Corp. |
12,100 |
1,598,284 |
|
|
Sony Corp. |
33,200 |
3,793,100 |
|
|
Sumitomo Bank Ltd. |
115,000 |
1,423,081 |
|
|
Sumitomo Chemical Co. Ltd. |
61,000 |
283,641 |
|
|
Sumitomo Corp. |
39,000 |
340,021 |
|
|
Sumitomo Electric Industries Ltd. |
28,000 |
517,109 |
|
|
Sumitomo Forestry Co. Ltd. |
8,000 |
59,698 |
|
|
Sumitomo Heavy Industries Ltd. |
25,000 |
61,873 |
|
|
Sumitomo Marine and Fire |
24,000 |
144,220 |
|
|
Sumitomo Metal Industries Ltd. |
132,000 |
79,198 |
|
|
Sumitomo Metal Mining Co. Ltd. |
23,000 |
126,137 |
|
|
Sumitomo Osaka Cement Co. Ltd. |
17,000 |
82,872 |
|
|
Taiheiyo Cement Corp. |
38,000 |
61,273 |
|
|
Taisei Corp. |
41,000 |
59,961 |
|
|
Taisho Pharmaceutical Co. Ltd. |
13,000 |
393,644 |
|
|
Taiyo Yuden Co. Ltd. |
4,000 |
230,618 |
|
|
Takara Shuzo Co. Ltd. |
8,000 |
174,745 |
|
|
Takashimaya Co. Ltd. |
13,000 |
88,966 |
|
|
Takeda Chemical Industries Ltd. |
33,000 |
1,952,095 |
|
|
Takefuji Corp. |
5,400 |
531,040 |
|
|
Teijin Ltd. |
33,000 |
122,509 |
|
|
Teikoku Oil Co. Ltd. |
12,000 |
42,636 |
|
|
Terumo Corp. |
8,000 |
221,243 |
|
|
Tobu Railway Co. Ltd. |
33,000 |
98,378 |
|
|
Toda Corp. |
13,000 |
54,842 |
|
|
Toei Co. Ltd. |
4,000 |
33,336 |
|
|
Common Stocks - continued |
|||
|
Shares |
Value (Note 1) |
||
|
Japan - continued |
|||
|
Toho Co. Ltd. |
700 |
$ 111,887 |
|
|
Tohoku Electric Power Co., Inc. |
18,900 |
270,203 |
|
|
Tokai Bank Ltd. |
84,000 |
425,237 |
|
|
Tokio Marine & Fire Insurance Co. Ltd. |
57,000 |
578,710 |
|
|
Tokyo Broadcasting System, Inc. |
3,000 |
107,434 |
|
|
Tokyo Dome Corp. |
1,000 |
4,828 |
|
|
Tokyo Electric Power Co. |
49,400 |
1,104,519 |
|
|
Tokyo Electron Ltd. |
6,400 |
898,772 |
|
|
Tokyo Gas Co. Ltd. |
94,000 |
241,455 |
|
|
Tokyo Style Co. Ltd. |
3,000 |
26,746 |
|
|
Tokyu Corp. |
40,000 |
208,868 |
|
|
Toppan Printing Co. Ltd. |
26,000 |
253,980 |
|
|
Toray Industries, Inc. |
51,000 |
186,463 |
|
|
Toshiba Corp. |
118,000 |
1,160,420 |
|
|
Tosoh Corp. |
23,000 |
84,091 |
|
|
Tostem Corp. |
8,000 |
116,171 |
|
|
Toto Ltd. |
14,000 |
109,459 |
|
|
Toyo Information System Co. Ltd. |
2,000 |
120,559 |
|
|
Toyo Seikan Kaisha Ltd. |
9,000 |
154,401 |
|
|
Toyobo Co. Ltd. |
29,000 |
53,014 |
|
|
Toyota Motor Corp. |
136,700 |
5,946,264 |
|
|
Trans Cosmos, Inc. |
900 |
127,487 |
|
|
Tsubakimoto Chain Co. |
8,000 |
32,249 |
|
|
Ube Industries Ltd. |
19,000 |
45,777 |
|
|
Uni-Charm Corp |
2,700 |
140,480 |
|
|
Uny Co. Ltd. |
7,000 |
74,613 |
|
|
Wacoal Corp. (a) |
6,000 |
50,680 |
|
|
World Co. Ltd. |
2,000 |
60,936 |
|
|
Yakult Honsha Co. Ltd. |
7,000 |
70,873 |
|
|
Yamaha Corp. |
9,000 |
79,057 |
|
|
Yamaichi Securities Co. Ltd. (a) |
3,000 |
0 |
|
|
Yamanouchi Pharmaceutical Co. Ltd. |
13,000 |
643,480 |
|
|
Yamato Transport Co. Ltd. |
17,000 |
370,535 |
|
|
Yamazaki Baking Co. |
9,000 |
72,898 |
|
|
Yokogawa Electric Corp. |
4,000 |
41,286 |
|
|
TOTAL JAPAN |
90,990,249 |
||
|
Netherlands - 5.9% |
|||
|
ABN AMRO Holding NV |
58,363 |
1,451,219 |
|
|
Aegon NV |
52,677 |
2,053,634 |
|
|
Akzo Nobel NV (a) |
11,219 |
496,259 |
|
|
ASM Lithography Holding NV (a) |
16,692 |
630,436 |
|
|
Buhrmann NV |
3,225 |
91,504 |
|
|
Elsevier NV |
25,531 |
308,804 |
|
|
Getronics NV (a) |
13,368 |
167,625 |
|
|
Hagemeyer NV |
4,310 |
123,360 |
|
|
Heineken NV |
12,510 |
635,464 |
|
|
IHC Caland NV |
1,044 |
54,237 |
|
|
ING Groep NV (Certificaten |
37,846 |
2,534,129 |
|
|
KLM Royal Dutch Airlines NV |
1,179 |
29,473 |
|
|
Koninklijke Ahold NV |
28,202 |
796,925 |
|
|
Koninklijke KPN NV |
37,593 |
1,001,868 |
|
|
|
|||
|
Shares |
Value (Note 1) |
||
|
Koninklijke Nedlloyd NV (a) |
600 |
$ 11,221 |
|
|
Koninklijke Philips Electronics NV |
50,275 |
2,446,640 |
|
|
Oce NV |
1,968 |
29,274 |
|
|
Royal Dutch Petroleum Co. |
83,680 |
5,120,170 |
|
|
STMicroelectronics NV |
32,578 |
1,996,232 |
|
|
Stork NV |
86 |
932 |
|
|
TNT Post Group NV |
18,688 |
436,638 |
|
|
Unilever NV (Certificaten |
22,564 |
1,068,023 |
|
|
Vedior NV |
2,532 |
33,166 |
|
|
Vopak NV |
1,350 |
28,533 |
|
|
Wolters Kluwer NV (Certificaten |
9,881 |
200,066 |
|
|
TOTAL NETHERLANDS |
21,745,832 |
||
|
New Zealand - 0.1% |
|||
|
Auckland International Airport Ltd. |
13,915 |
17,606 |
|
|
Brierley Investments Ltd. |
65,616 |
12,060 |
|
|
Carter Holt Harvey Ltd. |
70,392 |
55,364 |
|
|
Contact Energy Ltd. |
25,284 |
27,884 |
|
|
Fisher & Paykel Industries Ltd. |
4,114 |
13,101 |
|
|
Fletcher Challenge Ltd.: |
|
|
|
|
Building Division |
11,910 |
11,302 |
|
|
Energy Division |
15,694 |
60,040 |
|
|
Forestry Division |
29,679 |
10,656 |
|
|
Telecom Corp. of New Zealand Ltd. |
72,952 |
203,004 |
|
|
Warehouse Group Ltd. (The) |
9,551 |
24,251 |
|
|
TOTAL NEW ZEALAND |
435,268 |
||
|
Norway - 0.4% |
|||
|
Bergesen dy ASA: |
|
|
|
|
(A Shares) |
2,500 |
55,025 |
|
|
(B Shares) |
800 |
16,111 |
|
|
Christiania Bank Og Kreditkasse |
22,550 |
118,127 |
|
|
DNB Holding ASA |
31,850 |
144,411 |
|
|
Elkem AS (a) |
2,400 |
42,260 |
|
|
Hafslund ASA Series A |
1,750 |
8,667 |
|
|
Kvaerner ASA (a) |
3,462 |
46,291 |
|
|
Merkantildata ASA (a)(c) |
8,750 |
56,332 |
|
|
Norsk Hydro AS (a) |
10,900 |
467,827 |
|
|
Norske Skogindustrier AS Class A |
1,600 |
56,170 |
|
|
Orkla-Borregaard AS |
8,971 |
159,444 |
|
|
Petroleum Geo-Services ASA (a) |
4,600 |
87,579 |
|
|
SAS Norge ASA (B Shares) |
1,300 |
11,159 |
|
|
Schibsted AS (B Shares) |
3,200 |
67,967 |
|
|
Smedvig ASA Series A |
800 |
16,111 |
|
|
Storebrand ASA (A Shares) |
12,150 |
86,244 |
|
|
Tomra Systems AS |
3,700 |
109,941 |
|
|
TOTAL NORWAY |
1,549,666 |
||
|
Portugal - 0.5% |
|||
|
Banco Comercial Portuges SA (a) |
79,759 |
415,064 |
|
|
Banco Espirito Santo SA (BES) (Reg.) |
5,275 |
85,679 |
|
|
Banco Espirito Santo SA (BES) (a) |
2,492 |
40,476 |
|
|
Common Stocks - continued |
|||
|
Shares |
Value (Note 1) |
||
|
Portugal - continued |
|||
|
BPI-SGPS SA |
18,790 |
$ 66,746 |
|
|
Brisa Auto-Estradas de Portugal Sarl |
11,703 |
96,861 |
|
|
Cimpor-Cimentos de Portugal SGPS SA |
5,249 |
111,920 |
|
|
Electricidade de Portugal SA |
117,314 |
380,260 |
|
|
Jeronimo Martins SGPS SA |
2,627 |
37,466 |
|
|
Portucel Industrial Empresa Produtora |
2,285 |
14,407 |
|
|
Portugal Telecom SA |
40,653 |
423,114 |
|
|
Sonae SGPS SA (a) |
43,684 |
67,501 |
|
|
Sonae SGPS SA New (a) |
55,902 |
81,912 |
|
|
TOTAL PORTUGAL |
1,821,406 |
||
|
Singapore - 1.0% |
|||
|
Chartered Semiconductor |
44,000 |
368,137 |
|
|
City Developments Ltd. |
31,000 |
154,000 |
|
|
Creative Technology Ltd. |
4,000 |
86,921 |
|
|
Cycle & Carriage Ltd. |
6,000 |
13,247 |
|
|
DBS Group Holdings Ltd. |
52,327 |
632,387 |
|
|
DBS Land Ltd. |
54,000 |
87,223 |
|
|
Fraser & Neave Ltd. |
9,000 |
33,467 |
|
|
Hotel Properties Ltd. |
11,000 |
9,523 |
|
|
Keppel Corp. Ltd. |
31,000 |
70,246 |
|
|
Natsteel Electronics Ltd. |
20,000 |
66,818 |
|
|
Neptune Orient Lines Ltd. (a) |
55,000 |
60,078 |
|
|
Oversea-Chinese Banking Corp. Ltd. |
50,824 |
351,406 |
|
|
Overseas Union Enterprises Ltd. |
4,000 |
11,388 |
|
|
Parkway Holdings Ltd. |
11,000 |
27,994 |
|
|
Sembcorp Industries Ltd. |
65,969 |
70,526 |
|
|
Singapore Airlines Ltd. |
48,000 |
462,960 |
|
|
Singapore Press Holdings Ltd. |
14,048 |
226,094 |
|
|
Singapore Technologies Engineering Ltd. |
116,000 |
156,365 |
|
|
Singapore Telecommunications Ltd. |
244,000 |
402,626 |
|
|
United Industrial Corp. Ltd. |
71,000 |
33,827 |
|
|
United Overseas Bank Ltd. |
38,616 |
302,897 |
|
|
United Overseas Land Ltd. |
28,000 |
26,355 |
|
|
Venture Manufacturing Singapore Ltd. |
9,000 |
115,043 |
|
|
TOTAL SINGAPORE |
3,769,528 |
||
|
Spain - 2.3% |
|||
|
Acerinox SA (Reg. D) |
2,218 |
65,000 |
|
|
Actividades de Construccion y Servicios SA (ACS) |
2,213 |
54,536 |
|
|
Aguas de Barcelona SA |
4,196 |
52,540 |
|
|
Altadis SA: |
|
|
|
|
(Spain) |
10,396 |
149,100 |
|
|
(France) (a) |
418 |
6,121 |
|
|
Autopistas Concesionaria Espanola SA |
10,165 |
78,535 |
|
|
Azucarera Ebro Agricolas SA |
1,950 |
22,685 |
|
|
Banco Bilbao Vizcaya Argentaria SA |
96,626 |
1,433,864 |
|
|
Banco Santander Central Hispano SA |
137,067 |
1,472,840 |
|
|
Corporacion Financiera Alba SA |
2,422 |
60,654 |
|
|
Corporacion Mapfre Compania Internacional de Reaseguros SA (Reg.) |
2,594 |
41,234 |
|
|
|
|||
|
Shares |
Value (Note 1) |
||
|
Cortefiel SA |
1,628 |
$ 32,920 |
|
|
Endesa SA |
33,151 |
646,202 |
|
|
Fomento Construcciones y Contratas SA (FOCSA) |
4,415 |
70,573 |
|
|
Gas Natural SDG SA Series E |
13,160 |
213,283 |
|
|
Grupo Dragados SA |
4,032 |
33,658 |
|
|
Iberdrola SA |
28,802 |
331,230 |
|
|
Metrovacesa SA |
1,900 |
30,203 |
|
|
Portland Valderrivas SA |
543 |
10,339 |
|
|
Repsol SA |
37,178 |
736,255 |
|
|
Sol Melia SA |
5,167 |
52,768 |
|
|
Telefonica SA (a) |
130,210 |
2,497,673 |
|
|
TelePizza SA (a) |
7,620 |
39,519 |
|
|
Union Electrica Fenosa SA |
8,801 |
163,427 |
|
|
Vallehermoso SA |
1,549 |
9,904 |
|
|
Zardoya Otis SA |
4,767 |
37,507 |
|
|
TOTAL SPAIN |
8,342,570 |
||
|
Sweden - 3.4% |
|||
|
ABB Ltd. |
1,006 |
112,026 |
|
|
Assi Doman AB |
3,800 |
57,429 |
|
|
Atlas Copco AB: |
|
|
|
|
(A Shares) |
5,585 |
115,501 |
|
|
(B Shares) |
1,885 |
36,984 |
|
|
Drott AB (B Shares) |
3,700 |
41,202 |
|
|
Electrolux AB (B Shares) |
14,900 |
184,885 |
|
|
Forenings Sparbanken AB (A Shares) |
20,950 |
312,169 |
|
|
Gambro AB: |
|
|
|
|
(A Shares) |
10,700 |
88,513 |
|
|
(B Shares) |
1,400 |
11,730 |
|
|
Hennes & Mauritz AB (H&M) (B Shares) |
33,000 |
579,218 |
|
|
Netcom AB (B Shares) (a) |
4,300 |
227,105 |
|
|
Nordic Baltic Holding AB |
118,178 |
820,933 |
|
|
OM Gruppen AB |
3,500 |
175,574 |
|
|
Sandvik AB |
10,400 |
227,211 |
|
|
SAPA AB |
900 |
13,124 |
|
|
Securitas AB (B Shares) |
14,200 |
316,255 |
|
|
Skandia Foersaekrings AB |
40,600 |
822,411 |
|
|
Skandinaviska Enskilda Banken |
27,880 |
334,119 |
|
|
Skanska AB (B Shares) |
4,700 |
161,002 |
|
|
SKF AB: |
|
|
|
|
(A Shares) |
400 |
5,430 |
|
|
(B Shares) (a) |
2,600 |
37,777 |
|
|
SSAB Swedish Steel (A Shares) |
2,800 |
24,053 |
|
|
Svenska Cellulosa AB (SCA) (B Shares) |
9,600 |
182,244 |
|
|
Svenska Handelsbanken AB (A Shares) |
25,600 |
423,540 |
|
|
Swedish Match Co. (a) |
11,608 |
37,548 |
|
|
Telefonaktiebolaget LM Ericsson |
305,500 |
6,262,750 |
|
|
Telia AB (a) |
58,700 |
420,215 |
|
|
Trelleborg AB (B Shares) |
1,200 |
8,209 |
|
|
Volvo AB: |
|
|
|
|
(A Shares) |
5,040 |
80,712 |
|
|
Common Stocks - continued |
|||
|
Shares |
Value (Note 1) |
||
|
Sweden - continued |
|||
|
Volvo AB: - continued |
|
|
|
|
(B Shares) (a) |
12,560 |
$ 208,465 |
|
|
WM-Data AB (B Shares) |
16,200 |
91,059 |
|
|
TOTAL SWEDEN |
12,419,393 |
||
|
Switzerland - 5.9% |
|||
|
ABB Ltd. (Reg.) |
10,772 |
1,206,791 |
|
|
Adecco SA |
690 |
529,214 |
|
|
Alusuisse Group AG (Reg.) (a) |
240 |
159,393 |
|
|
Credit Suisse Group (Reg.) |
10,730 |
2,243,893 |
|
|
Georg Fischer AG (Reg.) |
170 |
50,396 |
|
|
Givaudan AG (a) |
271 |
72,553 |
|
|
Holderbank Financiere Glarus AG: |
|
|
|
|
(Bearer) |
221 |
261,173 |
|
|
(Reg.) |
412 |
130,422 |
|
|
Jelmoli Holding AG |
10 |
12,628 |
|
|
Kuoni Reisen Holding AG Class B (Reg.) |
120 |
53,981 |
|
|
Lonza Group AG |
250 |
121,797 |
|
|
Nestle SA (Reg.) |
1,545 |
3,332,144 |
|
|
Novartis AG (Reg.) |
2,820 |
4,267,425 |
|
|
Roche Holding AG |
63 |
631,593 |
|
|
Roche Holding AG |
275 |
2,464,667 |
|
|
SAirGroup (Reg.) |
300 |
46,449 |
|
|
Schindler Holding AG (a) |
30 |
51,499 |
|
|
SGS Societe Generale de |
|
|
|
|
(Bearer) |
45 |
90,486 |
|
|
(Reg.) |
30 |
12,065 |
|
|
Sika Finanz AG |
50 |
14,822 |
|
|
Sulzer AG (Reg.) (a) |
160 |
116,282 |
|
|
Swiss Reinsurance Co. (Reg.) (a) |
565 |
1,160,772 |
|
|
Swisscom AG |
2,910 |
825,888 |
|
|
The Swatch Group AG: |
|
|
|
|
(Bearer) |
145 |
206,179 |
|
|
(Reg.) |
600 |
173,044 |
|
|
UBS AG |
16,752 |
2,439,752 |
|
|
Valora Holding AG |
180 |
44,778 |
|
|
Zurich Allied AG (Reg.) |
1,900 |
979,145 |
|
|
TOTAL SWITZERLAND |
21,699,231 |
||
|
United Kingdom - 19.1% |
|||
|
3i Group PLC |
22,355 |
550,499 |
|
|
Abbey National PLC |
52,990 |
640,543 |
|
|
Airtours PLC |
20,382 |
81,535 |
|
|
Allied Zurich PLC |
58,337 |
713,210 |
|
|
AMEC PLC |
10,281 |
41,862 |
|
|
Amvescap PLC |
25,444 |
542,114 |
|
|
Anglian Water PLC |
8,512 |
68,965 |
|
|
ARM Holdings PLC (a) |
36,869 |
491,629 |
|
|
AstraZeneca Group PLC: |
|
|
|
|
(Sweden) |
4,994 |
224,566 |
|
|
(United Kingdom) |
59,504 |
2,711,151 |
|
|
|
|||
|
Shares |
Value (Note 1) |
||
|
BAA PLC |
39,477 |
$ 314,699 |
|
|
BAE SYSTEMS PLC |
107,544 |
668,701 |
|
|
Barclays PLC |
54,368 |
1,355,377 |
|
|
Barratt Developments PLC |
9,121 |
29,481 |
|
|
Bass PLC |
33,136 |
322,744 |
|
|
BBA Group PLC |
18,009 |
131,033 |
|
|
Berkeley Group PLC |
5,445 |
44,432 |
|
|
BG Group PLC |
125,123 |
778,006 |
|
|
Blue Circle Industries PLC |
27,070 |
154,979 |
|
|
BOC Group PLC |
18,035 |
261,661 |
|
|
Boots Co. PLC |
33,231 |
244,678 |
|
|
BP Amoco PLC |
822,143 |
7,570,562 |
|
|
British Airways PLC |
40,529 |
191,061 |
|
|
British American Tobacco PLC |
80,232 |
515,157 |
|
|
British Land Co. PLC |
21,149 |
130,890 |
|
|
British Sky Broadcasting Group PLC (a) |
66,791 |
1,085,205 |
|
|
British Telecommunications PLC |
238,836 |
3,051,129 |
|
|
Bunzl PLC |
17,193 |
96,189 |
|
|
Cadbury Schweppes PLC |
71,227 |
408,816 |
|
|
Canary Wharf Group PLC (a) |
26,838 |
194,339 |
|
|
Capita Group PLC |
24,162 |
182,982 |
|
|
Caradon PLC |
9,387 |
24,082 |
|
|
Carlton Communications PLC |
22,743 |
247,228 |
|
|
Celltech Group PLC (a) |
9,895 |
209,390 |
|
|
Centrica PLC |
149,278 |
486,818 |
|
|
CGNU PLC |
82,158 |
1,262,246 |
|
|
Coats Viyella PLC |
15,458 |
11,252 |
|
|
Corus Group PLC |
112,688 |
116,209 |
|
|
Diageo PLC |
125,916 |
1,073,116 |
|
|
Dixons Group PLC |
72,781 |
251,854 |
|
|
Eidos PLC |
2,324 |
16,674 |
|
|
Electrocomponents PLC |
13,637 |
160,100 |
|
|
EMI Group PLC |
28,812 |
266,847 |
|
|
Exel PLC |
10,883 |
185,342 |
|
|
FKI PLC |
23,506 |
78,360 |
|
|
GKN PLC |
27,282 |
353,906 |
|
|
Glaxo Wellcome PLC |
133,027 |
3,828,682 |
|
|
Granada Compass PLC (a) |
76,873 |
945,396 |
|
|
Great Universal Stores PLC Class A |
34,401 |
243,321 |
|
|
Halifax Group PLC |
79,777 |
622,083 |
|
|
Hammerson PLC |
10,345 |
65,224 |
|
|
Hanson PLC |
27,425 |
162,179 |
|
|
Hays PLC |
65,418 |
382,112 |
|
|
Hilton Group PLC |
55,653 |
175,846 |
|
|
HSBC Holdings PLC (Reg.) |
333,077 |
4,825,455 |
|
|
IMI PLC |
5,814 |
19,382 |
|
|
Imperial Chemical Industries PLC |
27,036 |
184,605 |
|
|
Invensys PLC |
130,702 |
509,592 |
|
|
J. Sainsbury PLC |
66,811 |
345,704 |
|
|
Jarvis PLC |
1,041 |
2,674 |
|
|
Johnson Matthey PLC |
8,588 |
128,209 |
|
|
Kingfisher PLC |
51,122 |
370,481 |
|
|
Land Securities PLC |
20,030 |
239,074 |
|
|
Common Stocks - continued |
|||
|
Shares |
Value (Note 1) |
||
|
United Kingdom - continued |
|||
|
LASMO PLC |
37,997 |
$ 83,711 |
|
|
Legal & General Group PLC |
180,922 |
464,144 |
|
|
Lloyds TSB Group PLC |
198,198 |
1,861,498 |
|
|
Logica PLC |
14,722 |
459,835 |
|
|
London Bridge Software Holdings PLC |
4,635 |
63,821 |
|
|
Marconi PLC |
100,249 |
1,775,577 |
|
|
Marks & Spencer PLC |
100,210 |
301,382 |
|
|
Misys PLC |
22,319 |
258,308 |
|
|
National Grid Group PLC |
55,381 |
452,718 |
|
|
National Power PLC (c) |
40,559 |
276,883 |
|
|
Nycomed Amersham PLC |
23,542 |
210,361 |
|
|
Pearson PLC |
23,005 |
663,535 |
|
|
Pearson PLC rights 9/30/00 (a) |
6,274 |
90,026 |
|
|
Peninsular & Oriental Steam |
23,059 |
206,212 |
|
|
Pilkington PLC |
30,267 |
40,140 |
|
|
Provident Financial Group PLC |
5,546 |
66,638 |
|
|
Prudential Corp. PLC |
70,758 |
925,061 |
|
|
Psion PLC |
14,867 |
189,624 |
|
|
Railtrack PLC Class L |
19,597 |
279,494 |
|
|
Rank Group PLC Class L |
2,483 |
6,046 |
|
|
Reed International PLC |
39,673 |
339,262 |
|
|
Rentokil Initial PLC |
81,624 |
190,472 |
|
|
Reuters Group PLC |
52,186 |
1,044,264 |
|
|
Rexam PLC |
17,415 |
70,676 |
|
|
Rio Tinto PLC (Reg.) |
39,117 |
623,091 |
|
|
Rmc Group PLC |
10,643 |
99,497 |
|
|
Royal Bank of Scotland Group PLC |
93,312 |
1,682,465 |
|
|
Sage Group PLC |
48,461 |
446,371 |
|
|
Schroders PLC |
11,083 |
232,120 |
|
|
Scottish Power UK PLC |
64,608 |
491,625 |
|
|
Sema Group PLC |
17,079 |
319,330 |
|
|
Slough Estates PLC |
16,855 |
95,227 |
|
|
Smith & Nephew PLC |
36,384 |
148,976 |
|
|
SmithKline Beecham PLC |
205,212 |
2,680,582 |
|
|
Smiths Industries PLC |
10,442 |
136,212 |
|
|
Stagecoach Holdings PLC |
45,503 |
48,805 |
|
|
Tate & Lyle PLC |
18,807 |
69,510 |
|
|
Taylor Woodrow PLC |
15,225 |
35,950 |
|
|
Tesco PLC |
250,768 |
787,806 |
|
|
Thames Water PLC |
12,991 |
157,223 |
|
|
TI Group PLC |
18,171 |
92,180 |
|
|
Unigate PLC |
800 |
2,841 |
|
|
Unilever PLC |
108,110 |
689,201 |
|
|
United Utilities PLC |
17,824 |
165,338 |
|
|
Vodafone Group PLC |
2,233,469 |
9,143,249 |
|
|
Williams PLC Class L |
24,200 |
135,041 |
|
|
|
|||
|
Shares |
Value (Note 1) |
||
|
Wolseley PLC |
23,753 |
$ 131,169 |
|
|
WPP Group PLC |
28,891 |
409,534 |
|
|
TOTAL UNITED KINGDOM |
70,734,669 |
||
|
TOTAL COMMON STOCKS (Cost $338,710,011) |
344,899,353 |
||
|
Nonconvertible Preferred Stocks - 0.7% |
|||
|
|
|
|
|
|
Australia - 0.2% |
|||
|
News Corp. Ltd. (ltd. vtg.) |
80,145 |
869,381 |
|
|
Germany - 0.4% |
|||
|
MAN AG |
1,450 |
28,973 |
|
|
RWE AG (non-vtg.) |
1,850 |
55,333 |
|
|
SAP AG (a) |
4,750 |
1,219,563 |
|
|
Volkswagen AG |
2,600 |
66,982 |
|
|
TOTAL GERMANY |
1,370,851 |
||
|
Italy - 0.1% |
|||
|
Fiat Spa |
3,723 |
56,457 |
|
|
Fiat Spa (savings share) |
996 |
13,209 |
|
|
Telecom Italia Mobile Spa |
49,092 |
246,493 |
|
|
Telecom Italia Spa Risp |
25,107 |
148,716 |
|
|
TOTAL ITALY |
464,875 |
||
|
TOTAL NONCONVERTIBLE PREFERRED STOCKS (Cost $2,330,471) |
2,705,107 |
||
|
Nonconvertible Bonds - 0.0% |
|||||
|
Moody's Ratings (unaudited) |
Principal Amount (e) |
|
|||
|
Australia - 0.0% |
|||||
|
AMP Insurance Investment Holdings Pty Ltd. |
- |
AUD |
2,266 |
0 |
|
|
Government Obligations - 4.9% |
|||||
|
|
|||||
|
United States of America - 4.9% |
|||||
|
U.S. Treasury Bills, yield at date of purchase 5.87% to 6.18% 9/28/00 to 11/16/00 (d) |
|
18,461,000 |
18,266,024 |
||
|
Cash Equivalents - 7.0% |
|||
|
Shares |
Value (Note 1) |
||
|
Bankers Trust Institutional Daily Asset Fund, 6.6883% (b) |
25,669,318 |
$ 25,669,318 |
|
|
TOTAL INVESTMENT PORTFOLIO - 105.9% (Cost $384,977,248) |
391,539,802 |
||
|
NET OTHER ASSETS - (5.9)% |
(21,659,602) |
||
|
NET ASSETS - 100% |
$ 369,880,200 |
||
|
Futures Contracts |
|||||
|
|
Expiration Date |
Underlying Face Amount at Value |
Unrealized Gain/(Loss) |
||
|
Purchased |
|||||
|
11 All Ordinary Index Contracts (Australia) |
Oct. 2000 |
$ 533,930 |
$ (6,842) |
||
|
41 CAC 40 Index Contracts (France) |
Oct. 2000 |
2,534,119 |
26,086 |
||
|
13 DAX 30 |
Sept. 2000 |
2,212,581 |
53,900 |
||
|
52 FTSE 100 |
Sept. 2000 |
5,231,496 |
164,148 |
||
|
12 Hang Seng Stock Index Contracts (Hong Kong) |
Oct. 2000 |
1,320,008 |
(9,667) |
||
|
24 IBEX 35 Index Contracts (Spain) |
Sept. 2000 |
2,385,439 |
(75,384) |
||
|
13 MIB 30 Index Contracts (Italy) |
Sept. 2000 |
2,958,423 |
38,275 |
||
|
1 Nikkei 225 Index Contracts (Japan) |
Sept. 2000 |
85,100 |
4,894 |
||
|
14 Nikkei 300 Index Contracts (Japan) |
Sept. 2000 |
389,722 |
(5,737) |
||
|
37 Topix Index Contracts (Japan) |
Sept. 2000 |
5,238,573 |
(230,198) |
||
|
|
|
$ 22,889,391 |
$ (40,525) |
||
|
The face value of futures purchased as a percentage of net assets - 6.2% |
|
Forward Foreign Currency Contracts |
|||||
|
|
Settlement Dates |
Value |
Unrealized Gain/ (Loss) |
||
|
Contracts to Buy |
|||||
|
5,587,121 EUR |
Sept. 2000 |
$ 4,965,348 |
$ (73,475) |
||
|
2,414,701 GBP |
Sept. 2000 |
3,500,743 |
(117,327) |
||
|
525,745,022 JPY |
Sept. 2000 |
4,940,583 |
56,283 |
||
|
TOTAL CONTRACTS TO BUY (Payable amount $13,541,193) |
$ 13,406,674 |
$ (134,519) |
|||
|
The value of contracts to buy as a percentage of net assets - 3.6% |
|
Currency Abbreviations |
||
|
AUD |
- |
Australian dollar |
|
EUR |
- |
European Monetary Unit |
|
GBP |
- |
British pound |
|
JPY |
- |
Japanese yen |
|
Legend |
|
(a) Non-income producing |
|
(b) The rate quoted is the annualized seven-day yield of the fund at |
|
(c) Security exempt from registration under Rule 144A of the Securities |
|
(d) Security or a portion of the security was pledged to cover margin requirements for futures contracts. At the period end, the value of securities pledged amounted to $1,621,724. |
|
(e) Principal amount is stated in United States dollars unless otherwise noted. |
|
Other Information |
|
Purchases and sales of securities, other than short-term securities, |
|
The market value of futures contracts opened and closed during the |
|
The fund participated in the security lending program. At period end, the value of securities loaned amounted to $26,485,226. The fund received |
|
Income Tax Information |
|
At August 31, 2000, the aggregate cost of investment securities for income tax purposes was $385,065,721. Net unrealized appreciation aggregated $6,474,081, of which $40,015,887 related to appreciated investment securities and $33,541,806 related to depreciated investment securities. |
See accompanying notes which are an integral part of the financial statements.
Semiannual Report
Statement of Assets and Liabilities
|
|
August 31, 2000 (Unaudited) |
|
|
Assets |
|
|
|
Investment in securities, at value |
|
$ 391,539,802 |
|
Cash |
|
1,773 |
|
Foreign currency held at value |
|
4,061,528 |
|
Receivable for investments sold |
|
1,425,184 |
|
Unrealized appreciation on |
|
58,424 |
|
Receivable for fund shares sold |
|
1,128,431 |
|
Dividends receivable |
|
662,024 |
|
Interest receivable |
|
60 |
|
Redemption fees receivable |
|
459 |
|
Receivable for daily variation on futures contracts |
|
70,148 |
|
Other receivables |
|
13,398 |
|
Total assets |
|
398,961,231 |
|
Liabilities |
|
|
|
Payable for investments purchased |
$ 2,544,894 |
|
|
Unrealized depreciation on |
192,943 |
|
|
Payable for fund shares redeemed |
515,484 |
|
|
Accrued management fee |
58,643 |
|
|
Other payables and |
99,749 |
|
|
Collateral on securities loaned, |
25,669,318 |
|
|
Total liabilities |
|
29,081,031 |
|
Net Assets |
|
$ 369,880,200 |
|
Net Assets consist of: |
|
|
|
Paid in capital |
|
$ 360,461,484 |
|
Undistributed net investment income |
|
3,210,484 |
|
Accumulated undistributed net realized gain (loss) on investments and foreign currency transactions |
|
(78,411) |
|
Net unrealized appreciation (depreciation) on investments |
|
6,286,643 |
|
Net Assets, for 10,646,642 shares outstanding |
|
$ 369,880,200 |
|
Net Asset Value, offering price |
|
$34.74 |
Statement of Operations
|
|
Six months ended August 31, 2000 (Unaudited) |
|
|
Investment Income Dividends |
|
$ 3,357,754 |
|
Interest |
|
636,921 |
|
Security lending |
|
98,830 |
|
|
|
4,093,505 |
|
Less foreign taxes withheld |
|
(398,236) |
|
Total income |
|
3,695,269 |
|
Expenses |
|
|
|
Management fee and |
$ 531,075 |
|
|
Transfer agent fees |
199,102 |
|
|
Accounting fees |
94,764 |
|
|
Non-interested trustees' compensation |
460 |
|
|
Registration fees |
58,879 |
|
|
Audit |
13,958 |
|
|
Legal |
585 |
|
|
Miscellaneous |
2,091 |
|
|
Total expenses before reductions |
900,914 |
|
|
Expense reductions |
(340,826) |
560,088 |
|
Net investment income |
|
3,135,181 |
|
Realized and Unrealized Gain (Loss) Net realized gain (loss) on: |
|
|
|
Investment securities |
(319,156) |
|
|
Foreign currency transactions |
(792,408) |
|
|
Futures contracts |
1,304,580 |
193,016 |
|
Change in net unrealized appreciation (depreciation) on: |
|
|
|
Investment securities |
(15,822,411) |
|
|
Assets and liabilities in |
94,162 |
|
|
Futures contracts |
(1,596,618) |
(17,324,867) |
|
Net gain (loss) |
|
(17,131,851) |
|
Net increase (decrease) in net assets resulting from operations |
|
$ (13,996,670) |
See accompanying notes which are an integral part of the financial statements.
Semiannual Report
Spartan International Index Fund
Financial Statements - continued
Statement of Changes in Net Assets
|
Increase (Decrease) in Net Assets |
Six months ended |
Year ended |
|
Operations |
$ 3,135,181 |
$ 1,562,669 |
|
Net realized gain (loss) |
193,016 |
1,140,136 |
|
Change in net unrealized appreciation (depreciation) |
(17,324,867) |
20,437,260 |
|
Net increase (decrease) in net assets resulting from operations |
(13,996,670) |
23,140,065 |
|
Distributions to shareholders |
- |
(535,652) |
|
From net realized gain |
(528,396) |
(1,178,572) |
|
In excess of net realized gain |
(78,411) |
- |
|
Total distributions |
(606,807) |
(1,714,224) |
|
Share transactions |
163,104,497 |
226,314,449 |
|
Reinvestment of distributions |
571,157 |
1,602,355 |
|
Cost of shares redeemed |
(34,213,456) |
(37,729,643) |
|
Net increase (decrease) in net assets resulting from share transactions |
129,462,198 |
190,187,161 |
|
Trading fees |
54,504 |
177,921 |
|
Total increase (decrease) in net assets |
114,913,225 |
211,790,923 |
|
Net Assets |
|
|
|
Beginning of period |
254,966,975 |
43,176,052 |
|
End of period (including undistributed net investment income of $3,210,484 and $75,303, respectively) |
$ 369,880,200 |
$ 254,966,975 |
|
Other Information Shares |
|
|
|
Sold |
4,558,074 |
6,643,083 |
|
Issued in reinvestment of distributions |
15,407 |
45,094 |
|
Redeemed |
(958,414) |
(1,153,839) |
|
Net increase (decrease) |
3,615,067 |
5,534,338 |
Financial Highlights
|
|
Six months ended |
Years ended February 28, |
||
|
Selected Per-Share Data |
(Unaudited) |
2000 G |
1999 |
1998 E |
|
Net asset value, beginning of period |
$ 36.26 |
$ 28.84 |
$ 27.64 |
$ 25.00 |
|
Income from Investment Operations |
|
|
|
|
|
Net investment income D |
.35 |
.49 |
.46 |
.11 |
|
Net realized and unrealized gain (loss) |
(1.80) |
7.25 |
1.08 |
2.29 |
|
Total from investment operations |
(1.45) |
7.74 |
1.54 |
2.40 |
|
Less Distributions |
|
|
|
|
|
From net investment income |
- |
(.12) |
(.48) |
(.06) |
|
From net realized gain |
(.07) |
(.26) |
(.09) |
- |
|
In excess of net realized gain |
(.01) |
- |
(.04) |
- |
|
Total distributions |
(.08) |
(.38) |
(.61) |
(.06) |
|
Trading fees added to paid in capital |
.01 |
.06 |
.27 |
.30 |
|
Net asset value, end of period |
$ 34.74 |
$ 36.26 |
$ 28.84 |
$ 27.64 |
|
Total Return B, C |
(3.99)% |
27.08% |
6.58% |
10.83% |
|
Ratios and Supplemental Data |
|
|
|
|
|
Net assets, end of period (000 omitted) |
$ 369,880 |
$ 254,967 |
$ 43,176 |
$ 24,686 |
|
Ratio of expenses to average net assets |
.35% A, F |
.35% F |
.36% F |
.35% A, F |
|
Ratio of net investment income to average net assets |
1.96% A |
1.48% |
1.62% |
1.43% A |
|
Portfolio turnover rate |
3% A |
3% |
2% |
2% A |
|
A Annualized B The total returns would have been lower had certain expenses not been reduced during the periods shown. C Total for periods of less than one year are not annualized. D Net investment income per share has been calculated based on average shares outstanding during the period. E For the period November 5, 1997 (commencement of operations) to February 28, 1998. F FMR agreed to reimburse a portion of the fund's expenses during the period. Without this reimbursement, the fund's expense ratio would have been higher. G For the year ended February 29 |
||||
See accompanying notes which are an integral part of the financial statements.
Semiannual Report
For the period ended August 31, 2000 (Unaudited)
1. Significant Accounting Policies.
The Spartan Total Market Index Fund, Spartan Extended Market Index Fund and Spartan International Index Fund (the funds) are funds of Fidelity Concord Street Trust (the trust). The trust is registered under the Investment Company Act of 1940, as amended, as an open-end management investment company organized as a Massachusetts business trust. Each fund is authorized to issue an unlimited number of shares. The financial statements have been prepared in conformity with generally accepted accounting principles which require management to make certain estimates and assumptions at the date of the financial statements. The following summarizes the significant accounting policies of the funds:
Security Valuation:
Spartan Total Market Index and Spartan Extended Market Index Funds. Securities for which exchange quotations are readily available are valued at the last sale price, or if no sale price, at the closing bid price. Foreign securities are valued based on quotations from the principal market in which such securities are normally traded. If trading or events occurring in other markets after the close of the principal market in which foreign securities are traded, and before the close of the business of the fund, are expected to materially affect the value of those securities, then they are valued at their fair value taking this trading or these events into account. Fair value is determined in good faith under consistently applied procedures under the general supervision of the Board of Trustees. Securities (including restricted securities) for which exchange quotations are not readily available (and in certain cases debt securities which trade on an exchange) are valued primarily using dealer-supplied valuations or at their fair value. Short-term securities with remaining maturities of sixty days or less for which quotations are not readily available are valued at amortized cost or original cost plus accrued interest, both of which approximate current value.
Spartan International Index Fund. Securities for which quotations are readily available are valued using the official closing price or at the last sale price in the principal market in which they are traded. If the last sale price (on the local exchange) is unavailable, the last evaluated quote or closing bid price normally is used. If trading or events occurring in other markets after the close of the principal market in which securities are traded are expected to materially affect the value of those securities, then they are valued at their fair value taking this trading or these events into account. Fair value is determined in good faith under consistently applied procedures under the general supervision of the Board of Trustees. Securities (including restricted securities) for which quotations are not readily available are valued primarily using dealer-supplied valuations or at their fair value. Short-term securities with remaining maturities of sixty days or less for which quotations are not readily available are valued at amortized cost or original cost plus accrued interest, both of which approximate current value.
Foreign Currency Translation. The accounting records of the funds are maintained in U.S. dollars. Investment securities and other assets and liabilities denominated in a foreign currency are translated into U.S. dollars at the prevailing rates of exchange at period end. Purchases and sales of securities, income receipts and expense payments are translated into U.S. dollars at the prevailing exchange rate on the respective dates of the transactions.
Net realized gains and losses on foreign currency transactions represent net gains and losses from sales and maturities of foreign currency contracts, disposition of foreign currencies, the difference between the amount of net investment income accrued and the U.S. dollar amount actually received, and gains and losses between trade and settlement date on purchases and sales of securities. The effects of changes in foreign currency exchange rates on investments in securities are included with the net realized and unrealized gain or loss on investment securities.
Income Taxes. As a qualified regulated investment company under Subchapter M of the Internal Revenue Code, each fund is not subject to U.S. federal income taxes to the extent that it distributes substantially all of its taxable income for its fiscal year. Each fund may be subject to foreign taxes on income and gains on investments which are accrued based upon each fund's understanding of the tax rules and regulations that exist in the markets in which they invest. Foreign governments may also impose taxes on other payments or transactions with respect to foreign securities. Each fund accrues such taxes as applicable. The schedules of investments include information regarding income taxes under the caption "Income Tax Information."
Investment Income. Dividend income is recorded on the ex-dividend date, except certain dividends from foreign securities where the ex-dividend date may have passed, are recorded as soon as the funds are informed of the ex-dividend date. Non-cash dividends included in dividend income, if any, are recorded at the fair market value of the securities received. Interest income, which includes accretion of original issue discount, is accrued as earned. Investment income is recorded net of foreign taxes withheld where recovery of such taxes is uncertain.
Expenses. Most expenses of the trust can be directly attributed to a fund. Expenses which cannot be directly attributed are apportioned among the funds in the trust.
Distributions to Shareholders. Distributions are recorded on the ex-dividend date.
Income and capital gain distributions are determined in accordance with income tax regulations which may differ from generally accepted accounting principles. These differences, which may result in distribution reclassifications, are primarily due to differing treatments for futures transactions, foreign currency transactions, passive foreign investment companies (PFIC), market discount, partnerships, non-taxable dividends and losses deferred due to wash sales. Certain funds also utilized earnings and profits distributed to shareholders on redemption of shares as a part of the dividends paid deduction for income tax purposes.
Semiannual Report
Notes to Financial Statements (Unaudited) - continued
1. Significant Accounting Policies - continued
Distributions to Shareholders - continued
Permanent book and tax basis differences relating to shareholder distributions will result in reclassifications to paid in capital. Undistributed net investment income and accumulated undistributed net realized gain (loss) on investments and foreign currency transactions may include temporary book and tax basis differences which will reverse in a subsequent period. Any taxable income or gain remaining at fiscal year end is distributed in the following year.
Short-Term Trading (Redemption) Fees. Shares held in the funds less than 90 days are subject to a short-term trading fee equal to 0.50%, 0.75% and 1.00% of the amount invested in Spartan Total Market Index, Spartan Extended Market Index and Spartan International Index, respectively. This fee, which is retained by the fund, is accounted for as an addition to paid in capital. Shares purchased through April 28, 1999 were subject to a purchase fee, but will not be subject to a short-term trading fee.
Spartan Extended Market Index and Spartan International Index also receive their allocable share of short-term trading fees attributable to redemptions from the Fidelity Four-in-One Index Fund. For the period these fees total $7,770 and $10,361, respectively.
Security Transactions. Security transactions are accounted for as of trade date. Gains and losses on securities sold are determined on the basis of identified cost.
2. Operating Policies.
Forward Foreign Currency Contracts. The Spartan International Index fund generally uses foreign currency contracts to facilitate transactions in foreign-denominated securities and to manage the fund's currency exposure. Contracts to sell generally are used to hedge the fund's investments against currency fluctuations, while contracts to buy generally are used to offset a previous contract to sell. Also, a contract to buy can be used to acquire exposure to foreign currencies and a contract to sell can be used to offset a previous contract to buy. These contracts involve market risk in excess of the unrealized gain or loss reflected in the fund's Statement of Assets and Liabilities. The U.S. dollar value of the currencies the fund has committed to buy or sell is shown in the schedule of investments under the caption "Forward Foreign Currency Contracts." This amount represents the aggregate exposure to each currency the fund has acquired or hedged through currency contracts at period end. Losses may arise from changes in the value of foreign currency or if the counterparties do not perform under the contracts' terms.
The U.S. dollar value of forward foreign currency contracts is determined using forward currency exchange rates supplied by a quotation service. Purchases and sales of forward foreign currency contracts having the same settlement date and broker are offset and any realized gain (loss) is recognized on the date of offset; otherwise, gain (loss) is recognized on settlement date. Contracts that have been offset with different counterparties are reflected as
both a contract to buy and a contract to sell in the schedule of investments under the caption "Forward Foreign Currency Contracts."
Futures Contracts. Certain funds may use futures contracts to manage their exposure to the stock market and to fluctuations in currency values. Buying futures tends to increase a fund's exposure to the underlying instrument, while selling futures tends to decrease a fund's exposure to the underlying instrument or hedge other fund investments. Futures contracts involve, to varying degrees, risk of loss in excess of the futures variation margin reflected in each applicable fund's Statement of Assets and Liabilities. The underlying face amount at value of any open futures contracts at period end is shown in each applicable fund's schedule of investments under the caption "Futures Contracts." This amount reflects each contract's exposure to the underlying instrument at period end. Losses may arise from changes in the value of the underlying instruments or if the counterparties do not perform under the contracts' terms. Gains (losses) are realized upon the expiration or closing of the futures contracts. Futures contracts are valued at the settlement price established each day by the board of trade or exchange on which they are traded.
Restricted Securities. Certain funds are permitted to invest in securities that are subject to legal or contractual restrictions on resale. These securities generally may be resold in transactions exempt from registration or to the public if the securities are registered. Disposal of these securities may involve time-consuming negotiations and expense, and prompt sale at an acceptable price may be difficult. Information regarding restricted securities is included under the caption "Other Information" at the end of each applicable fund's schedule of investments.
3. Purchases and Sales of Investments.
Information regarding purchases and sales of securities (other than short-term securities) and the market value of future contracts opened and closed is included under the caption "Other Information" at the end of each applicable fund's schedule of investments.
4. Fees and Other Transactions with Affiliates.
Management Fee. As each fund's investment adviser, Fidelity Management & Research Company (FMR) receives a fee that is computed daily at an annual rate of .24%, .24% and .34% of the Spartan Total Market Index, Spartan Extended Market Index and Spartan International Index funds' average net assets, respectively.
Sub-Adviser and Security Lending Fees. FMR and each of the funds have entered into a sub-advisory agreement with Bankers Trust Company (Bankers Trust). Bankers Trust receives a sub-advisory fee for providing investment management and custodial services to each of the funds. For providing these services to Spartan Extended Market Index and Spartan Total Market Index, FMR pays Bankers Trust fees at an annual rate of 0.0125% of the average net assets of each fund. For providing these services to Spartan International Index, FMR pays Bankers Trust fees at an annual rate of 0.0650% of the average net assets of the fund, plus fees of up to $200,000 annually.
Semiannual Report
Notes to Financial Statements (Unaudited) - continued
4. Fees and Other Transactions with Affiliates - continued
Sub-Adviser and Security Lending Fees - continued
Under a separate securities lending agreement with Bankers Trust, each fund receives at least 70% of net income from its securities lending program. Bankers Trust retains no more than 30% of net income under the agreement. For the period, Bankers Trust retained the following amounts:
|
|
Amount |
|
Spartan Total Market Index |
$81,418 |
|
Spartan Extended Market Index |
$132,251 |
|
Spartan International Index |
$42,357 |
In March 1999, Bankers Trust announced that it had reached an agreement with the U.S. Attorney's Office to resolve an investigation concerning inappropriate transfers of unclaimed funds and related recordkeeping problems that occurred between 1994 and 1996. As a result of the plea, absent an order from the Securities and Exchange Commission (SEC), Bankers Trust would not have been able to provide investment advisory services of the funds. The SEC previously granted a temporary order to permit Bankers Trust and its affiliates to provide investment advisory services to registered investment companies. On July 10, 2000, the SEC granted Bankers Trust a permanent order.
Transfer Agent Fees. Fidelity Service Company, Inc. (FSC), an affiliate of FMR, is the funds' transfer, dividend disbursing and shareholder servicing agent. FSC receives account fees and asset-based fees that vary according to account size and type of account. FSC pays for typesetting, printing and mailing of all shareholder reports, except proxy statements. For the period, the transfer agent fees were equivalent to an annualized rate of .12%, .13% and .12% of the average net assets of Spartan Total Market Index, Spartan Extended Market Index and Spartan International Index, respectively.
Accounting Fees. FSC maintains each fund's accounting records. The fee is based on the level of average net assets for the month plus out-of-pocket expenses.
Brokerage Commissions. Spartan Total Market Index and Spartan Extended Market Index placed a portion of their portfolio transactions with brokerage firms which are affiliates of FMR. The commissions paid to these affiliated firms are shown under the caption "Other Information" at the end of each applicable fund's schedule of investments.
5. Security Lending.
Certain funds lend portfolio securities from time to time in order to earn additional income. Each applicable fund receives collateral (in the form of U.S. Treasury obligations, letters of credit and/or cash) against the loaned securities and maintains collateral in an amount not less than 100% of the market value of the loaned securities during the period of the loan. The market value of the loaned securities is determined at the close of business of the funds and any additional required collateral is delivered to the funds on the next business day. If the borrower defaults on its obligation to return the securities loaned because of insolvency or other reasons, a fund could experience delays and costs in recovering the securities loaned or in gaining access to the collateral. Information regarding the value of securities loaned and the value of collateral at period end is included under the caption "Other Information" at the end of each applicable fund's schedule of investments.
6. Expense Reductions.
FMR voluntarily agreed to reimburse the fund's operating expenses (excluding interest, taxes, brokerage commissions, extraordinary expenses and sub-advisory fees paid by the fund associated with securities lending) above the following annual rate of average net assets for each of the following funds:
|
|
FMR |
|
|
|
Expense |
|
|
|
Limitations |
Reimbursement |
|
Spartan Total Market Index |
.25% |
$792,981 |
|
Spartan Extended Market Index |
.25% |
$483,428 |
|
Spartan International Index |
.35% |
$340,826 |
In addition, through arrangements with the funds' custodian and transfer agent, credits realized as a result of uninvested cash balances were used to reduce a portion of the fund's expenses. During the period, the funds' custodian and transfer agent fees were reduced by $2,895, $2,062 and $4,692, $3,572 respectively, for Spartan Extended Market Index and Spartan Total Market Index under these arrangements.
Semiannual Report
Fidelity offers several ways to conveniently manage your personal investments via your telephone or PC. You can access your account information, conduct trades and research your investments 24 hours a day.
By Phone
Fidelity Automated Service Telephone provides a single toll-free number to access account balances, positions, quotes and trading. It's easy to navigate the service, and on your first call, the system will help you create a personal identification number (PIN) for security.
(phone_graphic)Fidelity Automated Service Telephone (FAST®)
1-800-544-5555
Press
1 For mutual fund and brokerage trading.
2 For quotes.*
3 For account balances and holdings.
4 To review orders and mutual fund activity.
5 To change your PIN.
*0 To speak to a Fidelity representative.
By PC
Fidelity's web site on the Internet provides a wide range of information, including daily financial news, fund performance, interactive planning tools and news about Fidelity products and services.
(computer_graphic)Fidelity's Web Site
www.fidelity.com
If you are not currently on the Internet, call EarthLink Sprint at 1-800-288-2967, and be sure to ask for registration number SMD004 to receive a special Fidelity package that includes 30 days of free Internet access. EarthLink is North America's #1 independent Internet access provider.
(computer_graphic)
Fidelity On-line Xpress+x®
Fidelity On-line Xpress+ software for Windows combines comprehensive portfolio management capabilities, securities trading and access to
research and analysis tools . . . all on your desktop. Call Fidelity at 1-800-544-0240 or visit our Web site for more information on how to manage
your investments via your PC. * When you call the quotes line, please remember that a fund's yield and return will vary and, except for money market funds, share price will also vary. This means
that you may have a gain or loss when you sell your shares. There is no assurance that money market funds will be able to maintain a stable $1 share price; an
investment in a money market fund is not insured or guaranteed by the U.S. government. Total returns are historical and include changes in share price,
reinvestment of dividends and capital gains, and the effects of any sales charges.
Semiannual Report
If more than one address is listed, please locate the address that is closest to you. We'll give your correspondence immediate attention and send you written confirmation upon completion of your request.
(letter_graphic)Making Changes
To Your Account
(such as changing name, address, bank, etc.)
Fidelity Investments
P.O. Box 770001
Cincinnati, OH 45277-0002
(letter_graphic)For Non-Retirement
Accounts
Buying shares
Fidelity Investments
P.O. Box 770001
Cincinnati, OH 45277-0003
Overnight Express
Fidelity Investments
2300 Litton Lane - KH1A
Hebron, KY 41048
Selling shares
Fidelity Investments
P.O. Box 660602
Dallas, TX 75266-0602
Overnight Express
Fidelity Investments
Attn: Redemptions - CP61
400 East Las Colinas Blvd.
Irving, TX 75039-5587
General Correspondence
Fidelity Investments
P.O. Box 500
Merrimack, NH 03054-0500
(letter_graphic)For Retirement
Accounts
Buying shares
Fidelity Investments
P.O. Box 770001
Cincinnati, OH 45277-0003
Selling shares
Fidelity Investments
P.O. Box 660602
Dallas, TX 75266-0602
Overnight Express
Fidelity Investments
Attn: Redemptions - CP6R
400 East Las Colinas Blvd.
Irving, TX 75039-5587
General Correspondence
Fidelity Investments
P.O. Box 500
Merrimack, NH 03054-0500
Semiannual Report
For directions and hours,
please call 1-800-544-9797.
Arizona
7373 N. Scottsdale Road
Scottsdale, AZ
California
815 East Birch Street
Brea, CA
851 East Hamilton Avenue
Campbell, CA
527 North Brand Boulevard
Glendale, CA
19200 Von Karman Avenue
Irvine, CA
10100 Santa Monica Blvd.
Los Angeles, CA
251 University Avenue
Palo Alto, CA
1760 Challenge Way
Sacramento, CA
7676 Hazard Center Drive
San Diego, CA
950 Northgate Drive
San Rafael, CA
8 Montgomery Street
San Francisco, CA
1400 Civic Drive
Walnut Creek, CA
6300 Canoga Avenue
Woodland Hills, CA
Colorado
1625 Broadway
Denver, CO
Connecticut
48 West Putnam Avenue
Greenwich, CT
265 Church Street
New Haven, CT
300 Atlantic Street
Stamford, CT
29 South Main Street
West Hartford, CT
Delaware
222 Delaware Avenue
Wilmington, DE
Florida
4400 N. Federal Highway
Boca Raton, FL
90 Alhambra Plaza
Coral Gables, FL
4090 N. Ocean Boulevard
Ft. Lauderdale, FL
1907 West State Road 434
Longwood, FL
8880 Tamiami Trail, North
Naples, FL
2401 PGA Boulevard
Palm Beach Gardens, FL
8065 Beneva Road
Sarasota, FL
1502 N. Westshore Blvd.
Tampa, FL
Georgia
3445 Peachtree Road, N.E.
Atlanta, GA
1000 Abernathy Road
Atlanta, GA
Illinois
One North Franklin Street
Chicago, IL
1415 West 22nd Street
Oak Brook, IL
1700 East Golf Road
Schaumburg, IL
3232 Lake Avenue
Wilmette, IL
Indiana
4729 East 82nd Street
Indianapolis, IN
Maine
Three Canal Plaza
Portland, ME
Maryland
7401 Wisconsin Avenue
Bethesda, MD
One W. Pennsylvania Ave.
Towson, MD
Massachusetts
801 Boylston Street
Boston, MA
155 Congress Street
Boston, MA
25 State Street
Boston, MA
300 Granite Street
Braintree, MA
44 Mall Road
Burlington, MA
416 Belmont Street
Worcester, MA
Michigan
280 Old N. Woodward Ave.
Birmingham, MI
29155 Northwestern Hwy.
Southfield, MI
Minnesota
7600 France Avenue South
Edina, MN
Missouri
700 West 47th Street
Kansas City, MO
8885 Ladue Road
Ladue, MO
New Jersey
150 Essex Street
Millburn, NJ
56 South Street
Morristown, NJ
501 Route 17, South
Paramus, NJ
New York
1055 Franklin Avenue
Garden City, NY
999 Walt Whitman Road
Melville, L.I., NY
1271 Avenue of the Americas
New York, NY
71 Broadway
New York, NY
350 Park Avenue
New York, NY
North Carolina
4611 Sharon Road
Charlotte, NC
Ohio
600 Vine Street
Cincinnati, OH
28699 Chagrin Boulevard
Woodmere Village, OH
Oregon
16850 SW 72nd Avenue
Tigard, OR
Pennsylvania
1735 Market Street
Philadelphia, PA
439 Fifth Avenue
Pittsburgh, PA
Rhode Island
47 Providence Place
Providence, RI
Tennessee
6150 Poplar Avenue
Memphis, TN
Texas
10000 Research Boulevard
Austin, TX
4017 Northwest Parkway
Dallas, TX
1155 Dairy Ashford Street
Houston, TX
2701 Drexel Drive
Houston, TX
400 East Las Colinas Blvd.
Irving, TX
14100 San Pedro
San Antonio, TX
19740 IH 45 North
Spring, TX
Utah
215 South State Street
Salt Lake City, UT
Virginia
1861 International Drive
McLean, VA
Washington
411 108th Avenue, N.E.
Bellevue, WA
511 Pine Street
Seattle, WA
Washington, DC
1900 K Street, N.W.
Washington, DC
Wisconsin
595 North Barker Road
Brookfield, WI
Fidelity Brokerage Services, Inc., 100 Summer St., Boston, MA 02110 Member NYSE/SIPC
Semiannual Report
Semiannual Report
Investment Adviser
Fidelity Management & Research Company
Boston, MA
Investment Sub-Adviser
Bankers Trust Company
Officers
Edward C. Johnson 3d, President
Robert C. Pozen, Senior Vice President
Robert A. Lawrence, Vice President
Eric D. Roiter, Secretary
Robert A. Dwight, Treasurer
Maria F. Dwyer, Deputy Treasurer
John H. Costello, Assistant Treasurer
Thomas J. Simpson, Assistant Treasurer
Board of Trustees
Ralph F. Cox *
Phyllis Burke Davis *
Robert M. Gates *
Edward C. Johnson 3d
Donald J. Kirk *
Ned C. Lautenbach *
Peter S. Lynch
Marvin L. Mann *
William O. McCoy *
Gerald C. McDonough *
Robert C. Pozen
Thomas R. Williams *
Advisory Board
J. Michael Cook
Abigail P. Johnson
Marie L. Knowles
General Distributor
Fidelity Distributors Corporation
Boston, MA
Transfer and Shareholder Servicing Agent
Fidelity Service Company, Inc.
Boston, MA
Custodian
Bankers Trust Company
New York, NY
* Independent trustees
Fidelity's Index Funds
Spartan Extended Market Index Fund
Spartan International Index Fund
Spartan 500 Index Fund
Spartan Total Market Index Fund
The Fidelity Telephone Connection
Mutual Fund 24-Hour Service
Exchanges/Redemptions
and Account Assistance 1-800-544-6666
Product Information 1-800-544-6666
Retirement Accounts 1-800-544-4774
(8 a.m. - 9 p.m.)
TDD Service 1-800-544-0118
for the deaf and hearing impaired
(9 a.m. - 9 p.m. Eastern time)
Fidelity Automated Service
Telephone (FAST®) (automated graphic) 1-800-544-5555
(automated graphic) Automated line for quickest service
|
SIF-SANN-1000 |
112812 |
|
1.707985.102 |
|
(Recycle graphic) Printed on Recycled Paper
(Fidelity Investment logo)(registered trademark)
Corporate Headquarters
82 Devonshire St., Boston, MA 02109
www.fidelity.com
Fidelity ®
Semiannual Report
August 31, 2000
(2 Fidelity logo Graphics)(registered trademark)
|
President's Message |
Ned Johnson on investing strategies. |
|
|
Performance |
How the fund has done over time. |
|
|
Fund Talk |
The manager's review of fund performance, strategy and outlook. |
|
|
Investment Changes |
A summary of major shifts in the fund's investments over the past six months. |
|
|
Investments |
A complete list of the fund's investments with their market values. |
|
|
Financial Statements |
Statements of assets and liabilities,
operations, and changes in net assets, |
|
|
Notes |
Notes to the financial statements. |
Standard & Poor's, S&P and S&P 500 are registered service marks of The McGraw-Hill Companies, Inc. and have been licensed for use by Fidelity Distributors Corporation.
Other third party marks appearing herein are the property of their respective owners.
All other marks appearing herein are registered or unregistered trademarks or service marks of FMR Corp. or an affiliated company.
(Recycle graphic) This report is printed on recycled paper using soy-based inks.
If additional copies of financial reports, prospectuses or historical account information are needed, or for more information on any Fidelity fund including
charges and expenses, please call the appropriate number listed below or the number provided to your institutional or employer-sponsored retirement plan.
Read the prospectus carefully before you invest or send money.
Retirement Plan Level Accounts
Corporate Clients (800) 962-1375
"Not For Profit" Clients (800) 343-0860
Financial and Other Institutions
Nationwide (800) 843-3001
Other Investors (800) 544-8888
This report and the financial statements contained herein are submitted for the general information of the shareholders of the fund. This report is not authorized for distribution to prospective investors in the fund unless preceded or accompanied by an effective prospectus.
Mutual fund shares are not deposits or obligations of, or guaranteed by, any depository institution. Shares are not insured by the FDIC, Federal Reserve Board or any other agency, and are subject to investment risks, including possible loss of principal amount invested. Neither the fund nor Fidelity Distributions Corporation is a bank.
Semiannual Report
(photo_of_Edward_C_Johnson_3d)
Dear Shareholder:
A slowing U.S. economy triggered an equity market rally during the later stages of summer, boosting most major stock indexes back into positive territory for calendar year 2000. One notable exception, however, was the Dow Jones Industrial Average, which posted a negative return during that timeframe. Fixed-income markets - particularly Treasuries - continued their yearlong trend of strong performance, as nearly every bond sector outperformed the stock market on a year-to-date basis.
While it's impossible to predict the future direction of the markets with any degree of certainty, there are certain basic principles that can help investors plan for their future needs.
The longer your investment time frame, the less likely it is that you will be affected by short-term market volatility. A 10-year investment horizon appropriate for saving for a college education, for example, enables you to weather market cycles in a long-term fund, which may have a higher risk potential, but also has a higher potential rate of return.
An intermediate-length fund could make sense if your investment horizon is two to four years, while a short-term bond fund could be the right choice if you need your money in one or two years.
If your time horizon is less than a year, you might want to consider moving some of your bond investment into a money market fund. These funds seek income and a stable share price by investing in high-quality, short-term investments. Of course, it's important to remember that an investment in a money market fund is not insured or guaranteed by the Federal Deposit Insurance Corporation or any other government agency. Although money market funds seek to preserve the value of your investment at $1.00 per share, it is possible to lose money by investing in these types of funds.
Finally, no matter what your time horizon or portfolio diversity, it makes good sense to follow a regular investment plan, investing a certain amount of money in a fund at the same time each month or quarter and periodically reviewing your overall portfolio. By doing so, you won't get caught up in the excitement of a rapidly rising market, nor will you buy all your shares at market highs. While this strategy - known as dollar cost averaging - won't assure a profit or protect you from a loss in a declining market, it should help you lower the average cost of your purchases. Of course, you should consider your financial ability to continue your purchases through periods of low price levels before undertaking such a strategy.
If you have questions, please call us at 1-800-544-6666, or visit our web site at www.fidelity.com. We are available 24 hours a day, seven days a week to provide you the information you need to make the investments that are right for you.
Best regards,
/s/Edward C. Johnson 3d
Edward C. Johnson 3d
Semiannual Report
There are several ways to evaluate a fund's historical performance. You can look at the total percentage change in value, the average annual percentage change or the growth of a hypothetical $100,000 investment. Total return reflects the change in the value of an investment, assuming reinvestment of the fund's dividend income and capital gains (the profits earned upon the sale of securities that have grown in value). You can also look at the fund's income, as reflected in the fund's yield, to measure performance. If Fidelity had not reimbursed certain fund expenses, the total returns and dividends would have been lower.
Cumulative Total Returns
|
Periods ended August 31, 2000 |
Past 6 |
Past 1 |
Past 5 |
Past 10 |
|
Fidelity US Bond Index |
5.25% |
7.24% |
36.62% |
118.59% |
|
LB Aggregate Bond |
5.53% |
7.56% |
37.27% |
117.24% |
|
Intermediate US Government Funds |
4.74% |
6.11% |
30.09% |
91.42% |
Cumulative total returns show the fund's performance in percentage terms over a set period - in this case, six months, one year, five years or 10 years. For example, if you had invested $1,000 in a fund that had a 5% return over the past year, the value of your investment would be $1,050. You can compare the fund's returns to the performance of the Lehman Brothers Aggregate Bond Index - a market value-weighted index of investment-grade fixed-rate debt issues, including government, corporate, asset-backed, and mortgage-backed securities, with maturities of one year or more. To measure how the fund's performance stacked up against its peers, you can compare it to the intermediate U.S. government funds average, which reflects the performance of mutual funds with similar objectives tracked by Lipper Inc. The past six months average represents a peer group of 127 mutual funds. These benchmarks reflect reinvestment of dividends and capital gains, if any, and exclude the effect of sales charges.
Average Annual Total Returns
|
Periods ended August 31, 2000 |
Past 1 |
Past 5 |
Past 10 |
|
Fidelity US Bond Index |
7.24% |
6.44% |
8.13% |
|
LB Aggregate Bond |
7.56% |
6.54% |
8.07% |
|
Intermediate US Government Funds |
6.11% |
5.39% |
6.68% |
Average annual total returns take the fund's cumulative return and show you what would have happened if the fund had performed at a constant rate each year. (Note: Lipper calculates average annual total returns by annualizing each fund's total return, then taking an arithmetic average. This may produce a different figure than that obtained by averaging the cumulative total returns and annualizing the result.)
Semiannual Report
Performance - continued
$100,000 Over 10 Years

$100,000 Over 10 Years: Let's say hypothetically that $100,000 was invested in Fidelity U.S. Bond Index Fund on August 31, 1990. As the chart shows, by August 31, 2000, the value of the investment would have grown to $218,595 - a 118.59% increase on the initial investment. For comparison, look at how the Lehman Brothers Aggregate Bond Index did over the same period. With dividends and capital gains, if any, reinvested, the same $100,000 would have grown to $217,240 - a 117.24% increase.
Understanding
Performance
How a fund did yesterday is no guarantee of how it will do tomorrow. Bond prices, for example, generally move in the opposite direction of interest rates. In turn, the share price, return and yield of a fund that invests in bonds will vary. That means if you sell your shares during a market downturn, you might lose money. But if you can ride out the market's ups and downs, you may have a gain.
3Semiannual Report
Performance - continued
Dividends and Yield
|
Periods ended August 31, 2000 |
Past 1 |
Past 6 |
Past 1 |
|
Dividends per share |
6.03¢ |
35.45¢ |
69.71¢ |
|
Annualized dividend rate |
6.88% |
6.89% |
6.81% |
|
30-day annualized yield |
6.91% |
- |
- |
Dividends per share show the income paid by the fund for a set period. If you annualize this number, based on an average share price of $10.32 over the past one month, $10.20 over the past six months and $10.23 over the past one year, you can compare the fund's income over these three periods. The 30-day annualized yield is a standard formula for all funds based on the yields of the bonds in the fund, averaged over the past 30 days. This figure shows you the yield characteristics of the fund's investments at the end of the period. It also helps you compare funds from different companies on an equal basis. If Fidelity had not reimbursed certain fund expenses during the period shown, the yield would have been 6.75%.
Semiannual Report
An interview with Thomas Silvia, Portfolio Manager of Fidelity U.S. Bond Index Fund(Portfolio Manager photograph)
Q. How did the fund perform, Tom?
A. For the six-month period that ended August 31, 2000, the fund had a total return of 5.25%. To get a sense of how the fund did relative to its competitors, the intermediate U.S. government funds average returned 4.74% for the same six-month period, according to Lipper Inc. Additionally, the Lehman Brothers Aggregate Bond Index returned 5.53%. For the 12-month period that ended August 31, 2000, the fund had a total return of 7.24%. In comparison, the U.S. government funds average returned 6.11% and the Lehman Brothers index returned 7.56% for the same 12-month period.
Q. The overall performance of the bond market steadily improved during the past six months. Can you tell us what was behind investors' renewed optimism about fixed-income investments?
A. Sure. Probably the main reason for the market's better performance over the past six months was anticipation that the Federal Reserve Board might be finished raising interest rates in light of indications that the U.S. economy was slowing. Another reason was that there was a shrinking supply of U.S. Treasury securities due to the growing federal budget surplus. To cut financing costs, the U.S. Treasury Department scaled back its auctions of new Treasury securities and bought back billions of dollars of outstanding debt. While Treasury securities benefited the most from these actions, agency, mortgage, corporate and other types of bonds were boosted as well. Additionally, investors who were concerned about rising volatility in the equity markets increasingly sought out the relative stability of fixed-income investments.
Q. Given that backdrop, how did each of the segments of the Lehman Brothers Aggregate Bond Index perform over the past six months?
A. For the six-month period that ended August 31, 2000, mortgage-backed securities, at about 35% of the index, returned 5.61%; corporate securities, which accounted for nearly 24% of the index, returned 4.68%; agency securities, at about 10% of the index, returned 5.07%; and asset-backed securities, at less than 2% of the index, returned 1.59%. Those returns compared to the 6.14% return of U.S. Treasury securities, which made up about 29% of the index.
Q. Which holdings helped the fund's performance?
A. The fund benefited from its slight overweighting - compared to the Lehman Brothers Aggregate Bond Index - in callable long-term Treasury securities. Because of the government's cutback on the size and frequency of new bond offerings as well as the buyback programs it instituted, longer-term securities started trading on expectations about supply and demand rather than on interest-rate hikes. Anticipating a scarcity of longer-term securities, investors pushed the yields lower and the prices higher even as short-term interest rates and Treasury yields rose. Since many of our long-term Treasury holdings were callable - meaning they carried a covenant that allows the government to buy them back before they mature - the strong demand for them made them among the market's best performers. The fund's performance also was helped by security selection within the Yankee bonds, which are bonds issued by foreign governments or corporations but denominated in U.S. dollars. In particular, we saw strong performance from some of our Yankee holdings in banks such as NatWest, Bank of Tokyo, Norbanken and others.
Semiannual Report
Fund Talk: The Manager's Overview - continued
Q. Which holdings detracted from the fund's performance?
A. Two of our corporate holdings performed particularly poorly. Rite Aid fell in response to the difficulty it encountered in financing its operations and because of accounting irregularities. Holdings in Finova suffered when the company received a credit rating downgrade and questions arose about its long-term profitability.
Q. What's your approach to managing the fund?
A. The fund is designed to produce returns that are in line with the Lehman Brothers Aggregate Bond Index. Since the index is made up of about 6000 individual securities, it would be quite expensive to own everything it contains. So instead, I use a process known as stratified sampling. By that I mean that I assemble a portfolio that replicates the characteristics of the index - including credit quality, maturity, sector and others - by investing in representative securities. Here's how the process works: I manage the fund's allocation to various market sectors to approximate that of the index. I start by determining what portion of securities in the index are Treasuries, mortgages, agencies, corporates and so on. After that, I identify bonds that give the fund the same sector breakdown as the index. I repeat this process with the other characteristics of the index. Then I choose individual securities - based on Fidelity's research - that have the same characteristics I'm looking for but that have the potential to outperform other securities with similar characteristics.
Q. What's your outlook?
A. As I mentioned at the beginning of this discussion, investors appear to be quite hopeful that the Federal Reserve Board has completed its 15-month long campaign to slow the economy and subdue inflation. Whether or not that is the case remains to be seen. That being said, it's probably unlikely that the Fed would raise
Semiannual Report
Fund Talk: The Manager's Overview - continued
interest rates before the November presidential election. But no matter what the direction of interest rates, I'll continue to attempt to keep the fund's performance on track with the Lehman Brothers Aggregate Bond Index.
The views expressed in this report reflect those of the portfolio manager only through the end of the period of the report as stated on the cover and do not necessarily represent the views of Fidelity or any other person in the Fidelity organization. Any such views are subject to change at any time based upon market or other conditions and Fidelity disclaims any responsibility to update such views. These views may not be relied on as investment advice and, because investment decisions for a Fidelity fund are based on numerous factors, may not be relied on as an indication of trading intent on behalf of any Fidelity fund.
Fund Facts
Goal: to provide returns
consistent with those of the
Lehman Brothers Aggregate
Bond Index
Start date: March 8, 1990
Size: as of August 31, 2000,
more than $1.7 billion
Manager: Thomas Silvia, since
1998; manager, various other
Fidelity and Spartan bond
funds; joined Fidelity in 1993
Tom Silvia on the role of agency securities and recent developments in that marketplace:
"Fannie Mae and Freddie Mac are government-sponsored enterprises (GSEs) and, as such, enjoy certain benefits, including a $4.5 billion line of credit from the U.S. Treasury. They purchase home loans from originators such as banks, thrifts and mortgage banks, which they hold for their own investment portfolios. They also pool home loans into mortgage securities. Whether they hold mortgages for their own portfolios or whether they package them as securities, the effect is that cash is freed up so that originators can make new loans. As a result, Fannie Mae and Freddie Mac securities make up a fast-growing share of the government debt markets at a time when the Treasury is limiting its issuance.
"Although the emergency line of credit to the U.S. Treasury has never been tapped, it carries symbolic significance because it traditionally has allowed Fannie Mae and Freddie Mac to borrow at interest rates close to the U.S. government's rate. Renewed government interest in curbing Fannie's and Freddie's line of credit and limiting how much of their securities commercial banks can own have caused their securities to perform poorly recently."
Semiannual Report
|
Quality Diversification as of August 31, 2000 |
||
|
(Moody's Ratings) |
% of fund's investments |
% of fund's investments |
|
Aaa |
70.3 |
70.6 |
|
Aa |
1.9 |
1.8 |
|
A |
11.4 |
10.9 |
|
Baa |
11.3 |
12.0 |
|
Ba and Below |
0.7 |
0.5 |
|
Not Rated |
0.7 |
0.8 |
|
Table excludes short-term investments. Where Moody's ratings are not available, we have used S&P ® ratings. Securities rated as Ba or below were rated investment grade by other nationally recognized rating agencies or assigned an investment grade rating at the time of acquisition by Fidelity. |
|
Average Years to Maturity as of August 31, 2000 |
||
|
|
|
6 months ago |
|
Years |
9.0 |
8.9 |
|
Average years to maturity is based on the average time remaining until principal payments are expected from each of the fund's bonds, weighted by dollar amount. |
|
Duration as of August 31, 2000 |
||
|
|
|
6 months ago |
|
Years |
4.8 |
5.2 |
|
Duration shows how much a bond fund's price fluctuates with changes in comparable interest rates. |
|
Asset Allocation (% of fund's net assets) |
|||||||
|
As of August 31, 2000 * |
As of February 29, 2000 ** |
||||||
 |
Corporate Bonds 22.4% |
|
|
Corporate Bonds 23.2% |
|
||
 |
U.S. Government and Government Agency Obligations 70.0% |
|
|
U.S. Government and Government Agency Obligations 70.3% |
|
||
 |
Asset-Backed |
|
|
Asset-Backed |
|
||
 |
CMOs and Other Mortgage Related Securities 1.5% |
|
|
CMOs and Other Mortgage Related Securities 2.7% |
|
||
 |
Other Investments 1.7% |
|
|
Other Investments 1.3% |
|
||
 |
Short-Term |
|
|
Short-Term |
|
||
|
* Foreign investments |
5.7% |
|
** Foreign investments |
5.7% |
|
||

Semiannual Report
(Unaudited)
Showing Percentage of Net Assets
|
Nonconvertible Bonds - 22.4% |
|||||
|
Moody's Ratings |
Principal Amount (000s) |
Value (Note 1) (000s) |
|||
|
AEROSPACE & DEFENSE - 0.3% |
|||||
|
Defense Electronics - 0.3% |
|||||
|
Raytheon Co. 8.3% 3/1/10 (b) |
Baa2 |
|
$ 5,000 |
$ 5,197 |
|
|
BASIC INDUSTRIES - 1.1% |
|||||
|
Chemicals & Plastics - 0.2% |
|||||
|
Praxair, Inc. 6.75% 3/1/03 |
A3 |
|
4,000 |
3,958 |
|
|
Paper & Forest Products - 0.9% |
|||||
|
Abitibi-Consolidated, Inc. 8.55% 8/1/10 |
Baa3 |
|
2,370 |
2,396 |
|
|
Fort James Corp. 6.625% 9/15/04 |
Baa2 |
|
5,791 |
5,550 |
|
|
Westvaco Corp. 8.2% 1/15/30 |
A3 |
|
7,000 |
7,008 |
|
|
|
14,954 |
||||
|
TOTAL BASIC INDUSTRIES |
18,912 |
||||
|
CONSTRUCTION & REAL ESTATE - 0.5% |
|||||
|
Real Estate - 0.1% |
|||||
|
Arden Realty LP 8.875% 3/1/05 |
Baa3 |
|
2,180 |
2,195 |
|
|
Real Estate Investment Trusts - 0.4% |
|||||
|
Avalonbay Communities, Inc. 6.58% 2/15/04 |
Baa1 |
|
2,000 |
1,935 |
|
|
CenterPoint Properties Trust 6.75% 4/1/05 |
Baa2 |
|
4,600 |
4,347 |
|
|
|
6,282 |
||||
|
TOTAL CONSTRUCTION & REAL ESTATE |
8,477 |
||||
|
ENERGY - 0.9% |
|||||
|
Oil & Gas - 0.9% |
|||||
|
Duke Energy Field Services LLC 7.875% 8/16/10 |
Baa2 |
|
4,000 |
4,018 |
|
|
Oryx Energy Co. 8.125% 10/15/05 |
Baa1 |
|
7,935 |
8,153 |
|
|
Petro-Canada 7% 11/15/28 |
A3 |
|
1,920 |
1,754 |
|
|
Phillips Petroleum Co. 8.75% 5/25/10 |
Baa2 |
|
2,345 |
2,531 |
|
|
|
16,456 |
||||
|
FINANCE - 10.8% |
|||||
|
Banks - 4.3% |
|||||
|
Bank of America Corp. 7.8% 2/15/10 |
Aa3 |
|
4,700 |
4,789 |
|
|
Bank of Tokyo-Mitsubishi Ltd. 8.4% 4/15/10 |
A3 |
|
1,700 |
1,734 |
|
|
Bank One Capital III 8.75% 9/1/30 |
Aa3 |
|
3,300 |
3,296 |
|
|
Bank One Corp. 7.875% 8/1/10 |
A1 |
|
1,950 |
1,954 |
|
|
BankBoston NA 7% 9/15/07 |
A2 |
|
5,143 |
5,007 |
|
|
Barnett Banks, Inc. 10.875% 3/15/03 |
Aa3 |
|
1,020 |
1,107 |
|
|
Nonconvertible Bonds - continued |
|||||
|
Moody's Ratings |
Principal Amount (000s) |
Value (Note 1) (000s) |
|||
|
FINANCE - continued |
|||||
|
Banks - continued |
|||||
|
Chase Manhattan Corp. 7.125% 2/1/07 |
A1 |
|
$ 5,000 |
$ 4,946 |
|
|
Commonwealth Bank of Australia 8.5% 6/1/10 |
A1 |
|
1,100 |
1,159 |
|
|
Den Danske Bank AS 6.375% 6/15/08 (b)(d) |
A1 |
|
7,770 |
7,304 |
|
|
First Tennessee National Corp. 6.75% 11/15/05 |
A3 |
|
1,540 |
1,452 |
|
|
Kansallis-Osake-Pankki (NY Branch) yankee |
A1 |
|
3,110 |
3,236 |
|
|
Korea Development Bank 7.375% 9/17/04 |
Baa2 |
|
4,500 |
4,413 |
|
|
Mellon Financial Co. 6.7% 3/1/08 |
A2 |
|
5,000 |
4,777 |
|
|
Merita Bank Ltd. yankee 6.5% 1/15/06 |
A1 |
|
2,100 |
2,006 |
|
|
National Westminster Bank PLC 7.375% 10/1/09 |
Aa3 |
|
5,000 |
4,950 |
|
|
Nordbanken AB 7.25% 11/12/09 (d) |
A1 |
|
10,000 |
9,953 |
|
|
Popular, Inc. 6.2% 4/30/01 |
A3 |
|
1,325 |
1,314 |
|
|
Providian National Bank: |
|
|
|
|
|
|
6.25% 5/7/01 |
Baa3 |
|
3,390 |
3,354 |
|
|
6.75% 3/15/02 |
Baa3 |
|
1,310 |
1,290 |
|
|
State Street Corp. 7.65% 6/15/10 |
A1 |
|
5,000 |
5,072 |
|
|
Union Planters Corp. 6.75% 11/1/05 |
Baa2 |
|
1,500 |
1,427 |
|
|
|
74,540 |
||||
|
Credit & Other Finance - 5.5% |
|||||
|
Ahmanson Capital Trust I 8.36% 12/1/26 (b) |
A3 |
|
4,800 |
4,278 |
|
|
Aristar, Inc. 6% 5/15/02 |
A3 |
|
1,600 |
1,563 |
|
|
AT&T Capital Corp. 6.25% 5/15/01 |
A1 |
|
2,850 |
2,825 |
|
|
CIT Group, Inc. 7.375% 3/15/03 |
A1 |
|
1,500 |
1,497 |
|
|
Countrywide Funding Corp. 6.45% 2/27/03 |
A3 |
|
5,000 |
4,897 |
|
|
Edison Mission Energy Funding Corp. 6.77% 9/15/03 (b) |
Baa1 |
|
3,190 |
3,086 |
|
|
Finova Capital Corp. 7.25% 11/8/04 |
Ba1 |
|
3,000 |
2,093 |
|
|
First Security Capital I 8.41% 12/15/26 |
A3 |
|
3,000 |
2,826 |
|
|
Ford Motor Credit Co.: |
|
|
|
|
|
|
5.75% 2/23/04 |
A2 |
|
8,000 |
7,608 |
|
|
7.875% 6/15/10 |
A2 |
|
7,000 |
7,028 |
|
|
General Motors Acceptance Corp. 5.85% 1/14/09 |
A2 |
|
10,000 |
8,920 |
|
|
Household Finance Corp. 8% 5/9/05 |
A2 |
|
5,000 |
5,098 |
|
|
MMI Capital Trust I 7.625% 12/15/27 |
Ba1 |
|
9,000 |
8,024 |
|
|
PNC Funding Corp. 7.5% 11/1/09 |
A3 |
|
7,000 |
6,994 |
|
|
Popular North America, Inc. 7.375% 9/15/01 |
A3 |
|
2,540 |
2,535 |
|
|
Sears Roebuck Acceptance Corp. 6.25% 5/1/09 |
A3 |
|
3,000 |
2,649 |
|
|
Nonconvertible Bonds - continued |
|||||
|
Moody's Ratings |
Principal Amount (000s) |
Value (Note 1) (000s) |
|||
|
FINANCE - continued |
|||||
|
Credit & Other Finance - continued |
|||||
|
Spear, Leeds & Kellogg LP/SLK Capital Corp. 8.25% 8/15/05 (b) |
A3 |
|
$ 5,000 |
$ 5,021 |
|
|
Sprint Capital Corp. 5.7% 11/15/03 |
Baa1 |
|
4,000 |
3,805 |
|
|
Textron Financial Corp. 7.125% 12/9/04 |
A2 |
|
7,000 |
6,973 |
|
|
Trizec Finance Ltd. yankee 10.875% 10/15/05 |
Baa3 |
|
1,470 |
1,492 |
|
|
TXU Eastern Funding 6.75% 5/15/09 |
Baa1 |
|
1,200 |
1,087 |
|
|
U.S. West Capital Funding, Inc. 6.875% 7/15/28 |
Baa1 |
|
5,000 |
4,328 |
|
|
|
94,627 |
||||
|
Insurance - 0.5% |
|||||
|
American General Corp. 7.5% 8/11/10 |
A2 |
|
5,000 |
4,986 |
|
|
Metropolitan Life Insurance Co. 6.3% 11/1/03 (b) |
A1 |
|
3,560 |
3,442 |
|
|
|
8,428 |
||||
|
Securities Industry - 0.5% |
|||||
|
Amvescap PLC yankee 6.375% 5/15/03 |
A3 |
|
4,835 |
4,658 |
|
|
Lehman Brothers Holdings 7% 5/15/03 |
A3 |
|
4,000 |
3,964 |
|
|
|
8,622 |
||||
|
TOTAL FINANCE |
186,217 |
||||
|
INDUSTRIAL MACHINERY & EQUIPMENT - 0.4% |
|||||
|
Tyco International Group SA: |
|
|
|
|
|
|
6.875% 9/5/02 |
Baa1 |
|
5,150 |
5,109 |
|
|
yankee 6.375% 6/15/05 |
Baa1 |
|
2,255 |
2,164 |
|
|
TOTAL INDUSTRIAL MACHINERY & EQUIPMENT |
7,273 |
||||
|
MEDIA & LEISURE - 1.9% |
|||||
|
Broadcasting - 1.3% |
|||||
|
British Sky Broadcasting Group PLC 7.3% 10/15/06 |
Baa3 |
|
3,000 |
2,724 |
|
|
Continental Cablevision, Inc. 8.3% 5/15/06 |
A2 |
|
5,000 |
5,142 |
|
|
Hearst-Argyle Television, Inc. 7.5% 11/15/27 |
Baa3 |
|
5,000 |
4,430 |
|
|
Nielsen Media Research, Inc. 7.6% 6/15/09 |
A3 |
|
2,270 |
2,238 |
|
|
Shaw Communications, Inc. 8.25% 4/11/10 |
Baa2 |
|
2,230 |
2,277 |
|
|
TCI Communications, Inc. 8.75% 8/1/15 |
A2 |
|
5,535 |
5,824 |
|
|
|
22,635 |
||||
|
Nonconvertible Bonds - continued |
|||||
|
Moody's Ratings |
Principal Amount (000s) |
Value (Note 1) (000s) |
|||
|
MEDIA & LEISURE - continued |
|||||
|
Publishing - 0.6% |
|||||
|
News America, Inc. 7.3% 4/30/28 |
Baa3 |
|
$ 5,000 |
$ 4,418 |
|
|
Time Warner Entertainment Co. LP 8.375% 7/15/33 |
Baa2 |
|
6,000 |
6,210 |
|
|
|
10,628 |
||||
|
TOTAL MEDIA & LEISURE |
33,263 |
||||
|
NONDURABLES - 0.6% |
|||||
|
Beverages - 0.2% |
|||||
|
Diageo Capital PLC 7.25% 11/1/09 |
A1 |
|
4,000 |
3,963 |
|
|
Foods - 0.3% |
|||||
|
ConAgra, Inc.: |
|
|
|
|
|
|
5.5% 10/15/02 |
Baa1 |
|
2,400 |
2,298 |
|
|
6.7% 8/1/27 |
Baa1 |
|
4,000 |
3,713 |
|
|
|
6,011 |
||||
|
Tobacco - 0.1% |
|||||
|
Philip Morris Companies, Inc. 7% 7/15/05 |
A2 |
|
1,015 |
971 |
|
|
TOTAL NONDURABLES |
10,945 |
||||
|
RETAIL & WHOLESALE - 0.9% |
|||||
|
Drug Stores - 0.1% |
|||||
|
Rite Aid Corp. 6.5% 12/15/05 (b) |
Caa1 |
|
4,740 |
2,038 |
|
|
General Merchandise Stores - 0.6% |
|||||
|
Federated Department Stores, Inc.: |
|
|
|
|
|
|
6.79% 7/15/27 |
Baa1 |
|
1,800 |
1,733 |
|
|
8.5% 6/1/10 |
Baa1 |
|
8,000 |
8,053 |
|
|
|
9,786 |
||||
|
Grocery Stores - 0.2% |
|||||
|
Safeway, Inc. 7.5% 9/15/09 |
Baa2 |
|
3,000 |
2,962 |
|
|
TOTAL RETAIL & WHOLESALE |
14,786 |
||||
|
SERVICES - 0.3% |
|||||
|
Leasing & Rental - 0.3% |
|||||
|
Hertz Corp. 7.625% 8/15/07 |
A3 |
|
4,605 |
4,590 |
|
|
Nonconvertible Bonds - continued |
|||||
|
Moody's Ratings |
Principal Amount (000s) |
Value (Note 1) (000s) |
|||
|
TECHNOLOGY - 0.6% |
|||||
|
Communications Equipment - 0.1% |
|||||
|
Corning, Inc. 6.85% 3/1/29 |
A2 |
|
$ 2,330 |
$ 2,106 |
|
|
Computers & Office Equipment - 0.5% |
|||||
|
Comdisco, Inc. 7.25% 9/1/02 |
Baa1 |
|
2,660 |
2,579 |
|
|
Compaq Computer Corp. 7.45% 8/1/02 |
Baa2 |
|
4,900 |
4,899 |
|
|
|
7,478 |
||||
|
TOTAL TECHNOLOGY |
9,584 |
||||
|
TRANSPORTATION - 0.9% |
|||||
|
Air Transportation - 0.5% |
|||||
|
Continental Airlines, Inc. pass thru trust certificates 7.42% 10/1/08 |
Baa1 |
|
1,332 |
1,307 |
|
|
Delta Air Lines, Inc. 7.9% 12/15/09 |
Baa3 |
|
7,000 |
6,709 |
|
|
|
8,016 |
||||
|
Railroads - 0.4% |
|||||
|
Canadian National Railway Co. 6.9% 7/15/28 |
Baa2 |
|
3,150 |
2,769 |
|
|
CSX Corp. 6.46% 6/22/05 |
Baa2 |
|
2,000 |
1,896 |
|
|
Wisconsin Central Transportation Corp. 6.625% 4/15/08 |
Baa2 |
|
3,150 |
2,866 |
|
|
|
7,531 |
||||
|
TOTAL TRANSPORTATION |
15,547 |
||||
|
UTILITIES - 3.2% |
|||||
|
Electric Utility - 1.1% |
|||||
|
Avon Energy Partners Holdings: |
|
|
|
|
|
|
6.46% 3/4/08 (b) |
Baa2 |
|
5,000 |
4,518 |
|
|
6.73% 12/11/02 (b) |
Baa2 |
|
4,450 |
4,365 |
|
|
Dominion Resources, Inc. 8.125% 6/15/10 |
Baa1 |
|
2,695 |
2,759 |
|
|
Israel Electric Corp. Ltd. 7.1% 12/15/07 (b) |
A3 |
|
3,000 |
2,831 |
|
|
Massachusetts Electric Co. 6.78% 11/20/06 |
A1 |
|
2,000 |
1,985 |
|
|
Niagara Mohawk Power Corp. 8.875% 5/15/07 |
Baa3 |
|
1,205 |
1,263 |
|
|
Texas Utilities Electric Co. 6.75% 4/1/03 |
A3 |
|
1,575 |
1,562 |
|
|
|
19,283 |
||||
|
Gas - 1.2% |
|||||
|
Enron Corp. 6.95% 7/15/28 |
Baa2 |
|
7,000 |
6,257 |
|
|
Enserch Corp. 6.25% 1/1/03 |
Baa2 |
|
4,375 |
4,263 |
|
|
Nonconvertible Bonds - continued |
|||||
|
Moody's Ratings |
Principal Amount (000s) |
Value (Note 1) (000s) |
|||
|
UTILITIES - continued |
|||||
|
Gas - continued |
|||||
|
Reliant Energy Resources Corp. 8.125% 7/15/05 (b) |
Baa1 |
|
$ 6,700 |
$ 6,760 |
|
|
Southwest Gas Corp. 9.75% 6/15/02 |
Baa2 |
|
3,020 |
3,116 |
|
|
|
20,396 |
||||
|
Telephone Services - 0.9% |
|||||
|
Cable & Wireless Optus Ltd. 8% 6/22/10 (b) |
Baa1 |
|
1,800 |
1,836 |
|
|
Deutsche Telekom International Finance BV 8.25% 6/15/30 |
Aa2 |
|
5,000 |
5,056 |
|
|
Telecomunicaciones de Puerto Rico, Inc. 6.65% 5/15/06 |
Baa2 |
|
1,990 |
1,870 |
|
|
Teleglobe Canada, Inc. 7.7% 7/20/29 |
Baa1 |
|
5,000 |
4,723 |
|
|
WorldCom, Inc. 8.875% 1/15/06 |
A3 |
|
2,014 |
2,076 |
|
|
|
15,561 |
||||
|
TOTAL UTILITIES |
55,240 |
||||
|
TOTAL NONCONVERTIBLE BONDS (Cost $396,784) |
386,487 |
||||
|
U.S. Government and Government Agency Obligations - 34.9% |
|||||
|
|
|||||
|
U.S. Government Agency Obligations - 8.6% |
|||||
|
Fannie Mae: |
|
|
|
|
|
|
5.25% 1/15/09 |
Aaa |
|
21,500 |
19,259 |
|
|
6.5% 8/15/04 |
Aaa |
|
11,500 |
11,396 |
|
|
6.5% 4/29/09 |
Aaa |
|
17,230 |
16,301 |
|
|
7% 7/15/05 |
Aaa |
|
4,000 |
4,037 |
|
|
7.25% 1/15/10 |
Aaa |
|
9,000 |
9,221 |
|
|
7.25% 5/15/30 |
Aaa |
|
23,500 |
24,721 |
|
|
Federal Agricultural Mortgage Corp. 6.92% 8/10/02 |
Aaa |
|
1,040 |
1,042 |
|
|
Federal National Mortgage Association: |
|
|
|
|
|
|
0% 4/8/03 |
Aaa |
|
1,000 |
841 |
|
|
0% 10/8/04 |
Aaa |
|
1,000 |
760 |
|
|
Freddie Mac 5.75% 3/15/09 |
Aaa |
|
12,000 |
11,111 |
|
|
Government Loan Trusts (assets of Trust
guaranteed by U.S. Government through
Agency for International Development) |
Aaa |
|
2,296 |
2,401 |
|
|
U.S. Government and Government Agency Obligations - continued |
|||||
|
Moody's Ratings |
Principal Amount (000s) |
Value (Note 1) (000s) |
|||
|
U.S. Government Agency Obligations - continued |
|||||
|
Government Trust Certificates (assets of Trust guaranteed by U.S. Government through Defense Security Assistance Agency): |
|
|
|
|
|
|
Class 1-C, 9.25% 11/15/01 |
Aaa |
|
$ 256 |
$ 260 |
|
|
Class 2-E, 9.4% 5/15/02 |
Aaa |
|
505 |
511 |
|
|
Class 3-T, 9.625% 5/15/02 |
Aaa |
|
574 |
582 |
|
|
Guaranteed Export Trust Certificates (assets of Trust guaranteed by U.S. Government through Export-Import Bank): |
|
|
|
|
|
|
Series 1993-C, 5.2% 10/15/04 |
Aaa |
|
799 |
771 |
|
|
Series 1993-D, 5.23% 5/15/05 |
Aaa |
|
380 |
365 |
|
|
Series 1995-A, 6.28% 6/15/04 |
Aaa |
|
6,381 |
6,288 |
|
|
Series 1995-B, 6.13% 6/15/04 |
Aaa |
|
8,000 |
7,861 |
|
|
Guaranteed Trade Trust Certificates (assets of
Trust guaranteed by U.S. Government through
Export-Import Bank) Series 1997-A, |
Aaa |
|
2,500 |
2,467 |
|
|
Overseas Private Investment Corp. U.S. Government guaranteed participation certificate: |
|
|
|
|
|
|
Series 1994-195, 6.08% 8/15/04 (callable) |
Aaa |
|
1,065 |
1,053 |
|
|
Series 1998-196A, 5.926% 6/15/05 (callable) |
- |
|
2,180 |
2,142 |
|
|
Private Export Funding Corp. secured: |
|
|
|
|
|
|
5.31% 11/15/03 (b) |
Aaa |
|
5,000 |
4,781 |
|
|
5.48% 9/15/03 |
Aaa |
|
1,138 |
1,114 |
|
|
5.65% 3/15/03 |
Aaa |
|
956 |
942 |
|
|
5.8% 2/1/04 |
Aaa |
|
1,330 |
1,305 |
|
|
6.86% 4/30/04 |
Aaa |
|
546 |
544 |
|
|
Tennessee Valley Authority 7.125% 5/1/30 |
Aaa |
|
6,280 |
6,433 |
|
|
U.S. Department of Housing and Urban Development government guaranteed participation certificates Series 1999-A: |
|
|
|
|
|
|
5.75% 8/1/06 |
- |
|
7,500 |
7,146 |
|
|
5.96% 8/1/09 |
- |
|
3,600 |
3,421 |
|
|
TOTAL U.S. GOVERNMENT AGENCY OBLIGATIONS |
149,076 |
||||
|
U.S. Treasury Obligations - 26.3% |
|||||
|
U.S. Treasury Bonds: |
|
|
|
|
|
|
6.125% 11/15/27 |
Aaa |
|
10,000 |
10,334 |
|
|
6.25% 5/15/30 |
Aaa |
|
1,700 |
1,840 |
|
|
8% 11/15/21 |
Aaa |
|
4,610 |
5,747 |
|
|
U.S. Government and Government Agency Obligations - continued |
|||||
|
Moody's Ratings |
Principal Amount (000s) |
Value (Note 1) (000s) |
|||
|
U.S. Treasury Obligations - continued |
|||||
|
U.S. Treasury Bonds: - continued |
|
|
|
|
|
|
8.125% 5/15/21 |
Aaa |
|
$ 2,000 |
$ 2,514 |
|
|
8.75% 5/15/17 |
Aaa |
|
45,790 |
59,176 |
|
|
8.875% 8/15/17 |
Aaa |
|
40,000 |
52,325 |
|
|
12% 8/15/13 |
Aaa |
|
35,300 |
48,135 |
|
|
14% 11/15/11 |
Aaa |
|
66,480 |
92,916 |
|
|
U.S. Treasury Notes: |
|
|
|
|
|
|
5.75% 8/15/10 |
Aaa |
|
3,300 |
3,303 |
|
|
5.875% 10/31/01 |
Aaa |
|
122,000 |
121,352 |
|
|
5.875% 11/15/04 |
Aaa |
|
19,000 |
18,893 |
|
|
U.S. Treasury Notes - coupon STRIPS 0% 11/15/11 |
Aaa |
|
72,000 |
37,228 |
|
|
TOTAL U.S. TREASURY OBLIGATIONS |
453,763 |
||||
|
TOTAL U.S. GOVERNMENT AND (Cost $606,144) |
602,839 |
||||
|
U.S. Government Agency - Mortgage Securities - 35.1% |
|||||
|
|
|||||
|
Fannie Mae - 23.4% |
|||||
|
5.5% 1/1/09 to 4/1/11 |
Aaa |
|
6,376 |
6,070 |
|
|
6% 3/1/11 to 2/1/29 |
Aaa |
|
49,799 |
46,928 |
|
|
6% 4/1/14 (c) |
Aaa |
|
341 |
321 |
|
|
6.5% 12/1/08 to 9/1/30 |
Aaa |
|
80,459 |
77,050 |
|
|
7% 3/1/15 to 6/1/30 |
Aaa |
|
99,493 |
97,237 |
|
|
7.5% 11/1/07 to 8/1/30 |
Aaa |
|
132,728 |
131,835 |
|
|
8% 11/1/08 to 7/1/30 |
Aaa |
|
38,644 |
39,041 |
|
|
8.5% 6/1/17 to 8/1/23 |
Aaa |
|
3,562 |
3,647 |
|
|
9.5% 12/1/09 to 9/1/21 |
Aaa |
|
1,774 |
1,857 |
|
|
10.75% 9/1/10 to 5/1/14 |
Aaa |
|
135 |
144 |
|
|
11.25% 5/1/14 |
Aaa |
|
19 |
21 |
|
|
11.5% 8/1/14 |
Aaa |
|
67 |
72 |
|
|
12.5% 1/1/15 |
Aaa |
|
35 |
38 |
|
|
13.5% 11/1/14 |
Aaa |
|
12 |
14 |
|
|
14% 3/1/12 to 9/1/13 |
Aaa |
|
108 |
120 |
|
|
TOTAL FANNIE MAE |
404,395 |
||||
|
U.S. Government Agency - Mortgage Securities - continued |
|||||
|
Moody's Ratings |
Principal Amount (000s) |
Value (Note 1) (000s) |
|||
|
Freddie Mac - 4.1% |
|||||
|
6.5% 10/1/07 |
Aaa |
|
$ 362 |
$ 357 |
|
|
7.5% 9/1/15 to 9/1/30 |
Aaa |
|
5,062 |
5,049 |
|
|
8% 7/1/16 to 2/1/28 |
Aaa |
|
1,819 |
1,842 |
|
|
8.5% 9/1/19 to 4/1/30 |
Aaa |
|
52,454 |
53,607 |
|
|
8.5% 8/1/30 (c) |
Aaa |
|
7,500 |
7,664 |
|
|
9% 11/1/01 to 10/1/16 |
Aaa |
|
204 |
210 |
|
|
9.5% 10/1/08 to 9/1/18 |
Aaa |
|
460 |
471 |
|
|
10% 6/1/20 |
Aaa |
|
59 |
62 |
|
|
10.5% 5/1/09 to 12/1/15 |
Aaa |
|
111 |
116 |
|
|
11% 5/1/15 to 9/1/20 |
Aaa |
|
1,314 |
1,418 |
|
|
11.5% 8/1/13 to 10/1/15 |
Aaa |
|
56 |
60 |
|
|
11.75% 9/1/13 |
Aaa |
|
29 |
31 |
|
|
12% 2/1/13 to 7/1/15 |
Aaa |
|
34 |
37 |
|
|
12.75% 8/1/12 to 10/1/13 |
Aaa |
|
38 |
42 |
|
|
13.5% 12/1/14 |
Aaa |
|
187 |
212 |
|
|
TOTAL FREDDIE MAC |
71,178 |
||||
|
Government National Mortgage Association - 7.6% |
|||||
|
6% 12/15/08 to 4/15/09 |
Aaa |
|
1,328 |
1,293 |
|
|
6.5% 6/15/23 to 12/15/28 |
Aaa |
|
19,211 |
18,470 |
|
|
7% 12/15/22 to 12/15/28 |
Aaa |
|
30,081 |
29,520 |
|
|
7.5% 2/15/17 to 9/15/28 |
Aaa |
|
55,160 |
55,182 |
|
|
8% 11/15/16 to 9/1/30 (f) |
Aaa |
|
23,624 |
23,983 |
|
|
8.5% 7/15/27 to 2/15/30 |
Aaa |
|
1,062 |
1,088 |
|
|
9.5% 3/15/23 |
Aaa |
|
82 |
86 |
|
|
10.5% 5/20/16 to 1/20/18 |
Aaa |
|
1,262 |
1,358 |
|
|
TOTAL GOVERNMENT NATIONAL MORTGAGE ASSOCIATION |
130,980 |
||||
|
TOTAL U.S. GOVERNMENT AGENCY - MORTGAGE SECURITIES (Cost $612,379) |
606,553 |
||||
|
Asset-Backed Securities - 1.5% |
|||||
|
|
|||||
|
ANRC Auto Owner Trust 7.06% 5/17/04 |
Aaa |
|
5,000 |
5,011 |
|
|
BankAmerica Manufacturing Housing Contract Trust V 6.2% 4/10/09 |
Aaa |
|
2,390 |
2,350 |
|
|
CIT Marine Trust 5.8% 4/15/10 |
Aaa |
|
5,000 |
4,889 |
|
|
CS First Boston Mortgage Securities Corp. |
Aaa |
|
2,258 |
2,256 |
|
|
Key Auto Finance Trust 6.65% 10/15/03 |
Baa3 |
|
153 |
153 |
|
|
Asset-Backed Securities - continued |
|||||
|
Moody's Ratings |
Principal Amount (000s) |
Value (Note 1) (000s) |
|||
|
Olympic Automobile Receivables Trust |
Aaa |
|
$ 322 |
$ 320 |
|
|
Sears Credit Account Master Trust II: |
|
|
|
|
|
|
6.2% 7/16/07 |
Aaa |
|
5,000 |
4,928 |
|
|
7.5% 11/15/07 |
A2 |
|
5,000 |
5,005 |
|
|
WFS Financial Owner Trust 6.9% 12/20/03 |
Aaa |
|
721 |
720 |
|
|
TOTAL ASSET-BACKED SECURITIES (Cost $25,724) |
25,632 |
||||
|
Commercial Mortgage Securities - 1.5% |
|||||
|
|
|||||
|
Allied Capital Commercial Mortgage Trust sequential pay Series 1998-1 Class A, 6.31% 1/25/28 (b) |
Aaa |
|
998 |
984 |
|
|
First Union-Lehman Brothers Commercial Mortgage Trust sequential pay Series 1997-C2 Class B, 6.79% 11/18/29 |
Aa2 |
|
15,000 |
14,293 |
|
|
GS Mortgage Securities Corp. II Series 1999-GSFL II Class E, 8.6174% 11/13/13 (b)(d) |
Baa2 |
|
6,000 |
5,990 |
|
|
Heller Financial Commercial Mortgage Asset Corp. sequential pay Series 2000-PH1 Class A1, 7.715% 9/15/08 |
Aaa |
|
4,887 |
4,997 |
|
|
TOTAL COMMERCIAL MORTGAGE SECURITIES (Cost $26,878) |
26,264 |
||||
|
Foreign Government and Government Agency Obligations (e) - 1.7% |
|||||
|
|
|||||
|
Chile Republic 6.875% 4/28/09 |
Baa1 |
|
1,500 |
1,410 |
|
|
Korean Republic yankee 8.875% 4/15/08 |
Baa2 |
|
5,000 |
5,276 |
|
|
Newfoundland Province yankee 11.625% 10/15/07 |
Baa1 |
|
4,000 |
4,943 |
|
|
Quebec Province yankee 7.5% 7/15/23 |
A2 |
|
10,000 |
10,004 |
|
|
United Mexican States 9.875% 2/1/10 |
Baa3 |
|
6,800 |
7,319 |
|
|
TOTAL FOREIGN GOVERNMENT AND (Cost $30,409) |
28,952 |
||||
|
Cash Equivalents - 3.7% |
|||
|
Maturity Amount (000s) |
Value (Note 1) (000s) |
||
|
Investments in repurchase agreements (U.S. Government Obligations), in a joint trading account at 6.67%, |
$ 64,334 |
$ 64,322 |
|
|
TOTAL INVESTMENT PORTFOLIO - 100.8% (Cost $1,762,640) |
1,741,049 |
||
|
NET OTHER ASSETS - (0.8)% |
(13,282) |
||
|
NET ASSETS - 100% |
$ 1,727,767 |
||
|
Legend |
|
(a) S&P credit ratings are used in the absence of a rating by Moody's Investors Service, Inc. |
|
(b) Security exempt from registration under Rule 144A of the Securities Act of 1933. These securities may be resold in transactions exempt from registration, normally to qualified institutional buyers. At the period end, the value of these securities amounted to $62,431,000 or 3.6% of net assets. |
|
(c) Security purchased on a delayed delivery or when-issued basis. |
|
(d) The coupon rate shown on floating or adjustable rate securities represents the rate at period end. |
|
(e) For foreign government obligations not individually rated by S&P or Moody's, the ratings listed have been assigned by FMR, the fund's investment adviser, based principally on S&P and Moody's ratings of the sovereign credit of the issuing government. |
|
(f) A portion of this security is subject to a forward commitment to sell. |
|
Other Information |
|
The composition of long-term debt holdings as a percentage of total value of investments in securities, is as follows (ratings are unaudited): |
|
Moody's Ratings |
S&P Ratings |
|||
|
Aaa, Aa, A |
83.6% |
|
AAA, AA, A |
75.8% |
|
Baa |
11.3% |
|
BBB |
12.8% |
|
Ba |
0.6% |
|
BB |
0.7% |
|
B |
0.0% |
|
B |
0.1% |
|
Caa |
0.1% |
|
CCC |
0.0% |
|
Ca, C |
0.0% |
|
CC, C |
0.0% |
|
|
|
|
D |
0.0% |
|
The percentage not rated by Moody's or S&P amounted to 0.7%. |
|
Income Tax Information |
|
At August 31, 2000, the aggregate cost of investment securities for income tax purposes was $1,762,656,000. Net unrealized depreciation aggregated $21,607,000, of which $12,978,000 related to appreciated investment securities and $34,585,000 related to depreciated investment securities. |
|
At February 29, 2000, the fund had a capital loss carryforward of approximately $22,625,000 all of which will expire on February 29, 2008. |
See accompanying notes which are an integral part of the financial statements.
Semiannual Report
Statement of Assets and Liabilities
|
Amounts in thousands (except per-share amount) |
August 31, 2000 (Unaudited) |
|
|
Assets |
|
|
|
Investment in securities, at value (including repurchase agreements of $64,322) (cost $1,762,640) - |
|
$ 1,741,049 |
|
Cash |
|
322 |
|
Receivable for investments sold |
|
8,829 |
|
Receivable for fund shares sold |
|
2,353 |
|
Interest receivable |
|
21,276 |
|
Total assets |
|
1,773,829 |
|
Liabilities |
|
|
|
Payable for investments purchased |
$ 35,637 |
|
|
Delayed delivery |
7,986 |
|
|
Payable for fund shares redeemed |
1,574 |
|
|
Distributions payable |
350 |
|
|
Accrued management fee |
218 |
|
|
Other payables and accrued expenses |
297 |
|
|
Total liabilities |
|
46,062 |
|
Net Assets |
|
$ 1,727,767 |
|
Net Assets consist of: |
|
|
|
Paid in capital |
|
$ 1,791,624 |
|
Undistributed net investment income |
|
667 |
|
Accumulated undistributed net realized |
|
(42,933) |
|
Net unrealized appreciation (depreciation) on investments |
|
(21,591) |
|
Net Assets, for 167,039 shares outstanding |
|
$ 1,727,767 |
|
Net Asset Value, offering price and redemption price |
|
$10.34 |
See accompanying notes which are an integral part of the financial statements.
Semiannual Report
Financial Statements - continued
Statement of Operations
|
Amounts in thousands |
Six months ended August 31, 2000 (Unaudited) |
|
|
Investment Income Interest |
|
$ 58,306 |
|
Security lending |
|
29 |
|
Total Income |
|
58,335 |
|
Expenses |
|
|
|
Management fee |
$ 2,578 |
|
|
Transfer agent fees |
1,069 |
|
|
Accounting and security lending fees |
177 |
|
|
Non-interested trustees' compensation |
3 |
|
|
Custodian fees and expenses |
60 |
|
|
Registration fees |
65 |
|
|
Audit |
25 |
|
|
Legal |
4 |
|
|
Total expenses before reductions |
3,981 |
|
|
Expense reductions |
(1,474) |
2,507 |
|
Net investment income |
|
55,828 |
|
Realized and Unrealized Gain (Loss) Net realized gain (loss) on investment securities |
|
(8,611) |
|
Change in net unrealized appreciation (depreciation) |
|
36,780 |
|
Net gain (loss) |
|
28,169 |
|
Net increase (decrease) in net assets resulting |
|
$ 83,997 |
See accompanying notes which are an integral part of the financial statements.
Semiannual Report
Financial Statements - continued
Statement of Changes in Net Assets
|
Amounts in thousands |
Six months ended
August 31, 2000 |
Year ended
February 29, |
|
Increase (Decrease) in Net Assets |
|
|
|
Operations |
$ 55,828 |
$ 93,699 |
|
Net realized gain (loss) |
(8,611) |
(33,761) |
|
Change in net unrealized appreciation (depreciation) |
36,780 |
(44,246) |
|
Net increase (decrease) in net assets resulting |
83,997 |
15,692 |
|
Distributions to shareholders |
(55,981) |
(93,349) |
|
From net realized gain |
- |
(6,645) |
|
In excess of net realized gain |
- |
(762) |
|
Total distributions |
(55,981) |
(100,756) |
|
Share transactions |
458,899 |
940,208 |
|
Reinvestment of distributions |
54,033 |
97,054 |
|
Cost of shares redeemed |
(350,703) |
(709,196) |
|
Net increase (decrease) in net assets resulting |
162,229 |
328,066 |
|
Total increase (decrease) in net assets |
190,245 |
243,002 |
|
Net Assets |
|
|
|
Beginning of period |
1,537,522 |
1,294,520 |
|
End of period (including undistributed net investment income of $667 and $820, respectively) |
$ 1,727,767 |
$ 1,537,522 |
|
Other Information Shares |
|
|
|
Sold |
44,941 |
90,129 |
|
Issued in reinvestment of distributions |
5,288 |
9,331 |
|
Redeemed |
(34,357) |
(68,189) |
|
Net increase (decrease) |
15,872 |
31,271 |
See accompanying notes which are an integral part of the financial statements.
Semiannual Report
Financial Highlights
|
|
Six months ended August 31, 2000 |
Years ended February 28, |
||||
|
|
(Unaudited) |
2000 G |
1999 |
1998 |
1997 |
1996 G |
|
Selected Per-Share Data |
|
|
|
|
|
|
|
Net asset value, beginning of period |
$ 10.170 |
$ 10.800 |
$ 10.800 |
$ 10.480 |
$ 10.710 |
$ 10.250 |
|
Income from Invest- |
.353 D |
.678 D |
.690 D |
.738 D |
.739 D |
.755 |
|
Net realized and
unrealized |
.171 |
(.573) |
(.003) |
.316 |
(.235) |
.460 |
|
Total from investment operations |
.524 |
.105 |
.687 |
1.054 |
.504 |
1.215 |
|
Less Distributions |
|
|
|
|
|
|
|
From net investment income |
(.354) |
(.675) |
(.687) |
(.734) |
(.734) |
(.755) |
|
From net |
- |
(.054) |
- |
- |
- |
- |
|
In excess of net realized gain |
- |
(.006) |
- |
- |
- |
- |
|
Total distributions |
(.354) |
(.735) |
(.687) |
(.734) |
(.734) |
(.755) |
|
Net asset value, end of period |
$ 10.340 |
$ 10.170 |
$ 10.800 |
$ 10.800 |
$ 10.480 |
$ 10.710 |
|
Total Return B, C |
5.25% |
1.03% |
6.48% |
10.41% |
4.93% |
12.13% |
|
Ratios and Supplemental Data |
|
|
|
|
|
|
|
Net assets, end of period (in millions) |
$ 1,728 |
$ 1,538 |
$ 1,295 |
$ 815 |
$ 568 |
$ 476 |
|
Ratio of expenses to average net assets |
.32% A, E |
.32% E |
.32% E |
.32% E |
.32% E |
.32% E |
|
Ratio of expenses to average net assets after expense reductions |
.31% A, F |
.31% F |
.31% F |
.31% F |
.31% F |
.31% F |
|
Ratio of net invest- |
6.87% A |
6.53% |
6.35% |
6.98% |
7.05% |
7.11% |
|
Portfolio turnover rate |
111% A |
133% |
184% |
97% |
65% |
128% |
A Annualized
B Total returns for periods of less than one year are not annualized.
C The total returns would have been lower had certain expenses not been reduced during the periods shown.
D Net investment income per share has been calculated based on average shares outstanding during the period.
E FMR agreed to reimburse a portion of the fund's expenses during the period. Without this reimbursement, the fund's expense ratio would have been higher.
F FMR or the fund has entered into varying arrangements with third parties who either paid or reduced a portion of the fund's expenses.
G For the year ended February 29
See accompanying notes which are an integral part of the financial statements.
Semiannual Report
For the period ended August 31, 2000 (Unaudited)
1. Significant Accounting Policies.
Fidelity U.S. Bond Index Fund (the fund) is a fund of Fidelity Concord Street Trust (the trust) and is authorized to issue an unlimited number of shares. The trust is registered under the Investment Company Act of 1940, as amended, as an open-end management investment company organized as a Massachusetts business trust. The financial statements have been prepared in conformity with generally accepted accounting principles which require management to make certain estimates and assumptions at the date of the financial statements. The following summarizes the significant accounting policies of the fund:
Security Valuation. Securities are valued based upon a computerized matrix system and/or appraisals by a pricing service, both of which consider market transactions and dealer-supplied valuations. Securities (including restricted securities) for which market quotations are not readily available are valued at their fair value as determined in good faith under consistently applied procedures under the general supervision of the Board of Trustees. Short-term securities with remaining maturities of sixty days or less for which quotations are not readily available are valued at amortized cost or original cost plus accrued interest, both of which approximate current value.
Income Taxes. As a qualified regulated investment company under Subchapter M of the Internal Revenue Code, the fund is not subject to income taxes to the extent that it distributes substantially all of its taxable income for its fiscal year. The schedule of investments includes information regarding income taxes under the caption "Income Tax Information."
Investment Income. Interest income, which includes accretion of original issue discount, is accrued as earned.
Expenses. Most expenses of the trust can be directly attributed to a fund. Expenses which cannot be directly attributed are apportioned among the funds in the trust.
Distributions to Shareholders. Distributions are declared daily and paid monthly from net interest income. Distributions from realized gains, if any, are recorded on the ex-dividend date.
Income and capital gain distributions are determined in accordance with income tax regulations which may differ from generally accepted accounting principles. These differences, which may result in distribution reclassifications, are primarily due to differing treatments for paydown gains/losses on certain securities, market discount and losses deferred due to wash sales and excise tax regulations.
Permanent book and tax basis differences relating to shareholder distributions will result in reclassifications to paid in capital. Undistributed net investment income and accumulated undistributed net realized gain (loss) on investments may include temporary book and tax basis differences which will reverse in a subsequent period. Any taxable income or gain remaining at fiscal year end is distributed in the following year.
Semiannual Report
Notes to Financial Statements (Unaudited) - continued
1. Significant Accounting
Policies - continued
Security Transactions. Security transactions are accounted for as of trade date. Gains and losses on securities sold are determined on the basis of identified cost.
2. Operating Policies.
Joint Trading Account. Pursuant to an Exemptive Order issued by the Securities and Exchange Commission (SEC), the fund, along with other affiliated entities of Fidelity Management & Research Company (FMR), may transfer uninvested cash balances into one or more joint trading accounts. These balances are invested in one or more repurchase agreements for U.S. Treasury or Federal Agency obligations.
Repurchase Agreements. The underlying U.S. Treasury, Federal Agency, or other obligations found to be satisfactory by FMR are transferred to an account of the fund, or to the Joint Trading Account, at a custodian bank. The securities are marked-to-market daily and maintained at a value at least equal to the principal amount of the repurchase agreement (including accrued interest). FMR, the fund's investment adviser, is responsible for determining that the value of the underlying securities remains in accordance with the market value requirements stated above.
Interfund Lending Program. Pursuant to an Exemptive Order issued by the SEC, the fund, along with other registered investment companies having management contracts with FMR, may participate in an interfund lending program. This program provides an alternative credit facility allowing the fund to borrow from, or lend money to, other participating funds.
Delayed Delivery Transactions. The fund may purchase or sell securities on a delayed delivery basis. Payment and delivery may take place after the customary settlement period for that security. The price of the underlying securities and the date when the securities will be delivered and paid for are fixed at the time the transaction is negotiated. The market values of the securities purchased on a delayed delivery basis are identified as such in the fund's schedule of investments. The fund may receive compensation for interest forgone in the purchase of a delayed delivery security. With respect to purchase commitments, the fund identifies securities as segregated in its records with a value at least equal to the amount of the commitment. Losses may arise due to changes in the market value of the underlying securities or if the counterparty does not perform under the contract.
Restricted Securities. The fund is permitted to invest in securities that are subject to legal or contractual restrictions on resale. These securities generally may be resold in transactions exempt from registration or to the public if the securities are registered. Disposal of these securities may involve time-consuming negotiations and expense, and prompt sale at an acceptable price may be difficult. At the end of the period, the fund had no investments in restricted securities (excluding 144A issues).
Semiannual Report
Notes to Financial Statements (Unaudited) - continued
3. Purchases and Sales of Investments.
Purchases and sales of securities, other than short-term securities, aggregated $1,008,451,000 and $883,659,000, respectively, of which U.S. government and government agency obligations aggregated $750,184,000 and $647,591,000, respectively.
4. Fees and Other Transactions with Affiliates.
Management Fee. As the fund's investment adviser, FMR receives a fee that is computed daily at an annual rate of .32% of the fund's average net assets.
Sub-Adviser Fee. FMR, on behalf of the fund, has entered into a sub-advisory agreement with Fidelity Investments Money Management, Inc. (FIMM), a wholly owned subsidiary of FMR. For its services, FIMM receives a fee from FMR of 50% of the management fee payable to FMR. The fee is paid prior to any voluntary expense reimbursements which may be in effect.
Transfer Agent Fees. Fidelity Investments Institutional Operations Company, Inc. (FIIOC), an affiliate of FMR, is the fund's transfer, dividend disbursing and shareholder servicing agent. FIIOC receives account fees and asset-based fees that vary according to account size and type of account. FIIOC pays for typesetting, printing and mailing of all shareholder reports, except proxy statements. For the period, the transfer agent fees were equivalent to an annualized rate of .13% of average net assets.
Accounting and Security Lending Fees. Fidelity Service Company, Inc., an affiliate of FMR, maintains the fund's accounting records and administers the security lending program. The security lending fee is based on the number and duration of lending transactions. The accounting fee is based on the level of average net assets for the month plus out-of-pocket expenses.
5. Interfund Lending Program.
The fund participated in the interfund lending program as a lender. The average daily loan balance during the period for which the loan was outstanding amounted to $19,443,000. The weighted average interest rate was 6.60%. Interest earned from the interfund lending program amounted to $4,000 and is included in interest income on the Statement of Operations. At period end there were no interfund loans outstanding.
6. Security Lending.
The fund lends portfolio securities from time to time in order to earn additional income. The fund receives collateral in the form of U.S. Treasury obligations, letters of credit, and/or cash against the loaned securities, and maintains collateral in an amount not less than 100% of the market value of the loaned securities during the period of the loan. The market value of the loaned securities is determined at the close of business of the fund and any additional required collateral is delivered to the fund on the next business day. If the borrower defaults on its obligation to return the securities loaned because of insolvency or other reasons, the fund
Semiannual Report
Notes to Financial Statements (Unaudited) - continued
6. Security Lending -
continued
could experience delays and costs in recovering the securities loaned or in gaining access to the collateral. At period end there were no security loans outstanding.
7. Expense Reductions.
FMR voluntarily agreed to reimburse the fund's operating expenses (excluding interest, taxes, certain securities lending fees, brokerage commissions and extraordinary expenses, if any) above an annual rate of .32% of average net assets. For the period, the reimbursement reduced the expenses by $1,381,000.
In addition, through arrangements with the fund's custodian and transfer agent, credits realized as a result of uninvested cash balances were used to reduce a portion of the fund's expenses. During the period, the fund's custodian and transfer agent fees were reduced by $84,000 and $9,000, respectively, under these arrangements.
Semiannual Report
Semiannual Report
Semiannual Report
Investment Adviser
Fidelity Management & Research Company
Boston, MA
Investment Sub-Adviser
Fidelity Investments
Money Management, Inc.
Officers
Edward C. Johnson 3d, President
Robert C. Pozen, Senior Vice President
Dwight D. Churchill, Vice President
David L. Murphy, Vice President
Thomas J. Silvia, Vice President
Eric D. Roiter, Secretary
Robert A. Dwight, Treasurer
Maria F. Dwyer, Deputy Treasurer
Stanley N. Griffith, Assistant
Vice President
John H. Costello, Assistant Treasurer
Thomas J. Simpson, Assistant Treasurer
Board of Trustees
Ralph F. Cox *
Phyllis Burke Davis *
Robert M. Gates *
Edward C. Johnson 3d
Donald J. Kirk *
Ned C. Lautenbach *
Peter S. Lynch
Marvin L. Mann *
William O. McCoy *
Gerald C. McDonough *
Robert C. Pozen
Thomas R. Williams *
Advisory Board
J. Michael Cook
Abigail P. Johnson
Marie L. Knowles
* Independent trustees
General Distributor
Fidelity Distributors Corporation
Boston, MA
Transfer and Shareholder Servicing Agent
Fidelity Investments Institutional Operations Company, Inc.
Boston, MA
Custodian
The Bank of New York
New York, NY
|
UBI-SANN-1000 |
112814 |
|
1.536707.103 |
|
(Fidelity Investment logo)(registered trademark)
Corporate Headquarters
82 Devonshire St., Boston, MA 02109
www.fidelity.com
Spartan®
Fund
Semiannual Report
August 31, 2000
(2 Fidelity logo graphics)(registered trademark)
|
President's Message |
Ned Johnson on investing strategies. |
|
|
Performance |
How the fund has done over time. |
|
|
Fund Talk |
The manager's review of fund performance, strategy and outlook. |
|
|
Investment Changes |
A summary of the major shifts in the fund's investments over the past six months. |
|
|
Investments |
A complete list of the fund's investments with their market values. |
|
|
Financial Statements |
Statements of assets and liabilities,
operations, and changes in net assets, |
|
|
Notes |
Notes to the financial statements. |
Standard & Poor's, S&P and S&P 500 are registered service marks of The McGraw-Hill Companies, Inc. and have been licensed for use by Fidelity Distributors Corporation.
Other third party marks appearing herein are the property of their respective owners.
All other marks appearing herein are registered or unregistered trademarks or service marks of FMR Corp. or an affiliated company.
(Recycle graphic) This report is printed on recycled paper using soy-based inks.
If additional copies of financial reports, prospectuses or historical account information are needed, or for more information on any Fidelity fund
including charges and expenses, please call the appropriate number listed below or the number provided to your institutional or employer-sponsored
retirement plan. Read the prospectus carefully before you invest or send money.
Retirement Plan Level Accounts
Corporate Clients (800) 962-1375
"Not For Profit" Clients (800) 343-0860
Financial and Other Institutions
Nationwide (800) 843-3001
Other Investors (800) 544-8888
This report and the financial statements contained herein are submitted for the general information of the shareholders of the fund. This report is not authorized for distribution to prospective investors in the fund unless preceded or accompanied by an effective prospectus.
Mutual fund shares are not deposits or obligations of, or guaranteed by, any depository institution. Shares are not insured by the FDIC, Federal Reserve Board or any other agency, and are subject to investment risks, including possible loss of principal amount invested. Neither the fund nor Fidelity Distributions Corporation is a bank.
Semiannual Report
|
(photo_of_Edward_C_Johnson_3d)
Dear Shareholder:
A slowing U.S. economy triggered an equity market rally during the later stages of summer, boosting most major stock indexes back into positive territory for calendar year 2000. One notable exception, however, was the Dow Jones Industrial Average, which posted a negative return during that timeframe. Fixed-income markets - particularly Treasuries - continued their yearlong trend of strong performance, as nearly every bond sector outperformed the stock market on a year-to-date basis.
While it's impossible to predict the future direction of the markets with any degree of certainty, there are certain basic principles that can help investors plan for their future needs.
First, investors are encouraged to take a long-term view of their portfolios. If you can afford to leave your money invested through the inevitable up and down cycles of the financial markets, you will greatly reduce your vulnerability to any single decline. We know from experience, for example, that stock prices have gone up over longer periods of time, have significantly outperformed other types of investments and have stayed ahead of inflation.
Second, you can further manage your investing risk through diversification. A stock mutual fund, for instance, is already diversified, because it invests in many different companies. You can increase your diversification further by investing in a number of different stock funds, or in such other investment categories as bonds. If you have a short investment time horizon, you might want to consider moving some of your investment into a money market fund, which seeks income and a stable share price by investing in high-quality, short-term investments. Of course, it's important to remember that an investment in a money market fund is not insured or guaranteed by the Federal Deposit Insurance Corporation or any other government agency. Although money market funds seek to preserve the value of your investment at $1.00 per share, it is possible to lose money by investing in these types of funds.
Finally, no matter what your time horizon or portfolio diversity, it makes good sense to follow a regular investment plan, investing a certain amount of money in a fund at the same time each month or quarter and periodically reviewing your overall portfolio. By doing so, you won't get caught up in the excitement of a rapidly rising market, nor will you buy all your shares at market highs. While this strategy - known as dollar cost averaging - won't assure a profit or protect you from a loss in a declining market, it should help you lower the average cost of your purchases. Of course, you should consider your financial ability to continue your purchases through periods of low price levels before undertaking such a strategy.
If you have questions, please call us at 1-800-544-6666, or visit our web site at www.fidelity.com. We are available 24 hours a day, seven days a week to provide you the information you need to make the investments that are right for you.
Best regards,
/s/Edward C. Johnson 3d
Edward C. Johnson 3d
Semiannual Report
There are several ways to evaluate a fund's historical performance. You can look at the total percentage change in value, the average annual percentage change or the growth of a hypothetical $100,000 investment. Total return reflects the change in the value of an investment, assuming reinvestment of the fund's dividend income and capital gains (the profits earned upon the sale of securities that have grown in value). If Fidelity had not reimbursed certain fund expenses, the total returns would have been lower.
Cumulative Total Returns
|
Periods ended August 31, 2000 |
Past 6 |
Past 1 |
Past 5 |
Past 10 |
|
Spartan US Equity Index |
11.68% |
16.17% |
190.66% |
479.57% |
|
S&P 500 ® |
11.73% |
16.32% |
193.58% |
493.54% |
|
S&P 500 Index Objective Funds |
11.35% |
15.65% |
187.07% |
472.18% |
Cumulative total returns show the fund's performance in percentage terms over a set period - in this case, six months, one year, five years or 10 years. For example, if you had invested $1,000 in a fund that had a 5% return over the past year, the value of your investment would be $1,050. You can compare the fund's returns to the performance of the Standard & Poor's 500SM Index - a market capitalization-weighted index of common stocks. To measure how the fund's performance stacked up against its peers, you can compare it to the S&P 500 index objective funds average, which reflects the performance of mutual funds with similar objectives tracked by Lipper Inc. The past six months average represents a peer group of 133 mutual funds. These benchmarks include reinvested dividends and capital gains, if any, and exclude the effect of sales charges. Lipper has created new comparison categories that group funds according to portfolio characteristics and capitalization, as well as by capitalization only. These averages are listed on page 5 of this report.(dagger)
Average Annual Total Returns
|
Periods ended August 31, 2000 |
|
Past 1 |
Past 5 |
Past 10 |
|
Spartan US Equity Index |
|
16.17% |
23.79% |
19.21% |
|
S&P 500 |
|
16.32% |
24.04% |
19.49% |
|
S&P 500 Index Objective Funds |
|
15.65% |
23.48% |
19.05% |
Average annual total returns take the fund's cumulative return and show you what would have happened if the fund had performed at a constant rate each year. (Note: Lipper calculates average annual total returns by annualizing each fund's total return, then taking an arithmetic average. This may produce a different figure than that obtained by averaging the cumulative total returns and annualizing the result.)
Semiannual Report
$100,000 Over 10 Years
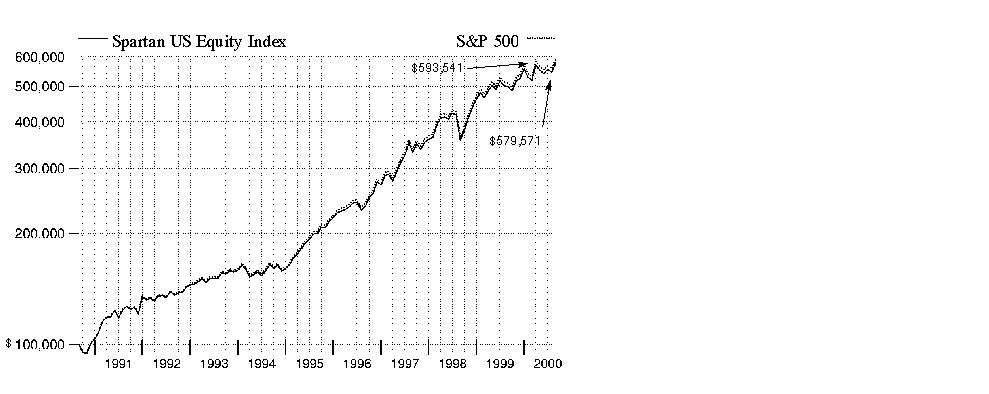
$100,000 Over 10 Years: Let's say hypothetically that $100,000 was invested in Spartan US Equity Index Fund on August 31, 1990. As the chart
shows, by August 31, 2000, the value of the investment would have grown to $579,571 - a 479.57% increase on the initial investment. For comparison,
look at how the Standard & Poor's 500 Index did over the same period. With dividends and capital gains, if any, reinvested, the same $100,000 would have
grown to $593,541 - a 493.54% increase. Understanding How a fund did yesterday is
no guarantee of how it will do
tomorrow. The stock market,
for example, has a history of
long-term growth and
short-term volatility. In turn, the
share price and return of a
fund that invests in stocks will
vary. That means if you sell
your shares during a market
downturn, you might lose
money. But if you can ride out
the market's ups and downs,
you may have a gain.
Performance
(dagger)The Lipper S&P 500 funds average reflects the performance (excluding sales charges) of mutual funds with similar portfolio characteristics and capitalization. As of August 31, 2000, the six month, one year, five year, and 10 year cumulative total returns for the S&P 500 funds average were, 11.35%, 15.65%, 187.07%, and 472.18%.The one year, five year and 10 year average annual total returns were, 15.65%, 23.48%, and 19.05%, respectively.
Semiannual Report
An interview with Dean Barr, who oversees the Spartan U.S.
Equity Index Fund's investment
management personnel as
Managing Director for Bankers
Trust, sub-adviser of the fund(Portfolio Manager photograph)
Q. How did the fund perform, Dean?
A. For the six months that ended August 31, 2000, the fund returned 11.68%. That performance was in line with the Standard & Poor's 500 Index, which returned 11.73%, and the S&P 500 index objective funds average tracked by Lipper Inc., which returned 11.35% during the same period. For the 12 months that ended August 31, 2000, the fund returned 16.17%, while the S&P 500 index and Lipper average posted returns of 16.32% and 15.65%, respectively.
Q. How would you describe the market environment during the six-month period?
A. It was one marked by historically high levels of volatility and rapid sector rotations. Concerns about seemingly overstretched valuations and further tightening by the Federal Reserve Board sent jittery investors fleeing smaller-cap tech stocks in droves for the perceived predictability found in large, well-established companies elsewhere in the market. The S&P 500 - home to many of these well-known stocks - benefited from this migration, although the party was short-lived. A quarter-point interest-rate hike on March 24, coupled with expectations for an even bigger increase in May, pulled the entire market into a steep decline, culminating in a nearly 6% drop in the index on April 14. Stocks forged a recovery later in the month, only to turn back again in mid-May when the Fed greeted them with an additional half-point increase. Investors - sensing a slowdown in the economy and hopefully an end to the Fed's yearlong tightening cycle - eased their way back into the market, this time focusing on seasoned growth companies with demonstrated revenues and earnings. Earnings worries related to a decelerating economy, however, tempered optimism surrounding rates and spawned confusion and persistent volatility during the summer months, with few industries enjoying market leadership for long. With the Fed choosing not to raise rates in August, stocks staged a "relief rally," lifting the S&P 500 to within points of its all-time high achieved in late March.
Q. Which segments of the market scored the highest gains during the period?
A. While technology stocks struggled to recoup their losses from the downturn in the spring, financial, health and energy stocks took the ball and ran with it. The finance sector laid claim to some of the period's best performers, many of which emerged from the brokerage and investment management spaces. Strong capital markets activity and industry consolidation painted a healthy backdrop for key players such as Citigroup, Morgan Stanley Dean Witter and Lehman Brothers. Not to be left out, insurance stocks also performed well, posting gains on signs of margin improvement. American International Group was the big winner here. Not too far behind were components of the health sector, namely pharmaceutical and biotechnology firms. Drug stocks such as Pfizer - which traditionally outperform in a slowing economy - rallied as exciting new product pipelines overcame concerns that presidential campaign rhetoric surrounding health care reform would dominate the investment landscape. Most biotech and genomics stocks fell sharply in the spring, but recovered nicely during the period behind investors' renewed enthusiasm for the sector when researchers reported a successful mapping of the human genome. Alza and Medimmune were notable contributors. Rising oil and gas prices resulting from supply shortages lifted the energy sector, with names such as Anadarko Petroleum leading the way, followed by Halliburton and Exxon Mobil.
Semiannual Report
Fund Talk: The Manager's Overview - continued
Q. Despite the volatility, technology - by far the fund's largest sector weighting - still produced its share of winners during the period. What were they, and why?
A. Following the spring swoon, blue-chip tech names - such as Intel and Oracle - received the bulk of the support from valuation-conscious investors seeking quality of earnings and industry leadership. With corporate America spending hand over fist for new technology, firms engaged in the build-out of Internet infrastructure had widespread appeal with investors. Attempting to satisfy the growing need for communications bandwidth, networking and telecommunications equipment providers Nortel and Corning enjoyed strong advances. Overall, it was a mixed bag for semiconductor companies, with many stocks struggling to shake off their Y2K hangovers. Communications chip manufacturers benefited as a play on Internet infrastructure, evidenced by the impressive run-up in stocks such as Altera and Advanced Micro Devices. Similarly, Internet software provider Siebel Systems was a big winner, as were leaders in data storage, including EMC and Network Appliance. Additionally, computer hardware heavyweights Sun Microsystems and IBM performed well, recovering nicely in August. Conversely, those stocks that fought a losing battle throughout the period included Yahoo!, Qualcomm, Motorola, Microsoft and Texas Instruments.
Q. How did some other sectors of the market fare?
A. Retailers such as Wal-Mart and Home Depot suffered from the fear of a slowdown in consumer spending. Utilities also underperformed due to the poor performance of traditional telecommunications providers, such as AT&T and WorldCom, which struggled in the face of increased competition and pricing pressures in their long-distance businesses. U.S. West was a notable exception here, soaring in June on the announcement of its acquisition by high-speed fiber-optic carrier Qwest.
Q. What's your outlook?
A. It appears as if the economy is poised for a soft landing, though it's still too early to know for sure. Inaction on the rate front of late by the Fed tells me that growth is slowing enough right now to keep rates steady for at least the time being. Technology-enabled productivity gains, coupled with slower economic growth, should help neutralize spiking energy prices and keep inflation under wraps. Combine that with the presidential election, and I think we may see a Fed that's on hold for the remainder of 2000. Robust tech spending should further dampen inflationary pressures and keep corporate profits rising. If so, I expect growth stocks to prosper and continue to outperform in the coming months.
Semiannual Report
Fund Talk: The Manager's Overview - continued
The views expressed in this report reflect those of Bankers Trust only through the end of the period of the report as stated on the cover and do not necessarily represent the views of Fidelity or any other person in the Fidelity organization. Any such views are subject to change at any time based upon market or other conditions and Fidelity disclaims any responsibility to update such views. These views may not be relied on as investment advice and, because investment decisions for a Fidelity fund are based on numerous factors, may not be relied on as an indication of trading intent on behalf of any Fidelity fund.
Fund Facts
Goal: total return that corresponds to that of the Standard & Poor's 500 Index
Start date: February 17, 1988
Size: as of August 31, 2000, more than $20.9 billion
Sub-adviser: Bankers Trust, since 1997
3Dean Barr on
changes to the S&P 500:
"The S&P 500 is an index of 500 stocks chosen to be a representation of the broader market. Periodically, companies will be added to or deleted from the index. Usually, this is based on such events as acquisitions, spin-offs or shifts in asset size."
Here are some of the changes to the index during the past six months involving some well-known companies:
Semiannual Report
|
Top Ten Stocks as of August 31, 2000 |
||
|
|
% of fund's |
% of fund's net assets |
|
General Electric Co. |
4.4 |
3.7 |
|
Intel Corp. |
3.8 |
3.3 |
|
Cisco Systems, Inc. |
3.6 |
3.9 |
|
Microsoft Corp. |
2.8 |
4.0 |
|
Exxon Mobil Corp. |
2.1 |
2.2 |
|
Pfizer, Inc. |
2.0 |
1.1 |
|
Citigroup, Inc. |
2.0 |
1.5 |
|
Oracle Corp. |
1.9 |
1.8 |
|
Nortel Networks Corp. |
1.8 |
1.3 |
|
International Business Machines Corp. |
1.7 |
1.6 |
|
|
26.1 |
24.4 |
|
Top Ten Market Sectors as of August 31, 2000 |
||
|
|
% of fund's |
% of fund's net assets |
|
Technology |
34.2 |
33.4 |
|
Finance |
14.6 |
12.1 |
|
Health |
9.8 |
9.3 |
|
Utilities |
9.1 |
10.8 |
|
Industrial Machinery & Equipment |
6.1 |
4.7 |
|
Energy |
5.5 |
5.4 |
|
Nondurables |
5.1 |
5.5 |
|
Retail & Wholesale |
4.7 |
5.8 |
|
Media & Leisure |
4.0 |
4.6 |
|
Basic Industries |
2.6 |
3.1 |
Semiannual Report
(Unaudited)
Showing Percentage of Net Assets
|
Common Stocks - 99.9% |
|||
|
Shares |
Value (Note 1) (000s) |
||
|
AEROSPACE & DEFENSE - 1.3% |
|||
|
Aerospace & Defense - 1.1% |
|||
|
BFGoodrich Co. |
173,682 |
$ 7,088 |
|
|
Boeing Co. |
1,385,933 |
74,321 |
|
|
Honeywell International, Inc. |
1,259,918 |
48,586 |
|
|
ITT Industries, Inc. |
142,043 |
4,776 |
|
|
Lockheed Martin Corp. |
629,850 |
17,872 |
|
|
Northrop Grumman Corp. |
110,025 |
8,561 |
|
|
Rockwell International Corp. |
295,652 |
11,955 |
|
|
Textron, Inc. |
228,773 |
12,826 |
|
|
United Technologies Corp. |
742,082 |
46,334 |
|
|
|
232,319 |
||
|
Defense Electronics - 0.1% |
|||
|
Raytheon Co. Class B |
537,504 |
14,949 |
|
|
Ship Building & Repair - 0.1% |
|||
|
General Dynamics Corp. |
318,849 |
20,068 |
|
|
TOTAL AEROSPACE & DEFENSE |
267,336 |
||
|
BASIC INDUSTRIES - 2.6% |
|||
|
Chemicals & Plastics - 1.5% |
|||
|
Air Products & Chemicals, Inc. |
360,589 |
13,094 |
|
|
Armstrong Holdings, Inc. |
65,080 |
1,037 |
|
|
Ashland, Inc. |
110,960 |
3,911 |
|
|
Avery Dennison Corp. |
176,311 |
9,532 |
|
|
Dow Chemical Co. |
1,054,669 |
27,619 |
|
|
E.I. du Pont de Nemours and Co. |
1,646,910 |
73,905 |
|
|
Eastman Chemical Co. |
120,615 |
5,202 |
|
|
Engelhard Corp. |
200,670 |
3,763 |
|
|
FMC Corp. (a) |
47,696 |
3,234 |
|
|
Great Lakes Chemical Corp. |
85,644 |
2,890 |
|
|
Hercules, Inc. |
168,609 |
2,234 |
|
|
Newell Rubbermaid, Inc. |
419,338 |
10,877 |
|
|
Pharmacia Corp. |
1,997,896 |
117,002 |
|
|
PPG Industries, Inc. |
273,875 |
11,092 |
|
|
Praxair, Inc. |
247,964 |
10,972 |
|
|
Rohm & Haas Co. |
342,123 |
9,900 |
|
|
Sealed Air Corp. (a) |
131,545 |
6,750 |
|
|
Union Carbide Corp. |
211,785 |
8,485 |
|
|
W.R. Grace & Co. (a) |
106,157 |
843 |
|
|
|
322,342 |
||
|
Common Stocks - continued |
|||
|
Shares |
Value (Note 1) (000s) |
||
|
BASIC INDUSTRIES - continued |
|||
|
Iron & Steel - 0.1% |
|||
|
Allegheny Technologies, Inc. |
130,808 |
$ 2,845 |
|
|
Bethlehem Steel Corp. (a) |
197,938 |
693 |
|
|
Crane Co. |
104,552 |
2,627 |
|
|
Nucor Corp. |
133,747 |
4,915 |
|
|
USX - U.S. Steel Group |
138,994 |
2,415 |
|
|
Worthington Industries, Inc. |
135,508 |
1,414 |
|
|
|
14,909 |
||
|
Metals & Mining - 0.3% |
|||
|
Alcan Aluminium Ltd. |
344,048 |
11,281 |
|
|
Alcoa, Inc. |
1,358,782 |
45,180 |
|
|
Freeport-McMoRan Copper & Gold, Inc. Class B (a) |
207,536 |
2,036 |
|
|
Inco Ltd. (a) |
285,681 |
5,077 |
|
|
Phelps Dodge Corp. |
123,784 |
5,508 |
|
|
|
69,082 |
||
|
Packaging & Containers - 0.1% |
|||
|
Ball Corp. |
46,720 |
1,618 |
|
|
Bemis Co., Inc. |
75,242 |
2,521 |
|
|
Crown Cork & Seal Co., Inc. |
201,403 |
2,606 |
|
|
Owens-Illinois, Inc. (a) |
230,437 |
3,010 |
|
|
Tupperware Corp. |
91,126 |
1,840 |
|
|
|
11,595 |
||
|
Paper & Forest Products - 0.6% |
|||
|
Boise Cascade Corp. |
91,858 |
2,744 |
|
|
Fort James Corp. |
325,262 |
10,286 |
|
|
Georgia-Pacific Corp. |
270,406 |
7,233 |
|
|
International Paper Co. |
761,238 |
24,264 |
|
|
Kimberly-Clark Corp. |
874,683 |
51,169 |
|
|
Louisiana-Pacific Corp. |
169,140 |
1,787 |
|
|
Mead Corp. |
163,788 |
4,392 |
|
|
Pactiv Corp. (a) |
271,658 |
2,988 |
|
|
Potlatch Corp. |
46,590 |
1,567 |
|
|
Temple-Inland, Inc. |
83,755 |
3,554 |
|
|
Westvaco Corp. |
150,105 |
4,109 |
|
|
Weyerhaeuser Co. |
367,523 |
17,021 |
|
|
Willamette Industries, Inc. |
169,983 |
5,184 |
|
|
|
136,298 |
||
|
TOTAL BASIC INDUSTRIES |
554,226 |
||
|
Common Stocks - continued |
|||
|
Shares |
Value (Note 1) (000s) |
||
|
CONSTRUCTION & REAL ESTATE - 0.2% |
|||
|
Building Materials - 0.2% |
|||
|
Fortune Brands, Inc. |
249,283 |
$ 6,357 |
|
|
Masco Corp. |
707,013 |
13,787 |
|
|
Owens Corning |
90,847 |
471 |
|
|
Sherwin-Williams Co. |
257,538 |
5,923 |
|
|
Vulcan Materials Co. |
158,452 |
7,021 |
|
|
|
33,559 |
||
|
Construction - 0.0% |
|||
|
Centex Corp. |
94,647 |
2,733 |
|
|
Kaufman & Broad Home Corp. |
77,162 |
1,915 |
|
|
Pulte Corp. |
66,083 |
2,177 |
|
|
|
6,825 |
||
|
Engineering - 0.0% |
|||
|
Fluor Corp. |
121,063 |
3,624 |
|
|
TOTAL CONSTRUCTION & REAL ESTATE |
44,008 |
||
|
DURABLES - 1.6% |
|||
|
Autos, Tires, & Accessories - 1.1% |
|||
|
AutoZone, Inc. (a) |
215,999 |
4,860 |
|
|
Cooper Tire & Rubber Co. |
120,928 |
1,459 |
|
|
Cummins Engine Co., Inc. |
65,240 |
2,316 |
|
|
Dana Corp. |
245,000 |
6,048 |
|
|
Danaher Corp. |
232,593 |
13,069 |
|
|
Delphi Automotive Systems Corp. |
893,121 |
14,681 |
|
|
Eaton Corp. |
120,126 |
7,973 |
|
|
Ford Motor Co. |
2,949,637 |
71,344 |
|
|
General Motors Corp. |
843,345 |
60,879 |
|
|
Genuine Parts Co. |
283,930 |
5,838 |
|
|
Goodyear Tire & Rubber Co. |
245,884 |
5,748 |
|
|
Johnson Controls, Inc. |
134,559 |
7,190 |
|
|
Navistar International Corp. (a) |
101,073 |
3,790 |
|
|
PACCAR, Inc. |
123,035 |
5,221 |
|
|
TRW, Inc. |
193,073 |
8,821 |
|
|
Visteon Corp. |
212,360 |
3,331 |
|
|
|
222,568 |
||
|
Consumer Durables - 0.3% |
|||
|
Minnesota Mining & Manufacturing Co. |
622,420 |
57,885 |
|
|
Snap-On, Inc. |
94,860 |
2,923 |
|
|
|
60,808 |
||
|
Common Stocks - continued |
|||
|
Shares |
Value (Note 1) (000s) |
||
|
DURABLES - continued |
|||
|
Consumer Electronics - 0.1% |
|||
|
Black & Decker Corp. |
133,871 |
$ 5,363 |
|
|
Maytag Corp. |
123,228 |
4,698 |
|
|
Whirlpool Corp. |
114,834 |
4,364 |
|
|
|
14,425 |
||
|
Home Furnishings - 0.0% |
|||
|
Leggett & Platt, Inc. |
308,923 |
5,464 |
|
|
Textiles & Apparel - 0.1% |
|||
|
Liz Claiborne, Inc. |
89,817 |
3,946 |
|
|
NIKE, Inc. Class B |
433,829 |
17,163 |
|
|
Reebok International Ltd. (a) |
88,730 |
1,703 |
|
|
Russell Corp. |
53,120 |
1,013 |
|
|
Springs Industries, Inc. Class A |
18,209 |
544 |
|
|
VF Corp. |
186,119 |
4,257 |
|
|
|
28,626 |
||
|
TOTAL DURABLES |
331,891 |
||
|
ENERGY - 5.5% |
|||
|
Energy Services - 0.8% |
|||
|
Baker Hughes, Inc. |
525,029 |
19,196 |
|
|
Halliburton Co. |
705,123 |
37,372 |
|
|
McDermott International, Inc. |
91,772 |
705 |
|
|
Rowan Companies, Inc. (a) |
146,586 |
4,544 |
|
|
Schlumberger Ltd. (NY Shares) |
878,081 |
74,911 |
|
|
Transocean Sedco Forex, Inc. |
333,346 |
19,917 |
|
|
|
156,645 |
||
|
Oil & Gas - 4.7% |
|||
|
Amerada Hess Corp. |
145,596 |
9,964 |
|
|
Anadarko Petroleum Corp. |
386,234 |
25,403 |
|
|
Apache Corp. |
182,371 |
11,489 |
|
|
Burlington Resources, Inc. |
341,051 |
13,408 |
|
|
Chevron Corp. |
1,027,588 |
86,831 |
|
|
Conoco, Inc. Class B |
981,795 |
25,649 |
|
|
Devon Energy Corp. |
176,300 |
10,325 |
|
|
Exxon Mobil Corp. |
5,476,667 |
447,033 |
|
|
Kerr-McGee Corp. |
147,848 |
9,342 |
|
|
Occidental Petroleum Corp. |
589,169 |
12,741 |
|
|
Phillips Petroleum Co. |
402,952 |
24,933 |
|
|
Royal Dutch Petroleum Co. (NY Shares) |
3,375,203 |
206,520 |
|
|
Common Stocks - continued |
|||
|
Shares |
Value (Note 1) (000s) |
||
|
ENERGY - continued |
|||
|
Oil & Gas - continued |
|||
|
Sunoco, Inc. |
139,166 |
$ 3,784 |
|
|
Texaco, Inc. |
868,076 |
44,706 |
|
|
The Coastal Corp. |
336,357 |
23,167 |
|
|
Tosco Corp. |
232,968 |
7,106 |
|
|
Unocal Corp. |
388,104 |
12,953 |
|
|
USX - Marathon Group |
490,305 |
13,453 |
|
|
|
988,807 |
||
|
TOTAL ENERGY |
1,145,452 |
||
|
FINANCE - 14.6% |
|||
|
Banks - 4.9% |
|||
|
AmSouth Bancorp. |
620,275 |
11,320 |
|
|
Bank of America Corp. |
2,609,571 |
139,775 |
|
|
Bank of New York Co., Inc. |
1,163,152 |
60,993 |
|
|
Bank One Corp. |
1,808,449 |
63,748 |
|
|
BB&T Corp. |
553,342 |
14,975 |
|
|
Capital One Financial Corp. |
312,479 |
18,846 |
|
|
Chase Manhattan Corp. |
2,026,955 |
113,256 |
|
|
Comerica, Inc. |
249,124 |
14,029 |
|
|
Fifth Third Bancorp |
734,360 |
33,918 |
|
|
First Union Corp. |
1,547,847 |
44,791 |
|
|
Firstar Corp. |
1,532,945 |
36,599 |
|
|
FleetBoston Financial Corp. |
1,421,578 |
60,684 |
|
|
Huntington Bancshares, Inc. |
393,674 |
6,643 |
|
|
J.P. Morgan & Co., Inc. |
256,513 |
42,886 |
|
|
KeyCorp |
692,473 |
13,979 |
|
|
Mellon Financial Corp. |
776,822 |
35,151 |
|
|
National City Corp. |
961,939 |
20,141 |
|
|
Northern Trust Corp. |
351,659 |
29,649 |
|
|
PNC Financial Services Group, Inc. |
459,855 |
27,103 |
|
|
Regions Financial Corp. |
346,000 |
7,526 |
|
|
SouthTrust Corp. |
269,598 |
7,599 |
|
|
State Street Corp. |
254,462 |
29,963 |
|
|
Summit Bancorp |
277,789 |
7,691 |
|
|
SunTrust Banks, Inc. |
479,067 |
23,654 |
|
|
Synovus Finanical Corp. |
443,501 |
8,731 |
|
|
U.S. Bancorp |
1,190,389 |
25,891 |
|
|
Union Planters Corp. |
218,177 |
6,613 |
|
|
Common Stocks - continued |
|||
|
Shares |
Value (Note 1) (000s) |
||
|
FINANCE - continued |
|||
|
Banks - continued |
|||
|
Wachovia Corp. |
321,271 |
$ 18,413 |
|
|
Wells Fargo & Co. |
2,537,474 |
109,587 |
|
|
|
1,034,154 |
||
|
Credit & Other Finance - 3.4% |
|||
|
American Express Co. |
2,114,062 |
124,994 |
|
|
Associates First Capital Corp. Class A |
1,152,996 |
32,428 |
|
|
CIT Group, Inc. Class A |
401,522 |
7,027 |
|
|
Citigroup, Inc. |
7,078,957 |
413,234 |
|
|
Countrywide Credit Industries, Inc. |
178,673 |
6,767 |
|
|
Household International, Inc. |
744,126 |
35,718 |
|
|
MBNA Corp. |
1,340,823 |
47,348 |
|
|
Old Kent Financial Corp. |
220,073 |
6,451 |
|
|
Providian Financial Corp. |
224,859 |
25,845 |
|
|
|
699,812 |
||
|
Federal Sponsored Credit - 0.7% |
|||
|
Fannie Mae |
1,598,752 |
85,933 |
|
|
Freddie Mac |
1,099,701 |
46,325 |
|
|
USA Education, Inc. |
263,374 |
10,321 |
|
|
|
142,579 |
||
|
Insurance - 3.2% |
|||
|
Aetna, Inc. |
221,658 |
12,399 |
|
|
AFLAC, Inc. |
417,429 |
22,541 |
|
|
Allstate Corp. |
1,185,208 |
34,445 |
|
|
American General Corp. |
390,641 |
28,444 |
|
|
American International Group, Inc. |
3,641,807 |
324,576 |
|
|
Aon Corp. |
406,852 |
15,181 |
|
|
CIGNA Corp. |
256,093 |
24,905 |
|
|
Cincinnati Financial Corp. |
248,597 |
9,664 |
|
|
Conseco, Inc. |
511,428 |
4,315 |
|
|
Hartford Financial Services Group, Inc. |
346,306 |
23,073 |
|
|
Jefferson-Pilot Corp. |
167,669 |
11,098 |
|
|
Lincoln National Corp. |
301,477 |
16,280 |
|
|
Loews Corp. |
162,646 |
13,164 |
|
|
Marsh & McLennan Companies, Inc. |
422,107 |
50,125 |
|
|
MBIA, Inc. |
158,969 |
10,452 |
|
|
MGIC Investment Corp. |
169,991 |
9,998 |
|
|
Progressive Corp. |
117,428 |
8,903 |
|
|
SAFECO Corp. |
210,412 |
5,536 |
|
|
The Chubb Corp. |
280,760 |
21,496 |
|
|
Common Stocks - continued |
|||
|
Shares |
Value (Note 1) (000s) |
||
|
FINANCE - continued |
|||
|
Insurance - continued |
|||
|
The St. Paul Companies, Inc. |
346,011 |
$ 16,479 |
|
|
Torchmark Corp. |
201,501 |
5,655 |
|
|
UnumProvident Corp. |
378,178 |
8,202 |
|
|
|
676,931 |
||
|
Savings & Loans - 0.2% |
|||
|
Charter One Financial, Inc. |
334,055 |
7,934 |
|
|
Golden West Financial Corp. |
248,589 |
11,839 |
|
|
Washington Mutual, Inc. |
861,359 |
30,148 |
|
|
|
49,921 |
||
|
Securities Industry - 2.2% |
|||
|
Bear Stearns Companies, Inc. |
179,795 |
12,058 |
|
|
Charles Schwab Corp. |
2,121,339 |
81,009 |
|
|
Franklin Resources, Inc. |
390,929 |
14,855 |
|
|
Lehman Brothers Holdings, Inc. |
192,513 |
27,914 |
|
|
Merrill Lynch & Co., Inc. |
593,859 |
86,110 |
|
|
Morgan Stanley Dean Witter & Co. |
1,782,851 |
191,768 |
|
|
PaineWebber Group, Inc. |
231,856 |
16,578 |
|
|
Stilwell Financial, Inc. (a) |
352,728 |
17,063 |
|
|
T. Rowe Price Associates, Inc. |
196,094 |
8,873 |
|
|
|
456,228 |
||
|
TOTAL FINANCE |
3,059,625 |
||
|
HEALTH - 9.8% |
|||
|
Drugs & Pharmaceuticals - 6.6% |
|||
|
Allergan, Inc. |
206,282 |
15,084 |
|
|
ALZA Corp. (a) |
161,935 |
12,246 |
|
|
American Home Products Corp. |
2,054,236 |
111,314 |
|
|
Amgen, Inc. (a) |
1,617,182 |
122,603 |
|
|
Bausch & Lomb, Inc. |
83,999 |
3,003 |
|
|
Biogen, Inc. (a) |
236,497 |
16,348 |
|
|
Bristol-Myers Squibb Co. |
3,105,528 |
164,593 |
|
|
Eli Lilly & Co. |
1,767,329 |
129,015 |
|
|
Medimmune, Inc. (a) |
310,452 |
26,117 |
|
|
Merck & Co., Inc. |
3,618,805 |
252,864 |
|
|
Pfizer, Inc. |
9,902,575 |
428,286 |
|
|
Quintiles Transnational Corp. (a) |
184,998 |
2,578 |
|
|
Schering-Plough Corp. |
2,306,460 |
92,547 |
|
|
Common Stocks - continued |
|||
|
Shares |
Value (Note 1) (000s) |
||
|
HEALTH - continued |
|||
|
Drugs & Pharmaceuticals - continued |
|||
|
Sigma-Aldrich Corp. |
140,573 |
$ 4,085 |
|
|
Watson Pharmaceuticals, Inc. (a) |
151,469 |
9,344 |
|
|
|
1,390,027 |
||
|
Medical Equipment & Supplies - 2.8% |
|||
|
Abbott Laboratories |
2,437,361 |
106,635 |
|
|
Baxter International, Inc. |
456,911 |
38,038 |
|
|
Becton, Dickinson & Co. |
398,023 |
11,990 |
|
|
Biomet, Inc. |
273,106 |
9,234 |
|
|
Boston Scientific Corp. (a) |
642,772 |
12,172 |
|
|
C.R. Bard, Inc. |
80,043 |
3,907 |
|
|
Cardinal Health, Inc. |
435,517 |
35,631 |
|
|
Guidant Corp. (a) |
482,496 |
32,478 |
|
|
Johnson & Johnson |
2,187,574 |
201,120 |
|
|
Mallinckrodt, Inc. |
106,376 |
4,794 |
|
|
McKesson HBOC, Inc. |
449,407 |
11,207 |
|
|
Medtronic, Inc. |
1,882,775 |
96,492 |
|
|
Millipore Corp. |
69,751 |
4,246 |
|
|
St. Jude Medical, Inc. (a) |
132,548 |
5,252 |
|
|
|
573,196 |
||
|
Medical Facilities Management - 0.4% |
|||
|
HCA - The Healthcare Co. |
882,324 |
30,440 |
|
|
HEALTHSOUTH Corp. (a) |
615,874 |
3,772 |
|
|
Humana, Inc. (a) |
266,798 |
2,284 |
|
|
Manor Care, Inc. (a) |
182,617 |
2,443 |
|
|
Tenet Healthcare Corp. |
497,886 |
15,434 |
|
|
UnitedHealth Group, Inc. |
257,468 |
24,331 |
|
|
Wellpoint Health Networks, Inc. (a) |
99,722 |
8,607 |
|
|
|
87,311 |
||
|
TOTAL HEALTH |
2,050,534 |
||
|
INDUSTRIAL MACHINERY & EQUIPMENT - 6.1% |
|||
|
Electrical Equipment - 4.7% |
|||
|
American Power Conversion Corp. (a) |
274,214 |
6,530 |
|
|
Emerson Electric Co. |
670,992 |
44,411 |
|
|
General Electric Co. |
15,571,722 |
913,864 |
|
|
Scientific-Atlanta, Inc. |
249,834 |
19,471 |
|
|
Common Stocks - continued |
|||
|
Shares |
Value (Note 1) (000s) |
||
|
INDUSTRIAL MACHINERY & EQUIPMENT - continued |
|||
|
Electrical Equipment - continued |
|||
|
Thomas & Betts Corp. |
91,144 |
$ 1,709 |
|
|
W.W. Grainger, Inc. |
147,752 |
4,266 |
|
|
|
990,251 |
||
|
Industrial Machinery & Equipment - 1.3% |
|||
|
Briggs & Stratton Corp. |
37,459 |
1,620 |
|
|
Caterpillar, Inc. |
551,365 |
20,263 |
|
|
Cooper Industries, Inc. |
146,492 |
5,173 |
|
|
Deere & Co. |
379,794 |
12,509 |
|
|
Dover Corp. |
329,200 |
16,090 |
|
|
Illinois Tool Works, Inc. |
476,369 |
26,706 |
|
|
Ingersoll-Rand Co. |
257,398 |
11,728 |
|
|
Pall Corp. |
199,338 |
4,261 |
|
|
Parker-Hannifin Corp. |
176,198 |
6,134 |
|
|
The Stanley Works |
138,569 |
3,707 |
|
|
Timken Co. |
92,092 |
1,502 |
|
|
Tyco International Ltd. |
2,656,715 |
151,433 |
|
|
|
261,126 |
||
|
Pollution Control - 0.1% |
|||
|
Allied Waste Industries, Inc. (a) |
282,824 |
2,598 |
|
|
Waste Management, Inc. |
988,502 |
18,720 |
|
|
|
21,318 |
||
|
TOTAL INDUSTRIAL MACHINERY & EQUIPMENT |
1,272,695 |
||
|
MEDIA & LEISURE - 4.0% |
|||
|
Broadcasting - 1.4% |
|||
|
Clear Channel Communications, Inc. (a) |
863,814 |
62,519 |
|
|
Comcast Corp. Class A (special) (a) |
1,411,657 |
52,584 |
|
|
Time Warner, Inc. |
2,054,780 |
175,684 |
|
|
|
290,787 |
||
|
Entertainment - 1.5% |
|||
|
Carnival Corp. |
962,065 |
19,181 |
|
|
Viacom, Inc. Class B (non-vtg.) (a) |
2,401,822 |
161,673 |
|
|
Walt Disney Co. |
3,267,390 |
127,224 |
|
|
|
308,078 |
||
|
Leisure Durables & Toys - 0.2% |
|||
|
Brunswick Corp. |
138,170 |
2,591 |
|
|
Harley-Davidson, Inc. |
477,451 |
23,783 |
|
|
Common Stocks - continued |
|||
|
Shares |
Value (Note 1) (000s) |
||
|
MEDIA & LEISURE - continued |
|||
|
Leisure Durables & Toys - continued |
|||
|
Hasbro, Inc. |
270,630 |
$ 3,332 |
|
|
Mattel, Inc. |
669,408 |
6,610 |
|
|
|
36,316 |
||
|
Lodging & Gaming - 0.1% |
|||
|
Harrah's Entertainment, Inc. (a) |
192,193 |
5,453 |
|
|
Hilton Hotels Corp. |
579,198 |
5,792 |
|
|
Marriott International, Inc. Class A |
376,793 |
14,883 |
|
|
|
26,128 |
||
|
Publishing - 0.4% |
|||
|
American Greetings Corp. Class A |
106,179 |
1,978 |
|
|
Dow Jones & Co., Inc. |
138,953 |
8,693 |
|
|
Gannett Co., Inc. |
419,072 |
23,730 |
|
|
Harcourt General, Inc. |
105,790 |
6,275 |
|
|
Knight-Ridder, Inc. |
123,753 |
6,760 |
|
|
McGraw-Hill Companies, Inc. |
307,381 |
19,038 |
|
|
Meredith Corp. |
79,636 |
2,175 |
|
|
The New York Times Co. Class A |
269,397 |
10,557 |
|
|
Tribune Co. |
484,893 |
17,305 |
|
|
|
96,511 |
||
|
Restaurants - 0.4% |
|||
|
Darden Restaurants, Inc. |
194,604 |
3,442 |
|
|
McDonald's Corp. |
2,101,309 |
62,777 |
|
|
Starbucks Corp. (a) |
288,674 |
10,573 |
|
|
Tricon Global Restaurants, Inc. (a) |
231,846 |
6,753 |
|
|
Wendy's International, Inc. |
178,885 |
3,376 |
|
|
|
86,921 |
||
|
TOTAL MEDIA & LEISURE |
844,741 |
||
|
NONDURABLES - 5.1% |
|||
|
Beverages - 1.6% |
|||
|
Adolph Coors Co. Class B |
57,971 |
3,453 |
|
|
Anheuser-Busch Companies, Inc. |
710,630 |
56,007 |
|
|
Brown-Forman Corp. Class B (non-vtg.) |
82,688 |
4,382 |
|
|
Coca-Cola Enterprises, Inc. |
661,380 |
12,318 |
|
|
Seagram Co. Ltd. |
690,736 |
41,574 |
|
|
The Coca-Cola Co. |
3,892,218 |
204,828 |
|
|
|
322,562 |
||
|
Common Stocks - continued |
|||
|
Shares |
Value (Note 1) (000s) |
||
|
NONDURABLES - continued |
|||
|
Foods - 1.6% |
|||
|
Archer-Daniels-Midland Co. |
994,255 |
$ 8,762 |
|
|
Bestfoods |
431,761 |
30,493 |
|
|
Campbell Soup Co. |
664,364 |
16,858 |
|
|
ConAgra, Inc. |
774,053 |
14,175 |
|
|
General Mills, Inc. |
458,389 |
14,726 |
|
|
H.J. Heinz Co. |
553,870 |
21,116 |
|
|
Hershey Foods Corp. |
215,683 |
9,207 |
|
|
Kellogg Co. |
637,806 |
14,789 |
|
|
Nabisco Group Holdings Corp. |
513,343 |
14,406 |
|
|
PepsiCo, Inc. |
2,266,092 |
96,592 |
|
|
Quaker Oats Co. |
205,844 |
13,985 |
|
|
Ralston Purina Co. |
482,748 |
10,922 |
|
|
Sara Lee Corp. |
1,375,886 |
25,626 |
|
|
Sysco Corp. |
523,949 |
22,170 |
|
|
Wm. Wrigley Jr. Co. |
179,424 |
13,289 |
|
|
|
327,116 |
||
|
Household Products - 1.4% |
|||
|
Avon Products, Inc. |
373,517 |
14,637 |
|
|
Clorox Co. |
369,211 |
13,361 |
|
|
Colgate-Palmolive Co. |
906,919 |
46,196 |
|
|
Gillette Co. |
1,641,746 |
49,252 |
|
|
International Flavors & Fragrances, Inc. |
161,955 |
4,170 |
|
|
Procter & Gamble Co. |
2,056,798 |
127,136 |
|
|
Unilever NV (NY Shares) |
898,814 |
42,469 |
|
|
|
297,221 |
||
|
Tobacco - 0.5% |
|||
|
Philip Morris Companies, Inc. |
3,605,322 |
106,808 |
|
|
UST, Inc. |
270,429 |
5,848 |
|
|
|
112,656 |
||
|
TOTAL NONDURABLES |
1,059,555 |
||
|
PRECIOUS METALS - 0.1% |
|||
|
Barrick Gold Corp. |
647,286 |
10,293 |
|
|
Homestake Mining Co. |
376,817 |
2,096 |
|
|
Newmont Mining Corp. |
279,272 |
5,184 |
|
|
Placer Dome, Inc. |
539,702 |
4,823 |
|
|
TOTAL PRECIOUS METALS |
22,396 |
||
|
Common Stocks - continued |
|||
|
Shares |
Value (Note 1) (000s) |
||
|
RETAIL & WHOLESALE - 4.7% |
|||
|
Apparel Stores - 0.2% |
|||
|
Gap, Inc. |
1,338,164 |
$ 30,025 |
|
|
The Limited, Inc. |
675,773 |
13,515 |
|
|
TJX Companies, Inc. |
471,871 |
8,877 |
|
|
|
52,417 |
||
|
Drug Stores - 0.4% |
|||
|
CVS Corp. |
616,687 |
22,895 |
|
|
Longs Drug Stores Corp. |
63,435 |
1,197 |
|
|
Walgreen Co. |
1,589,159 |
52,244 |
|
|
|
76,336 |
||
|
General Merchandise Stores - 2.3% |
|||
|
Consolidated Stores Corp. (a) |
178,163 |
2,427 |
|
|
Costco Wholesale Corp. (a) |
709,915 |
24,448 |
|
|
Dillards, Inc. Class A |
163,728 |
2,098 |
|
|
Dollar General Corp. |
524,224 |
10,779 |
|
|
Federated Department Stores, Inc. (a) |
335,044 |
9,256 |
|
|
JCPenney Co., Inc. |
415,107 |
5,811 |
|
|
Kmart Corp. (a) |
776,144 |
5,433 |
|
|
Kohls Corp. (a) |
516,739 |
28,937 |
|
|
Nordstrom, Inc. |
211,783 |
3,653 |
|
|
Sears, Roebuck & Co. |
561,130 |
17,500 |
|
|
Target Corp. |
1,399,724 |
32,544 |
|
|
The May Department Stores Co. |
530,716 |
12,173 |
|
|
Wal-Mart Stores, Inc. |
7,012,906 |
332,675 |
|
|
|
487,734 |
||
|
Grocery Stores - 0.4% |
|||
|
Albertson's, Inc. |
666,143 |
14,322 |
|
|
Great Atlantic & Pacific Tea, Inc. |
22,265 |
312 |
|
|
Kroger Co. (a) |
1,313,118 |
29,791 |
|
|
Safeway, Inc. (a) |
780,576 |
38,492 |
|
|
SUPERVALU, Inc. |
206,723 |
3,088 |
|
|
Winn-Dixie Stores, Inc. |
225,627 |
3,145 |
|
|
|
89,150 |
||
|
Retail & Wholesale, Miscellaneous - 1.4% |
|||
|
Alberto-Culver Co. Class B |
87,905 |
2,489 |
|
|
Bed Bath & Beyond, Inc. (a) |
448,252 |
7,872 |
|
|
Best Buy Co., Inc. (a) |
323,188 |
19,957 |
|
|
Circuit City Stores, Inc. - Circuit City Group |
323,487 |
8,390 |
|
|
Home Depot, Inc. |
3,640,547 |
174,974 |
|
|
Lowe's Companies, Inc. |
604,038 |
27,068 |
|
|
Common Stocks - continued |
|||
|
Shares |
Value (Note 1) (000s) |
||
|
RETAIL & WHOLESALE - continued |
|||
|
Retail & Wholesale, Miscellaneous - continued |
|||
|
Office Depot, Inc. (a) |
517,395 |
$ 3,783 |
|
|
RadioShack Corp. |
295,888 |
17,457 |
|
|
Staples, Inc. (a) |
770,260 |
11,843 |
|
|
Tiffany & Co., Inc. |
191,853 |
7,986 |
|
|
Toys 'R' Us, Inc. (a) |
347,864 |
6,327 |
|
|
|
288,146 |
||
|
TOTAL RETAIL & WHOLESALE |
993,783 |
||
|
SERVICES - 0.5% |
|||
|
Advertising - 0.2% |
|||
|
Interpublic Group of Companies, Inc. |
450,878 |
17,246 |
|
|
Omnicom Group, Inc. |
280,156 |
23,376 |
|
|
Young & Rubicam, Inc. |
113,199 |
6,622 |
|
|
|
47,244 |
||
|
Leasing & Rental - 0.0% |
|||
|
Ryder System, Inc. |
128,149 |
2,459 |
|
|
Printing - 0.1% |
|||
|
Deluxe Corp. |
117,607 |
2,587 |
|
|
R.R. Donnelley & Sons Co. |
195,517 |
5,035 |
|
|
|
7,622 |
||
|
Services - 0.2% |
|||
|
Cendant Corp. (a) |
1,118,020 |
14,744 |
|
|
Convergys Corp. (a) |
242,379 |
9,483 |
|
|
Dun & Bradstreet Corp. |
256,521 |
8,465 |
|
|
Ecolab, Inc. |
203,876 |
7,938 |
|
|
H&R Block, Inc. |
156,203 |
5,604 |
|
|
National Service Industries, Inc. |
64,407 |
1,284 |
|
|
|
47,518 |
||
|
TOTAL SERVICES |
104,843 |
||
|
TECHNOLOGY - 34.2% |
|||
|
Communications Equipment - 7.7% |
|||
|
3Com Corp. |
67,529 |
1,123 |
|
|
ADC Telecommunications, Inc. (a) |
994,637 |
40,718 |
|
|
Andrew Corp. (a) |
132,926 |
3,938 |
|
|
Cabletron Systems, Inc. (a) |
291,285 |
10,905 |
|
|
Cisco Systems, Inc. (a) |
10,940,933 |
750,822 |
|
|
Common Stocks - continued |
|||
|
Shares |
Value (Note 1) (000s) |
||
|
TECHNOLOGY - continued |
|||
|
Communications Equipment - continued |
|||
|
Comverse Technology, Inc. (a) |
241,781 |
$ 22,229 |
|
|
Corning, Inc. |
463,603 |
152,033 |
|
|
Lucent Technologies, Inc. |
5,127,865 |
214,409 |
|
|
Nortel Networks Corp. |
4,664,234 |
380,427 |
|
|
Tellabs, Inc. (a) |
650,609 |
36,556 |
|
|
|
1,613,160 |
||
|
Computer Services & Software - 8.5% |
|||
|
Adobe Systems, Inc. |
190,104 |
24,714 |
|
|
America Online, Inc. (a) |
3,612,768 |
211,799 |
|
|
Autodesk, Inc. |
98,116 |
2,760 |
|
|
Automatic Data Processing, Inc. |
987,494 |
58,879 |
|
|
BMC Software, Inc. (a) |
387,269 |
10,456 |
|
|
Ceridian Corp. (a) |
230,622 |
5,578 |
|
|
Citrix Systems, Inc. (a) |
286,101 |
6,294 |
|
|
Computer Associates International, Inc. |
934,451 |
29,669 |
|
|
Computer Sciences Corp. (a) |
264,092 |
20,880 |
|
|
Compuware Corp. (a) |
602,522 |
6,364 |
|
|
Electronic Data Systems Corp. |
733,950 |
36,560 |
|
|
Equifax, Inc. |
237,570 |
6,043 |
|
|
First Data Corp. |
649,619 |
30,979 |
|
|
IMS Health, Inc. |
470,992 |
8,890 |
|
|
Mercury Interactive Corp. (a) |
111,649 |
13,642 |
|
|
Microsoft Corp. (a) |
8,284,595 |
578,368 |
|
|
NCR Corp. (a) |
155,025 |
6,259 |
|
|
Novell, Inc. (a) |
527,013 |
6,456 |
|
|
Oracle Corp. (a) |
4,472,683 |
406,735 |
|
|
Parametric Technology Corp. (a) |
430,875 |
5,763 |
|
|
Paychex, Inc. |
585,406 |
26,124 |
|
|
PeopleSoft, Inc. (a) |
408,440 |
13,172 |
|
|
Sabre Holdings Corp. Class A |
198,313 |
5,528 |
|
|
Sapient Corp. (a) |
188,768 |
9,910 |
|
|
Siebel Systems, Inc. (a) |
317,924 |
62,889 |
|
|
Unisys Corp. (a) |
483,804 |
6,289 |
|
|
VERITAS Software Corp. (a) |
620,722 |
74,836 |
|
|
Yahoo!, Inc. (a) |
854,274 |
103,794 |
|
|
|
1,779,630 |
||
|
Computers & Office Equipment - 8.1% |
|||
|
Adaptec, Inc. (a) |
166,116 |
4,070 |
|
|
Apple Computer, Inc. (a) |
514,569 |
31,357 |
|
|
Common Stocks - continued |
|||
|
Shares |
Value (Note 1) (000s) |
||
|
TECHNOLOGY - continued |
|||
|
Computers & Office Equipment - continued |
|||
|
Compaq Computer Corp. |
2,675,354 |
$ 91,129 |
|
|
Dell Computer Corp. (a) |
4,052,141 |
176,775 |
|
|
EMC Corp. (a) |
3,414,039 |
334,576 |
|
|
Gateway, Inc. (a) |
505,680 |
34,437 |
|
|
Hewlett-Packard Co. |
1,573,791 |
190,035 |
|
|
International Business Machines Corp. |
2,794,384 |
368,859 |
|
|
Lexmark International Group, Inc. Class A (a) |
204,037 |
13,836 |
|
|
Network Appliance, Inc. (a) |
480,406 |
56,208 |
|
|
Palm, Inc. |
818,433 |
36,011 |
|
|
Pitney Bowes, Inc. |
409,145 |
14,959 |
|
|
Seagate Technology, Inc. (a) |
344,938 |
20,481 |
|
|
Sun Microsystems, Inc. (a) |
2,496,260 |
316,869 |
|
|
Xerox Corp. |
1,055,246 |
16,950 |
|
|
|
1,706,552 |
||
|
Electronic Instruments - 1.2% |
|||
|
Agilent Technologies, Inc. |
716,955 |
43,241 |
|
|
Applied Materials, Inc. (a) |
1,268,820 |
109,515 |
|
|
KLA-Tencor Corp. (a) |
291,574 |
19,135 |
|
|
Novellus Systems, Inc. (a) |
183,309 |
11,285 |
|
|
PE Corp. - Biosystems Group |
330,707 |
32,533 |
|
|
PerkinElmer, Inc. |
73,904 |
6,647 |
|
|
Tektronix, Inc. |
73,081 |
5,568 |
|
|
Teradyne, Inc. (a) |
275,224 |
17,838 |
|
|
Thermo Electron Corp. (a) |
242,904 |
5,648 |
|
|
|
251,410 |
||
|
Electronics - 8.5% |
|||
|
Advanced Micro Devices, Inc. (a) |
475,336 |
17,885 |
|
|
Altera Corp. (a) |
630,244 |
40,848 |
|
|
Analog Devices, Inc. (a) |
557,088 |
55,987 |
|
|
Broadcom Corp. Class A (a) |
337,772 |
84,443 |
|
|
Conexant Systems, Inc. (a) |
343,190 |
12,762 |
|
|
Intel Corp. |
10,536,504 |
788,921 |
|
|
JDS Uniphase Corp. (a) |
1,456,140 |
181,267 |
|
|
Linear Technology Corp. |
492,872 |
35,456 |
|
|
LSI Logic Corp. (a) |
472,995 |
16,998 |
|
|
Maxim Integrated Products, Inc. (a) |
447,783 |
39,265 |
|
|
Micron Technology, Inc. (a) |
875,268 |
71,553 |
|
|
Molex, Inc. |
317,191 |
16,752 |
|
|
Motorola, Inc. |
3,393,780 |
122,388 |
|
|
Common Stocks - continued |
|||
|
Shares |
Value (Note 1) (000s) |
||
|
TECHNOLOGY - continued |
|||
|
Electronics - continued |
|||
|
National Semiconductor Corp. (a) |
282,564 |
$ 12,574 |
|
|
Sanmina Corp. (a) |
205,263 |
24,221 |
|
|
Solectron Corp. (a) |
947,637 |
42,940 |
|
|
Texas Instruments, Inc. |
2,715,630 |
181,777 |
|
|
Xilinx, Inc. (a) |
507,979 |
45,147 |
|
|
|
1,791,184 |
||
|
Photographic Equipment - 0.2% |
|||
|
Eastman Kodak Co. |
487,107 |
30,322 |
|
|
Polaroid Corp. |
70,644 |
1,201 |
|
|
|
31,523 |
||
|
TOTAL TECHNOLOGY |
7,173,459 |
||
|
TRANSPORTATION - 0.5% |
|||
|
Air Transportation - 0.2% |
|||
|
AMR Corp. |
235,382 |
7,723 |
|
|
Delta Air Lines, Inc. |
192,625 |
9,535 |
|
|
Southwest Airlines Co. |
780,400 |
17,657 |
|
|
US Airways Group, Inc. (a) |
104,788 |
3,563 |
|
|
|
38,478 |
||
|
Railroads - 0.2% |
|||
|
Burlington Northern Santa Fe Corp. |
673,432 |
15,068 |
|
|
CSX Corp. |
343,567 |
8,203 |
|
|
Norfolk Southern Corp. |
602,424 |
9,676 |
|
|
Union Pacific Corp. |
389,704 |
15,491 |
|
|
|
48,438 |
||
|
Trucking & Freight - 0.1% |
|||
|
FedEx Corp. (a) |
476,477 |
19,226 |
|
|
TOTAL TRANSPORTATION |
106,142 |
||
|
UTILITIES - 9.1% |
|||
|
Cellular - 1.1% |
|||
|
ALLTEL Corp. |
506,907 |
25,630 |
|
|
Nextel Communications, Inc. Class A (a) |
1,177,180 |
65,260 |
|
|
QUALCOMM, Inc. (a) |
1,172,559 |
70,207 |
|
|
Sprint Corp. - PCS Group Series 1 (a) |
1,440,760 |
72,308 |
|
|
|
233,405 |
||
|
Common Stocks - continued |
|||
|
Shares |
Value (Note 1) (000s) |
||
|
UTILITIES - continued |
|||
|
Electric Utility - 1.9% |
|||
|
AES Corp. (a) |
677,404 |
$ 43,185 |
|
|
Ameren Corp. |
204,801 |
8,282 |
|
|
American Electric Power Co., Inc. |
514,748 |
18,145 |
|
|
Cinergy Corp. |
245,511 |
7,212 |
|
|
CMS Energy Corp. |
187,794 |
4,906 |
|
|
Consolidated Edison, Inc. |
337,345 |
10,563 |
|
|
Constellation Energy Corp. |
224,900 |
8,602 |
|
|
CP&L Energy, Inc. |
231,584 |
8,569 |
|
|
Dominion Resources, Inc. |
383,610 |
20,331 |
|
|
DTE Energy Co. |
232,293 |
8,072 |
|
|
Duke Energy Corp. |
584,882 |
43,756 |
|
|
Edison International |
545,587 |
11,287 |
|
|
Entergy Corp. |
366,007 |
11,140 |
|
|
FirstEnergy Corp. |
339,676 |
8,407 |
|
|
Florida Progress Corp. |
164,227 |
8,519 |
|
|
FPL Group, Inc. |
288,533 |
15,400 |
|
|
GPU, Inc. |
169,887 |
5,203 |
|
|
Niagara Mohawk Holdings, Inc. (a) |
221,524 |
2,852 |
|
|
PECO Energy Co. |
269,898 |
13,006 |
|
|
PG&E Corp. |
622,641 |
18,018 |
|
|
Pinnacle West Capital Corp. |
144,293 |
5,943 |
|
|
PPL Corp. |
212,431 |
7,116 |
|
|
Public Service Enterprise Group, Inc. |
352,975 |
12,795 |
|
|
Reliant Energy, Inc. |
478,682 |
17,771 |
|
|
Southern Co. |
1,032,331 |
30,905 |
|
|
TXU Corp. |
419,776 |
14,666 |
|
|
Unicom Corp. |
282,915 |
12,926 |
|
|
XCEL Energy, Inc. |
465,661 |
11,671 |
|
|
|
389,248 |
||
|
Gas - 0.9% |
|||
|
Columbia Energy Group |
126,833 |
8,902 |
|
|
Eastern Enterprises Co. |
42,646 |
2,697 |
|
|
El Paso Energy Corp. |
363,699 |
21,185 |
|
|
Enron Corp. |
1,139,760 |
96,737 |
|
|
KeySpan Corp. |
195,500 |
6,733 |
|
|
NICOR, Inc. |
73,065 |
2,694 |
|
|
ONEOK, Inc. |
45,871 |
1,465 |
|
|
Peoples Energy Corp. |
55,530 |
1,805 |
|
|
Common Stocks - continued |
|||
|
Shares |
Value (Note 1) (000s) |
||
|
UTILITIES - continued |
|||
|
Gas - continued |
|||
|
Sempra Energy |
300,521 |
$ 5,860 |
|
|
Williams Companies, Inc. |
687,963 |
31,689 |
|
|
|
179,767 |
||
|
Telephone Services - 5.2% |
|||
|
AT&T Corp. |
5,861,870 |
184,649 |
|
|
BellSouth Corp. |
2,970,182 |
110,825 |
|
|
CenturyTel, Inc. |
220,892 |
6,364 |
|
|
Global Crossing Ltd. (a) |
1,343,240 |
40,381 |
|
|
Qwest Communications International, Inc. (a) |
2,539,160 |
131,084 |
|
|
SBC Communications, Inc. |
5,360,262 |
223,791 |
|
|
Sprint Corp. - FON Group |
1,388,984 |
46,531 |
|
|
Verizon Communications |
4,287,779 |
187,054 |
|
|
WorldCom, Inc. (a) |
4,512,635 |
164,711 |
|
|
|
1,095,390 |
||
|
TOTAL UTILITIES |
1,897,810 |
||
|
TOTAL COMMON STOCKS (Cost $11,200,189) |
20,928,496 |
||
|
U.S. Treasury Obligations - 0.2% |
|||||
|
Moody's |
Principal Amount (000s) |
|
|||
|
U.S. Treasury Bills, yield at date of purchase
5.87% to 6.25% 9/28/00 to 11/16/00 (c) |
- |
|
$ 46,395 |
45,876 |
|
|
Cash Equivalents - 4.8% |
|||
|
Shares |
Value (Note 1) |
||
|
Bankers Trust Institutional Daily Asset Fund, 6.6883% (b) |
1,008,522,869 |
$ 1,008,523 |
|
|
TOTAL INVESTMENT PORTFOLIO - 104.9% (Cost $12,254,588) |
21,982,895 |
||
|
NET OTHER ASSETS - (4.9)% |
(1,030,375) |
||
|
NET ASSETS - 100% |
$ 20,952,520 |
||
|
Futures Contracts |
|||||
|
|
Expiration Date |
Underlying Face Amount at Value (000s) |
Unrealized Gain/Loss (000s) |
||
|
Purchased |
|||||
|
64 S&P 500 Stock Index Contracts |
Sept. 2000 |
$ 24,339 |
$ 1,225 |
||
|
The face value of futures purchased as a percentage of net assets - 0.1% |
|
Legend |
|
(a) Non-income producing |
|
(b) The rate quoted is the annualized seven-day yield of the fund at |
|
(c) Security or a portion of the security was pledged to cover margin requirements for futures contracts. At the period end, the value of securities pledged amounted to $5,119,000. |
|
Income Tax Information |
|
At August 31, 2000, the aggregate |
See accompanying notes which are an integral part of the financial statements.
Semiannual Report
Statement of Assets and Liabilities
|
Amounts in thousands (except per-share amounts) |
August 31, 2000 (Unaudited) |
|
|
Assets |
|
|
|
Investment in securities, at value (cost $12,254,588) - |
|
$ 21,982,895 |
|
Cash |
|
1 |
|
Receivable for investments sold |
|
1,589 |
|
Receivable for fund shares sold |
|
27,869 |
|
Dividends receivable |
|
26,534 |
|
Receivable for daily variation on futures contracts |
|
536 |
|
Other receivables |
|
201 |
|
Total assets |
|
22,039,625 |
|
Liabilities |
|
|
|
Payable for investments purchased |
$ 42,418 |
|
|
Payable for fund shares redeemed |
32,532 |
|
|
Accrued management fee |
878 |
|
|
Other payables and accrued expenses |
2,754 |
|
|
Collateral on securities loaned, at value |
1,008,523 |
|
|
Total liabilities |
|
1,087,105 |
|
Net Assets |
|
$ 20,952,520 |
|
Net Assets consist of: |
|
|
|
Paid in capital |
|
$ 11,319,682 |
|
Undistributed net investment income |
|
35,554 |
|
Accumulated undistributed net realized gain (loss) on investments and foreign currency transactions |
|
(132,260) |
|
Net unrealized appreciation (depreciation) on investments and assets and liabilities in foreign currencies |
|
9,729,544 |
|
Net Assets, for 388,719 shares outstanding |
|
$ 20,952,520 |
|
Net Asset Value, offering price and redemption price |
|
$53.90 |
See accompanying notes which are an integral part of the financial statements.
Semiannual Report
Financial Statements - continued
Statement of Operations
|
Amounts in thousands |
Six months ended August 31, 2000 (Unaudited) |
|
|
Investment Income Dividends |
|
$ 117,274 |
|
Interest |
|
4,965 |
|
Security lending |
|
1,055 |
|
Total income |
|
123,294 |
|
Expenses |
|
|
|
Management fee and sub-advisory fee |
$ 24,513 |
|
|
Transfer agent fees |
13,822 |
|
|
Accounting fees |
651 |
|
|
Non-interested trustees' compensation |
45 |
|
|
Registration fees |
307 |
|
|
Audit |
78 |
|
|
Legal |
47 |
|
|
Interest |
5 |
|
|
Reports to shareholders |
365 |
|
|
Miscellaneous |
3 |
|
|
Total expenses before reductions |
39,836 |
|
|
Expense reductions |
(21,932) |
17,904 |
|
Net investment income |
|
105,390 |
|
Realized and Unrealized Gain (Loss) Net realized gain (loss) on: |
|
|
|
Investment securities |
(49,089) |
|
|
Futures contracts |
3,431 |
(45,658) |
|
Change in net unrealized appreciation (depreciation) on: |
|
|
|
Investment securities |
2,112,175 |
|
|
Assets and liabilities in foreign currencies |
1 |
|
|
Futures contracts |
1,272 |
2,113,448 |
|
Net gain (loss) |
|
2,067,790 |
|
Net increase (decrease) in net assets resulting |
|
$ 2,173,180 |
See accompanying notes which are an integral part of the financial statements.
Semiannual Report
Financial Statements - continued
Statement of Changes in Net Assets
|
Amounts in thousands |
Six months ended
August 31, 2000 |
Year ended February 29, 2000 |
|
Increase (Decrease) in Net Assets |
|
|
|
Operations |
$ 105,390 |
$ 207,643 |
|
Net realized gain (loss) |
(45,658) |
488,795 |
|
Change in net unrealized appreciation (depreciation) |
2,113,448 |
1,135,914 |
|
Net increase (decrease) in net assets resulting |
2,173,180 |
1,832,352 |
|
Distributions to shareholders |
(103,783) |
(205,943) |
|
From net realized gain |
- |
(119,245) |
|
Total distributions |
(103,783) |
(325,188) |
|
Share transactions |
3,765,131 |
8,777,752 |
|
Reinvestment of distributions |
102,435 |
320,772 |
|
Cost of shares redeemed |
(3,620,918) |
(7,734,901) |
|
Net increase (decrease) in net assets resulting |
246,648 |
1,363,623 |
|
Total increase (decrease) in net assets |
2,316,045 |
2,870,787 |
|
Net Assets |
|
|
|
Beginning of period |
18,636,475 |
15,765,688 |
|
End of period (including undistributed net investment income of $35,554 and $33,947, respectively) |
$ 20,952,520 |
$ 18,636,475 |
|
Other Information Shares |
|
|
|
Sold |
72,996 |
182,069 |
|
Issued in reinvestment of distributions |
2,026 |
6,689 |
|
Redeemed |
(70,366) |
(160,547) |
|
Net increase (decrease) |
4,656 |
28,211 |
See accompanying notes which are an integral part of the financial statements.
Semiannual Report
Financial Highlights
|
|
Six months ended August 31, 2000 |
Years ended February 28, |
||||
|
|
(Unaudited) |
2000 G |
1999 |
1998 |
1997 |
1996 G |
|
Selected Per-Share Data |
|
|
|
|
|
|
|
Net asset value, beginning of period |
$ 48.52 |
$ 44.30 |
$ 37.90 |
$ 28.85 |
$ 23.56 |
$ 18.02 |
|
Income from Invest- |
|
|
|
|
|
|
|
Net investment |
.27 D |
.55 D |
.53 D |
.55 D |
.51 D |
.48 |
|
Net realized |
5.38 |
4.54 |
6.74 |
9.29 |
5.47 |
5.63 |
|
Total from investment operations |
5.65 |
5.09 |
7.27 |
9.84 |
5.98 |
6.11 |
|
Less Distributions |
|
|
|
|
|
|
|
From net investment income |
(.27) |
(.55) |
(.53) |
(.54) |
(.49) |
(.46) |
|
From net |
- |
(.32) |
(.34) |
(.25) |
(.20) |
(.11) |
|
Total distributions |
(.27) |
(.87) |
(.87) |
(.79) |
(.69) |
(.57) |
|
Net asset value, |
$ 53.90 |
$ 48.52 |
$ 44.30 |
$ 37.90 |
$ 28.85 |
$ 23.56 |
|
Total Return B, C |
11.68% |
11.53% |
19.50% |
34.65% |
25.87% |
34.37% |
|
Ratios and Supplemental Data |
|
|
|
|
|
|
|
Net assets, |
$ 20,953 |
$ 18,636 |
$ 15,766 |
$ 11,177 |
$ 6,487 |
$ 4,113 |
|
Ratio of expenses |
.19% A, E |
.19% E |
.19% E |
.20% E |
.28% E |
.28% E |
|
Ratio of expenses to average net assets after expense reductions |
.18% A, F |
.18% F |
.18% F |
.19% F |
.26% F |
.25% F |
|
Ratio of net invest- |
1.03% A |
1.14% |
1.33% |
1.66% |
2.00% |
2.34% |
|
Portfolio turnover rate |
9% A |
8% |
4% |
2% |
3% |
1% |
A Annualized
B Total returns for periods of less than one year are not annualized.
C The total returns would have been lower had certain expenses not been reduced during the periods shown.
D Net investment income per share has been calculated based on average shares outstanding during the period.
E FMR agreed to reimburse a portion of the fund's expenses during the period. Without this reimbursement, the fund's expense ratio would have been higher.
F FMR or the fund has entered into varying arrangements with third parties who either paid or reduced a portion of the fund's expenses.
G For the year ended February 29
See accompanying notes which are an integral part of the financial statements.
Semiannual Report
For the period ended August 31, 2000 (Unaudited)
1. Significant Accounting Policies.
Spartan U.S. Equity Index (the fund) is a fund of Fidelity Concord Street Trust (the trust) and is authorized to issue an unlimited number of shares. The trust is registered under the Investment Company Act of 1940, as amended, as an open-end management investment company organized as a Massachusetts business trust. The financial statements have been prepared in conformity with generally accepted accounting principles which require management to make certain estimates and assumptions at the date of the financial statements. The following summarizes the significant accounting policies of the fund:
Security Valuation. Securities for which exchange quotations are readily available are valued at the last sale price, or if no sale price, at the closing bid price. Foreign securities are valued based on quotations from the principal market in which such securities are normally traded. If trading or events occurring in other markets after the close of the principal market in which foreign securities are traded, and before the close of the business of the fund, are expected to materially affect the value of those securities, then they are valued at their fair value taking this trading or these events into account. Fair value is determined in good faith under consistently applied procedures under the general supervision of the Board of Trustees. Securities for which exchange quotations are not readily available (and in certain cases debt securities which trade on an exchange) are valued primarily using dealer-supplied valuations or at their fair value. Short-term securities with remaining maturities of sixty days or less for which quotations are not readily available are valued at amortized cost or original cost plus accrued interest, both of which approximate current value.
Foreign Currency Translation. The accounting records of the fund are maintained in U.S. dollars. Investment securities and other assets and liabilities denominated in a foreign currency are translated into U.S. dollars at the prevailing rates of exchange at period end. Purchases and sales of securities, income receipts and expense payments are translated into U.S. dollars at the prevailing exchange rate on the respective dates of the transactions.
Net realized gains and losses on foreign currency transactions represent net gains and losses from sales and maturities of foreign currency contracts, disposition of foreign currencies, the difference between the amount of net investment income accrued and the U.S. dollar amount actually received, and gains and losses between trade and settlement date on purchases and sales of securities. The effects of changes in foreign currency exchange rates on investments in securities are included with the net realized and unrealized gain or loss on investment securities.
Income Taxes. As a qualified regulated investment company under Subchapter M of the Internal Revenue Code, the fund is not subject to income taxes to the extent that it distributes substantially all of its taxable income for its fiscal year. The schedule of investments includes information regarding income taxes under the caption "Income Tax Information."
Semiannual Report
Notes to Financial Statements (Unaudited) - continued
1. Significant Accounting Policies - continued
Investment Income. Dividend income is recorded on the ex-dividend date, except certain dividends from foreign securities where the ex-dividend date may have passed, are recorded as soon as the fund is informed of the ex-dividend date. Non-cash dividends included in dividend income, if any, are recorded at the fair market value of the securities received. Interest income, which includes accretion of original issue discount, is accrued as earned. Investment income is recorded net of foreign taxes withheld where recovery of such taxes is uncertain.
Expenses. Most expenses of the trust can be directly attributed to a fund. Expenses which cannot be directly attributed are apportioned among the funds in the trust.
Deferred Trustee Compensation. Under a Deferred Compensation Plan (the Plan) non-interested Trustees must defer receipt of a portion of, and may elect to defer receipt of an additional portion of, their annual compensation. Deferred amounts are treated as though equivalent dollar amounts had been invested in shares of the fund or are invested in a cross-section of other Fidelity funds. Deferred amounts remain in the fund until distributed in accordance with the Plan.
Distributions to Shareholders. Distributions are recorded on the ex-dividend date.
Income and capital gain distributions are determined in accordance with income tax regulations which may differ from generally accepted accounting principles. These differences, which may result in distribution reclassifications, are primarily due to differing treatments for litigation proceeds, futures transactions, market discount, redemptions in kind and losses deferred due to wash sales and excise tax regulations. The fund also utilized earnings and profits distributed to shareholders on redemption of shares as a part of the dividends paid deduction for income tax purposes.
Permanent book and tax basis differences relating to shareholder distributions will result in reclassifications to paid in capital. Undistributed net investment income and accumulated undistributed net realized gain (loss) on investments and foreign currency transactions may include temporary book and tax basis differences which will reverse in a subsequent period. Any taxable income or gain remaining at fiscal year end is distributed in the following year.
Security Transactions. Security transactions are accounted for as of trade date. Gains and losses on securities sold are determined on the basis of identified cost.
2. Operating Policies.
Foreign Currency Contracts. The fund generally uses foreign currency contracts to facilitate transactions in foreign-denominated securities. Losses may arise from changes in the value of the foreign currency or if the counterparties do not perform under the contracts' terms. The U.S. dollar value of foreign currency contracts is determined using contractual currency exchange rates established at the time of each trade.
Semiannual Report
Notes to Financial Statements (Unaudited) - continued
2. Operating Policies - continued
Futures Contracts. The fund may use futures contracts to manage its exposure to the stock market. Buying futures tends to increase the fund's exposure to the underlying instrument, while selling futures tends to decrease the fund's exposure to the underlying instrument or hedge other fund investments. Futures contracts involve, to varying degrees, risk of loss in excess of the futures variation margin reflected in the Statement of Assets and Liabilities. The underlying face amount at value of any open futures contracts at period end is shown in the schedule of investments under the caption "Futures Contracts." This amount reflects each contract's exposure to the underlying instrument at period end. Losses may arise from changes in the value of the underlying instruments or if the counterparties do not perform under the contracts' terms. Gains (losses) are realized upon the expiration or closing of the futures contracts. Futures contracts are valued at the settlement price established each day by the board of trade or exchange on which they are traded.
3. Purchases and Sales of Investments.
Purchases and sales of securities, other than short-term securities, aggregated $1,292,346,000 and $950,239,000, respectively.
The market value of futures contracts opened and closed during the period amounted to $1,882,022,000 and $1,960,142,000, respectively.
4. Fees and Other Transactions with Affiliates.
Management Fee. As the fund's investment adviser, Fidelity Management & Research Company (FMR) receives a fee that is computed daily at an annual rate of .24% of the fund's average net assets.
Sub-Adviser and Security Lending Fees. FMR and the fund have entered into a sub-advisory agreement with Bankers Trust Company (Bankers Trust). Bankers Trust receives a sub-advisory fee for providing investment management and custodial services to the fund. For these services, FMR pays Bankers Trust fees at an annual rate of 0.006% of the fund's average net assets.
Under a separate securities lending agreement with Bankers Trust, the fund receives at least 70% of net income from the securities lending program. Bankers Trust retains no more than 30% of net income under this agreement. For the period, Bankers Trust retained $126,000.
In March 1999, Bankers Trust announced that it had reached an agreement with the U.S. Attorney's Office to resolve an investigation concerning inappropriate transfers of unclaimed funds and related recordkeeping problems that occurred between 1994 and 1996. As a result of the plea, absent an order from the Securities and Exchange Commission (SEC), Bankers Trust would not have been able to provide investment advisory services of the funds. The SEC previously granted a temporary order to permit Bankers Trust and its affiliates to provide investment advisory services to registered investment companies. On July 10, 2000, the SEC granted Bankers Trust a permanent order.
Semiannual Report
Notes to Financial Statements (Unaudited) - continued
4. Fees and Other Transactions with Affiliates - continued
Transfer Agent Fees. Fidelity Investments Institutional Operations Company, Inc. (FIIOC), an affiliate of FMR, is the fund's transfer, dividend disbursing and shareholder servicing agent. FIIOC receives account fees and asset-based fees that vary according to account size and type of account. FIIOC pays for typesetting, printing and mailing of all shareholder reports, except proxy statements. For the period, the transfer agent fees were equivalent to an annualized rate of .14% of average net assets.
Accounting Fees. Fidelity Service Company, Inc., an affiliate of FMR, maintains the fund's accounting records. The fee is based on the level of average net assets for the month plus out-of-pocket expenses.
Brokerage Commissions. The fund placed a portion of its portfolio transactions with brokerage firms which are affiliates of Bankers Trust. The commissions paid to these affiliated firms were $63,000 for the period.
5. Security Lending.
The fund lends portfolio securities from time to time in order to earn additional income. The fund receives collateral in the form of U.S. Treasury obligations,
letters of credit, and/or cash against the loaned securities, and maintains collateral in an amount not less than 100% of the market value of the loaned securities during the period of the loan. The market value of the loaned securities is determined at the close of business of the fund and any additional required collateral is delivered to the fund on the next business day. If the borrower defaults on its obligation to return the securities loaned because of insolvency or other reasons, the fund could experience delays and costs in recovering the securities loaned or in gaining access to the collateral. At period end, the value of the securities loaned amounted to $981,468,000. The fund received cash collateral of $1,008,523,000 which was invested in the Bankers Trust Institutional Daily Asset Fund.
6. Bank Borrowings.
The fund is permitted to have bank borrowings for temporary or emergency purposes to fund shareholder redemptions. The fund has established borrowing arrangements with certain banks. The interest rate on the borrowings is the bank's base rate, as revised from time to time. The average daily loan balance during the period for which loans were outstanding amounted to $7,315,000. The weighted average interest rate was 6.3%.
Semiannual Report
Notes to Financial Statements (Unaudited) - continued
7. Expense Reductions.
FMR voluntarily agreed to reimburse the fund's operating expenses (excluding interest, taxes, brokerage commissions, extraordinary expenses and sub-advisory fees paid by the fund associated with securities lending) above an annual rate of .19% of average net assets. For the period, the reimbursement reduced expenses by $20,442,000.
In addition, through arrangements with the fund's custodian and transfer agent, credits realized as a result of uninvested cash balances were used to reduce a portion of the fund's expenses. During the period, the fund's custodian and transfer agent fees were reduced by $36,000 and $1,454,000, respectively, under these arrangements.
Semiannual Report
Semiannual Report
Semiannual Report
Investment Adviser
Fidelity Management & Research Company
Boston, MA
Investment Sub-Adviser
Bankers Trust Company
Officers
Edward C. Johnson 3d, President
Robert C. Pozen, Senior Vice President
Robert A. Lawrence, Vice President
Eric D. Roiter, Secretary
Robert A. Dwight, Treasurer
Maria F. Dwyer, Deputy Treasurer
John H. Costello, Assistant Treasurer
Thomas J. Simpson, Assistant Treasurer
Board of Trustees
Ralph F. Cox *
Phyllis Burke Davis *
Robert M. Gates *
Edward C. Johnson 3d
Donald J. Kirk *
Ned C. Lautenbach *
Peter S. Lynch
Marvin L. Mann *
William O. McCoy *
Gerald C. McDonough *
Robert C. Pozen
Thomas R. Williams *
Advisory Board
J. Michael Cook
Abigail P. Johnson
Marie L. Knowles
General Distributor
Fidelity Distributors Corporation
Boston, MA
* Independent trustees(Fidelity Investment logo)(registered trademark)
Corporate Headquarters
82 Devonshire St., Boston, MA 02109
www.fidelity.com
Transfer and Shareholder Servicing Agent
Fidelity Investments Institutional
Operations Company, Inc.
Boston, MA
Custodian
Bankers Trust Company
New York, NY
|
UEI-SANN-1000 |
112811 |
|
1.536672.103 |
|
|
|