
|
|
|
|
|
|
|
|
|
GOLDMAN SACHS MID CAP VALUE FUND
Market Overview
Dear Shareholder:
During the period under review the financial markets experienced a dramatic increase in volatility. However, investors who stayed the course were generally rewarded for their disciplined approach, as many sectors of the market generated solid returns.
While a range of stocks were negatively impacted by the correction, technology issues experienced the brunt of the decline. At one point the technology-heavy Nasdaq composite was down 37% from its peak. While the NASDAQ posted a one-year return of 45.93% for the period ended August 31, 2000, this was largely due to the strong performance of technology stocks late in 1999 and in the summer of 2000. However, by the end of the reporting period the NASDAQ was still off 19% from its peak. In contrast, the S&P 500 Index, which also fell during the middle of the period, recovered to the point that it was again nearing its record high by the end of August.
As always, we appreciate your support and we look forward to serving your investment needs in the years to come.
Sincerely,
 |
 |
|
|
David B. Ford
|
David W. Blood
|
|
September 15, 2000
GOLDMAN SACHS MID CAP VALUE FUND
Fund Basics
as of August 31, 2000
| PERFORMANCE REVIEW | ||||||
| August 31, 1999–August 31, 2000 | Fund Total Return (without sales charge)1
|
Russell MidCap Value Index2 | Russell MidCap Index2
|
|||
| |
||||||
| Class A | 8.70 | % | 6.27 | % | 28.84 | % |
| Class B | 8.01 | 6.27 | 28.84 | |||
| Class C | 7.84 | 6.27 | 28.84 | |||
| Institutional | 9.08 | 6.27 | 28.84 | |||
| Service | 8.48 | 6.27 | 28.84 | |||
| |
||||||
1 The net asset value represents the net assets of the Fund (ex-dividend) divided by the total number of shares. The Fund’s performance assumes the reinvestment of dividends and other distributions.
2 The Russell MidCap Value Index, an unmanaged index of common stock prices, replaced the Russell MidCap Index as of 11/30/99 as the Mid Cap Value Fund’s performance benchmark. The Russell MidCap Value Index (with dividends reinvested) includes more value-oriented stocks and, therefore, is expected to be a better benchmark comparison for the Fund’s performance. The Russell MidCap Index is an unmanaged index of common stock prices. Index figures do not reflect any fees or expenses. In addition, investors cannot invest directly in the Index.
| STANDARDIZED TOTAL RETURNS3 | ||||||||||
| For the period ended 6/30/00 | Class A
|
Class B
|
Class C
|
Institutional
|
Service
|
|||||
| |
||||||||||
| One Year | –16.31 | % | –16.48 | % | –13.03 | % | –11.21 | % | –11.68 | % |
| Since Inception | –2.25 | –1.99 | –0.94 | 11.41 | 0.56 | |||||
| (8/15/97)
|
(8/15/97)
|
(8/15/97)
|
(8/1/95)
|
(7/18/97)
|
||||||
| |
||||||||||
3 The Standardized Total Returns are average annual total returns or cumulative total returns (only if the performance period is one year or less) as of the most recent calendar quarter-end. They assume reinvestment of all distributions at net asset value. These returns reflect a maximum initial sales charge of 5.5% for Class A shares, the assumed deferred sales charge for Class B shares (5% maximum declining to 0% after six years) and the assumed deferred sales charge for Class C shares (1% if redeemed within 12 months of purchase). Because Institutional and Service shares do not involve a sales charge, such a charge is not applied to their Standardized Total Returns.
Total return figures represent past performance and do not indicate future results, which will vary. The investment return and principal value of an investment will fluctuate and, therefore, an investor’s shares, when redeemed, may be worth more or less than their original cost. Performance reflects fee waivers and expense limitations in effect. In their absence, performance would be reduced.
| TOP 10 HOLDINGS AS OF 8/31/00 | |||
| Holding | % of Total Net Assets
|
Line of Business
|
|
| |
|||
| Old Republic International Corp.
|
2.4
|
%
|
Property Insurance
|
| Synopsys, Inc.
|
2.1
|
Computer Software
|
|
| Public Service Co. of New Mexico
|
2.0
|
Electrical Utilities
|
|
| Georgia-Pacific Corp. (Timber Group)
|
1.9
|
Forest
|
|
| Everest Re Group, Ltd.
|
1.8
|
Property Insurance
|
|
| Manor Care, Inc.
|
1.8
|
Medical Providers
|
|
| Northeast Utilities
|
1.7
|
Electrical Utilities
|
|
| Pacific Century Financial Corp.
|
1.6
|
Banks
|
|
| Ambac Financial Group, Inc.
|
1.6
|
Property Insurance
|
|
| Ross Stores, Inc.
|
1.6
|
Clothing
|
|
| |
|||
The top 10 holdings may not be representative of the Fund’s future investments.
GOLDMAN SACHS MID CAP VALUE FUND
Performance Overview
Dear Shareholder,
We are pleased to report on the performance of the Goldman Sachs Mid Cap Value Fund for the one year period that ended August 31, 2000.
Performance Review
Over the one-year period that ended August 31, 2000, the Fund’s Class A, B, C, Institutional and Service shares generated cumulative total returns, without sales charges, of 8.70%, 8.01%, 7.84%, 9.08%, and 8.48%, respectively. These figures compare favorably to the 6.27% cumulative total return of the Fund’s benchmark, the Russell MidCap Value Index.
This year continues to be a volatile environment for value stocks. Even though mid-cap value stocks posted positive absolute returns, particularly from March through May when the high valuations of many growth companies concerned investors, they still trail their growth counterparts in 2000. For the year-to-date that ended August 31, 2000 the Russell MidCap Value Index appreciated 7.9%, versus a 13.9% return for the Russell MidCap Index.
Portfolio Highlights
During the reporting period, the Fund’s outperformance was largely due to strong stock selection. Our disciplined investment process and intense focus on the critical factors that determine sustainable cash flow provided us with the confidence to invest in well-positioned mid-cap companies during a period that was oftentimes in the midst of unusual market volatility. Our in-depth research, which includes a detailed financial analysis, a thorough assessment of possible risks, as well as visits to management, frequently allowed us to eliminate from consideration inexpensive mid-cap stocks that are fundamentally poorly positioned and are likely to remain that way. By seeking to eliminate suspect investments from the Fund we believe our resulting portfolio was well-positioned to benefit from an earnings recovery.

Portfolio Outlook
We continue to believe that the current environment offers tremendous investment opportunity for mid-cap value stocks. Improved absolute returns reflect not only a renewed interest in the extended market but, more importantly, a renaissance of value investing after a lengthy hiatus. In addition, several mid-cap value companies were acquired, which helped to generate interest in the sector. It is not surprising that the Mid Cap Value Fund benefited from several takeovers in its holdings during the year. We believe merger activity should continue to be a positive catalyst for the sector, as their current prices offer large corporate buyers a very favorable return on investment.
The Fund has also benefited from an enhancement to its portfolio management team. A senior portfolio manager with twenty-eight years experience joined the team as a group head, along with another research analyst. Not only does this allow an increased degree of industry and sector specialization, but it underscores a commitment to provide continued investment excellence.
As always, we appreciate your investment and look forward to earning your continued confidence in the years to come.
Goldman Sachs Mid Cap Value Investment Team
New York
September 15, 2000
GOLDMAN SACHS MID CAP VALUE FUND
The Goldman Sachs Advantage
Founded in 1869, Goldman, Sachs & Co. is a premier financial services firm traditionally known on Wall Street and around the world for its institutional expertise.
Today, the firm’s Investment Management Division provides individual investors the opportunity to tap the resources of a global institutional powerhouse — and put this expertise to work in their individual portfolios.
What Sets Goldman Sachs Funds Apart?

Our portfolio management teams are located on-site, around the world, in New York, London, Tokyo and Singapore. Their understanding of local economies, markets, industries and cultures helps deliver what many investors want: access to global investment opportunities and consistent, risk-adjusted performance.

Our portfolio management teams make on-site visits to hundreds of companies each month, then construct selective portfolios with an emphasis on their best ideas. Our teams also have access to Goldman, Sachs & Co.’s Global Investment Research Department.

In this, our institutional heritage is clear. Institutions, as well as many individual investors, often look to us to manage the risks of global investing over time in different market environments.
To learn more about the Goldman Sachs Funds, call your investment professional today.
| The following graph shows the value as of August 31, 2000, of a $10,000 investment made on August 1, 1995 (commence ment of
operations) in the Institutional Class of shares of the Goldman Sachs Mid Cap Value Fund. For comparative purposes, the performance of the Fund’s new benchmark (the Russell MidCap Value Index (with dividends reinvested) as of November 30, 1999, and
the Fund’s previous benchmark, the Russell MidCap Index (with dividends reinvested)) with dividends reinvested are shown. This performance data represents past performance and should not be considered indicative of future performance which will
fluctuate with changes in market conditions. These performance fluctuations will cause an investor’s shares, when redeemed, to be worth more or less than their original cost. Performance of Class A, Class B, Class C and Service Shares will vary from
the Institutional Class of Shares due to differences in fees and loads.
|
| Mid Cap Value Fund’s Lifetime Performance
|
| Growth of a $10,000 Investment, Distributions Reinvested August 1, 1995 to August 31, 2000.
|

| Average Annual Total Return through August 31, 2000 | Since Inception | Five Years | One Year | ||||
|---|---|---|---|---|---|---|---|
| Class A (commenced August 15, 1997) | |||||||
| Excluding sales charges | 3.09% | n/a
|
8.70% | ||||
| Including sales charges | 1.19% | n/a
|
2.73% | ||||
| |
|||||||
| Class B (commenced August 15, 1997) | |||||||
| Excluding contingent deferred sales charges | 2.42% | n/a
|
8.01% | ||||
| Including contingent deferred sales charges | 1.40% | n/a
|
3.01% | ||||
| |
|||||||
| Class C (commenced August 15, 1997) | |||||||
| Excluding contingent deferred sales charges | 2.41% | n/a
|
7.84% | ||||
| Including contingent deferred sales charges | 2.41% | n/a
|
6.84% | ||||
| |
|||||||
| Institutional Class (commenced August 1, 1995) | 13.26% | 13.18%
|
9.08% | ||||
| |
|||||||
| Service Class (commenced July 18, 1997) | 3.84% | n/a
|
8.48% | ||||
| |
|||||||
| Shares | Description | Value | |||
|---|---|---|---|---|---|
| Common Stocks – 91.1% | |||||
| Airlines – 0.4% | |||||
| 18,800 | Delta Air Lines, Inc. | $ 930,600 | |||
| Apparel – 1.0% | |||||
| 56,300 | Nike, Inc. Class B | 2,227,369 | |||
| Banks – 4.4% | |||||
| 25,300 | AmSouth Bancorp | 461,725 | |||
| 34,700 | Comerica, Inc. | 1,954,044 | |||
| 264,800 | Pacific Century Financial Corp. | 3,707,200 | |||
| 84,600 | The Colonial BancGroup, Inc. | 824,850 | |||
| 88,750 | UnionBanCal Corp. | 2,202,109 | |||
| 13,100 | Wilmington Trust Corp. | 659,913 | |||
| 9,809,841 | |||||
| Chemicals – 3.9% | |||||
| 189,000 | IMC Global, Inc. | 2,775,938 | |||
| 151,500 | Millennium Chemicals, Inc. | 2,499,750 | |||
| 65,700 | Potash Corp. of Saskatchewan, Inc. | 3,490,312 | |||
| 8,766,000 | |||||
| Clothing – 1.6% | |||||
| 236,400 | Ross Stores, Inc. | 3,575,550 | |||
| Computer Hardware – 3.1% | |||||
| 38,600 | Diebold, Inc. | 1,090,450 | |||
| 231,500 | Ingram Micro, Inc.* | 3,472,500 | |||
| 46,100 | Tech Data Corp.* | 2,379,912 | |||
| 6,942,862 | |||||
| Computer Software – 2.8% | |||||
| 83,800 | Mentor Graphics Corp.* | 1,581,725 | |||
| 129,442 | Synopsys, Inc.* | 4,797,444 | |||
| 6,379,169 | |||||
| Construction – 0.5% | |||||
| 57,800 | D.R. Horton, Inc. | 1,134,325 | |||
| Consumer Durables – 1.0% | |||||
| 37,850 | Herman Miller, Inc. | 1,208,834 | |||
| 49,100 | Sherwin-Williams Co. | 1,129,300 | |||
| 2,338,134 | |||||
| Defense/Aerospace – 1.4% | |||||
| 39,500 | Northrop Grumman Corp. | 3,073,594 | |||
| Department Store – 0.3% | |||||
| 26,200 | Federated Department Stores, Inc.* | 723,775 | |||
| Electrical Equipment – 0.3% | |||||
| 9,000 | Eaton Corp. | 597,375 | |||
| Electrical Utilities – 12.7% | |||||
| 91,600 | DTE Energy Co. | 3,183,100 | |||
| 124,200 | Energy East Corp. | 2,817,788 | |||
| 103,000 | Entergy Corp. | 3,135,062 | |||
| 65,000 | FPL Group, Inc. | 3,469,375 | |||
| 171,500 | Northeast Utilities | 3,901,625 | |||
| 215,100 | Public Service Co. of New Mexico | 4,597,762 | |||
| 39,200 | Reliant Energy, Inc. | 1,455,300 | |||
| Shares | Description | Value | |||
|---|---|---|---|---|---|
| Common Stocks – (continued) | |||||
| Electrical Utilities – (continued) | |||||
| 102,100 | SCANA Corp. | $ 2,794,988 | |||
| 70,600 | Unicom Corp. | 3,225,537 | |||
| 28,580,537 | |||||
| Energy Resources – 3.5% | |||||
| 45,694 | Anadarko Petroleum Corp. | 3,005,294 | |||
| 58,100 | Burlington Resources, Inc. | 2,284,056 | |||
| 129,600 | Ocean Energy, Inc.* | 1,968,300 | |||
| 48,300 | Pioneer Natural Resources Co.* | 670,163 | |||
| 7,927,813 | |||||
| Environmental Services – 1.5% | |||||
| 238,400 | Republic Services, Inc.* | 3,486,600 | |||
| Equity REIT – 7.0% | |||||
| 28,100 | AvalonBay Communities, Inc. | 1,255,719 | |||
| 39,900 | Boston Properties, Inc. | 1,613,456 | |||
| 95,900 | Duke-Weeks Realty Corp. | 2,277,625 | |||
| 33,100 | Equity Residential Properties Trust | 1,588,800 | |||
| 55,700 | Health Care Property Investors, Inc. | 1,465,606 | |||
| 116,000 | Public Storage, Inc. | 2,827,500 | |||
| 30,100 | Spieker Properties, Inc. | 1,644,213 | |||
| 200,000 | Trizec Hahn Corp. | 3,162,500 | |||
| 15,835,419 | |||||
| Food & Beverage – 2.9% | |||||
| 294,494 | Archer-Daniels-Midland Co. | 2,595,224 | |||
| 35,495 | ConAgra, Inc. | 650,004 | |||
| 140,000 | Fleming Cos., Inc. | 2,161,250 | |||
| 43,100 | Nabisco Group Holdings Corp. | 1,209,494 | |||
| 6,615,972 | |||||
| Forest – 3.3% | |||||
| 32,300 | Fort James Corp. | 1,021,487 | |||
| 146,100 | Georgia-Pacific Corp. (Timber Group) | 4,282,556 | |||
| 19,600 | Georgia-Pacific Group | 524,300 | |||
| 65,700 | Smurfit-Stone Container Corp.* | 862,313 | |||
| 39,900 | Sonoco Products Co. | 770,569 | |||
| 7,461,225 | |||||
| Gas Utilities – 1.0% | |||||
| 93,050 | LG&E Energy Corp. | 2,279,725 | |||
| Heavy Electrical – 1.0% | |||||
| 97,800 | UCAR International, Inc.* | 1,332,525 | |||
| 131,600 | UNOVA, Inc.* | 987,000 | |||
| 2,319,525 | |||||
| Heavy Machinery – 1.3% | |||||
| 88,700 | Deere & Co. | 2,921,556 | |||
| Industrial Parts – 1.1% | |||||
| 72,350 | Parker-Hannifin Corp. | 2,518,684 | |||
| Information Services – 1.5% | |||||
| 11,400 | Convergys Corp.* | 446,025 | |||
| 160,900 | Modis Professional Services, Inc.* | 1,106,187 | |||
| 56,500 | The Dun & Bradstreet Corp. | 1,864,500 | |||
| 3,416,712 | |||||
| Shares | Description | Value | |||
|---|---|---|---|---|---|
| Common Stocks – (continued) | |||||
| Media – 2.7% | |||||
| 136,800 | A.H. Belo Corp. | $ 2,616,300 | |||
| 65,600 | Media General, Inc. | 3,378,400 | |||
| 5,994,700 | |||||
| Medical Providers – 5.0% | |||||
| 45,500 | Aetna, Inc. | 2,545,156 | |||
| 89,200 | Health Management Associates, Inc.* | 1,455,075 | |||
| 301,200 | Manor Care, Inc.* | 4,028,550 | |||
| 106,600 | Tenet Healthcare Corp. | 3,304,600 | |||
| 11,333,381 | |||||
| Mining – 1.5% | |||||
| 111,700 | Ispat International NV | 726,050 | |||
| 28,200 | Nucor Corp. | 1,036,350 | |||
| 35,800 | Phelps Dodge Corp. | 1,593,100 | |||
| 3,355,500 | |||||
| Oil Refining – 1.2% | |||||
| 44,200 | Tosco Corp. | 1,348,100 | |||
| 41,900 | Valero Energy Corp. | 1,262,238 | |||
| 2,610,338 | |||||
| Oil Services – 2.3% | |||||
| 21,500 | Cal Dive International, Inc.* | 1,236,250 | |||
| 25,000 | Coflexip SA ADR | 1,485,156 | |||
| 23,000 | Diamond Offshore Drilling, Inc. | 1,030,688 | |||
| 106,600 | Stolt Offshore SA * | 1,479,075 | |||
| 5,231,169 | |||||
| Property Insurance – 9.3% | |||||
| 56,500 | Ambac Financial Group, Inc. | 3,651,313 | |||
| 101,500 | Everest Re Group, Ltd. | 4,085,375 | |||
| 33,100 | Loews Corp. | 2,679,031 | |||
| 33,300 | MBIA, Inc. | 2,189,475 | |||
| 222,800 | Old Republic International Corp. | 5,333,275 | |||
| 43,600 | XL Capital Ltd. | 3,005,675 | |||
| 20,944,144 | |||||
| Publishing – 0.9% | |||||
| 77,200 | R.R. Donnelley & Sons Co. | 1,987,900 | |||
| Railroads – 0.5% | |||||
| 43,500 | CSX Corp. | 1,038,563 | |||
| Restaurants – 1.2% | |||||
| 231,450 | CBRL Group, Inc. | 2,791,866 | |||
| Security/Asset Management – 1.5% | |||||
| 3,800 | Lehman Brothers Holdings, Inc. | 551,000 | |||
| 42,765 | The Bear Stearns Cos., Inc. | 2,867,928 | |||
| 3,418,928 | |||||
| Semiconductors – 1.6% | |||||
| 89,700 | MEMC Electronic Materials, Inc.* | 1,614,600 | |||
| 35,700 | Siliconix, Inc. * | 1,994,737 | |||
| 3,609,337 | |||||
| Shares | Description | Value | |||
|---|---|---|---|---|---|
| Common Stocks – (continued) | |||||
| Specialty Retail – 1.3% | |||||
| 20,400 | AutoZone, Inc.* | $ 459,000 | |||
| 24,800 | Avnet, Inc. | 1,484,900 | |||
| 49,700 | Toys “R” Us, Inc.* | 903,919 | |||
| 2,847,819 | |||||
| Telephone – 0.2% | |||||
| 19,700 | CenturyTel, Inc. | 561,401 | |||
| Thrifts – 2.4% | |||||
| 87,900 | GreenPoint Financial Corp. | 2,296,387 | |||
| 359,300 | Sovereign Bancorp, Inc. | 3,054,050 | |||
| 5,350,437 | |||||
| Tobacco – 1.4% | |||||
| 35,166 | R.J. Reynolds Tobacco Holdings, Inc. | 1,261,580 | |||
| 92,500 | UST, Inc. | 2,000,313 | |||
| 3,261,893 | |||||
| Truck Freight – 0.6% | |||||
| 54,200 | CNF Transportation, Inc. | 1,327,900 | |||
| TOTAL COMMON STOCKS | |||||
| (Cost $192,696,287) | $ 205,527,638 | ||||
| Principal
Amount |
Interest
Rate |
Maturity
Date |
Value | ||||
|---|---|---|---|---|---|---|---|
| Repurchase Agreement – 8.4% | |||||||
| Joint Repurchase Agreement Account II Ù | |||||||
| $18,900,000 | 6.66% | 09/01/2000 | $ 18,900,000 | ||||
| TOTAL REPURCHASE AGREEMENT | |||||||
| (Cost $18,900,000) | $ 18,900,000 | ||||||
| TOTAL INVESTMENTS | |||||||
| (Cost $211,596,287) | $ 224,427,638 | ||||||
*
|
Non-income producing security.
|
Ù
|
Joint repurchase agreement was entered into on August 31, 2000.
|
| The percentage shown for each investment category reflects the value of investments in that category as a percentage of total net
assets.
|
| |
| Investment Abbreviations:
|
| ADR—American Depositary Receipt
|
| |
| Assets:
|
| Investment in securities, at value (identified cost $211,596,287) | $224,427,638 | |||
| Cash | 19,329 | |||
| Receivables: | ||||
| Investment securities sold | 1,741,221 | |||
| Dividends and interest | 480,586 | |||
| Fund shares sold | 208,499 | |||
| Reimbursement from investment adviser | 38,632 | |||
| Other assets | 2,569 | |||
| Total assets | 226,918,474 | |||
| Liabilities: | ||||
| Payables: | ||||
| Fund shares repurchased | 594,097 | |||
| Investment securities purchased | 561,401 | |||
| Amounts owed to affiliates | 187,527 | |||
| Accrued expenses and other liabilities | 35,675 | |||
| Total liabilities | 1,378,700 | |||
| Net Assets: | ||||
| Paid-in capital | 232,617,463 | |||
| Accumulated undistributed net investment income | 2,001,174 | |||
| Accumulated net realized loss from investment, options and foreign currency related transactions | (21,910,214 | ) | ||
| Net unrealized gain on investments | 12,831,351 | |||
| NET ASSETS | $225,539,774 | |||
| Net asset value, offering and redemption price per share: (a) | ||||
| Class A | $19.88 | |||
| Class B | $19.69 | |||
| Class C | $19.67 | |||
| Institutional | $19.86 | |||
| Service | $19.73 | |||
| Shares outstanding: | ||||
| Class A | 1,968,707 | |||
| Class B | 1,131,753 | |||
| Class C | 290,769 | |||
| Institutional | 7,965,367 | |||
| Service | 10,448 | |||
| Total shares outstanding, $.001 par value (unlimited number of shares authorized) | 11,367,044 | |||
(a)
|
Maximum public offering price per share (NAV per share multiplied by 1.0582) for Class A shares is $21.04. At redemption, Class B
and Class C Shares may be subject to a deferred contingent sales charge, assessed on the amount equal to the lesser of the current net asset value or the original purchase price of the shares.
|
| Investment income: | ||||
| Dividends (a) | $ 4,843,040 | |||
| Interest | 520,165 | |||
| Total income | 5,363,205 | |||
| Expenses: | ||||
| Management fees | 1,673,380 | |||
| Distribution and Service fees (b) | 397,161 | |||
| Transfer Agent fees (c) | 193,393 | |||
| Registration fees | 85,833 | |||
| Custodian fees | 75,164 | |||
| Professional fees | 66,992 | |||
| Amortization of deferred organization expenses | 15,801 | |||
| Trustee fees | 8,729 | |||
| Other | 99,802 | |||
| Total expenses | 2,616,255 | |||
| Less — expense reductions | (119,374 | ) | ||
| Net expenses | 2,496,881 | |||
| NET INVESTMENT INCOME | 2,866,324 | |||
| Realized and unrealized gain (loss) on investment transactions: | ||||
| Net realized loss from investment transactions | (16,933,957 | ) | ||
| Net change in unrealized gain on investments | 27,143,384 | |||
| Net realized and unrealized gain on investment transactions | 10,209,427 | |||
| NET INCREASE IN NET ASSETS RESULTING FROM OPERATIONS | $13,075,751 | |||
(a)
|
Foreign taxes withheld on dividends were $40,254.
|
(b)
|
Class A, Class B and Class C had Distribution and Service fees of $99,049, $234,374 and $63,738, respectively.
|
(c)
|
Class A, Class B, Class C, Institutional Class and Service Class had Transfer Agent fees of $75,277, $44,531, $12,110, $61,403 and
$72, respectively.
|
| For the
Year Ended August 31, 2000 |
For the
Seven Months Ended August 31, 1999 |
For the
Year Ended January 31, 1999 |
||||||||||||
|---|---|---|---|---|---|---|---|---|---|---|---|---|---|---|
| From operations: | ||||||||||||||
| Net investment income | $ 2,866,324 | $ 980,264 | $ 2,221,134 | |||||||||||
| Net realized gain (loss) from investment, options and foreign currency related
transactions |
(16,933,957 | ) | 13,695,867 | 6,435,290 | ||||||||||
| Net change in unrealized gain (loss) on investments and translation of assets and
liabilities denominated in foreign currencies |
27,143,384 | 11,157,599 | (58,648,058 | ) | ||||||||||
| Net increase (decrease) in net assets resulting from operations | 13,075,751 | 25,833,730 | (49,991,634 | ) | ||||||||||
| Distributions to shareholders: | ||||||||||||||
| From net investment income | ||||||||||||||
| Class A Shares | (279,844 | ) | — | (280,574 | ) | |||||||||
| Class B Shares | — | — | (3,078 | ) | ||||||||||
| Class C Shares | — | — | (9,612 | ) | ||||||||||
| Institutional Shares | (1,995,272 | ) | — | (2,055,325 | ) | |||||||||
| Service Shares | (1,120 | ) | — | (2,638 | ) | |||||||||
| In excess of net investment income | ||||||||||||||
| Class A Shares | — | — | (6,261 | ) | ||||||||||
| Class B Shares | — | — | (69 | ) | ||||||||||
| Class C Shares | — | — | (214 | ) | ||||||||||
| Institutional Shares | — | — | (45,868 | ) | ||||||||||
| Service Shares | — | — | (59 | ) | ||||||||||
| From net realized gain on investment and options transactions | ||||||||||||||
| Class A Shares | — | (4,331,730 | ) | (3,498,210 | ) | |||||||||
| Class B Shares | — | (2,778,438 | ) | (1,854,834 | ) | |||||||||
| Class C Shares | — | (868,578 | ) | (536,322 | ) | |||||||||
| Institutional Shares | — | (16,406,543 | ) | (9,058,413 | ) | |||||||||
| Service Shares | — | (16,471 | ) | (14,028 | ) | |||||||||
| Total distributions to shareholders | (2,276,236 | ) | (24,401,760 | ) | (17,365,505 | ) | ||||||||
| From share transactions: | ||||||||||||||
| Proceeds from sales of shares | 29,205,968 | 40,482,737 | 203,854,529 | |||||||||||
| Reinvestment of dividends and distributions | 2,225,142 | 23,418,266 | 16,585,994 | |||||||||||
| Cost of shares repurchased | (98,141,541 | ) | (99,881,814 | ) | (199,307,468 | ) | ||||||||
| Net increase (decrease) in net assets resulting from share transactions | (66,710,431 | ) | (35,980,811 | ) | 21,133,055 | |||||||||
| TOTAL DECREASE | (55,910,916 | ) | (34,548,841 | ) | (46,224,084 | ) | ||||||||
| Net assets: | ||||||||||||||
| Beginning of period | 281,450,690 | 315,999,531 | 362,223,615 | |||||||||||
| End of period | $225,539,774 | $281,450,690 | $315,999,531 | |||||||||||
| Accumulated undistributed (distributions in excess of) net investment income | $ 2,001,174 | $ 1,394,240 | $ (31,716 | ) | ||||||||||
| 1. ORGANIZATION
|
| Goldman Sachs Trust (the “Trust”) is a Delaware business trust registered under the Investment Company Act of 1940 (as
amended) as an open-end management investment company. The Trust includes the Goldman Sachs Mid Cap Value Fund (the “Fund”). Effective May 1, 1999, the name of Goldman Sachs Mid Cap Equity Fund was changed to Goldman Sachs Mid Cap Value Fund.
The Fund is a diversified portfolio offering five classes of shares — Class A, Class B, Class C, Institutional and Service.
|
| 2. SIGNIFICANT ACCOUNTING POLICIES
|
| The following is a summary of the significant accounting policies consistently followed by the Fund. The preparation of financial
statements in conformity with generally accepted accounting principles requires management to make estimates and assumptions that may affect the reported amounts. Actual results could differ from those estimates. Effective for fiscal year 1999, the Board
of Trustees approved a change in the fiscal year-end of the Fund from January 31 to August 31. Accordingly, the Statements of Changes in Net Assets, Summary of Share Transactions and Financial Highlights of the Fund include the seven months ended August
31, 1999 and the year ended January 31, 1999.
|
| A. Investment Valuation — Investments in
securities traded on a U.S. or foreign securities exchange or the NASDAQ system are valued daily at their last sale price on the principal exchange on which they are traded. If no sale occurs, securities are valued at the last bid price. Debt securities
are valued at prices supplied by independent pricing services, broker/dealer-supplied valuations or matrix pricing systems. Unlisted equity and debt securities for which market quotations are available are valued at the last sale price on valuation date,
or if no sale occurs, at the last bid price. Short-term debt obligations maturing in sixty days or less are valued at amortized cost, which approximates market value. Securities for which quotations are not readily available are valued at fair value using
methods approved by the Board of Trustees of the Trust.
|
| B. Security Transactions and Investment Income — Security transactions are recorded as of the trade date. Realized gains and losses on sales of portfolio securities are calculated on the identified-cost basis. Dividend income is recorded on the ex-dividend date net of foreign withholding taxes where
applicable. Dividends for which the Fund has the choice to receive either cash or stock are recognized as investment income in an amount equal to the cash dividend. Interest income is recorded on the basis of interest accrued, premium amortized and
discount earned.
|
| Net investment income (other than class specific expenses) and unrealized and
realized gains or losses are allocated daily to each class of shares of the Fund based upon the relative proportion of net assets of each class.
|
| C. Federal Taxes — It is the Fund’s
policy to comply with the requirements of the Internal Revenue Code applicable to regulated investment companies and to distribute each year substantially all of its investment company taxable income and capital gains to its shareholders. Accordingly, no
federal tax provision is required. Income and capital gain distributions, if any, are declared and paid annually.
|
| The characterization of distributions to shareholders for financial reporting
purposes is determined in accordance with income tax rules. Therefore, the source of the Fund’s distributions may be shown in the accompanying financial statements as either from or in excess of net investment income or net realized gain on
investment transactions, or from paid-in capital, depending on the type of book/tax differences that may exist.
|
| At August 31, 2000, the Fund had approximately $19,761,198 of capital loss
carryforward expiring in the period of 2006 through 2008 for federal tax purposes. This amount is available to be carried forward to offset future capital gains to the extent permitted by applicable laws or regulations.
|
| 2. SIGNIFICANT ACCOUNTING POLICIES (continued)
|
| At August 31, 2000, the aggregate cost of portfolio securities for federal income
tax purposes is $213,221,822. Accordingly, the gross unrealized gain on investments was $28,373,761 and the gross unrealized loss on investments was $17,167,945 resulting in a net unrealized gain of $11,205,816.
|
| D. Expenses — Expenses incurred by the
Trust that do not specifically relate to an individual fund of the Trust are allocated to the funds based on a straight-line or pro rata basis depending upon the nature of the expense.
|
| Class A, Class B and Class C Shares bear all expenses and fees relating to their
respective Distribution and Service Plans. Shareholders of Service Shares bear all expenses and fees paid to service organizations. Each class of shares separately bears its respective class-specific Transfer Agency fees.
|
| E. Deferred Organization Expenses —
Organization-related costs are being amortized on a straight-line basis over a period of five years.
|
| F. Foreign Currency Translations — The
books and records of the Fund are maintained in U.S. dollars. Amounts denominated in foreign currencies are translated into U.S. dollars on the following basis: (i) investment valuations, foreign currency and other assets and liabilities initially
expressed in foreign currencies are converted each business day into U.S. dollars based upon current exchange rates; and (ii) purchases and sales of foreign investments, income and expenses are converted into U.S. dollars based upon currency exchange
rates prevailing on the respective dates of such transactions.
|
| Net realized and unrealized gain (loss) on foreign currency transactions will
represent: (i) foreign exchange gains and losses from the sale and holdings of foreign currencies; (ii) currency gains and losses between trade date and settlement date on investment securities transactions and forward exchange contracts; and (iii) gains
and losses from the difference between amounts of dividends and interest recorded and the amounts actually received.
|
| G. Segregation Transactions — The Fund may
enter into certain derivative transactions to seek to increase total return. Forward foreign currency exchange contracts, futures contracts, written options, when-issued securities and forward commitments represent examples of such transactions. As a
result of entering into these transactions, the Fund is required to segregate liquid assets on the accounting records equal to or greater than the market value of the corresponding transactions.
|
| H. Repurchase Agreements — Repurchase
agreements involve the purchase of securities subject to the seller’s agreement to repurchase them at a mutually agreed upon date and price. During the term of a repurchase agreement, the value of the underlying securities, including accrued
interest, is required to equal or exceed the value of the repurchase agreement. The underlying securities for all repurchase agreements are held in safekeeping at the Fund’s custodian.
|
| 3. AGREEMENTS
|
| Pursuant to the Investment Management Agreement (the “Agreement”), Goldman Sachs Asset Management (“GSAM”), a
unit of the Investment Management Division of Goldman, Sachs & Co. (“Goldman Sachs”), serves as the investment adviser to the Fund. Under the Agreement, the adviser, subject to the general supervision of the Trust’s Board of Trustees,
manages the Fund’s portfolio. As compensation for the services rendered pursuant to the Agreement, the assumption of the expenses related thereto and administering the Fund’s business affairs, including providing facilities, the adviser is
entitled to a fee, computed daily and payable monthly, at an annual rate equal to 0.75% of the average daily net assets of the Fund.
|
| The adviser has voluntarily agreed to limit certain “Other Expenses” of
the Fund (excluding Management fees, Distribution and Service fees, Transfer Agent fees, taxes, interest, brokerage, litigation, Service Share fees, indemnification costs and
|
| 3. AGREEMENTS (continued)
|
| other extraordinary expenses) to the extent such expenses exceed, on an annual basis, 0.10% of the average daily net assets of the
Fund. For the year ended August 31, 2000, Goldman Sachs has agreed to reimburse approximately $116,000. In addition, the Fund has entered into certain offset arrangements with the custodian resulting in a reduction in the Fund’s expenses. For the
year ended August 31, 2000 custodian fees were reduced by approximately $3,000.
|
| The Trust, on behalf of the Fund, has adopted Distribution and Service Plans.
Under the Distribution and Service Plans, Goldman Sachs and/or authorized dealers are entitled to a monthly fee from the Fund for distribution and shareholder maintenance services equal, on an annual basis, to 0.25%, 1.00% and 1.00% of the Fund’s
average daily net assets attributable to Class A, Class B and Class C Shares, respectively.
|
| Goldman Sachs serves as the distributor of shares of the Fund pursuant to a
Distribution Agreement. Goldman Sachs may receive a portion of the Class A sales load and Class B and Class C contingent deferred sales charges and has advised the Fund that it retained approximately $58,000 during the year ended August 31, 2000.
|
| Goldman Sachs also serves as the Transfer Agent of the Fund for a fee. The fees
charged for such transfer agency services are calculated daily and payable monthly at an annual rate as follows: 0.19% of the average daily net assets for Class A, Class B and Class C Shares and 0.04% of the average daily net assets for Institutional and
Service Shares.
|
| The Trust, on behalf of the Fund, has adopted a Service Plan. This Plan allows for
Service Shares to compensate service organizations for providing varying levels of account administration and shareholder liaison services to their customers who are beneficial owners of such shares. The Service Plan provides for compensation to the
service organizations in an amount up to 0.50% (on a annualized basis), of the average daily net asset value of the Service Shares.
|
| As of August 31, 2000, the amounts owed to affiliates were approximately $140,000,
$31,000 and $17,000 for Management, Distribution and Service and Transfer Agent fees, respectively.
|
| 4. PORTFOLIO SECURITIES TRANSACTIONS
|
| The cost of purchases and proceeds of sales and maturities of securities (excluding short-term investments) for the year ended
August 31, 2000, were $179,253,315 and $255,650,399, respectively. For the year ended August 31, 2000, Goldman Sachs earned approximately $13,000 of brokerage commissions from portfolio transactions.
|
| Option Accounting Principles — When the Fund writes
call or put options, an amount equal to the premium received is recorded as an asset and as an equivalent liability. The amount of the liability is subsequently marked-to-market to reflect the current market value of the options written. When a written
option expires on its stipulated expiration date or the Fund enters into a closing purchase transaction, the Fund realizes a gain or loss without regard to any unrealized gain or loss on the underlying security, and the liability related to such option is
extinguished. When a written call option is exercised, the Fund realizes a gain or loss from the sale of the underlying security, and the proceeds of the sale are increased by the premium originally received. When a written put option is exercised, the
amount of the premium originally received will reduce the cost of the security which the Fund purchases upon exercise. There is a risk of loss from a change in value of such options which may exceed the related premiums received.
|
| Upon the purchase of a call option or a protective put option by the Fund, the
premium paid is recorded as an investment and subsequently marked-to-market to reflect the current market value of the option. If an option which the Fund has purchased expires on the stipulated expiration date, the Fund will realize a loss in the amount
of the cost of the option. If the Fund enters into a closing sale transaction, the Fund will realize a gain or loss, depending on whether the sale proceeds for the closing sale transaction are greater or less than the cost of the option. If the Fund
exercises a purchased put option, the Fund will realize a gain or loss from the sale of the underlying security, and the proceeds from such sale will be decreased by the premium originally paid. If the Fund exercises a purchased call option, the cost of
the security which the Fund purchases
4. PORTFOLIO SECURITIES TRANSACTIONS (continued)
|
| upon exercise will be increased by the premium originally paid. At August 31, 2000, there were no open written options contracts.
|
| Futures Contracts — The Fund may enter into futures
transactions to hedge against changes in interest rates, securities prices or to seek to increase total return. Upon entering into a futures contract, the Fund is required to deposit with a broker or the Fund’s custodian bank an amount of cash or
securities equal to the minimum “initial margin” requirement of the associated futures exchange. Subsequent payments for futures contracts (“variation margin”) are paid or received by the Fund daily, depending on the daily fluctuations
in the value of the contracts, and are recorded for financial reporting purposes as unrealized gains or losses. When contracts are closed, the Fund realizes a gain or loss which is reported in the Statement of Operations.
|
| The use of futures contracts involve, to varying degrees, elements of market risk
which may exceed the amounts recognized in the Statement of Assets and Liabilities. Changes in the value of the futures contract may not directly correlate with changes in the value of the underlying securities. This risk may decrease the effectiveness of
the Fund’s hedging strategies and potentially result in a loss. At August 31, 2000, there were no open futures contracts.
|
| 5. LINE OF CREDIT FACILITY
|
| Effective May 31, 2000, the Fund participates in a $350,000,000 committed, unsecured revolving line of credit facility. Prior
thereto, the Fund participated in a $250,000,000 uncommitted and a $250,000,000 committed, unsecured revolving line of credit facility. Under the most restrictive arrangement, the Fund must own securities having a market value in excess of 400% of the
total bank borrowings. This facility is to be used solely for temporary or emergency purposes. The interest rate on borrowings is based on the Federal Funds rate. The committed facility also requires a fee to be paid by the Fund based on the amount of the
commitment. During the year ended August 31, 2000, the Fund did not have any borrowings under any of these facilities.
|
| 6. JOINT REPURCHASE AGREEMENT ACCOUNT
|
| The Fund, together with other registered investment companies having management agreements with GSAM or its affiliates, transfers
uninvested cash into joint accounts, the daily aggregate balance of which is invested in one or more repurchase agreements.
|
| At August 31, 2000, the Fund had an undivided interest in the repurchase
agreements in the joint account which equaled $18,900,000 in principal amount. At August 31, 2000, the following repurchase agreements held in this joint account were fully collateralized by Federal Agency obligations:
|
| Repurchase Agreements | Principal
Amount |
Interest
Rate |
Maturity
Date |
Amortized
Cost |
Maturity
Value |
|||||||
|---|---|---|---|---|---|---|---|---|---|---|---|---|
| ABN/AMRO, Inc. | $ 814,100,000 | 6.66 | % | 09/01/2000 | $ 814,100,000 | $ 814,250,608 | ||||||
| Banc of America Securities LLC | 900,000,000 | 6.67 | 09/01/2000 | 900,000,000 | 900,166,750 | |||||||
| Barclays Capital, Inc. | 500,000,000 | 6.67 | 09/01/2000 | 500,000,000 | 500,092,639 | |||||||
| Bear Stearns Companies, Inc. | 300,000,000 | 6.67 | 09/01/2000 | 300,000,000 | 300,055,583 | |||||||
| Chase Securities, Inc. | 450,000,000 | 6.67 | 09/01/2000 | 450,000,000 | 450,083,375 | |||||||
| Donaldson, Lufkin & Jenrette, Inc. | 1,000,000,000 | 6.67 | 09/01/2000 | 1,000,000,000 | 1,000,185,278 | |||||||
| J.P. Morgan & Co., Inc. | 800,000,000 | 6.65 | 09/01/2000 | 800,000,000 | 800,147,778 | |||||||
| Morgan Stanley Dean Witter & Co. | 750,000,000 | 6.65 | 09/01/2000 | 750,000,000 | 750,138,542 | |||||||
| Morgan Stanley Dean Witter & Co. | 300,000,000 | 6.60 | 09/01/2000 | 300,000,000 | 300,055,000 | |||||||
| UBS Warburg LLC | 800,000,000 | 6.65 | 09/01/2000 | 800,000,000 | 800,147,778 | |||||||
| TOTAL JOINT REPURCHASE AGREEMENT ACCOUNT II | $6,614,100,000 | $6,615,323,331 | ||||||||||
| 7. OTHER MATTERS
|
| As of August 31, 2000, Goldman, Sachs & Co. Employees Profit Sharing Master Trust was the beneficial owner of approximately
66% of the outstanding shares of the Fund.
|
| 8. CERTAIN RECLASSIFICATIONS
|
| In accordance with AICPA Statement of Position 93-2, the Fund has reclassified $16,846 from paid-in capital to accumulated net
investment loss. This reclassification has no impact on the net asset value of the Fund and is designed to present the Fund’s capital accounts on a tax basis. Reclassifications result primarily from the difference in the tax treatment of foreign
currency, net operating losses and organization costs.
|
| 9. CHANGE IN INDEPENDENT ACCOUNTANTS
|
| On October 26, 1999, the Board of Trustees of the Fund, upon the recommendation of the Board’s audit committee, determined
not to retain Arthur Andersen LLP and approved a change of the Fund’s independent accountants to PricewaterhouseCoopers LLP. For the period ended August 31, 1999 and the year ended January 31, 1999, Arthur Andersen LLP’s audit reports contained
no adverse opinion or disclaimer of opinion; nor were their reports qualified or modified as to uncertainty, audit scope, or accounting principles. Further, there were no disagreements between the Fund and Arthur Andersen LLP on accounting principles or
practices, financial statement disclosure or audit scope or procedure, which if not resolved to the satisfaction of Arthur Andersen LLP would have caused them to make reference to the disagreement in their reports.
|
| 10. SUMMARY OF SHARE TRANSACTIONS
|
| Share activity is as follows:
|
| For the Year Ended
August 31, 2000 |
For the Seven Months Ended
August 31, 1999 |
For the Year Ended
January 31, 1999 |
|||||||||||||||||
|---|---|---|---|---|---|---|---|---|---|---|---|---|---|---|---|---|---|---|---|
| Shares | Dollars | Shares | Dollars | Shares | Dollars | ||||||||||||||
| Class A Shares | |||||||||||||||||||
| Shares sold | 815,181 | $14,319,663 | 1,367,506 | $26,553,720 | 6,897,312 | $143,833,096 | |||||||||||||
| Reinvestments of dividends and distributions | 16,254 | 270,462 | 214,436 | 4,213,683 | 198,815 | 3,620,601 | |||||||||||||
| Shares repurchased | (1,527,747 | ) | (26,456,142 | ) | (2,756,189 | ) | (54,358,686 | ) | (7,448,798 | ) | (147,546,061 | ) | |||||||
| (696,312 | ) | (11,866,017 | ) | (1,174,247 | ) | (23,591,283 | ) | (352,671 | ) | (92,364 | ) | ||||||||
| Class B Shares | |||||||||||||||||||
| Shares sold | 203,697 | 3,662,014 | 232,886 | 4,652,883 | 1,238,560 | 27,854,158 | |||||||||||||
| Reinvestments of dividends and distributions | 2 | 31 | 121,303 | 2,361,741 | 82,866 | 1,503,199 | |||||||||||||
| Shares repurchased | (817,446 | ) | (13,980,108 | ) | (675,993 | ) | (12,921,155 | ) | (586,417 | ) | (11,387,076 | ) | |||||||
| (613,747 | ) | (10,318,063 | ) | (321,804 | ) | (5,906,531 | ) | 735,009 | 17,970,281 | ||||||||||
| Class C Shares | |||||||||||||||||||
| Shares sold | 75,788 | 1,333,632 | 98,072 | 2,005,005 | 499,586 | 10,988,153 | |||||||||||||
| Reinvestments of dividends and distributions | — | — | 33,722 | 656,882 | 22,110 | 401,070 | |||||||||||||
| Shares repurchased | (322,641 | ) | (5,484,036 | ) | (184,318 | ) | (3,524,952 | ) | (230,071 | ) | (4,500,505 | ) | |||||||
| (246,853 | ) | (4,150,404 | ) | (52,524 | ) | (863,065 | ) | 291,625 | 6,888,718 | ||||||||||
| Institutional Shares | |||||||||||||||||||
| Shares sold | 541,972 | 9,884,659 | 348,804 | 7,246,129 | 967,052 | 20,867,072 | |||||||||||||
| Reinvestments of dividends and distributions | 117,753 | 1,953,524 | 821,203 | 16,169,493 | 607,168 | 11,044,402 | |||||||||||||
| Shares repurchased | (3,020,832 | ) | (52,215,710 | ) | (1,537,957 | ) | (28,938,741 | ) | (1,801,025 | ) | (35,855,143 | ) | |||||||
| (2,361,107 | ) | (40,377,527 | ) | (367,950 | ) | (5,523,119 | ) | (226,805 | ) | (3,943,669 | ) | ||||||||
| Service Shares | |||||||||||||||||||
| Shares sold | 350 | 6,000 | 1,188 | 25,000 | 15,505 | 312,050 | |||||||||||||
| Reinvestments of dividends and distributions | 68 | 1,125 | 843 | 16,467 | 923 | 16,722 | |||||||||||||
| Shares repurchased | (334 | ) | (5,545 | ) | (7,477 | ) | (138,280 | ) | (978 | ) | (18,683 | ) | |||||||
| 84 | 1,580 | (5,446 | ) | (96,813 | ) | 15,450 | 310,089 | ||||||||||||
| NET INCREASE (DECREASE) | (3,917,935 | ) | $(66,710,431 | ) | (1,921,971 | ) | $(35,980,811 | ) | 462,608 | $ 21,133,055 | |||||||||
| Goldman Sachs Mid Cap Value Fund — Tax Information (unaudited)
|
| For the year ended August 31, 2000, 57.01% of the dividends paid from net investment
company taxable income by the Mid Cap Value Fund qualify for the dividends received deduction available to corporations.
|
| Income from
investment operations |
Distributions to shareholders |
||||||||||||||||||||||
|---|---|---|---|---|---|---|---|---|---|---|---|---|---|---|---|---|---|---|---|---|---|---|---|
| Net asset
value, beginning of period |
Net
investment income (loss) |
Net realized
and unrealized gain (loss) |
Total income
from investment operations |
From net
investment income |
In excess
of net investment income |
From net
realized gains |
Total
Distributions |
||||||||||||||||
| FOR THE YEAR ENDED AUGUST 31, | |||||||||||||||||||||||
| 2000 - Class A Shares | $18.42 | $0.20 | (c) | $1.38 | $1.58 | $(0.12 | ) | $ — | $ — | $(0.12) | |||||||||||||
| 2000 - Class B Shares | 18.23 | 0.06 | (c) | 1.40 | 1.46 | — | — | — | — | ||||||||||||||
| 2000 - Class C Shares | 18.24 | 0.06 | (c) | 1.37 | 1.43 | — | — | — | — | ||||||||||||||
| 2000 - Institutional Shares | 18.45 | 0.27 | (c) | 1.36 | 1.63 | (0.22 | ) | — | — | (0.22) | |||||||||||||
| 2000 - Service Shares | 18.31 | 0.18 | (c) | 1.35 | 1.53 | (0.11 | ) | — | — | (0.11) | |||||||||||||
| FOR THE SEVEN MONTHS ENDED AUGUST 31, | |||||||||||||||||||||||
| 1999 - Class A Shares | 18.38 | 0.06 | 1.71 | 1.77 | — | — | (1.73 | ) | (1.73) | ||||||||||||||
| 1999 - Class B Shares | 18.29 | (0.04 | ) | 1.71 | 1.67 | — | — | (1.73 | ) | (1.73) | |||||||||||||
| 1999 - Class C Shares | 18.30 | (0.04 | ) | 1.71 | 1.67 | — | — | (1.73 | ) | (1.73) | |||||||||||||
| 1999 - Institutional Shares | 18.37 | 0.09 | 1.72 | 1.81 | — | — | (1.73 | ) | (1.73) | ||||||||||||||
| 1999 - Service Shares | 18.29 | 0.05 | 1.70 | 1.75 | — | — | (1.73 | ) | (1.73) | ||||||||||||||
| FOR THE YEARS ENDED JANUARY 31, | |||||||||||||||||||||||
| 1999 - Class A Shares | 21.61 | 0.10 | (2.38 | ) | (2.28 | ) | (0.07 | ) | — | (0.88 | ) | (0.95) | |||||||||||
| 1999 - Class B Shares | 21.57 | (0.05 | ) | (2.35 | ) | (2.40 | ) | — | — | (0.88 | ) | (0.88) | |||||||||||
| 1999 - Class C Shares | 21.59 | (0.05 | ) | (2.34 | ) | (2.39 | ) | (0.02 | ) | — | (0.88 | ) | (0.90) | ||||||||||
| 1999 - Institutional Shares | 21.65 | 0.19 | (2.38 | ) | (2.19 | ) | (0.21 | ) | — | (0.88 | ) | (1.09) | |||||||||||
| 1999 - Service Shares | 21.62 | 0.03 | (2.31 | ) | (2.28 | ) | (0.17 | ) | — | (0.88 | ) | (1.05) | |||||||||||
| 1998 - Class A Shares
(commenced August 15, 1997) |
23.63 | 0.09 | 0.76 | 0.85 | (0.06 | ) | (0.04 | ) | (2.77 | ) | (2.87) | ||||||||||||
| 1998 - Class B Shares
(commenced August 15, 1997) |
23.63 | 0.06 | 0.74 | 0.80 | (0.09 | ) | — | (2.77 | ) | (2.86) | |||||||||||||
| 1998 - Class C Shares
(commenced August 15, 1997) |
23.63 | 0.06 | 0.76 | 0.82 | (0.09 | ) | — | (2.77 | ) | (2.86) | |||||||||||||
| 1998 - Institutional Shares | 18.73 | 0.16 | 5.66 | 5.82 | (0.13 | ) | — | (2.77 | ) | (2.90) | |||||||||||||
| 1998 - Service Shares
(commenced July 18, 1997) |
23.01 | 0.09 | 1.40 | 1.49 | (0.11 | ) | — | (2.77 | ) | (2.88) | |||||||||||||
| 1997 - Institutional Shares | 15.91 | 0.24 | 3.77 | 4.01 | (0.24 | ) | (0.93 | ) | (0.02 | ) | (1.19) | ||||||||||||
| FOR THE PERIOD ENDED JANUARY 31, | |||||||||||||||||||||||
| 1996 - Institutional Shares (commenced
August 1, 1995) |
15.00 | 0.13 | 0.90 | 1.03 | (0.12 | ) | — | — | (0.12) | ||||||||||||||
(a)
|
Assumes investment at the net asset value at the beginning of the period, reinvestment of all dividends and distributions, a
complete redemption of the investment at the net asset value at the end of the period and no sales or redemption charges. Total return would be reduced if a sales or redemption charge were taken into account. Total returns for periods less than one full
year are not annualized.
|
(b)
|
Annualized.
|
(c)
|
Calculated based on average shares outstanding methodology.
|
| Ratios assuming no
expense reductions |
|||||||||||||||||||||
|---|---|---|---|---|---|---|---|---|---|---|---|---|---|---|---|---|---|---|---|---|---|
| Net asset
value, end of period |
Total
return (a) |
Net assets
at end of period (in 000s) |
Ratio of
net expenses to average net assets |
Ratio of
net investment income (loss) to average net assets |
Ratio of
expenses to average net assets |
Ratio of
net investment income (loss) to average net assets |
Portfolio
turnover rate |
||||||||||||||
| $19.88 | 8.70 | % | $ 39,142 | 1.29 | % | 1.11 | % | 1.34 | % | 1.06 | % | 82.92 | % | ||||||||
| 19.69 | 8.01 | 22,284 | 2.04 | 0.35 | 2.09 | 0.30 | 82.92 | ||||||||||||||
| 19.67 | 7.84 | 5,720 | 2.04 | 0.32 | 2.09 | 0.27 | 82.92 | ||||||||||||||
| 19.86 | 9.08 | 158,188 | 0.89 | 1.51 | 0.94 | 1.46 | 82.92 | ||||||||||||||
| 19.73 | 8.48 | 206 | 1.39 | 1.03 | 1.44 | 0.98 | 82.92 | ||||||||||||||
| 18.42 | 9.04 | 49,081 | 1.29 | (b) | 0.43 | (b) | 1.37 | (b) | 0.35 | (b) | 68.84 | ||||||||||
| 18.23 | 8.53 | 31,824 | 2.04 | (b) | (0.33 | ) (b) | 2.12 | (b) | (0.41 | ) (b) | 68.84 | ||||||||||
| 18.24 | 8.52 | 9,807 | 2.04 | (b) | (0.34 | ) (b) | 2.12 | (b) | (0.42 | ) (b) | 68.84 | ||||||||||
| 18.45 | 9.26 | 190,549 | 0.89 | (b) | 0.79 | (b) | 0.97 | (b) | 0.71 | (b) | 68.84 | ||||||||||
| 18.31 | 8.97 | 190 | 1.39 | (b) | 0.38 | (b) | 1.47 | (b) | 0.30 | (b) | 68.84 | ||||||||||
| 18.38 | (10.48 | ) | 70,578 | 1.33 | 0.38 | 1.41 | 0.30 | 92.18 | |||||||||||||
| 18.29 | (11.07 | ) | 37,821 | 1.93 | (0.22 | ) | 2.01 | (0.30 | ) | 92.18 | |||||||||||
| 18.30 | (11.03 | ) | 10,800 | 1.93 | (0.22 | ) | 2.01 | (0.30 | ) | 92.18 | |||||||||||
| 18.37 | (10.07 | ) | 196,512 | 0.87 | 0.83 | 0.95 | 0.75 | 92.18 | |||||||||||||
| 18.29 | (10.48 | ) | 289 | 1.37 | 0.32 | 1.45 | 0.24 | 92.18 | |||||||||||||
| 21.61 | 3.42 | 90,588 | 1.35 | (b) | 0.33 | (b) | 1.47 | (b) | 0.21 | (b) | 62.60 | ||||||||||
| 21.57 | 3.17 | 28,743 | 1.85 | (b) | (0.20 | ) (b) | 1.97 | (b) | (0.32 | ) (b) | 62.60 | ||||||||||
| 21.59 | 3.27 | 6,445 | 1.85 | (b) | (0.23 | ) (b) | 1.97 | (b) | (0.35 | ) (b) | 62.60 | ||||||||||
| 21.65 | 30.86 | 236,440 | 0.85 | 0.78 | 0.97 | 0.66 | 62.60 | ||||||||||||||
| 21.62 | 6.30 | 8 | 1.35 | (b) | 0.63 | (b) | 1.43 | (b) | 0.51 | (b) | 62.60 | ||||||||||
| 18.73 | 25.63 | 145,253 | 0.85 | 1.35 | 0.91 | 1.29 | 74.03 | ||||||||||||||
| 15.91 | 6.89 | 135,671 | 0.85 | (b) | 1.67 | (b) | 0.98 | (b) | 1.54 | (b) | 58.77 | ||||||||||
| To the Shareholders and Board of Trustees of
|
| Goldman Sachs Trust — Mid Cap Value Fund:
|
| In our opinion, the accompanying statement of assets and liabilities, including the statement of investments, and the related
statements of operations and of changes in net assets and the financial highlights present fairly, in all material respects, the financial position of Goldman Sachs Mid Cap Value Fund (“the Fund”), one of the portfolios constituting Goldman
Sachs Trust, at August 31, 2000, the results of its operations, the changes in its net assets and the financial highlights for the year then ended, in conformity with accounting principles generally accepted in the United States of America. These
financial statements and financial highlights (hereafter referred to as “financial statements”) are the responsibility of the Fund’s management; our responsibility is to express an opinion on these financial statements based on our audit.
We conducted our audit of these financial statements in accordance with auditing standards generally accepted in the United States of America, which require that we plan and perform the audit to obtain reasonable assurance about whether the financial
statements are free of material misstatement. An audit includes examining, on a test basis, evidence supporting the amounts and disclosures in the financial statements, assessing the accounting principles used and significant estimates made by management,
and evaluating the overall financial statement presentation. We believe that our audit, which included confirmation of securities at August 31, 2000 by correspondence with the custodian and brokers, provides a reasonable basis for our opinion. The
statements of changes in net assets of the Fund for the period ended August 31, 1999 and the year ended January 31, 1999, and the financial highlights for each of the periods ended on or before August 31, 1999, were audited by other independent
accountants whose report dated October 8, 1999 expressed an unqualified opinion thereon.
|
| PricewaterhouseCoopers LLP
|
| Boston, Massachusetts
|
| October 23, 2000
|
GOLDMAN SACHS FUND PROFILE
Goldman Sachs Mid Cap Value Fund
| An Investment Idea for the Long Term | |||
| Historically, stocks have demonstrated greater potential to build wealth over the long term than most other types of investments. | |||
| Goldman Sachs Mid Cap Value Fund offers investors access to the benefits associated with equity investing. The Fund seeks long-term capital appreciation, primarily through equity securities of companies with public stock market capitalizations between $300 million and $15 billion at the time of investment. | |||
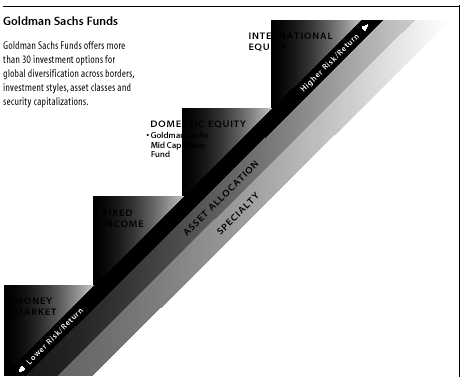
| Target Your Needs | |||
| The Goldman Sachs Mid Cap Value Fund has a distinct investment objective and a defined place on the risk/return spectrum. As your investment objectives or market conditions change, you can exchange shares within Goldman Sachs Funds without any additional charge.* (Please note: in general, greater returns are associated with greater risk.) | |||
| For More Information | |||
| To learn more about the Goldman Sachs Mid Cap Value Fund and other Goldman Sachs Funds, call your investment professional today. | |||
| *The exchange privilege is subject to termination and its terms are subject to change. | |||
|
|