
|
|
|
|
|
|
|
|
|
GOLDMAN SACHS JAPANESE EQUITY FUND
Market Overview
Dear Shareholder:
After generating exceptionally strong returns in 1999, the Japanese stock market has faltered this year, largely due to the correction in technology issues.
As always, we appreciate your support and we look forward to serving your investment needs in the years to come.
Sincerely,
 |
 |
||
| David B. Ford | David W. Blood | ||
| Co-Head, Goldman Sachs Asset Management | Co-Head, Goldman Sachs Asset Management | ||
| September 15, 2000 |
GOLDMAN SACHS JAPANESE EQUITY FUND
Fund Basics
as of August 31, 2000
| PERFORMANCE REVIEW | ||||
| Fund Total Return | TOPIX
|
|||
| August 31, 1999–August 31, 2000 | (without sales charge)1 | (USD)2
|
||
| |
||||
| Class A | 8.47 | % | 6.35 | % |
| Class B | 8.12 | 6.35 | ||
| Class C | 7.82 | 6.35 | ||
| Institutional | 9.14 | 6.35 | ||
| Service | 8.65 | 6.35 | ||
| |
||||
1 The net asset value represents the net assets of the Fund (ex-dividend) divided by the total number of shares. The Fund’s performance assumes the reinvestment of dividends and other distributions.
2 The Tokyo Price Index (TOPIX) figures do not reflect any fees or expenses. In addition, investors cannot invest directly in the unmanaged Index.
| STANDARDIZED TOTAL RETURNS 3 | |||||||||||
| For the period ended 6/30/00 | Class A
|
Class B
|
Class C
|
Institutional
|
Service
|
||||||
| |
|||||||||||
| One Year | 27.07 | % | 28.46 | % | 32.65 | % | 35.33 | % | 34.69 | % | |
| Since inception | 29.91 | 31.70 | 32.78 | 34.16 | 33.35 | ||||||
| (5/1/98) | |||||||||||
| |
|||||||||||
3 The Standardized Total Returns are average annual total returns or cumulative total returns (only if the performance period is one year or less) as of the most recent calendar quarter-end. They assume reinvestment of all distributions at net asset value. These returns reflect a maximum initial sales charge of 5.5% for Class A shares, the assumed deferred sales charge for Class B shares (5% maximum declining to 0% after six years) and the assumed deferred sales charge for Class C shares (1% if redeemed within 12 months of purchase). Because Institutional and Service shares do not involve a sales charge, such a charge is not applied to their Standardized Total Returns.
Total return figures represent past performance and do not indicate future results, which will vary. The investment return and principal value of an investment will fluctuate and, therefore, an investor’s shares, when redeemed, may be worth more or less than their original cost. Performance reflects expense limitations in effect. In their absence, performance would be reduced.
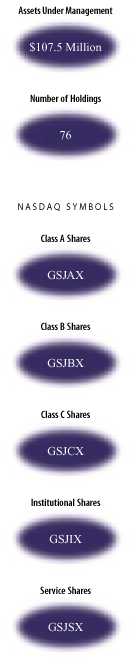
| TOP 10 HOLDINGS AS OF 8/31/00 | ||||
| Holding | % of Total Net Assets | Line of Business | ||
| |
||||
| NTT Mobile Communications Network, Inc. | 6.5 | % | Telecommunications | |
| Canon, Inc. | 2.6 | Computer Hardware | ||
| Advantest Corp. | 2.5 | Electronics Equipment | ||
| Rohm Co. | 2.4 | Electronics Equipment | ||
| Nippon Telephone & Telegraph Corp. | 2.2 | Telecommunications | ||
| NEC Corp. | 2.2 | Computer Hardware | ||
| Mitsui Mining & Smelting | 2.1 | Mining | ||
| Mineba Co. | 2.1 | Electronics Equipment | ||
| Takeda Chemical Industries Ltd. | 2.0 | Drugs | ||
| Sony Corp. | 2.0 | Electrical Equipment | ||
| |
||||
The top 10 holdings may not be representative of the Fund’s future investments.
GOLDMAN SACHS JAPANESE EQUITY FUND
Performance Overview
Dear Shareholder,
We are pleased to report on the performance of the Goldman Sachs Japanese Equity Fund for the one year period that ended August 31, 2000.
Performance Review
Over the one-year period that ended August 31, 2000, the Fund’s Class A, B, C, Institutional and Service shares generated cumulative total returns, without sales charges, of 8.47%, 8.12%, 7.82%, 9.14%, and 8.65%, respectively. These figures compare favorably to the 6.35% cumulative total return of the Fund’s benchmark, the Tokyo Price Index (TOPIX). The Fund’s relative outperformance was largely due to positive stock selection.
Sector Allocation
As of August 31, 2000, the Fund held large positions in the Electronics Machinery,
Telecommunications, and Computer Hardware sectors. It is important to note that the Fund’s sector weightings are the result of our bottom-up stock selection process, rather than sector-based decisions.
Portfolio Highlights
GOLDMAN SACHS JAPANESE EQUITY FUND
Outlook
Looking ahead, we are cautiously optimistic about the market. In addition to gradual progress in the macroeconomic picture, corporate earnings continue to show firm improvement. Many companies are pre-announcing financial results that are pointing to better than expected profits. We believe this stronger earnings outlook will likely result in a firmer stock market. However, in the near-term, we could see strains on the market, as many Japanese companies sell their equity holdings to lighten their balance sheets before new accounting changes are instituted.
We appreciate your continued support and look forward to reporting on the Fund’s progress in the future.
Goldman Sachs Japanese Equity Team
Tokyo
September 15, 2000
GOLDMAN SACHS JAPANESE EQUITY FUND
The Goldman Sachs Advantage
Founded in 1869, Goldman, Sachs & Co. is a premier financial services firm traditionally known on Wall Street and around the world for its institutional expertise.
Today, the firm’s Investment Management Division provides individual investors the opportunity to tap the resources of a global institutional powerhouse — and put this expertise to work in their individual portfolios.
What Sets Goldman Sachs Funds Apart?

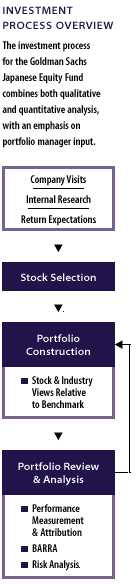
Our portfolio management teams are located on-site, around the world, in New York, London, Tokyo and Singapore. Their understanding of local economies, markets, industries and cultures helps deliver what many investors want: access to global investment opportunities and consistent, risk-adjusted performance.

Our portfolio management teams make on-site visits to hundreds of companies each month, then construct selective portfolios with an emphasis on their best ideas. Our teams also have access to Goldman, Sachs & Co.’s Global Investment Research Department.
In this, our institutional heritage is clear. Institutions, as well as many individual investors, often look to us to manage the risks of global investing over time in different market environments.
To learn more about the Goldman Sachs Funds, call your investment professional today.
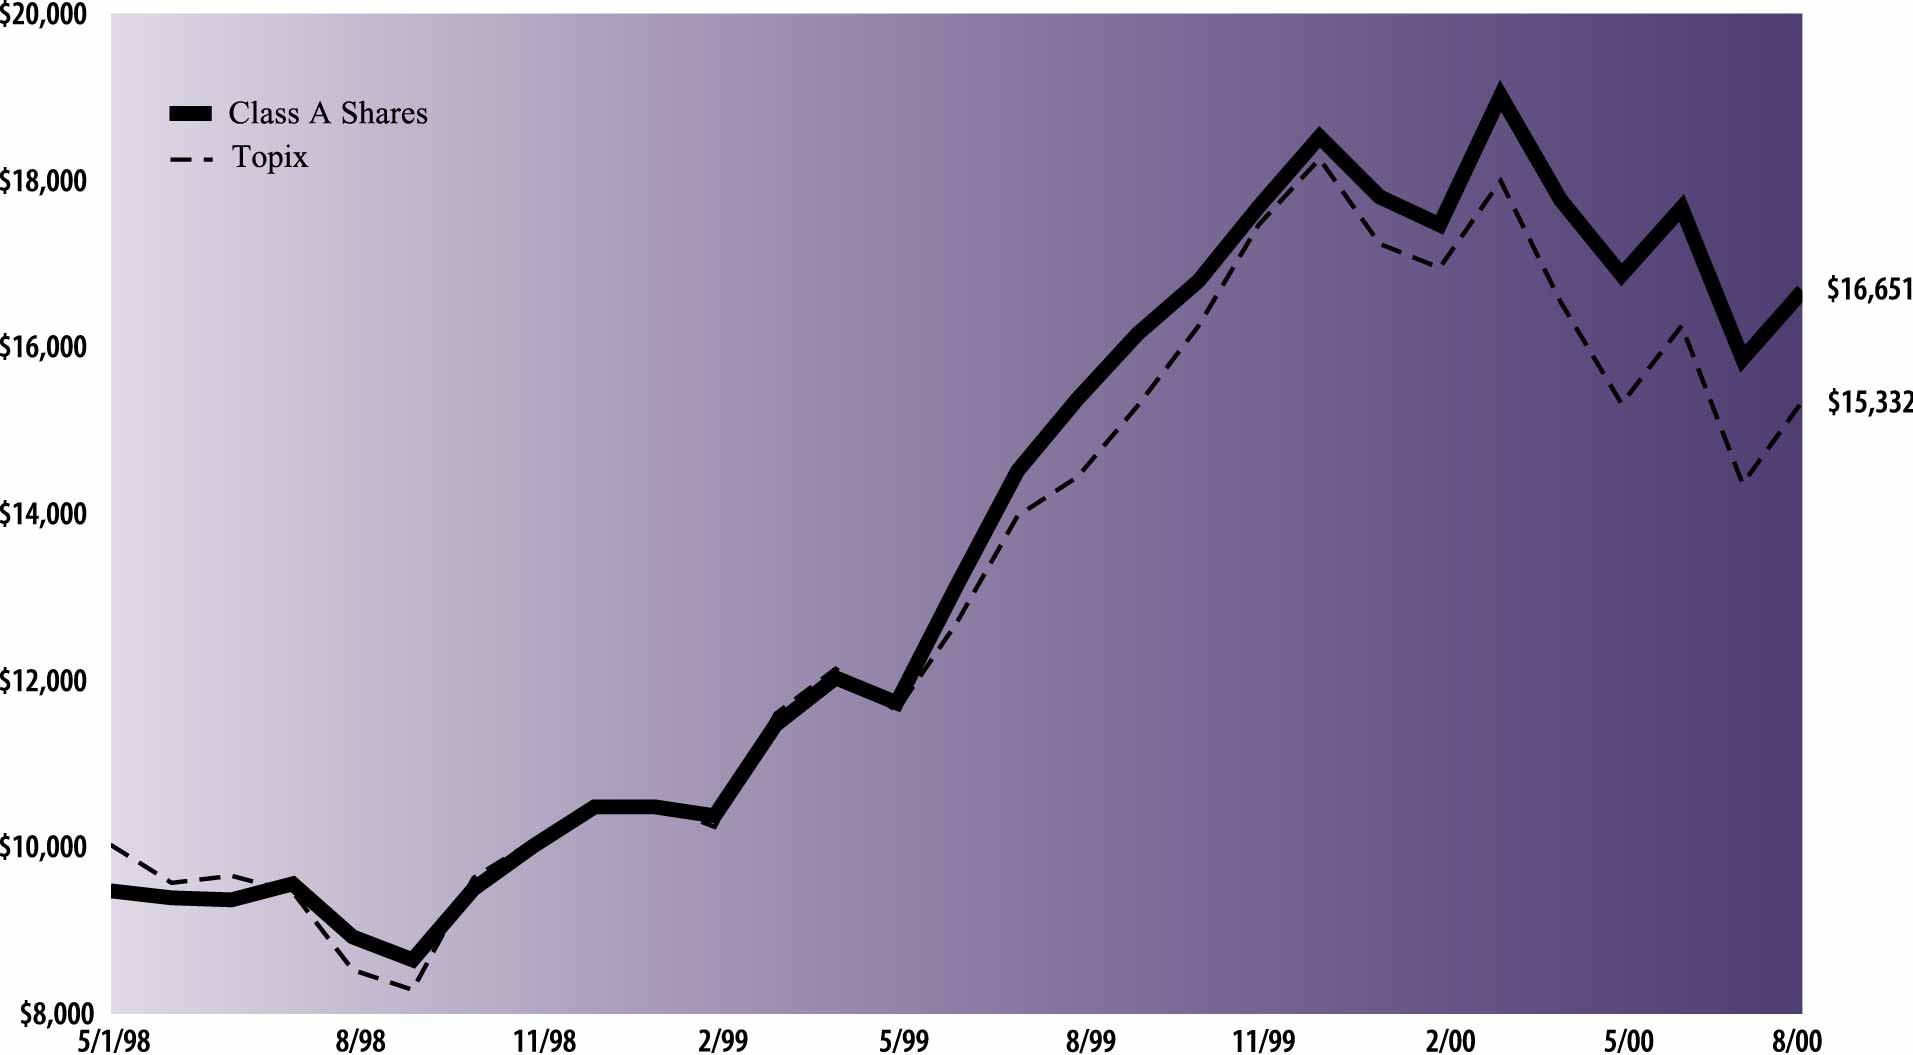
| The following graph shows the value, as of August 31, 2000, of a $10,000 investment made on May 1, 1998 (commencement of
operations) in Class A Shares (maximum sales charge of 5.5%) of the Goldman Sachs Japanese Equity Fund. For comparative purposes, the performance of the Fund’s benchmark (the Tokyo Price Index (“Topix”)), is shown. This performance data
represents past performance and should not be considered indicative of future performance which will fluctuate with changes in market conditions. These performance fluctuations will cause an investor’s shares, when redeemed, to be worth more or less
than their original cost. Performance of Class B, Class C, Institutional and Service Shares will vary from Class A Shares due to differences in fees and loads.
|
| Japanese Equity Fund’s Lifetime Performance
|
| Growth of a $10,000 Investment, Distributions Reinvested May 1, 1998 to August 31, 2000.
|
| Average Annual Total Return through August 31, 2000 (a) | Since Inception | One Year | |||
|---|---|---|---|---|---|
| Class A | |||||
| Excluding sales charges | 27.38% | 8.47% | |||
| Including sales charges | 24.35% | 2.48% | |||
| Class B | |||||
| Excluding contingent deferred sales charges | 26.87% | 8.12% | |||
| Including contingent deferred sales charges | 25.82% | 2.71% | |||
| Class C | |||||
| Excluding contingent deferred sales charges | 26.80% | 7.82% | |||
| Including contingent deferred sales charges | 26.80% | 6.74% | |||
| Institutional Class | 28.15% | 9.14% | |||
| Service Class | 27.42% | 8.65% | |||
(a)
|
Commencement date of operations was May 1, 1998 for all share classes.
|
| Shares | Description | Value | ||
|---|---|---|---|---|
| Common Stocks – 96.3% | ||||
| Japan – 96.3% | ||||
| 91,000 | 77 Bank Ltd. (Banks) | $ 708,204 | ||
| 8,000 | ABLE, Inc. (Real Estate) | 135,021 | ||
| 13,000 | Advantest Corp. (Electronics
Equipment) |
2,651,196 | ||
| 8,700 | Aiful Corp. (Financial Services) | 750,492 | ||
| 303,000 | Asahi Chemical Industry Co. Ltd.
(Chemicals) |
1,894,993 | ||
| 213,000 | Asahi Glass Co. Ltd. (Building
Materials) |
1,991,196 | ||
| 51,000 | Bridgestone Corp. (Auto) | 659,916 | ||
| 62,000 | Canon, Inc. (Computer Hardware) | 2,772,996 | ||
| 176,000 | Chiba Bank Ltd. (Banks) | 719,512 | ||
| 135,000 | Dai-Ichi Kangyo Bank Ltd. (Banks) | 1,024,051 | ||
| 132,000 | Daiwa Securities Group, Inc.
(Financial Services) |
1,646,132 | ||
| 147 | DDI Corp. (Telecommunications) | 1,157,806 | ||
| 172 | East Japan Railway Co. (Railroads) | 935,396 | ||
| 18,000 | Eisai Co. Ltd. (Drugs) | 543,460 | ||
| 12,600 | FANUC Ltd. (Machinery) | 1,370,464 | ||
| 48,000 | Fuji Photo Film Ltd. (Leisure) | 1,719,269 | ||
| 114,000 | Fujitec Co. Ltd. (Construction) | 1,047,539 | ||
| 51,000 | Fujitsu Ltd. (Computer Hardware) | 1,477,637 | ||
| 16,000 | Honda Motor Co. Ltd. (Auto) | 585,091 | ||
| 800 | Ito En Ltd. (Food & Beverage) | 59,259 | ||
| 174,000 | Kanebo Ltd. * (Consumer Products) | 512,293 | ||
| 128,000 | Kaneka Corp. (Chemicals) | 1,411,421 | ||
| 69,000 | Kao Corp. (Consumer Products) | 1,895,640 | ||
| 4,500 | Keyence Corp. (Industrial Parts) | 1,493,671 | ||
| 129,000 | Kirin Brewery Ltd. (Food &
Beverage) |
1,415,190 | ||
| 85,000 | Kokuyo Co. Ltd. (Specialty Retail) | 1,467,276 | ||
| 9,200 | Kyocera Corp. (Electronics
Equipment) |
1,642,457 | ||
| 13,900 | Matsumotokyoshi (Specialty Retail) | 1,251,196 | ||
| 127,000 | Matsushita Electric Works Ltd.
(Construction) |
1,548,054 | ||
| 30,300 | Meitec Corp. (Business Services) | 1,400,647 | ||
| 176,000 | Minebea Co. (Electronics Equipment) | 2,277,356 | ||
| 53,600 | Ministop Co. Ltd. (Specialty Retail) | 1,191,111 | ||
| 67,000 | Mitsui Marine & Fire (Insurance) | 333,587 | ||
| 288,000 | Mitsui Mining & Smelting (Mining) | 2,281,857 | ||
| 11,000 | Murata Manufacturing Co. Ltd.
(Electronics Equipment) |
1,684,295 | ||
| 82,000 | NEC Corp. (Computer Hardware) | 2,345,054 | ||
| 75,000 | NGK Insulators Ltd. (Multi-Industrial) | 1,030,239 | ||
| 18,000 | Nihon Unisys Ltd. (Computer
Hardware) |
322,194 | ||
| 7,100 | Nintendo Co. Ltd. (Entertainment) | 1,227,604 | ||
| 103,000 | Nippon Mining & Metals Co. Ltd.
(Mining) |
577,534 | ||
| 200 | Nippon Telephone & Telegraph Corp.
(Telecommunications) |
2,381,622 | ||
| 259 | NTT Mobile Communications
Network, Inc. (Telecommunications) |
6,848,383 | ||
| 111,000 | Ricoh Co. Ltd. (Computer Hardware) | 1,941,069 | ||
| 9,200 | Rohm Co. (Electronics Equipment) | 2,618,097 | ||
| Shares | Description | Value | |||
|---|---|---|---|---|---|
| Common Stocks – (continued) | |||||
| Japan – (continued) | |||||
| 9,500 | Ryohin Keikaku Co. Ltd. (Specialty
Retail) |
$ 917,487 | |||
| 130,000 | Sanwa Bank (Banks) | 1,229,911 | |||
| 161,000 | Sanyo Electric Co. Ltd. (Electrical
Equipment) |
1,366,198 | |||
| 18,500 | Sato Corp. (Electronics Equipment) | 464,885 | |||
| 126,000 | Sharp Corp. (Electrical Equipment) | 2,007,257 | |||
| 34,000 | Shin-Etsu Chemical Co. Ltd.
(Chemicals) |
1,670,511 | |||
| 41,000 | Skylark Co. Ltd. (Restaurants) | 1,499,297 | |||
| 6,600 | SMC Corp. (Machinery) | 1,169,620 | |||
| 19,600 | Sony Corp. (Electrical Equipment) | 2,186,967 | |||
| 106,000 | Sumitomo Bakelite (Chemicals) | 1,401,407 | |||
| 234,000 | Sumitomo Corp. (Wholesale) | 2,040,506 | |||
| 10,400 | Sumitomo Real Estate Sales Co. Ltd.
(Real Estate) |
408,589 | |||
| 4,800 | Taiyo Ink Manufacturing Co. Ltd.
(Chemicals) |
280,844 | |||
| 37,000 | Takeda Chemical Industries Ltd.
(Drugs) |
2,189,123 | |||
| 14,800 | Takefuji Corp. (Financial Services) | 1,455,715 | |||
| 43,600 | Terumo Corp. (Medical Products) | 1,206,001 | |||
| 252,000 | The Daiwa Bank Ltd. (Banks) | 633,249 | |||
| 71,000 | The Fuji Bank Ltd. (Banks) | 539,906 | |||
| 75,000 | The Nomura Securities Co. Ltd.
(Financial Services) |
1,754,571 | |||
| 97,000 | The Sumitomo Marine & Fire
Insurance Co. Ltd. (Insurance) |
583,000 | |||
| 126,000 | The Sumitomo Trust & Banking Co.
Ltd. (Banks) |
888,439 | |||
| 25,700 | THK Co. Ltd. (Machinery) | 1,214,515 | |||
| 6,500 | Toho Co. (Leisure) | 1,039,147 | |||
| 17,000 | Tokyo Broadcasting System, Inc.
(Media) |
608,908 | |||
| 69,000 | Tokyo Electric Power (Electrical
Utilities) |
1,543,038 | |||
| 61,500 | Toppan Forms Co. Ltd. (Publishing) | 1,300,352 | |||
| 38,000 | Toyoda Machine Works Ltd.
(Machinery) |
344,547 | |||
| 49,000 | Toyota Motor Corp. (Auto) | 2,131,833 | |||
| 128,000 | Tsubakimoto Chain Co. (Machinery) | 516,081 | |||
| 31,000 | Yamanouchi Pharmaceutical Co. Ltd.
(Drugs) |
1,534,740 | |||
| 60,000 | York-Benimaru Co. Ltd. (Specialty
Retail) |
1,409,284 | |||
| 630 | Yoshinoya D&C Co. Ltd.
(Restaurants) |
1,045,570 | |||
| TOTAL COMMON STOCKS | |||||
| (Cost $94,881,731) | $ 103,528,975 | ||||
| TOTAL INVESTMENTS | |||||
| (Cost $94,881,731) | $ 103,528,975 | ||||
*
|
Non-income producing security.
|
| The percentage shown for each investment category reflects the value of investments in that category as a percentage of total net
assets.
|
| As a % of
total net assets |
||||
|---|---|---|---|---|
| Common Stock Industry Classifications† | ||||
| Auto | 3.1 | % | ||
| Banks | 5.3 | |||
| Building Materials | 1.8 | |||
| Business Services | 1.3 | |||
| Chemicals | 6.2 | |||
| Computer Hardware | 8.2 | |||
| Construction | 2.4 | |||
| Consumer Products | 2.2 | |||
| Drugs | 4.0 | |||
| Electrical Equipment | 5.2 | |||
| Electrical Utilities | 1.4 | |||
| Electronics Equipment | 10.5 | |||
| Entertainment | 1.1 | |||
| Financial Services | 5.2 | |||
| Food & Beverage | 1.4 | |||
| Industrial Parts | 1.4 | |||
| Insurance | 0.9 | |||
| Leisure | 2.6 | |||
| Machinery | 4.3 | |||
| Media | 0.6 | |||
| Medical Products | 1.1 | |||
| Mining | 2.7 | |||
| Multi-Industrial | 1.0 | |||
| Publishing | 1.2 | |||
| Railroads | 0.9 | |||
| Real Estate | 0.5 | |||
| Restaurants | 2.4 | |||
| Specialty Retail | 5.8 | |||
| Telecommunications | 9.7 | |||
| Wholesale | 1.9 | |||
| TOTAL COMMON STOCK | 96.3 | % | ||
†
|
Industry concentrations greater than one tenth of one percent are disclosed.
|
| Assets: | ||||||||
| Investment in securities, at value (identified cost $94,881,731) | $103,528,975 | |||||||
| Cash, at value | 2,068,527 | |||||||
| Receivables: | ||||||||
| Fund shares sold | 1,716,008 | |||||||
| Investment securities sold, at value | 845,913 | |||||||
| Reimbursement from investment adviser | 98,440 | |||||||
| Dividends and interest, at value | 41,737 | |||||||
| Forward foreign currency exchange contracts, at value | 17,180 | |||||||
| Deferred organization expenses, net | 8,334 | |||||||
| Other assets | 245 | |||||||
| Total assets | 108,325,359 | |||||||
| Liabilities: | ||||||||
| Payables: | ||||||||
| Investment securities purchased, at value | 511,018 | |||||||
| Amounts owed to affiliates | 138,153 | |||||||
| Fund shares repurchased | 74,498 | |||||||
| Accrued expenses and other liabilities, at value | 58,498 | |||||||
| Total liabilities | 782,167 | |||||||
| Net Assets: | ||||||||
| Paid-in capital | 94,465,512 | |||||||
| Accumulated net investment loss | (1,052,384 | ) | ||||||
| Accumulated net realized gain on investment and foreign currency related transactions | 5,471,371 | |||||||
| Net unrealized gain on investments and translation of assets and liabilities denominated in foreign currencies | 8,658,693 | |||||||
| NET ASSETS | $107,543,192 | |||||||
| Net asset value, offering and redemption price per share: (a) | ||||||||
| Class A | $15.77 | |||||||
| Class B | $15.63 | |||||||
| Class C | $15.58 | |||||||
| Institutional | $15.96 | |||||||
| Service | $15.83 | |||||||
| Shares outstanding: | ||||||||
| Class A | 4,423,243 | |||||||
| Class B | 370,078 | |||||||
| Class C | 272,645 | |||||||
| Institutional | 1,739,909 | |||||||
| Service | 167 | |||||||
| Total shares outstanding, $.001 par value (unlimited number of shares authorized) | 6,806,042 | |||||||
(a)
|
Maximum public offering price per share (NAV per share multiplied by 1.0582) for Class A Shares is $16.69. At redemption, Class B
and Class C Shares may be subject to a contingent deferred sales charge, assessed on the amount equal to the lesser of the current net asset value or the original purchase price of the shares.
|
| Investment income: | ||||||||
| Dividends (a) | $ 426,376 | |||||||
| Interest | 113,496 | |||||||
| Total income | 539,872 | |||||||
| Expenses: | ||||||||
| Management fees | 979,938 | |||||||
| Distribution and Service fees (b) | 396,755 | |||||||
| Custodian fees | 173,141 | |||||||
| Transfer Agent fees (c) | 141,640 | |||||||
| Registration fees | 73,024 | |||||||
| Professional fees | 43,905 | |||||||
| Trustee fees | 8,900 | |||||||
| Amortization of deferred organization expenses | 3,030 | |||||||
| Other | 105,419 | |||||||
| Total expenses | 1,925,752 | |||||||
| Less — expense reductions | (356,497 | ) | ||||||
| Net expenses | 1,569,255 | |||||||
| NET INVESTMENT LOSS | (1,029,383 | ) | ||||||
| Realized and unrealized gain (loss) on Investments, Futures and Foreign currency related transactions: | ||||||||
| Net realized gain (loss) from: | ||||||||
| Investment transactions | 9,773,012 | |||||||
| Futures transactions | 418,165 | |||||||
| Foreign currency related transactions | (18,530 | ) | ||||||
| Net change in unrealized gain (loss) on: | ||||||||
| Investments | (5,490,559 | ) | ||||||
| Futures | (20,305 | ) | ||||||
| Translation of assets and liabilities denominated in foreign currencies | (14,848 | ) | ||||||
| Net realized and unrealized gain on Investments, Futures and Foreign currency related transactions: | 4,646,935 | |||||||
| NET INCREASE IN NET ASSETS RESULTING FROM OPERATIONS | $3,617,552 | |||||||
(a)
|
Foreign taxes withheld on dividends were $74,254.
|
(b)
|
Class A, Class B and Class C had Distribution and Service fees of $286,204, $61,667 and $48,884, respectively.
|
(c)
|
Class A, Class B, Class C, Institutional Class and Service Class had Transfer Agent fees of $108,757, $11,717, $9,288, $11,878 and
$0, respectively.
|
| For the
Year Ended August 31, 2000 |
For the
Seven Months Ended August 31, 1999 |
For the
Period Ended January 31, 1999 (a) |
||||||||||||||||||||
|---|---|---|---|---|---|---|---|---|---|---|---|---|---|---|---|---|---|---|---|---|---|---|
| From operations: | ||||||||||||||||||||||
| Net investment loss | $ (1,029,383 | ) | $ (203,143 | ) | $ (86,973 | ) | ||||||||||||||||
| Net realized gain from investment, futures and foreign currency related transactions | 10,172,647 | 4,330,190 | 140,585 | |||||||||||||||||||
| Net change in unrealized gain (loss) on investments, futures and translation of assets
and liabilities denominated in foreign currencies |
(5,525,712 | ) | 12,242,725 | 1,941,680 | ||||||||||||||||||
| Net increase in net assets resulting from operations | 3,617,552 | 16,369,772 | 1,995,292 | |||||||||||||||||||
| Distributions to shareholders: | ||||||||||||||||||||||
| In excess of net investment income | ||||||||||||||||||||||
| Class A Shares | (473,037 | ) | (1,121 | ) | — | |||||||||||||||||
| Class B Shares | (63,355 | ) | — | — | ||||||||||||||||||
| Class C Shares | (65,248 | ) | (715 | ) | — | |||||||||||||||||
| Institutional Shares | (411,232 | ) | (1,768 | ) | (6,204 | ) | ||||||||||||||||
| Service Shares | (23 | ) | — | — | ||||||||||||||||||
| From net realized gain on investment, futures and foreign currency transactions | ||||||||||||||||||||||
| Class A Shares | (3,934,010 | ) | — | — | ||||||||||||||||||
| Class B Shares | (595,331 | ) | — | — | ||||||||||||||||||
| Class C Shares | (521,995 | ) | — | — | ||||||||||||||||||
| Institutional Shares | (2,840,673 | ) | — | — | ||||||||||||||||||
| Service Shares | (259 | ) | — | — | ||||||||||||||||||
| Total distributions to shareholders | (8,905,163 | ) | (3,604 | ) | (6,204 | ) | ||||||||||||||||
| From share transactions: | ||||||||||||||||||||||
| Proceeds from sales of shares | 103,614,398 | 29,653,297 | 23,719,687 | |||||||||||||||||||
| Reinvestment of dividends and distributions | 8,358,222 | 3,181 | — | |||||||||||||||||||
| Cost of shares repurchased | (63,935,353 | ) | (2,751,373 | ) | (4,186,512 | ) | ||||||||||||||||
| Net increase in net assets resulting from share transactions | 48,037,267 | 26,905,105 | 19,533,175 | |||||||||||||||||||
| TOTAL INCREASE | 42,749,656 | 43,271,273 | 21,522,263 | |||||||||||||||||||
| Net assets: | ||||||||||||||||||||||
| Beginning of period | 64,793,536 | 21,522,263 | — | |||||||||||||||||||
| End of period | $107,543,192 | $64,793,536 | $21,522,263 | |||||||||||||||||||
| Accumulated net investment income (loss) | $ (1,052,384 | ) | $ 270,409 | $ (34,385 | ) | |||||||||||||||||
(a)
|
Commencement date of operations was May 1, 1998 for all share classes.
|
| 1. ORGANIZATION
|
| Goldman Sachs Trust (the “Trust”) is a Delaware business trust registered under the Investment Company Act of 1940 (as
amended) as an open-end management investment company. The Trust includes the Goldman Sachs Japanese Equity Fund (the “Fund”). The Fund is a diversified portfolio offering five classes of shares — Class A, Class B, Class C,
Institutional and Service.
|
| 2. SIGNIFICANT ACCOUNTING POLICIES
|
| The following is a summary of the significant accounting policies consistently followed by the Fund. The preparation of financial
statements in conformity with generally accepted accounting principles requires management to make estimates and assumptions that may affect the reported amounts. Actual results could differ from those estimates. Effective for fiscal year 1999, the Board
of Trustees approved a change in the fiscal year end of the Fund from January 31 to August 31. Accordingly, the Statements of Changes in Net Assets, Summary of Share Transactions and Financial Highlights of the Fund include the seven months ended August
31, 1999 and the year ended January 31, 1999.
|
| A. Investment Valuation — Investments in
securities traded on a U.S. or foreign securities exchange or the NASDAQ system are valued daily at their last sale price on the principal exchange on which they are traded. If no sale occurs, securities are valued at the last bid price. Debt securities
are valued at prices supplied by independent pricing services, broker/dealer-supplied valuations or matrix pricing system. Unlisted equity and debt securities for which market quotations are available are valued at the last sale price on the valuation
date or, if no sale occurs the last bid price. Short-term debt obligations maturing in sixty days or less are valued at amortized cost, which approximates market value. Securities for which quotations are not readily available are valued at fair value
using methods approved by the Board of Trustees of the Trust.
|
| B. Security Transactions and Investment Income — Security transactions are recorded as of the trade date. Realized gains and losses on sales of portfolio securities are calculated using the identified-cost basis. Dividend income is recorded on the ex-dividend date net of foreign withholding taxes where
applicable. Dividends for which the Fund has the choice to receive either cash or stock are recognized as investment income in an amount equal to the cash dividend. Interest income is recorded on the basis of interest accrued, premium amortized and
discount earned.
|
| Net investment income (other than class specific expenses) and unrealized and
realized gains or losses are allocated daily to each class of shares of the Fund based upon the relative proportion of net assets of each class.
|
| C. Federal Taxes — It is the Fund’s
policy to comply with the requirements of the Internal Revenue Code applicable to regulated investment companies and to distribute each year substantially all of its investment company taxable income and capital gains to its shareholders. Accordingly, no
federal tax provision is required. Income and capital gain distributions, if any, are declared and paid annually.
|
| The characterization of distributions to shareholders for financial reporting
purposes is determined in accordance with income tax rules. Therefore, the source of the Fund’s distributions may be shown in the accompanying financial statements as either from or in excess of net investment income or net realized gain on
investment transactions, or from paid-in capital, depending on the type of book/tax differences that may exist.
|
| At August 31, 2000, the aggregate cost of portfolio securities for federal income
tax purposes is $95,541,798. Accordingly, the gross unrealized gain on investments was $10,179,863 and the gross unrealized loss on investments was $2,192,686 resulting in a net unrealized gain of $7,987,177.
|
| D. Expenses — Expenses incurred by the
Trust which do not specifically relate to an individual Fund of the Trust are allocated to the Funds based on a straight-line or prorata basis depending upon the nature of the expense.
|
| Class A, Class B and Class C Shares bear all expenses and fees relating to their
respective Distribution and Service Plans. Shareholders of Service Shares bear all expenses and fees paid to service organizations. Each class of shares separately bears its respective class-specific Transfer Agency fees.
|
| 2. SIGNIFICANT ACCOUNTING POLICIES (continued)
|
| E. Deferred Organization Expenses —
Organization-related costs are amortized on a straight-line basis over a period of five years.
|
| F. Foreign Currency Translations — The
books and records of the Fund are maintained in U.S. dollars. Amounts denominated in foreign currencies are translated into U.S. dollars on the following basis: (i) investment valuations, foreign currency and other assets and liabilities initially
expressed in foreign currencies are converted each business day into U.S. dollars based on current exchange rates; (ii) purchases and sales of foreign investments, income and expenses are converted into U.S. dollars based on currency exchange rates
prevailing on the respective dates of such transactions.
|
| Net realized and unrealized gain (loss) on foreign currency transactions will
represent: (i) foreign exchange gains and losses from the sale and holdings of foreign currencies; (ii) currency gains and losses between trade date and settlement date on investment securities transactions and forward exchange contracts; and (iii) gains
and losses from the difference between amounts of dividends, interest and foreign withholding taxes recorded and the amounts actually received.
|
| G. Segregation Transactions — The Fund may
enter into certain derivative transactions to seek to increase total return. Forward foreign currency exchange contracts, futures contracts, written options, mortgage dollar rolls, when-issued securities and forward commitments represent examples of such
transactions. As a result of entering into these transactions, the Fund is required to segregate liquid assets on the accounting records equal to or greater than the market value of the corresponding transactions.
|
| 3. AGREEMENTS
|
| Pursuant to the Investment Management Agreement (the “Agreement”), Goldman Sachs Asset Management International (“
GSAMI”), an affiliate of Goldman Sachs & Co. (“Goldman Sachs”) serves as the investment adviser to the Fund. Under the Agreement, GSAMI, subject to the general supervision of the Trust’s Board of Trustees, manages the Fund’s
portfolio. As compensation for the services rendered under the Agreement, the assumption of the expenses related thereto and administering the Fund’s business affairs, including providing facilities, GSAMI is entitled to a fee, computed daily and
payable monthly, at an annual rate equal to 1.00% of the average daily net assets of the Fund.
|
| The adviser has voluntarily agreed to limit certain “Other Expenses”
(excluding Management fees, Distribution and Service fees, Transfer Agent fees, Service Share fees, taxes, interest, brokerage, litigation, indemnification costs and other extraordinary expenses) to the extent such expenses exceed, on an annual basis,
0.11% (0.01% prior to May 1, 2000) of the average daily net assets of the Fund. For the year ended August 31, 2000, Goldman Sachs reimbursed approximately $353,000. In addition, the Fund has entered into certain offset arrangements with the custodian
resulting in a reduction in the Fund’s expenses. For the year ended August 31, 2000, custody fees were reduced by approximately $3,000.
|
| The Trust, on behalf of the Fund, had adopted Distribution and Service Plans.
Under the Distribution and Service Plans, Goldman Sachs and/or Authorized Dealers are entitled to a monthly fee from the Fund for distribution and shareholder maintenance services equal, on an annual basis, to 0.50%, 1.00% and 1.00% of the Fund’s
average daily net assets attributable to Class A, Class B and Class C Shares, respectively.
|
| Goldman Sachs serves as the distributor of shares of the Fund pursuant to a
Distribution Agreement. Goldman Sachs may receive a portion of the Class A sales load and Class B and Class C contingent deferred sales charges and has advised the Fund that it retained approximately $497,000 for the year ended August 31, 2000.
|
| Goldman Sachs also serves as the transfer agent of the Fund for a fee. The fees
charged for such transfer agent services are calculated daily and payable monthly at an annual rate as follows: 0.19% of average daily net assets for Class A, Class B and Class C Shares and 0.04% of average daily net assets for Institutional and Service
Shares.
|
| 3. AGREEMENTS (continued)
|
| The Trust, on behalf of the Fund, has adopted a Service Plan. This Plan allows for Service Shares to compensate service
organizations for providing varying levels of account administration and shareholder liaison services to their customers who are beneficial owners of such shares. The Service Plan provides for compensation to the service organizations in an amount up to
0.50% (on an annualized basis), of the average daily net asset value of the Service Shares.
|
| As of August 31, 2000, the amounts owed to affiliates were approximately $88,000, $37,000 and $13,000 for Management, Distribution
and Service and Transfer Agent fees, respectively.
|
| 4. PORTFOLIO SECURITIES TRANSACTIONS
|
| The cost of purchases and proceeds of sales or maturities of securities (excluding short-term investments and futures) for the
year ended August 31, 2000, were $95,360,487 and $54,626,277, respectively. For the year ended August 31, 2000, Goldman Sachs earned approximately $8,000 of brokerage commissions from portfolio transactions including futures transactions executed on
behalf of the Fund.
|
| Forward Foreign Currency Exchange Contracts — The
Fund may enter into forward foreign currency exchange contracts for the purchase or sale of a specific foreign currency at a fixed price on a future date as a hedge or cross-hedge against either specific transactions or portfolio positions. The Fund may
also purchase and sell such contracts to seek to increase total return. All commitments are “marked-to-market” daily at the applicable translation rates and any resulting unrealized gains or losses are recorded in the Fund’s financial
statements. The Fund records realized gains or losses at the time a forward contract is offset by entry into a closing transaction or extinguished by delivery of the currency. Risks may arise upon entering these contracts from the potential inability of
counterparties to meet the terms of their contracts and from unanticipated movements in the value of a foreign currency relative to the U.S. dollar.
|
| At August 31, 2000, the Fund had the following outstanding forward foreign currency exchange contracts:
|
| Unrealized |
|||||||||
|---|---|---|---|---|---|---|---|---|---|
| Open Forward Foreign Currency
Purchase Contracts |
Value on
Settlement Date |
Current
Value |
Gain | Loss | |||||
| Japanese Yen | |||||||||
| expiring 10/20/2000 | $ 16,801 | $ 17,180 | $ 379 | $— | |||||
| TOTAL OPEN FORWARD FOREIGN CURRENCY
PURCHASE CONTRACTS |
$ 16,801 | $ 17,180 | $ 379 | $— | |||||
| Closed but Unsettled | Purchase | Sale | Realized |
||||||
| Forward Foreign Currency Contracts | Value | Value | Gain | Loss | |||||
| Japanese Yen | |||||||||
| expiring 10/20/2000 | $1,456,199 | $1,473,000 | $16,801 | $— | |||||
| TOTAL CLOSED BUT UNSETTLED FORWARD
FOREIGN CURRENCY CONTRACTS |
$1,456,199 | $1,473,000 | $16,801 | $— | |||||
| 4. PORTFOLIO SECURITIES TRANSACTIONS (continued)
|
| The contractual amounts of forward foreign currency exchange contracts do not necessarily represent the amounts potentially
subject to risk. The measurement of the risks associated with these instruments is meaningful only when all related and offsetting transactions are considered. At August 31, 2000, the Fund had sufficient cash and securities to cover any commitments under
these contracts.
|
| Futures Contracts — The Fund may enter into futures
transactions to hedge against changes in interest rates, securities prices, currency exchange rates or to seek to increase total return. Upon entering into a futures contract, the Fund is required to deposit with a broker or the Fund’s custodian
bank, an amount of cash or securities equal to the minimum “initial margin” requirement of the associated futures exchange. Subsequent payments for futures contracts (“variation margin”) are paid or received by the Fund, depending on
the fluctuations in the value of the contracts, and are recorded as unrealized gains or losses. When contracts are closed, the Fund realizes a gain or loss which is reported in the Statement of Operations.
|
| The use of futures contracts involve, to varying degrees, elements of market risk
which may exceed the amounts recognized in the Statement of Assets and Liabilities. Changes in the value of the futures contracts may not directly correlate with changes in the value of the underlying securities. This risk may decrease the effectiveness
of the Fund’s hedging strategies and potentially result in a loss. At August 31, 2000, there were no open futures contracts.
|
| 5. LINE OF CREDIT FACILITY
|
| Effective May 31, 2000, the Fund participates in a $350,000,000 committed, unsecured revolving line of credit facility. Prior
thereto, the Fund participated in a $250,000,000 uncommitted and a $250,000,000 committed, unsecured revolving line of credit facility. Under the most restrictive arrangement, the Fund must own securities having a market value in excess of 400% of the
total bank borrowings. These facilities are to be used solely for temporary or emergency proposes. The interest rate on borrowings is based on the Federal Funds rate. The committed facility also requires a fee to be paid by the Fund based on the amount of
the commitment. During the year ended August 31, 2000, the Fund did not have any borrowings under any of these facilities.
|
| 6. CERTAIN RECLASSIFICATIONS
|
| In accordance with AICPA Statement of Position 93-2, the Fund reclassified $716,455 from accumulated net realized gain from
investment and foreign currency related transactions to accumulated net investment loss and $3,030 from paid-in capital to accumulated undistributed net investment loss. These reclassifications have no impact on the net asset value of the Fund and are
designed to present the Fund’s capital accounts on a tax basis. Reclassifications results primarily from the difference in the tax treatment of foreign currency, net operating losses and organization costs.
|
| 7. OTHER MATTERS
|
| As of August 31, 2000, the Goldman Sachs Group was the beneficial owner of approximately 12% of the outstanding shares of the Fund.
|
| 8. CHANGE IN INDEPENDENT ACCOUNTANTS
|
| On October 26, 1999 the Board of Trustees of the Fund upon the recommendation of the Board’s audit committee, determined not
to retain Arthur Andersen LLP and approved a change of the Fund’s independent accountants to PricewaterhouseCoopers LLP. For the fiscal years ended August 31, 1999 and January 31, 1999, Arthur Andersen LLP’s audit reports contained no adverse
opinion or disclaimer of opinion; nor were their reports qualified or modified as to uncertainty, audit scope, or accounting principles. Further, there were no disagreements between the Fund and Arthur Andersen LLP on accounting principles or practices,
financial statement disclosure or audit scope or procedure, which if not resolved to the satisfaction of Arthur Andersen LLP would have caused them to make reference to the disagreement in their report.
|
| 9. SUMMARY OF SHARE TRANSACTIONS
|
| Share activity is as follows:
|
| For the Year Ended
August 31, 2000 |
For the Seven Months
Ended August 31, 1999 |
For the Period Ended
January 31, 1999(a) |
|||||||||||||||||
|---|---|---|---|---|---|---|---|---|---|---|---|---|---|---|---|---|---|---|---|
| Shares | Dollars | Shares | Dollars | Shares | Dollars | ||||||||||||||
| Class A Shares | |||||||||||||||||||
| Shares sold | 4,738,629 | $79,542,711 | 1,490,616 | $19,567,798 | 974,018 | $ 9,912,925 | |||||||||||||
| Reinvestment of dividends and distributions | 251,265 | 4,158,443 | 61 | 921 | — | — | |||||||||||||
| Shares repurchased | (2,677,761 | ) | (44,672,392 | ) | (138,512 | ) | (1,823,081 | ) | (215,073 | ) | (2,211,327 | ) | |||||||
| 2,312,133 | 39,028,762 | 1,352,165 | 17,745,638 | 758,945 | 7,701,598 | ||||||||||||||
| Class B Shares | |||||||||||||||||||
| Shares sold | 256,898 | 4,363,660 | 156,293 | 2,037,345 | 143,378 | 1,452,502 | |||||||||||||
| Reinvestment of dividends and distributions | 37,057 | 608,848 | — | — | — | — | |||||||||||||
| Shares repurchased | (185,312 | ) | (3,068,196 | ) | (24,231 | ) | (344,034 | ) | (14,005 | ) | (144,559 | ) | |||||||
| 108,643 | 1,904,312 | 132,062 | 1,693,311 | 129,373 | 1,307,943 | ||||||||||||||
| Class C Shares | |||||||||||||||||||
| Shares sold | 184,775 | 3,116,549 | 209,165 | 2,748,964 | 197,598 | 2,047,960 | |||||||||||||
| Reinvestment of dividends and distributions | 32,401 | 532,028 | 44 | 665 | — | — | |||||||||||||
| Shares repurchased | (166,325 | ) | (2,745,926 | ) | (13,133 | ) | (201,949 | ) | (171,880 | ) | (1,830,626 | ) | |||||||
| 50,851 | 902,651 | 196,076 | 2,547,680 | 25,718 | 217,334 | ||||||||||||||
| Institutional Shares | |||||||||||||||||||
| Shares sold | 984,742 | 16,591,478 | 384,318 | 5,299,190 | 1,028,740 | 10,304,702 | |||||||||||||
| Reinvestment of dividends and distributions | 183,481 | 3,058,621 | 104 | 1,595 | — | — | |||||||||||||
| Shares repurchased | (816,713 | ) | (13,448,640 | ) | (24,763 | ) | (382,309 | ) | — | — | |||||||||
| 351,510 | 6,201,459 | 359,659 | 4,918,476 | 1,028,740 | 10,304,702 | ||||||||||||||
| Service Shares | |||||||||||||||||||
| Shares sold | — | — | — | — | 161 | 1,598 | |||||||||||||
| Reinvestment of dividends and distributions | 17 | 282 | — | — | — | — | |||||||||||||
| Shares repurchased | (11 | ) | (199 | ) | — | — | — | — | |||||||||||
| 6 | 83 | — | — | 161 | 1,598 | ||||||||||||||
| NET INCREASE | 2,823,143 | $48,037,267 | 2,039,962 | $26,905,105 | 1,942,937 | $19,533,175 | |||||||||||||
(a)
|
Commencement date of operations was May 1, 1998 for all share classes.
|
| Goldman Sachs Japanese Fund — Tax Information (unaudited)
|
| Pursuant to Section 852 of the Internal Revenue Code, the Fund designated $3,591,461 as
capital gain dividends paid during its year ended August 31, 2000. For the distribution paid during the year ended August 31, 2000, the total amount of income received by the Japanese Equity Fund from sources within foreign countries and possessions of
the United States was $0.0270 per share all of which is attributable to qualified passive income. The total amount of taxes paid by the Fund to such countries was $0.0044 per share. A separate notice containing the country by country components of these
totals has been previously mailed to the shareholders.
|
| Income from
investment operations |
Distributions to shareholders |
||||||||||||||||||||
|---|---|---|---|---|---|---|---|---|---|---|---|---|---|---|---|---|---|---|---|---|---|
| Net asset
value, beginning of period |
Net
investment loss |
Net realized
and unrealized gains |
Total income
from investment operations |
From net
investment income |
In excess
of net investment income |
From net
realized gains |
Total
distributions |
||||||||||||||
| FOR THE YEAR ENDED AUGUST 31, | |||||||||||||||||||||
| 2000 - Class A Shares | $16.24 | $(0.20 | ) (c) | $1.67 | $1.47 | $ — | $(0.21 | ) | $(1.73 | ) | $(1.94) | ||||||||||
| 2000 - Class B Shares | 16.14 | (0.28 | ) (c) | 1.68 | 1.40 | — | (0.18 | ) | (1.73 | ) | (1.91) | ||||||||||
| 2000 - Class C Shares | 16.16 | (0.28 | ) (c) | 1.64 | 1.36 | — | (0.21 | ) | (1.73 | ) | (1.94) | ||||||||||
| 2000 - Institutional Shares | 16.36 | (0.09 | ) (c) | 1.67 | 1.58 | — | (0.25 | ) | (1.73 | ) | (1.98) | ||||||||||
| 2000 - Service Shares | 16.22 | (0.16 | ) (c) | 1.65 | 1.49 | — | (0.15 | ) | (1.73 | ) | (1.88) | ||||||||||
| FOR THE SEVEN MONTHS ENDED AUGUST 31, | |||||||||||||||||||||
| 1999 - Class A Shares | 11.06 | (0.06 | ) | 5.24 | 5.18 | — | — | — | — | ||||||||||||
| 1999 - Class B Shares | 11.03 | (0.09 | ) | 5.20 | 5.11 | — | — | — | — | ||||||||||||
| 1999 - Class C Shares | 11.04 | (0.08 | ) | 5.20 | 5.12 | — | — | — | — | ||||||||||||
| 1999 - Institutional Shares | 11.10 | (0.03 | ) | 5.29 | 5.26 | — | — | — | — | ||||||||||||
| 1999 - Service Shares | 11.04 | (0.06 | ) | 5.24 | 5.18 | — | — | — | — | ||||||||||||
| FOR THE PERIOD ENDED JANUARY 31, | |||||||||||||||||||||
| 1999 - Class A Shares (commenced May 1, 1998) | 10.00 | (0.06 | ) | 1.12 | 1.06 | — | — | — | — | ||||||||||||
| 1999 - Class B Shares (commenced May 1, 1998) | 10.00 | (0.08 | ) | 1.11 | 1.03 | — | — | — | — | ||||||||||||
| 1999 - Class C Shares (commenced May 1, 1998) | 10.00 | (0.09 | ) | 1.13 | 1.04 | — | — | — | — | ||||||||||||
| 1999 - Institutional Shares (commenced May 1, 1998) | 10.00 | (0.02 | ) | 1.13 | 1.11 | (0.01 | ) | — | — | (0.01) | |||||||||||
| 1999 - Service Shares (commenced May 1, 1998) | 10.00 | (0.05 | ) | 1.09 | 1.04 | — | — | — | — | ||||||||||||
(a)
|
Assumes investment at the net asset value at the beginning of the period, reinvestment of all dividends and distributions, a
complete redemption of the investment at the net asset value at the end of the period and no sales or redemption charges. Total return would be reduced if a sales or redemption charge were taken into account. Total returns for periods less than one full
year are not annualized.
|
(b)
|
Annualized.
|
| (c) Calculated based on the average shares outstanding methodology.
|
|
Ratios assuming no expense reductions |
||||||||||||||||||||||
|---|---|---|---|---|---|---|---|---|---|---|---|---|---|---|---|---|---|---|---|---|---|---|
| Net asset
value, end of period |
Total
return (b) |
Net assets
at end of period (in 000s) |
Ratio of
net expenses to average net assets |
Ratio of
net investment loss to average net assets |
Ratio of
expenses to average net assets |
Ratio of
net investment loss to average net assets |
Portfolio
turnover rate |
|||||||||||||||
| $15.77 | 8.47 | % | $69,741 | 1.74 | % | (1.20 | )% | 2.10 | % | (1.56 | )% | 60.76 | % | |||||||||
| 15.63 | 8.12 | 5,783 | 2.24 | (1.67 | ) | 2.60 | (2.03 | ) | 60.76 | |||||||||||||
| 15.58 | 7.82 | 4,248 | 2.24 | (1.66 | ) | 2.60 | (2.02 | ) | 60.76 | |||||||||||||
| 15.96 | 9.14 | 27,768 | 1.09 | (0.53 | ) | 1.45 | (0.89 | ) | 60.76 | |||||||||||||
| 15.83 | 8.65 | 3 | 1.59 | (0.94 | ) | 1.95 | (1.30 | ) | 60.76 | |||||||||||||
| 16.24 | 46.84 | 34,279 | 1.70 | (b) | (1.17 | ) (b) | 2.62 | (b) | (2.09 | ) (b) | 44.83 | |||||||||||
| 16.14 | 46.33 | 4,219 | 2.20 | (b) | (1.57 | ) (b) | 3.12 | (b) | (2.49 | ) (b) | 44.83 | |||||||||||
| 16.16 | 46.41 | 3,584 | 2.20 | (b) | (1.81 | ) (b) | 3.12 | (b) | (2.73 | ) (b) | 44.83 | |||||||||||
| 16.36 | 47.40 | 22,709 | 1.05 | (b) | (0.37 | ) (b) | 1.97 | (b) | (1.29 | ) (b) | 44.83 | |||||||||||
| 16.22 | 46.92 | 3 | 1.55 | (b) | (0.74 | ) (b) | 2.47 | (b) | (1.66 | ) (b) | 44.83 | |||||||||||
| 11.06 | 10.60 | 8,391 | 1.64 | (b) | (1.20 | ) (b) | 4.18 | (b) | (3.74 | ) (b) | 53.29 | |||||||||||
| 11.03 | 10.30 | 1,427 | 2.15 | (b) | (1.76 | ) (b) | 4.69 | (b) | (4.30 | ) (b) | 53.29 | |||||||||||
| 11.04 | 10.40 | 284 | 2.15 | (b) | (1.69 | ) (b) | 4.69 | (b) | (4.23 | ) (b) | 53.29 | |||||||||||
| 11.10 | 11.06 | 11,418 | 1.03 | (b) | (0.36 | ) (b) | 3.57 | (b) | (2.90 | ) (b) | 53.29 | |||||||||||
| 11.04 | 10.43 | 2 | 1.53 | (b) | (0.68 | ) (b) | 4.07 | (b) | (3.22 | ) (b) | 53.29 | |||||||||||
| To the Shareholders and Board of Trustees of
Goldman Sachs Trust — Japanese Equity Fund: |
| In our opinion, the accompanying statement of assets and liabilities, including the statement of investments, and the related
statements of operations and of changes in net assets and the financial highlights present fairly, in all material respects, the financial position of Goldman Sachs Japanese Equity Fund (“the Fund”), one of the portfolios constituting Goldman
Sachs Trust, at August 31, 2000, the results of its operations, the changes in its net assets and the financial highlights for the year then ended, in conformity with accounting principles generally accepted in the United States of America. These
financial statements and financial highlights (hereafter referred to as “financial statements”) are the responsibility of the Fund’s management; our responsibility is to express an opinion on these financial statements based on our audit.
We conducted our audit of these financial statements in accordance with auditing standards generally accepted in the United States of America, which require that we plan and perform the audit to obtain reasonable assurance about whether the financial
statements are free of material misstatement. An audit includes examining, on a test basis, evidence supporting the amounts and disclosures in the financial statements, assessing the accounting principles used and significant estimates made by management,
and evaluating the overall financial statement presentation. We believe that our audit, which included confirmation of securities at August 31, 2000 by correspondence with the custodian and brokers, provides a reasonable basis for our opinion. The
statements of changes in net assets and financial highlights of the Fund for the periods ended August 31, 1999 and January 31, 1999 were audited by other independent accountants whose report dated October 8, 1999 expressed an unqualified opinion thereon.
|
| PricewaterhouseCoopers LLP
|
| Boston, Massachusetts
|
| October 23, 2000
|
GOLDMAN SACHS FUND PROFILE
Goldman Sachs Japanese Equity Fund
| An Investment Idea for the Long Term | |||
| History has shown that a long-term plan that includes international stocks can help provide greater protection against market volatility over time than a portfolio that invests only in U.S. stocks. | |||
| Goldman Sachs Japanese Equity Fund provides investors access to the benefits associated with international market diversification. The Fund seeks long-term capital appreciation through equity securities of Japanese companies. | |||
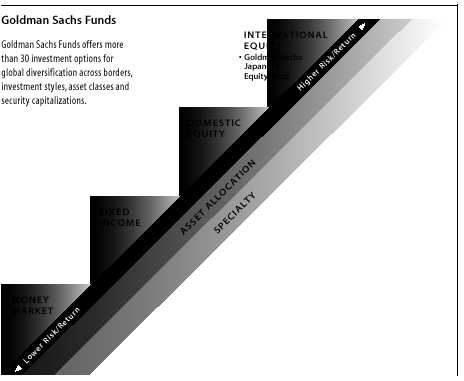
| Target Your Needs | |||
| The Goldman Sachs Japanese Equity Fund has a distinct investment objective and a defined place on the risk/return spectrum. As your investment objectives change, you can exchange shares within Goldman Sachs Funds without any additional charge.* (Please note: in general, greater returns are associated with greater risk.) | |||
| For More Information | |||
| To learn more about the Goldman Sachs Japanese Equity Fund and other Goldman Sachs Funds, call your investment professional today. | |||
| *The exchange privilege is subject to termination and its terms are subject to change. | |||

|
|