
|
|
|
|
|
|
|
|
|
Goldman Sachs Funds
TAXABLE INVESTMENT GRADE FUNDS
Semiannual Report April 30, 2000
Current income potential from
portfolios that invest in a
variety of fixed income securities.
[GRAPHIC]
[LOGO OF GOLDMAN SACHS]
GOLDMAN SACHS TAXABLE INVESTMENT GRADE FUNDS
Market Overview
Dear Shareholder:
During the period under review, bond markets around the world generally posted lackluster results, due to expanding
economies and higher yields.
Market Review
Outlook
Looking ahead, we are becoming more constructive on the outlook for the U.S. and European bond markets, although we retain our negative bias toward the Japanese bond market. In both the U.S. and Europe, we believe previously enacted and anticipated interest rate hikes have been largely priced into the market. In both regions we feel that these increased rates will result in slower economic growth and moderate inflation and increase the potential for a moderate rebound in their respective bond markets. However, we believe that the Bank of Japan will raise rates prior to year-end, likely resulting in falling bond prices.
Sincerely,
| /s/ David B. Ford | /s/ David W. Blood | /s/ Sharmin Mossavar-Rahmani |
| David B. Ford | David W. Blood | Sharmin Mossavar-Rahmani |
| Co-Head, Goldman Sachs | Co-Head, Goldman Sachs | CIO, Fixed Income Investments, |
| Asset Management | Asset Management | Goldman Sachs Asset Management |
| May 9, 2000 |
NOT FDIC-INSURED
May Lose Value
No Bank Guarantee
FUND BASICS
Adjustable Rate Government Fund
as of April 30, 2000
Assets Under Management
$247.8 Million
NASDAQ SYMBOLS
Class A Shares
GSAMX
Institutional Shares
GSARX
Service Shares
GSASX
| PERFORMANCE REVIEW |
||||
| October 31, 1999-
April 30 , 2000 |
Fund Total Return
(based on NAV)1 |
30-Day
Standardized Yield2 |
6-Month
|
1-Year
U.S. Treasury3 |
| | ||||
| Class A |
2.70% |
5.44% |
2.72% |
2.24% |
| Institutional |
2.90% |
5.92% |
2.72% |
2.24% |
| Service |
2.48% |
5.38% |
2.72% |
2.24% |
| |
||||
| 1 | The net asset value represents the net assets of the Fund (ex-dividend) divided by the total number of shares outstanding. The Fund's performance reflects the reinvestment of dividends and other distributions. |
| 2 | The 30-Day Standardized Yield of the Fund is calculated by dividing the net investment income per share (as defined by securities industry regulations) earned by the Fund over a 30-day period (ending on the stated month-end date) by the maximum public offering price per share of the Fund on the last day of the period. This number is compounded semiannually and then annualized. This yield does not necessarily reflect income actually earned and distributed by the Fund and, therefore, may not be correlated with the dividends or other distributions paid to shareholders. |
| 3 | The 6-Month and 1-Year U.S. Treasury securities reported by Merrill Lynch do not reflect any fees or expenses. |
| STANDARDIZED TOTAL RETURNS |
|||
| For the period ending 3/31/00 |
Class A |
Institutional |
Service |
| | |||
| One Year4 |
3.29% |
5.20% |
4.57% |
| Five Years4 |
N/A |
5.84% |
N/A |
| Since Inception4 |
5.10% |
5.34% |
4.74% |
| (5/15/95) |
(7/17/91) |
(3/27/97) |
|
| |
|||
| 4 | The Standardized Total Returns are average annual returns as of the most recent calendar quarter-end. They assume reinvestment of all distributions at net asset value. These returns reflect a maximum initial sales charge of 1.5% for Class A shares. Because Institutional and Service shares do not involve sales charges, such charges have not been applied to their Standardized Total Returns. |
| PORTFOLIO COMPOSITION AS OF 4/30/00 5 |
|
| Sector Allocation |
|
| |
|
| Adjustable Rate Mortgage Securities |
72.3% |
| Collateralized Mortgage Obligations |
9.4% |
| Fixed Rate Pass-Throughs |
6.6% |
| Cash Equivalents |
9.0% |
| |
|
| 5 | Figures represent a percentage of net assets and may not sum to 100%. The Fund is actively managed and, as such, its composition may differ over time. |
| Total return figures represent past performance and do not indicate future results, which will vary. The investment return and principal value of an investment will fluctuate and, therefore, an investor's shares, when redeemed, may be worth more or less than their original cost. Performance reflects expense limitations in effect. In their absence, performance would be reduced. |
PERFORMANCE OVERVIE W
Adjustable Rate Government Fund
Dear Shareholder,
We are pleased to report on the performance of the Goldman Sachs Adjustable Rate Government Fund for the six month period that ended April 30, 2000.
Performance Review
Over the six month reporting period that ended April 30, 2000, the Fund's Class A, Institutional and Service shares generated cumulative total returns, at net asset value, of 2.70%, 2.90% and 2.48%, respectively. These returns generally outperformed the Fund's benchmarks, the six-month U.S. Treasury bill and the one-year U.S. Treasury bill, which returned 2.72% and 2.24%, respectively.
Investment Objective
The Fund seeks a high level of current income consistent with low volatility of principal, primarily through investments in securities issued by the U.S. government, its agencies, instrumentalities or sponsored enterprises that are adjustable rate mortgage pass-through securities and other mortgage securities with periodic interest rate resets.
Portfolio Composition
We maintained our strategy of focusing on sectors and securities that we believe will generate a competitive total rate of return relative to the benchmark, while de-emphasizing directional duration management.
Portfolio Highlights
- Adjustable Rate Mortgages (ARMS) (71.7% on October 31, 1999 to 72.3% on April 30, 2000) -- During the reporting period the Fund's allocation to ARMs increased, due to our positive view on prepayment spreads.
- Collateralized Mortgage Obligations (CMOs) (14.1% on October 31, 1999 to 9.4% on April 30, 2000) -- The Fund reallocated assets from CMOs to ARMs, based on their strong technical and fundamental factors.
- Fixed-Rate Pass-Throughs (7.9% on October 31, 1999 to 6.6% on April 30, 2000) -- The Fund's allocation to fixed-rate pass-throughs remained relatively stable during the reporting period.
PERFORMANCE OVERVIEW
Portfolio Outlook
We continue our favorable outlook on the U.S. fixed income market, although spreads remain vulnerable to technical factors including both Federal Reserve and U.S. Treasury activities. However, we also believe recent spread widening will provide attractive buying opportunities across a variety of fixed income sectors. In particular, we believe the mortgage market currently represents excellent value, and find lower coupons to be particularly attractive.
We thank you for your investment and look forward to your continued confidence.
Goldman Sachs U.S. Fixed Income Investment Management Team
May 9, 2000
FIXED INCOME
INVESTMENT
PROCESS OVERVIEW
1
Sector Allocation
Our sector specialists work together to assess relative value among sectors and create investment strategies to meet each fund's objectives.
2
Security Selection
In selecting securities for each portfolio, our fixed income teams have access to the vast resources of Goldman Sachs.
3
Yield Curve Strategies
We adjust the term structure of our portfolios based on our expectations of the relationship between short- and long-term interest rates, while keeping each fund's duration close to its benchmark.
FUND BASICS
Short Duration Government Fund
as of April 30, 2000
Assets Under Management
$179.4 Million
NASDAQ SYMBOLS
Class A Shares
GSSDX
Class B Shares
GSDGX
Class C Shares
GSDCX
Institutional Shares
GSTGX
Service Shares
GSDSX
| PERFORMANCE REVIEW | |||
| October 31, 1999-
April 30, 2000 |
Fund Total Return
(based on NAV)1
|
30-Day
Standardized Yield2
|
2-Year U.S.
Treasury Security3
|
| |
|||
| Class A | 1.31%
|
5.52%
|
1.33%
|
| Class B | 0.90%
|
5.04%
|
1.33%
|
| Class C | 0.82%
|
4.88%
|
1.33%
|
| Institutional | 1.41%
|
6.04%
|
1.33%
|
| Service | 1.15%
|
5.55%
|
1.33%
|
| |
|
| 1 | The net asset value represents the net assets of the Fund (ex-dividend) divided by the total number of shares outstanding. The Fund's performance reflects the reinvestment of dividends and other distributions. |
| 2 | The 30-Day Standardized Yield of the Fund is calculated by dividing the net investment income per share (as defined by securities industry regulations) earned by the Fund over a 30-day period (ending on the stated month-end date) by the maximum public offering price per share of the Fund on the last day of the period. This number is compounded semiannually and then annualized. This yield does not necessarily reflect income actually earned and distributed by the Fund and, therefore, may not be correlated with the dividends or other distributions paid to shareholders. |
| 3 | The 2-Year U.S. Treasury security does not reflect any fees or expenses. |
| STANDARDIZED TOTAL RETURNS | |||||
| For the period ending 3/31/00 |
Class A |
Class B |
Class C |
Institutional |
Service |
| |
|||||
| One Year4 |
0.33% |
-0.28% |
0.69% |
2.67% |
2.27% |
| Five Years4 |
N/A |
N/A |
N/A |
5.99% |
N/A |
| Ten Years4 |
N/A |
N/A |
N/A |
6.25% |
N/A |
| Since Inception4 |
3.98% |
3.72% |
3.39% |
6.61% |
5.07% |
| (5/1/97) |
(5/1/97) |
(8/15/97) |
(8/15/88) |
(4/10/96) |
|
| |
|
| 4 | The Standardized Total Returns are average annual returns as of the most recent calendar quarter-end. They assume reinvestment of all distributions at net asset value. These returns reflect a maximum initial sales charge of 2% for Class A shares, the assumed deferred sales charge for Class B shares (2% maximum declining to 0% after three years) and the assumed deferred sales charge for Class C shares (1% if redeemed within 12 months of purchase). Because Institutional and Service shares do not involve sales charges, such charges have not been applied to their Standardized Total Returns. |
| PORTFOLIO COMPOSITION AS OF 4/30/00 5 | |
| Sector Allocation |
|
| |
|
| Collateralized Mortgage Obligations |
44.8% |
| Fixed Rate Pass-Throughs |
26.1% |
| Adjustable Rate Mortgage Securities |
22.4% |
| Agency Debentures |
4.5% |
| |
|
| 5 | Figures represent a percentage of net assets and may not sum to 100%. The Fund is actively managed and, as such, its composition may differ over time. |
| Total return figures represent past performance and do not indicate future results, which will vary. The investment return and principal value of an investment will fluctuate and, therefore, an investor's shares, when redeemed, may be worth more or less than their original cost. Performance reflects fee waivers and expense limitations in effect. In their absence, performance would be reduced. | |
PERFORMANCE OVERVIE W
Short Duration Government Fund
Dear Shareholder,
We are pleased to report on the performance of the Goldman Sachs Short Duration Government Fund for the six month period that ended April 30, 2000.
Performance Review
Over the six month reporting period that ended April 30, 2000, the Fund's Class A, B, C, Institutional and Service shares generated cumulative total returns, at net asset value, of 1.31%, 0.90%, 0.82%, 1.41% and 1.15%, respectively. Over the same time period the Fund's benchmark, the two-year U.S. Treasury security, generated a 1.33% cumulative total return.
Investment Objective
The Fund seeks a high level of current income and, secondarily, in seeking current income, may also consider the potential for capital appreciation, primarily through investing in U.S. Government securities and repurchase agreements collateralized by such securities.
Portfolio Composition
During the period, we maintained our strategy of focusing on sectors and securities that we believe will generate a competitive total rate of return relative to the benchmark, while deemphasizing directional duration management.
Portfolio Highlights
- Collateralized Mortgage Obligations (CMOs) (41.4% on October 31, 1999 to 44.8% on April 30, 2000) --The Fund's exposure to CMOs rose, due to compelling values in the marketplace.
- Fixed Rate Pass-Throughs (30.2% on October 31, 1999 to 26.1% on April 30, 2000) --The Fund's holding in fixed-rate pass-throughs were reduced in favor of CMOs, to take advantage of relative values.
- Adjustable Rate Mortgage Securities (ARMs) (20.4% on October 31, 1999 to 22.4% on April 30, 2000) --The Fund increased its exposure to ARMs, as a ready supply existed at attractive prices.
- Agency Debentures (6.9% on October 31, 1999 to 4.5% on April 30, 2000) --The Fund shifted its exposure from agency debentures into ARMs based on the prevailing market environment.
PERFORMANCE OVERVIE W
Portfolio Outlook
We continue our favorable outlook on the U.S. fixed income market, although spreads remain vulnerable to technical factors including both Federal Reserve and U.S. Treasury activities. However, we also believe recent spread widening will provide attractive buying opportunities across a variety of fixed income sectors. In particular, we believe the mortgage market currently represents excellent value, and find lower coupons to be particularly attractive.
We thank you for your investment and look forward to your continued confidence.
Goldman Sachs U.S. Fixed Income Investment Management Team
May 9, 2000
FUND BASICS
Government Income Fund
as of April 30, 2000
Assets Under Management
$108.6 Million
NASDAQ SYMBOLS
Class A Shares
GSGOX
Class B Shares
GSOBX
Class C Shares
GSOCX
Institutional Shares
GSOIX
Service Shares
GSOSX
| PERFORMANCE REVIEW | |||
| October 31, 1999- |
Fund Total Return |
30-Day |
Lehman Govt./ |
| April 30, 2000 |
(based on NAV)1 |
Standardized Yield2 |
Mortgage Index3 |
| |
|||
| Class A |
1.65% |
6.05% |
1.80% |
| Class B |
1.20% |
5.58% |
1.80% |
| Class C |
1.20% |
5.58% |
1.80% |
| Institutional |
1.85% |
N/A |
1.80% |
| Service |
1.97% |
N/A |
1.80% |
| |
|
| 1 | The net asset value represents the net assets of the Fund (ex-dividend) divided by the total number of shares outstanding. The Fund's performance reflects the reinvestment of dividends and other distributions. |
| 2 | The 30-Day Standardized Yield of the Fund is calculated by dividing the net investment income per share (as defined by securities industry regulations) earned by the Fund over a 30-day period (ending on the stated month-end date) by the maximum public offering price per share of the Fund on the last day of the period. This number is compounded semiannually and then annualized. This yield does not necessarily reflect income actually earned and distributed by the Fund and, therefore, may not be correlated with the dividends or other distributions paid to shareholders. |
| 3 | The Lehman Brothers Government/Mortgage Index does not reflect any fees or expenses. Investors cannot invest directly in the Index. |
| STANDARDIZED TOTAL RETURNS | |||||
| For the period ending 3/31/00 |
Class A |
Class B |
Class C |
Institutional |
Service |
| |
|||||
| One Year4 |
-3.14% |
-4.42% |
-0.34% |
1.82% |
1.67% |
| Five Years4 |
5.71% |
N/A |
N/A |
N/A |
6.57% |
| Since Inception4 |
5.43% |
4.50% |
4.14% |
5.24% |
6.04% |
| (2/10/93) |
(5/1/96) |
(8/15/97) |
(8/15/97) |
(2/10/93)5 |
|
| |
|
| 4 | The Standardized Total Returns are average annual returns as of the most recent calendar quarter-end. They assume reinvestment of all distributions at net asset value. These returns reflect a maximum initial sales charge of 4.5% for Class A shares, the assumed deferred sales charge for Class B shares (5% maximum declining to 0% after six years), and the assumed deferred sales charge for Class C shares (1% if redeemed within 12 months of purchase).BecauseInstitutional and Service shares do not involve sales charges, such charges have not been applied to their Standardized Total Returns. |
| 5 | Performance data for Service shares prior to 8/15/97 (commencement of operations) is that of Class A shares (excluding the impact of front-end sales charges applicable to Class A shares since Service shares are not subject to any sales charges). Performance of Class Ashares in the Fund reflects the expenses applicable to the Fund's Class A shares. The fees applicable to Service shares are different from those applicable to Class A shares which impact performance ratings and rankings for a class of shares. |
| PORTFOLIO COMPOSITION AS OF 4/30/00 6 | |
| Sector Allocation |
|
| |
|
| Mortgage-Backed Securities |
64.0% |
| Asset-Backed Securities |
15.3% |
| Agency Debentures |
11.2% |
| U.S. Treasuries |
9.3% |
| Cash Equivalents |
6.1% |
| Municipal Bonds |
1.8% |
| |
|
| 6 | Figures represent a percentage of net assets and may not sum to 100% . The Fund is actively managed and, as such, itscomposition may differ over time. |
| Total return figures represent past performance and do not indicate future results, which will vary. The investment return and principal value of an investment will fluctuate and, therefore, an investor's shares, when redeemed, may be worth more or less than their original cost. Performance reflects fee waivers and expense limitations in effect. In their absence, performance would be reduced. | |
PERFORMANCE OVERVIE W
Government Income Fund
Dear Shareholder,
We are pleased to report on the performance of the Goldman Sachs Government Income Fund for the six month period that ended April 30, 2000.
Performance Review
Over the six month reporting period that ended April 30, 2000, the Fund's Class A, B, C, Institutional and Service shares generated cumulative total returns, at net asset value, of 1.65%, 1.20%, 1.20%, 1.85% and 1.97%, respectively. Over the same time period, the Fund's benchmark, the Lehman Government/Mortgage Index, generated a 1.80% cumulative total return.
Investment Objective
The Fund seeks a high level of current income consistent with safety of principal, primarily through investing in U.S. government securities and repurchase agreements collateralized by such securities.
Portfolio Composition
During the period, we maintained our strategy of focusing on sectors and securities that we believe will generate a competitive total rate of return relative to the benchmark, while deemphasizing directional duration management.
Portfolio Highlights
n Mortgage-Backed Securities (MBS) (59.7% on October 31, 1999 to 64.0% on April 30, 2000) - The Fund's position in mortgage-backed securities increased during the reporting period.
n U.S.Treasuries (12.2% on October 31, 1999 to 9.3% on April 30, 2000) - The Fund opportunistically moved out of U.S. Treasuries during the reporting period into higher yielding credit sectors.
n Asset-Backed Securities (ABS) (15.5% on October 31, 1999 to 15.3% on April 30, 2000)
The Fund maintained its exposure to asset-backed securities.
n Agency Debentures (10.7% on October 31, 1999 to 11.2% on April 30, 2000) - The Fund slightly increased its exposure to agency debentures during the reporting period.
PERFORMANCE OVERVIEW
Portfolio Outlook
We continue our favorable outlook on the U.S. fixed income market, although spreads remain vulnerable to technical factors including both Federal Reserve and U.S. Treasury activities. However, we also believe recent spread widening will provide attractive buying opportunities across a variety of fixed income sectors. In particular, we believe the mortgage market currently represents excellent value, and find lower coupons to be particularly attractive.
We thank you for your investment and look forward to your continued confidence.
Goldman Sachs U.S. Fixed Income Investment Management Team
May 9, 2000
FUND BASICS
Core Fixed Income Fund
as of April 30, 2000
Assets Under Management
$331.5 Million
NASDAQ SYMBOLS
Class A Shares
GCFIX
Class B Shares
GCFBX
Class C Shares
GCFCX
Institutional Shares
GSFIX
Service Shares
GSCSX
PERFORMANCE REVIEW
| October 31, 1999-
April 30, 2000 |
Fund Total Return
(based on NAV)1 |
30-Day
Standardized Yield2 |
Lehman Aggregate
Bond Index3 |
| |
|||
| Class A |
1.27% |
6.20% |
1.42% |
| Class B |
1.01% |
5.72% |
1.42% |
| Class C |
1.01% |
5.73% |
1.42% |
| Institutional |
1.48% |
6.90% |
1.42% |
| Service |
1.33% |
6.39% |
1.42% |
| |
|||
| 1 | The net asset value represents the net assets of the Fund (ex-dividend) divided by the total number of shares outstanding. The Fund's performance reflects the reinvestment of dividends and other distributions. |
| 2 | The 30-Day Standardized Yield of the Fund is calculated by dividing the net investment income per share (as defined by securities industry regulations) earned by the Fund over a 30-day period (ending on the stated month-end date) by the maximum public offering price per share of the Fund on the last day of the period. This number is compounded semiannually and then annualized. This yield does not necessarily reflect income actually earned and distributed by the Fund and, therefore, may not be correlated with the dividends or other distributions paid to shareholders. |
| 3 | The Lehman Aggregate Bond Index does not reflect any fees or expenses. Investors cannot invest directly in the Index. |
STANDARDIZED TOTAL RETURNS
| For the period ending 3/31/00 |
Class A |
Class B |
Class C |
Institutional |
Service |
| |
|||||
| One Year4 |
-3.10% |
-4.41% |
-0.33% |
1.83% |
1.22% |
| Five Years4 |
N/A |
N/A |
N/A |
7.05% |
N/A |
| Since Inception4 |
4.07% |
3.86% |
4.06% |
6.03% |
5.62% |
| (5/1/97) |
(5/1/97) |
(8/15/97) |
(1/5/94) |
(3/13/96) |
|
| |
|||||
| 4 | The Standardized Total Returns are average annual returns as of the most recent calendar quarter-end. They assume reinvestment of all distributions at net asset value. These returns reflect a maximum initial sales charge of 4.5% for Class A shares, the assumed deferred sales charge for Class B shares (5% maximum declining to 0% after six years) and the assumed deferred sales charge for Class C shares (1% if redeemed within 12 months of purchase). Because Institutional and Service shares do not involve sales charges, such charges have not been applied to their Standardized Total Returns. |
PORTFOLIO COMPOSITION AS OF 4/30/00 5
| Sector Allocation | ||||
| |
||||
| Mortgage-Backed Securities | 45.5%
|
U.S. Treasuries
|
5.6%
|
|
| Corporate Bonds | 32.8%
|
Emerging Market Debt
|
2.4%
|
|
| Asset-Backed Securities | 11.7%
|
Agency Debentures
|
1.0%
|
|
| Cash Equivalents | 7.6%
|
Sovereign Credit
|
0.9%
|
|
| 5 | Figures represent a percentage of net assets and may not sum to 100%. The Fund is actively managed and, as such, its composition may differ over time. |
| Total return figures represent past performance and do not indicate future results, which will vary. The investment return and principal value of an investment will fluctuate and, therefore, an investor's shares, when redeemed, may be worth more or less than their original cost. Performance reflects expense limitations in effect. In their absence, performance would be reduced. |
PERFORMANCE OVERVIEW
Core Fixed Income Fund
Dear Shareholder,
We are pleased to report on the performance of the Goldman Sachs Core Fixed Income Fund for the six month period that ended April 30, 2000.
Performance Review
Over the six month reporting period that ended April 30, 2000, the Fund's Class A, B, C, Institutional and Service shares generated cumulative total returns, at net asset value, of 1.27%, 1.01%, 1.01%, 1.48% and 1.33% respectively. Over the same time period, the Fund's benchmark, the Lehman Brothers Aggregate Bond Index, generated a cumulative return of 1.42%.
Investment Objective
The Fund seeks total return consisting of capital appreciation and income that exceeds that of the Lehman Brothers Aggregate Bond Index, primarily through fixed income securities, including securities issued or guaranteed by the U.S. government, its agencies, instrumentalities or sponsored enterprises, corporate debt securities, mortgage-backed securities and asset-backed securities.
Portfolio Composition
During the period, we maintained our strategy of focusing on sectors and securities that we believe will generate a competitive total rate of return relative to the benchmark, while de-emphasizing directional duration management. Therefore, during the period under review, we underweighted Treasury and agency securities relative to the benchmark, and overweighted corporate, mortgage- and asset-backed and emerging market debt securities.
Portfolio Highlights
- Mortgage-Backed Securities (MBS) (42.6% on October 31, 1999 to 45.5% on April 30, 2000) -- The Fund's exposure to mortgage-backed securities slightly increased during the reporting period.
- Corporate Bonds (35.0% on October 31, 1999 to 32.8% on April 30, 2000) -- Generally speaking, corporate bonds underperformed during the period, with the inversion of the yield curve being the primary driver behind widening spreads at the long end of the corporate curve.
- Asset-Backed Securities (ABS) (9.6% on October 31, 1999 to 11.7% on April 30, 2000) -- ABS spreads widened in recent months. However, late in the reporting period spreads solidified, due to narrowing swap spreads and light primary issuance.
- U.S.Treasuries (4.2% on October 31, 1999 to 5.6% on April 30, 2000) -- Appreciation in the Fund's U.S. Treasury security holdings were largely responsible for its increased weighting in the portfolio.
PERFORMANCE OVERVIEW
Portfolio Outlook
We continue our favorable outlook on the U.S. fixed income market, although spreads remain vulnerable to technical factors including both Federal Reserve and U.S. Treasury activities. However, we also believe recent spread widening will provide attractive buying opportunities across a variety of fixed income sectors. In particular, we believe the mortgage market currently represents excellent value, and find lower coupons to be particularly attractive. In addition, our outlook within emerging markets remains positive, as fundamentals, growth prospects and capital flows remain supportive for the market.
We thank you for your investment and look forward to your continued confidence.
Goldman Sachs U.S. Fixed Income Investment Management Team
May 9, 2000
FUND BASICS
Global Income Fund
as of April 30, 2000
Assets Under Management
$571.4 Million
NASDAQ SYMBOLS
Class A Shares
GSGIX
Class B Shares
GSLBX
Class C Shares
GSLCX
Institutional Shares
GSGLX
Service Shares
GGISX
PERFORMANCE REVIEW
| October 31, 1999-- |
Fund Total Return |
30-Day |
JPM Global Govt. |
| April 30, 2000 |
(based on NAV)1 |
Standardized Yield2 |
Bond Index3 |
| |
|||
| Class A |
2.16% |
3.81% |
3.38% |
| Class B |
1.92% |
3.49% |
3.38% |
| Class C |
1.91% |
3.49% |
3.38% |
| Institutional |
2.43% |
4.65% |
3.38% |
| Service |
2.18% |
4.15% |
3.38% |
| |
|||
1 The net asset value represents the net assets of the Fund (ex-dividend) divided by the total number of shares outstanding. The Fund's performance reflects the reinvestment of dividends and other distributions.
2 The 30-Day Standardized Yield of the Fund is calculated by dividing the net investment income per share (as defined by securities industry regulations) earned by the Fund over a 30-day period (ending on the stated month-end date) by the maximum public offering price per share of the Fund on the last day of the period. This number is compounded semiannually and then annualized. This yield does not necessarily reflect income actually earned and distributed by the Fund and, therefore, may not be correlated with the dividends or other distributions paid to shareholders.
3 The composition and characteristics of the securities in the JP Morgan (JPM) Global Government Bond Index (hedged) are not identical to those of the Fund. Also, unlike the Fund's return, the Index's return does not reflect any fees or expenses. Investors cannot invest directly in the Index.
STANDARDIZED TOTAL RETURNS
| For the period ending 3/31/00 |
Class A |
Class B |
Class C |
Institutional |
Service |
| |
|||||
| One Year4 |
-4.30% |
-5.23% |
-1.20% |
0.88% |
0.31% |
| Five Years4 |
7.23% |
N/A |
N/A |
N/A |
8.29% |
| Since Inception4 |
6.77% |
5.83% |
5.26% |
8.55% |
7.39% |
| (8/2/91) |
(5/1/96) |
(8/15/97) |
(8/1/95) |
(8/2/91)5 |
|
| |
|||||
| 4 | The Standardized Total Returns are average annual returns as of the most recent calendar quarter-end. They assume reinvestment of all distributions at net asset value. These returns reflect a maximum initial sales charge of 4.5% for Class A shares, the assumed deferred sales charge for Class B shares (5% maximum declining to 0% after six years), and the assumed deferred sales charge for Class C shares (1% if redeemed within 12 months of purchase).Because Institutional and Service shares do not involve sales charges, such charges have not been applied to their Standardized Total Returns. |
| 5 | Performance data for Service shares prior to 3/12/97 (commencement of operations) is that of Class A shares (excluding the impact of front-end sales charges applicable to Class A shares since Service shares are not subject to any sales charges). Performance of Class A shares in the Fund reflects the expenses applicable to the Fund's Class A shares. The fees applicable to Service shares are different from those applicable to Class A shares which impact performance ratings and rankings for a class of shares. |
TOP POSITIONS AS OF 4/30/00 6
| Bonds Denomination |
Bonds Denomination |
|||
| |
||||
| 1. U.S. Dollar |
37.4% |
6. Canadian Dollar |
2.0% |
|
| 2. Euro Currency |
22.2% |
7. Swedish Krona |
1.8% |
|
| 3. Japanese Yen |
17.5% |
8. South African Rand |
1.7% |
|
| 4. British Pound |
10.7% |
9. Danish Krone |
1.6% |
|
| 5. U.S. Dollar Cash Equivalents |
2.7% |
10. German Mark |
1.5% |
|
| 6 | Figures represent a percentage of net assets and may not sum to 100%. The Fund is actively managed and, as such, its composition may differ over time. |
| Total return figures represent past performance and do not indicate future results, which will vary. The investment return and principal value of an investment will fluctuate and, therefore, an investor's shares, when redeemed, may be worth more or less than their original cost. Performance reflects fee waivers and expense limitations in effect. In their absence performance would be reduced. |
PERFORMANCE OVERVIEW
Global Income Fund
Dear Shareholder,
We are pleased to report on the performance of the Goldman Sachs Global Income Fund for the six month period that ended April 30, 2000.
Performance Review
Over the six month reporting period that ended April 30, 2000, the Fund's Class A, B, C, Institutional and Service shares generated cumulative total returns, at net asset value, of 2.16%, 1.92%, 1.91%, 2.43% and 2.18%, respectively. Over the same time period, the Fund's benchmark, the JP Morgan Global Government Bond Index (hedged into U.S. dollars), generated a 3.38% cumulative total return.
The Fund's underperformance versus its benchmark is attributable to several factors. In recent months, the exposure to credit in the portfolio had an offsetting negative impact, due to a widening of swap spreads in the U.S. Currency management also has a negative impact on overall performance, caused mainly by the fall in the Australian dollar.
Investment Objective
The Fund seeks high total return, emphasizing current income and, to a lesser extent, providing opportunities for capital appreciation primarily through investments in fixed income securities of U.S. and foreign issuers and through transactions in foreign currencies.
Portfolio Positioning
The Fund began the reporting period with an overweight exposure in the U.S., as a slowing of economic growth rates was anticipated. However, we scaled back to a neutral position, based on continued robust economic expansion, and the near certainty that the Federal Reserve will continue raising interest rates to ward off inflation. The Fund also moved to an underweight position in Canadian bonds, following a period of significant outperformance relative to the U.S.
During the first quarter of the year, a position in the 2-3 year area of the UK yield curve was introduced. This was based on the belief that UK economy has entered the advance stages of its economic upturn. Recent economic data has demonstrated that aggressive tightening by the Monetary Policy Committee is starting to have an effect on the manufacturing and retail sectors. In addition, with sterling remaining strong, it's believed that the short end of the UK yield curve offers attractive values.
In terms of currency, we have recently implemented a short yen position, as we feel that much of the Japanese recovery story has been priced into the market. In addition, we believe that equity flows will be less supportive for the yen going forward. Exposure to the British pound was also taken against the U.S, dollar and euro.
PERFORMANCE OVERVIE W
Portfolio Outlook
We currently favor the U.S. and European bond markets over the Japanese counterparts. In the U.S., the recent emergence of inflationary pressures have resulted in a sharp sell off in the bond market, with a further 100 basis points of tightening now fully discounted. In our view these rate hikes, combined with the previous 125 basis points of tightening, will slow the economy and more importantly keep inflationary pressures in check. Similarly in Europe, the prospective rate hikes now priced into the bond market should ensure that the ECB keeps inflation below their ceiling of 2%. This could enable bonds to stage a moderate rally through to year-end.
Japan continues to grow at a steady but unspectacular pace, which nevertheless should provide the Bank of Japan with the ability to raise rates moderately before year end, thereby bringing an end to the zero rate policy. This is currently not fully discounted by the market and we would anticipate a modest sell-off in the Japanese bond market.
In terms of currencies, we maintain a positive view on the U.S. dollar versus the yen, euro and the pound. This is largely due to interest rate differentials. In addition, with respect to the yen, recent data has shown limited signs of a sustainable recovery in the economy. This, coupled with foreign investors reducing equity weights, leads us to believe that the yen will remain under pressure. Finally, we expect the drivers for the weak euro to remain. These include equity outflows from U.S. investors and continued purchase of U.S. assets from Europe.
We thank you for your investment and look forward to your continued confidence.
Goldman Sachs Global Fixed Income Investment Management Team
May 9, 2000
GOLDMAN SACHS TAXABLE INVESTMENT GRADE FUNDS
The Goldman Sachs Advantage
Founded in 1869, Goldman, Sachs & Co. is a premier financial services firm traditionally known on Wall Street and around the world for its institutional expertise.
Today, the firm's Investment Management Division provides individual investors the opportunity to tap the resources of a global institutional powerhouse -- and put this expertise to work in their individual portfolios.
What Sets Goldman Sachs Funds Apart?
2
In-Depth Research
Our portfolio management teams make on-site
visits to hundreds of companies eachmonth, then construct selective
portfolios with an emphasis on their best ideas. Our teams also have access
to Goldman, Sachs & Co.'s Global Investment
ResearchDepartment.
Risk Management
In this, our institutional heritage is
clear. Institutions, as well as many individual investors, often look to us
to manage the risks of global investing over time in different market
environments.
To learn more about the Goldman Sachs Funds, call your investment professional today.
| The following
graph shows the value as of April 30, 2000, of a $10,000 investment made
on August 1, 1991 in the Institutional shares of the Adjustable Rate
Government Fund. For comparative purposes, the performance of the
Fund’s benchmarks, the six-month and one-year U.S. Treasury Bills
(“Six-Month T-Bill/One-Year T-Bill”), as well as the Lehman
Brothers Mutual Fund Short (1-2) U.S. Government Index (“Lehman 1-2
Index”), are shown. This performance data represents past
performance and should not be considered indicative of future performance
which will fluctuate with changes in market conditions. These performance
fluctuations will cause an investor’s shares, when redeemed, to be
worth more or less than their original cost. Performance of Class A and
Service shares will vary from Institutional shares due to differences in
fees and loads.
|
| Adjustable Rate
Government Fund’s Lifetime Performance
|
| Growth of a $10,000
Investment, Distributions Reinvested August 1, 1991 to April 30,
2000.
(a)
|
| |
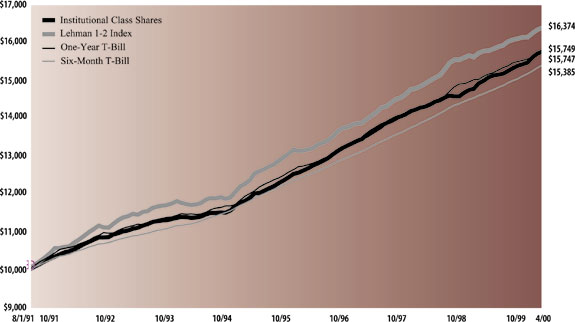
| Average Annual Total Return through April 30, 2000 | Since Inception | Five Years | One Year | Six Months (b) | |||||
|---|---|---|---|---|---|---|---|---|---|
| Class A shares (commenced May 15, 1995) | |||||||||
| Excluding sales charges | 5.41% | n/a | 4.71% | 2.70% | |||||
| Including sales charges | 5.09% | n/a | 3.11% | 1.13% | |||||
| Institutional shares (commenced July 17, 1991) | 5.34% | 5.79% | 5.12% | 2.90% | |||||
| Service shares (commenced March 27, 1997) | 4.70% | n/a | 4.43% | 2.48% | |||||
(a)
|
For comparative
purposes, initial investments are assumed to be made on the first day of
the month following commencement of operations.
|
(b)
|
Not
annualized.
|
| Principal
Amount |
Interest
Rate |
Maturity
Date |
Value | |||||
|---|---|---|---|---|---|---|---|---|
| Mortgage Backed Obligations – 88.3% | ||||||||
| Adjustable Rate Federal
Home Loan Mortgage Corp.
(FHLMC)# – 29.8% |
||||||||
| $ 1,330,467 | 6.90 | % | 07/01/2018 | $ 1,376,820 | ||||
| 2,918,220 | 7.55 | 11/01/2018 | 2,930,068 | |||||
| 661,170 | 7.05 | 12/01/2018 | 681,422 | |||||
| 3,915,446 | 7.25 | 05/01/2019 | 4,009,652 | |||||
| 7,181,089 | 7.35 | 11/01/2019 | 7,359,467 | |||||
| 5,890,329 | 6.90 | 01/01/2020 | 6,058,734 | |||||
| 2,162,478 | 7.21 | 05/01/2020 | 2,245,604 | |||||
| 11,663,574 | 7.10 | 06/01/2020 | 11,805,753 | |||||
| 17,043,970 | 7.35 | 02/01/2022 | 17,374,282 | |||||
| 3,315,611 | 6.98 | 06/01/2022 | 3,372,441 | |||||
| 1,910,245 | 7.22 | 08/01/2022 | 1,965,470 | |||||
| 3,113,367 | 6.91 | 09/01/2022 | 3,225,261 | |||||
| 2,545,096 | 7.00 | 09/01/2022 | 2,591,010 | |||||
| 4,376,846 | 7.29 | 06/01/2024 | 4,543,735 | |||||
| 1,578,658 | 7.41 | 02/01/2028 | 1,619,119 | |||||
| 2,700,658 | 7.21 | 07/01/2030 | 2,793,911 | |||||
| $73,952,749 | ||||||||
| Adjustable Rate Federal
National Mortgage Association
(FNMA)# – 38.7% |
||||||||
| $ 683,484 | 7.29 | % | 04/01/2003 | $ 674,517 | ||||
| 538,337 | 7.02 | 11/01/2014 | 549,663 | |||||
| 3,118,305 | 6.23 | 03/01/2017 | 3,163,147 | |||||
| 1,707,939 | 7.20 | 03/01/2017 | 1,769,322 | |||||
| 6,653,421 | 6.93 | 04/01/2017 | 6,592,343 | |||||
| 321,921 | 7.19 | 11/01/2017 | 333,089 | |||||
| 2,397,392 | 6.20 | 03/01/2018 | 2,391,997 | |||||
| 572,928 | 6.80 | 03/01/2018 | 578,835 | |||||
| 489,434 | 7.18 | 05/01/2018 | 501,136 | |||||
| 4,472,131 | 7.34 | 06/01/2018 | 4,586,080 | |||||
| 1,945,775 | 7.48 | 08/01/2018 | 2,003,408 | |||||
| 981,613 | 6.78 | 10/01/2018 | 1,004,161 | |||||
| 3,059,433 | 6.75 | 11/01/2018 | 3,148,340 | |||||
| 92,151 | 6.79 | 11/01/2018 | 94,440 | |||||
| 1,626,580 | 6.96 | 06/01/2019 | 1,651,629 | |||||
| 2,011,779 | 7.67 | 07/01/2019 | 2,076,840 | |||||
| 850,752 | 7.07 | 08/01/2019 | 866,567 | |||||
| 9,784,203 | 7.44 | 05/01/2020 | 10,006,598 | |||||
| 4,661,084 | 7.30 | 07/01/2020 | 4,818,396 | |||||
| 4,930,971 | 5.81 | 12/25/2020 | 4,905,774 | |||||
| 2,704,546 | 7.24 | 01/01/2021 | 2,797,934 | |||||
| 22,296,593 | 7.24 | 09/01/2021 | 23,157,018 | |||||
| 188,540 | 7.60 | 01/01/2022 | 190,190 | |||||
| 1,112,089 | 6.73 | 05/20/2022 | 1,120,674 | |||||
| 839,210 | 7.45 | 08/01/2022 | 872,384 | |||||
| 2,979,344 | 7.75 | 02/01/2023 | 3,088,268 | |||||
| 133,335 | 6.23 | 12/01/2023 | 129,919 | |||||
| 7,537,347 | 6.44 | 06/20/2024 | 7,650,106 | |||||
| 3,146,340 | 7.02 | 08/01/2027 | 3,231,889 | |||||
| 1,240,006 | 6.98 | 10/01/2027 | 1,261,223 | |||||
| 572,876 | 7.86 | 01/01/2028 | 578,336 | |||||
| $95,794,223 | ||||||||
| Principal
Amount |
Interest
Rate |
Maturity
Date |
Value | |||||
|---|---|---|---|---|---|---|---|---|
| Mortgage Backed Obligations – (continued) | ||||||||
| Adjustable Rate
Government National Mortgage Association
(GNMA)# – 3.8% |
||||||||
| $ 1,730,566 | 6.38 | % | 03/20/2016 | $ 1,749,499 | ||||
| 2,696,772 | 6.75 | 08/20/2018 | 2,729,214 | |||||
| 3,212,568 | 6.38 | 02/20/2021 | 3,244,694 | |||||
| 1,597,172 | 6.38 | 06/20/2022 | 1,610,157 | |||||
| $ 9,333,564 | ||||||||
| Federal Home Loan Mortgage Corp. (FHLMC) – 3.7% | ||||||||
| $ 1,710,146 | 6.50 | % | 03/01/2013 | $ 1,637,995 | ||||
| 3,467,203 | 6.50 | 04/01/2013 | 3,321,997 | |||||
| 1,453,547 | 6.50 | 05/01/2013 | 1,392,222 | |||||
| 2,837,718 | 6.50 | 06/01/2013 | 2,718,931 | |||||
| $ 9,071,145 | ||||||||
| Federal National Mortgage Association (FNMA) – 1.6% | ||||||||
| $ 4,016,196 | 8.00 | % | 11/01/2017 | $ 4,037,522 | ||||
| Government National Mortgage Association (GNMA) – 1.3% | ||||||||
| $ 3,497,622 | 6.50 | % | 08/15/2027 | $ 3,286,680 | ||||
| Collateralized Mortgage Obligations – 9.4% | ||||||||
| Inverse Floater# – 1.5% | ||||||||
| FNMA Series 1993-189, Class SA | ||||||||
| $ 3,826,191 | 9.75 | % | 10/25/2023 | $ 3,834,417 | ||||
| IOette·# – 0.1% | ||||||||
| FNMA Remic Trust Series 1990-145, Class B | ||||||||
| $ 12,117 | 35.00 | % | 12/25/2020 | $ 301,991 | ||||
| Regular Floater CMOs# – 2.5% | ||||||||
| FNMA Series 1998-66, Class FC | ||||||||
| $ 6,359,917 | 6.54 | % | 11/17/2028 | $ 6,192,270 | ||||
| Sequential Fixed Rate CMOs – 5.3% | ||||||||
| FHLMC Series 1169, Class D | ||||||||
| $ 179,733 | 7.00 | % | 05/15/2021 | $ 179,284 | ||||
| FNMA Remic Trust Series 1993-14, Class A | ||||||||
| 2,462,608 | 6.00 | 02/25/2008 | 2,397,570 | |||||
| FNMA Remic Trust Series 1993-144, Class B | ||||||||
| 1,468,736 | 9.00 | 11/25/2017 | 1,466,577 | |||||
| FNMA Remic Trust Series G93-39, Class A | ||||||||
| 1,912,465 | 5.70 | 08/25/2016 | 1,885,978 | |||||
| FNMA Remic Trust Series G97-4, Class C | ||||||||
| 5,405,648 | 7.50 | 06/17/2024 | 5,403,648 | |||||
| FNMA Series 1996-22, Class B | ||||||||
| 1,681,093 | 7.25 | 02/25/2024 | 1,676,891 | |||||
| $ 13,009,948 | ||||||||
| TOTAL COLLATERALIZED
MORTGAGE OBLIGATIONS |
$ 23,338,626 | |||||||
| TOTAL MORTGAGE BACKED
OBLIGATIONS |
||||||||
| (Cost $222,378,606) | $218,814,509 | |||||||
| Principal
Amount |
Interest
Rate |
Maturity
Date |
Value | |||||
|---|---|---|---|---|---|---|---|---|
| Repurchase Agreement – 9.0% | ||||||||
| Joint Repurchase Agreement Account Ù | ||||||||
| $22,200,000 | 5.85 | % | 05/01/2000 | $ 22,200,000 | ||||
| TOTAL REPURCHASE AGREEMENT | ||||||||
| (Cost $22,200,000) | $ 22,200,000 | |||||||
| TOTAL INVESTMENTS | ||||||||
| (Cost $244,578,606) | $241,014,509 | |||||||
#
|
Variable rate
security. Coupon rate disclosed is that which is in effect at April 30,
2000.
|
Ù
|
A portion of this security is segregated as collateral for initial
margin requirement on futures transactions.
|
Ÿ
|
Represents
security with notional or nominal principal amount. The actual effective
yield of this security is different than the stated coupon due to the
amortization of related premiums.
|
| The percentage
shown for each investment category reflects the value of investments in
that category as a percentage of total net assets.
|
| The following
graph shows the value as of April 30, 2000, of a $10,000 investment made
on September 1, 1988 in the Institutional shares of the Goldman Sachs
Short Duration Government Fund. For comparative purposes, the performance
of the Fund’s benchmark (the U.S. 2-Year Treasury Bill
(“Two-Year T-Bill”)), as well as the Lehman Brothers Mutual
Fund Short (1-3) U.S. Government Index (“Lehman Short (1-3)
Gov’t Index”), are shown. This performance data represents past
performance and should not be considered indicative of future performance
which will fluctuate with changes in market conditions. These performance
fluctuations will cause an investor’s shares, when redeemed, to be
worth more or less than their original cost. Performance of Class A,
Class B, Class C and Service shares will vary from Institutional shares
due to differences in fees and loads.
|
| Short Duration
Government Fund’s Lifetime Performance
|
| Growth of a $10,000
Investment, Distributions Reinvested September 1, 1988 to April 30,
2000.(a)
|
| |
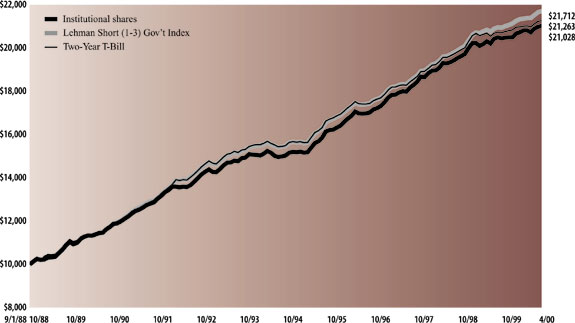
| Average Annual Total Return through April 30, 2000 | Since Inception | Ten Years | Five Years | One Year | Six Months (b) | ||||||
|---|---|---|---|---|---|---|---|---|---|---|---|
| Class A shares (commenced May 1, 1997) | |||||||||||
| Excluding sales charges | 4.59% | n/a | n/a | 2.29% | 1.31% | ||||||
| Including sales charges | 3.89% | n/a | n/a | 0.23% | -0.76% | ||||||
| Class B shares (commenced May 1, 1997) | |||||||||||
| Excluding contingent deferred sales charges | 4.00% | n/a | n/a | 1.56% | 0.90% | ||||||
| Including contingent deferred sales charges | 3.65% | n/a | n/a | -0.46% | -1.12% | ||||||
| Class C shares (commenced August 15, 1997) | |||||||||||
| Excluding contingent deferred sales charges | 3.28% | n/a | n/a | 1.41% | 0.82% | ||||||
| Including contingent deferred sales charges | 3.28% | n/a | n/a | 0.40% | -0.19% | ||||||
| Institutional shares (commenced August 15, 1988) | 6.58% | 6.25% | 5.80% | 2.59% | 1.41% | ||||||
| Service shares (commenced April 10, 1996) | 4.97% | n/a | n/a | 2.07% | 1.15% | ||||||
(a)
|
For comparative
purposes, initial investments are assumed to be made on the first day of
the month following commencement of operations.
|
(b)
|
Not
annualized.
|
| Principal
Amount |
Interest
Rate |
Maturity
Date |
Value | |||||
|---|---|---|---|---|---|---|---|---|
| Mortgage Backed Obligations – 93.3% | ||||||||
| Adjustable Rate Federal
Home Loan Mortgage Corp.
(FHLMC)# – 5.6% |
||||||||
| $ 841,662 | 6.50 | % | 08/01/2017 | $ 861,912 | ||||
| 827,776 | 7.37 | 05/01/2018 | 818,042 | |||||
| 2,455,704 | 7.32 | 06/01/2018 | 2,512,823 | |||||
| 889,523 | 7.05 | 12/01/2018 | 916,769 | |||||
| 3,846,140 | 7.35 | 02/01/2022 | 3,920,678 | |||||
| 1,103,309 | 7.70 | 10/01/2025 | 1,105,295 | |||||
| $ 10,135,519 | ||||||||
| Adjustable Rate Federal
National Mortgage
Association (FNMA)# – 16.8% |
||||||||
| $ 1,292,008 | 7.02 | % | 11/01/2014 | $ 1,319,192 | ||||
| 2,159,359 | 7.01 | 11/01/2017 | 2,182,464 | |||||
| 2,472,773 | 7.38 | 02/01/2018 | 2,484,370 | |||||
| 2,292,972 | 6.91 | 06/01/2018 | 2,297,329 | |||||
| 2,143,362 | 7.25 | 03/01/2019 | 2,185,350 | |||||
| 4,852,476 | 7.44 | 05/01/2020 | 4,962,773 | |||||
| 3,044,680 | 7.04 | 12/01/2020 | 3,088,249 | |||||
| 3,245,455 | 7.24 | 01/01/2021 | 3,357,520 | |||||
| 839,210 | 7.45 | 08/01/2022 | 872,384 | |||||
| 2,464,552 | 7.93 | 01/01/2023 | 2,502,678 | |||||
| 3,157,057 | 6.64 | 07/01/2028 | 3,234,026 | |||||
| 1,666,796 | 7.28 | 01/01/2031 | 1,731,901 | |||||
| $ 30,218,236 | ||||||||
| Federal Home Loan Mortgage Corp. (FHLMC) – 5.6% | ||||||||
| $ 3,267,196 | 6.50 | % | 01/01/2013 | $ 3,126,282 | ||||
| 854,863 | 6.50 | 04/01/2013 | 820,668 | |||||
| 1,795,454 | 6.50 | 05/01/2013 | 1,719,835 | |||||
| 816,105 | 6.50 | 06/01/2013 | 780,907 | |||||
| 2,494,906 | 6.00 | 11/01/2028 | 2,261,008 | |||||
| 350,464 | 6.00 | 07/01/2029 | 317,496 | |||||
| 1,000,000 | 6.50 | TBA-30 yr® | 936,870 | |||||
| $ 9,963,066 | ||||||||
| Federal National Mortgage Association (FNMA) – 13.5% | ||||||||
| $ 887,840 | 8.50 | % | 05/01/2010 | $ 902,543 | ||||
| 28,767 | 6.00 | 08/01/2010 | 27,336 | |||||
| 28,410 | 6.00 | 11/01/2010 | 26,865 | |||||
| 89,645 | 6.00 | 01/01/2011 | 84,770 | |||||
| 130,413 | 6.00 | 02/01/2011 | 123,321 | |||||
| 4,272,499 | 6.00 | 03/01/2011 | 4,040,160 | |||||
| 1,764,528 | 6.00 | 04/01/2011 | 1,668,573 | |||||
| 1,985,338 | 6.00 | 05/01/2011 | 1,877,376 | |||||
| 295,927 | 6.00 | 06/01/2011 | 279,834 | |||||
| 217,687 | 6.00 | 07/01/2011 | 205,849 | |||||
| 584,785 | 6.00 | 09/01/2011 | 552,985 | |||||
| 52,644 | 6.00 | 12/01/2011 | 49,782 | |||||
| 58,448 | 6.00 | 01/01/2012 | 55,099 | |||||
| 327,768 | 6.00 | 03/01/2012 | 308,987 | |||||
| 243,816 | 6.00 | 04/01/2013 | 229,846 | |||||
| 311,687 | 6.00 | 11/01/2013 | 293,827 | |||||
| 527,510 | 6.00 | 01/01/2014 | 486,464 | |||||
| 1,855,697Ù | 6.00 | 03/01/2014 | 1,681,725 | |||||
| 1,899,150 | 6.50 | 12/01/2028 | 1,773,939 | |||||
| Principal
Amount |
Interest
Rate |
Maturity
Date |
Value | |||||
|---|---|---|---|---|---|---|---|---|
| Mortgage Backed Obligations – (continued) | ||||||||
| Federal National Mortgage Association (FNMA) – (continued) | ||||||||
| $ 189,169 | 6.50 | % | 01/01/2029 | $ 176,697 | ||||
| 551,347 | 6.00 | 04/01/2029 | 499,140 | |||||
| 903,375 | 6.50 | 04/01/2029 | 843,815 | |||||
| 5,284,389 | 6.50 | 06/01/2029 | 4,935,989 | |||||
| 668,150 | 6.50 | 07/01/2029 | 623,464 | |||||
| 1,364,302 | 6.50 | 08/01/2029 | 1,273,058 | |||||
| 535,903 | 6.50 | 09/01/2029 | 500,062 | |||||
| 235,855 | 6.50 | 12/01/2029 | 220,305 | |||||
| 500,000 | 6.50 | TBA-30 yr® | 466,560 | |||||
| $ 24,208,371 | ||||||||
| Government National Mortgage Association (GNMA) – 7.0% | ||||||||
| $ 968,055 | 6.50 | % | 06/15/2008 | $ 941,782 | ||||
| 555,921 | 6.50 | 07/15/2008 | 540,566 | |||||
| 1,752,810 | 6.50 | 08/15/2008 | 1,704,784 | |||||
| 1,030,356 | 6.50 | 09/15/2008 | 1,002,059 | |||||
| 167,482 | 6.50 | 10/15/2008 | 162,409 | |||||
| 50,101 | 6.50 | 11/15/2008 | 48,583 | |||||
| 129,429 | 9.00 | 12/15/2008 | 133,345 | |||||
| 83,703 | 6.50 | 01/15/2009 | 81,168 | |||||
| 155,727 | 9.00 | 01/15/2009 | 160,438 | |||||
| 14,452 | 6.50 | 03/15/2009 | 14,014 | |||||
| 65,724 | 6.50 | 04/15/2009 | 63,733 | |||||
| 765,042 | 6.50 | 05/15/2009 | 741,869 | |||||
| 73,314 | 6.50 | 07/15/2009 | 71,093 | |||||
| 78,280 | 6.50 | 11/15/2009 | 75,662 | |||||
| 61,193 | 9.00 | 01/15/2010 | 63,229 | |||||
| 495,108 | 9.00 | 07/15/2012 | 508,817 | |||||
| 213,643 | 6.50 | 10/15/2023 | 201,559 | |||||
| 3,736,714 | 7.00 | 10/15/2023 | 3,610,600 | |||||
| 217,520 | 6.50 | 12/15/2023 | 205,217 | |||||
| 554,531 | 6.50 | 04/15/2024 | 522,646 | |||||
| 1,748,811 | 6.50 | 08/15/2027 | 1,643,340 | |||||
| $ 12,496,913 | ||||||||
| Collateralized Mortgage Obligations – 44.8% | ||||||||
| Inverse Floater# – 2.1% | ||||||||
| FNMA Remic Trust Series 1990-134, Class SC | ||||||||
| $ 818,647 | 12.37 | % | 11/25/2020 | $ 828,422 | ||||
| FNMA Remic Trust Series 1991-42, Class S | ||||||||
| 360,298 | 6.90 | 05/25/2021 | 318,143 | |||||
| FNMA Remic Trust Series 1993-164, Class SD | ||||||||
| 1,500,000 | 5.58 | 09/25/2008 | 1,279,305 | |||||
| FNMA Remic Trust Series 1993-231, Class SA | ||||||||
| 1,668,369 | 4.13 | 12/25/2008 | 1,414,593 | |||||
| $ 3,840,463 | ||||||||
| Inverse Floating Rate – Interest Only #· – 0.0% | ||||||||
| FHLMC Series 1684, Class JD | ||||||||
| $ 1,013,814 | 3.53 | % | 08/15/2020 | $ 27,109 | ||||
| FNMA Remic Trust Series 1993-110, Class SC | ||||||||
| 145,353 | 3.33 | 04/25/2019 | 1,002 | |||||
| $ 28,111 | ||||||||
| Principal
Amount |
Interest
Rate |
Maturity
Date |
Value | |||||
|---|---|---|---|---|---|---|---|---|
| Mortgage Backed Obligations – (continued) | ||||||||
| IOette·# – 0.4% | ||||||||
| FHLMC Series 1161, Class U | ||||||||
| $ 20,214 | 9.50 | % | 11/15/2021 | $ 647,852 | ||||
| Planned Amortization Class (PAC) CMOs – 14.4% | ||||||||
| FHLMC Series 1556, Class G | ||||||||
| $ 2,000,000 | 6.35 | % | 10/15/2010 | $ 1,968,120 | ||||
| FHLMC Series 1916, Class PC | ||||||||
| 3,700,000 | 6.75 | 12/15/2011 | 3,521,401 | |||||
| FHLMC Series 1987, Class L | ||||||||
| 4,000,000 | 6.20 | 08/25/2022 | 3,755,200 | |||||
| FHLMC Series 2055, Class OD | ||||||||
| 3,000,000 | 6.00 | 01/15/2012 | 2,780,610 | |||||
| FHLMC Series 2130, Class QY | ||||||||
| 2,810,256 | 8.50 | 02/15/2019 | 2,850,442 | |||||
| FHLMC Series 2149, Class TF | ||||||||
| 1,500,000 | 6.50 | 05/15/2024 | 1,424,850 | |||||
| FNMA Remic Trust Series 1997-84, Class PA | ||||||||
| 4,000,000 | 5.90 | 11/25/2021 | 3,746,240 | |||||
| FNMA Remic Trust Series G93-31, Class PJ | ||||||||
| 3,000,000 | 6.55 | 10/25/2020 | 2,908,770 | |||||
| FNMA Series G93-32, Class PH | ||||||||
| 3,000,000 | 6.50 | 11/25/2022 | 2,900,700 | |||||
| $ 25,856,333 | ||||||||
| Planned Amortization – Interest Only· – 0.2% | ||||||||
| FHLMC Series 1587, Class HA | ||||||||
| $ 3,098,522 | 6.50 | % | 10/15/2008 | $ 282,988 | ||||
| Principal Only° – 1.3% | ||||||||
| FNMA Remic Trust Series G92-28, Class A | ||||||||
| $ 2,807,682 | 8.12 | % | 05/25/2007 | $ 2,385,800 | ||||
| Regular Floater CMOs# – 0.6% | ||||||||
| FHLMC Series 1684, Class JC | ||||||||
| $ 975,275 | 5.47 | % | 08/15/2020 | $ 961,553 | ||||
| FNMA Remic Trust Series 1993-110, Class FC | ||||||||
| 145,353 | 5.67 | 04/25/2019 | 144,535 | |||||
| $ 1,106,088 | ||||||||
| Sequential Fixed Rate CMOs – 22.6% | ||||||||
| FHLMC Series 1033, Class G | ||||||||
| $ 1,022,355 | 8.00 | % | 01/15/2006 | $ 1,025,545 | ||||
| FHLMC Series 1468, Class ZB | ||||||||
| 5,189,940 | 9.00 | 02/15/2021 | 5,313,980 | |||||
| FHLMC Series 1812, Class D | ||||||||
| 1,015,101 | 6.00 | 07/15/2008 | 1,001,925 | |||||
| FHLMC Series 1998, Class DB | ||||||||
| 2,524,271 | 9.50 | 01/17/2025 | 2,584,955 | |||||
| FHLMC Series 2152, Class AB | ||||||||
| 2,885,095 | 6.25 | 01/15/2026 | 2,723,241 | |||||
| FNMA Remic Trust Series 1960-16, Class E | ||||||||
| 6,056,201 | 9.00 | 03/25/2020 | 6,292,998 | |||||
| FNMA Remic Trust Series 1989-74, Class J | ||||||||
| 1,449,798 | 9.80 | 10/25/2019 | 1,530,552 | |||||
| FNMA Remic Trust Series 1992-119, Class Z | ||||||||
| 3,710,214 | 8.00 | 07/25/2022 | 3,704,055 | |||||
| Principal
Amount |
Interest
Rate |
Maturity
Date |
Value | |||||
|---|---|---|---|---|---|---|---|---|
| Mortgage Backed Obligations – (continued) | ||||||||
| Sequential Fixed Rate CMOs – (continued) | ||||||||
| FNMA Remic Trust Series 1993-33, Class ZA | ||||||||
| $ 6,962,814 | 7.50 | % | 09/25/2021 | $ 6,869,930 | ||||
| FNMA Remic Trust Series G97-4, Class C | ||||||||
| 6,290,823 | 7.50 | 06/17/2024 | 6,288,495 | |||||
| FNMA Series 1988-12, Class A | ||||||||
| 1,883,103 | 10.00 | 02/25/2018 | 1,979,701 | |||||
| GNMA Remic Trust Series 1995-3, Class DQ | ||||||||
| 1,175,350 | 8.05 | 06/16/2025 | 1,186,104 | |||||
| $ 40,501,481 | ||||||||
| Super Floater# – 0.8% | ||||||||
| FNMA Remic Trust Series 88-12, Class B | ||||||||
| $ 1,486,660 | 3.77 | % | 02/25/2018 | $ 1,428,572 | ||||
| Support – 1.0% | ||||||||
| FHLMC Series 16, Class M | ||||||||
| $ 2,000,000 | 7.00 | % | 08/25/2023 | $ 1,841,240 | ||||
| Target Amortization Class (TAC) – 1.4% | ||||||||
| FNMA Remic Trust Series 1999-29, Class MA | ||||||||
| $ 2,675,327 | 6.00 | % | 06/25/2029 | $ 2,496,401 | ||||
| TOTAL COLLATERALIZED
MORTGAGE
OBLIGATIONS |
$ 80,415,329 | |||||||
| TOTAL MORTGAGE BACKED
OBLIGATIONS |
||||||||
| (Cost $172,176,812) | $167,437,434 | |||||||
| Agency Debentures – 4.5% | ||||||||
| Federal Home Loan Mortgage Corp. | ||||||||
| $ 3,000,000 | 5.63 | % | 02/20/2004 | $ 2,822,310 | ||||
| Small Business Administration | ||||||||
| 1,333,350 | 7.20 | 06/01/2017 | 1,307,802 | |||||
| 1,835,825 | 6.30 | 05/01/2018 | 1,728,117 | |||||
| 2,309,582 | 6.30 | 06/01/2018 | 2,174,226 | |||||
| TOTAL AGENCY DEBENTURES | ||||||||
| (Cost $8,424,857) | $ 8,032,455 | |||||||
| TOTAL INVESTMENTS | ||||||||
| (Cost $180,601,669) | $175,469,889 | |||||||
#
|
Variable rate
security. Coupon rate disclosed is that which is in effect at April 30,
2000.
|
®
|
TBA (To Be
Assigned) securities are purchased on a forward commitment basis with an
approximate (generally +/-2.5%) principal amount and no definite maturity
date. The actual principal amount and maturity date will be determined
upon settlement when the specific mortgage pools are
assigned.
|
·
|
Represents
security with notional or nominal principal amount. The actual effective
yield of this security is different than the stated coupon due to the
amortization of related premiums.
|
°
|
Security is issued
with a zero coupon. The interest rate disclosed represents effective
yield to maturity.
|
Ù
|
A portion of this
security is segregated as collateral for initial margin requirement on
futures transactions.
|
| The percentage
shown for each investment category reflects the value of investments in
that category as a percentage of net assets.
|
| The following
graph shows the value as of April 30, 2000, of a $10,000 investment made
on March 1, 1993 in Class A shares (with the maximum sales charge of
4.5%) of the Goldman Sachs Government Income Fund. For comparative
purposes, the performance of the Fund’s benchmark (the Lehman
Brothers Mutual Fund Government/Mortgage Index (“Lehman
Gov’t/MBS Index”)), as well as the Lehman Brothers Mutual Fund
General U.S. Government Index (“Lehman U.S. Gov’t Index”),
are shown. This performance data represents past performance and should
not be considered indicative of future performance which will fluctuate
with changes in market conditions. These performance fluctuations will
cause an investor’s shares, when redeemed, to be worth more or less
than their original cost. Performance of Class B, Class C, Institutional
and Service shares will vary from Class A due to differences in fees and
loads.
|
| Government Income
Fund’s Lifetime Performance
|
| Growth of a $10,000
Investment, Distributions Reinvested March 1, 1993 to April 30,
2000.(a)
|
| |
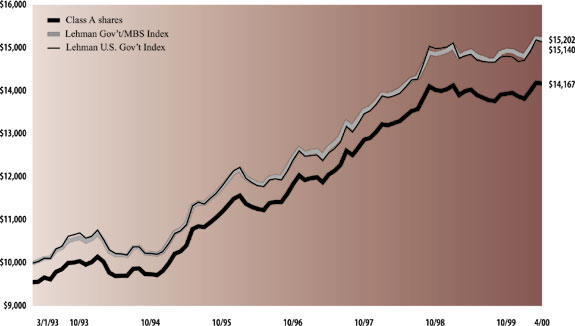
| Average Annual Total Return through April 30, 2000 | Since Inception | Five Years | One Year | Six Months (b) | |||||
|---|---|---|---|---|---|---|---|---|---|
| Class A shares (commenced February 10, 1993) | |||||||||
| Excluding sales charges | 6.01% | 6.36% | 0.99% | 1.65% | |||||
| Including sales charges | 5.34% | 5.39% | -3.56% | -2.95% | |||||
| Class B shares (commenced May 1, 1996) | |||||||||
| Excluding contingent deferred sales charges | 5.14% | n/a | 0.24% | 1.20% | |||||
| Including contingent deferred sales charges | 4.34% | n/a | -4.76% | -3.86% | |||||
| Class C shares (commenced August 15, 1997) | |||||||||
| Excluding contingent deferred sales charges | 3.89% | n/a | 0.24% | 1.20% | |||||
| Including contingent deferred sales charges | 3.89% | n/a | -0.76% | 0.19% | |||||
| Institutional shares (commenced August 15, 1997) | 5.02% | n/a | 1.39% | 1.85% | |||||
| Service shares (commenced August 15, 1997) | 4.58% | n/a | 1.31% | 1.97% | |||||
(a)
|
For comparative
purposes, initial investments are assumed to be made on the first day of
the month following commencement of operations.
|
(b)
|
Not
annualized.
|
| Principal
Amount |
Interest
Rate |
Maturity
Date |
Value | ||||||
|---|---|---|---|---|---|---|---|---|---|
| Mortgage Backed Obligations – 64.0% | |||||||||
| Federal Home Loan Mortgage Corp. (FHLMC) – 7.3% | |||||||||
| $ 2,433,624 | 6.50 | % | 08/01/2010 | $ 2,362,854 | |||||
| 704,139 | 6.00 | 12/01/2013 | 659,905 | ||||||
| 339,542 | 7.00 | 08/01/2028 | 325,111 | ||||||
| 1,000,099 | 6.00 | 02/01/2029 | 906,340 | ||||||
| 384,045 | 7.00 | 04/01/2029 | 367,723 | ||||||
| 299,225 | 6.00 | 05/01/2029 | 271,173 | ||||||
| 642,811 | 6.00 | 06/01/2029 | 582,342 | ||||||
| 500,000 | 6.50 | TBA-30 yr.® | 467,030 | ||||||
| 2,000,000 | 8.00 | TBA-30 yr.® | 1,993,120 | ||||||
| $ 7,935,598 | |||||||||
| Federal National Mortgage Association (FNMA) – 23.0% | |||||||||
| $ 318,855 | 6.50 | % | 08/01/2025 | $ 299,625 | |||||
| 199,657 | 6.50 | 09/01/2025 | 187,428 | ||||||
| 207,608 | 6.50 | 10/01/2025 | 194,892 | ||||||
| 270,294 | 6.50 | 11/01/2025 | 254,246 | ||||||
| 357,378 | 6.50 | 12/01/2025 | 335,778 | ||||||
| 17,125 | 6.50 | 05/01/2026 | 16,076 | ||||||
| 813,554 | 6.50 | 11/01/2028 | 759,916 | ||||||
| 648,673 | 6.00 | 12/01/2028 | 587,250 | ||||||
| 3,514,554 | 6.50 | 12/01/2028 | 3,282,840 | ||||||
| 549,149 | 6.00 | 01/01/2029 | 497,150 | ||||||
| 44,900 | 6.00 | 02/01/2029 | 40,648 | ||||||
| 490,820 | 6.50 | 03/01/2029 | 458,460 | ||||||
| 2,655,684 | 6.50 | 04/01/2029 | 2,480,595 | ||||||
| 729,609 | 6.00 | 05/01/2029 | 660,523 | ||||||
| 1,772,074 | 6.50 | 05/01/2029 | 1,653,558 | ||||||
| 4,414,823 | 6.50 | 06/01/2029 | 4,120,035 | ||||||
| 1,760,150 | 6.50 | 07/01/2029 | 1,642,431 | ||||||
| 877,510 | 6.50 | 10/01/2029 | 818,822 | ||||||
| 27,671 | 6.00 | 11/01/2029 | 25,051 | ||||||
| 2,000,000 | 6.00 | TBA-30 yr® | 1,810,000 | ||||||
| 1,000,000 | 6.50 | TBA-30 yr® | 933,120 | ||||||
| 2,000,000 | 7.00 | TBA-30 yr® | 1,913,120 | ||||||
| 2,000,000 | 8.00 | TBA-30 yr® | 1,996,860 | ||||||
| $ 24,968,424 | |||||||||
| Government National Mortgage Association (GNMA) – 13.2% | |||||||||
| $ 193,575 | 7.00 | % | 03/15/2023 | $ 187,042 | |||||
| 527,465 | 7.00 | 05/15/2023 | 509,663 | ||||||
| 183,984 | 7.00 | 06/15/2023 | 177,775 | ||||||
| 1,446,840 | 7.00 | 07/15/2023 | 1,398,009 | ||||||
| 540,678 | 7.00 | 08/15/2023 | 522,430 | ||||||
| 210,172 | 6.50 | 09/15/2023 | 198,284 | ||||||
| 538,639 | 7.00 | 09/15/2023 | 520,460 | ||||||
| 915,881 | 6.50 | 10/15/2023 | 864,079 | ||||||
| 1,175,918 | 7.00 | 10/15/2023 | 1,136,231 | ||||||
| 882,786 | 6.50 | 11/15/2023 | 832,856 | ||||||
| 461,202 | 7.00 | 11/15/2023 | 445,636 | ||||||
| 893,568 | 6.50 | 12/15/2023 | 843,028 | ||||||
| 538,471 | 7.00 | 12/15/2023 | 520,298 | ||||||
| 745,398 | 6.50 | 01/15/2024 | 702,537 | ||||||
| 308,636 | 6.50 | 02/15/2024 | 290,889 | ||||||
| 394,266 | 6.50 | 04/15/2024 | 371,596 | ||||||
| 300,903 | 6.50 | 01/15/2026 | 282,756 | ||||||
| Principal
Amount |
Interest
Rate |
Maturity
Date |
Value | ||||||
|---|---|---|---|---|---|---|---|---|---|
| Mortgage Backed Obligations – (continued) | |||||||||
| Government National Mortgage Association (GNMA) – (continued) | |||||||||
| $ 660,774 | 6.50 | % | 03/15/2026 | $ 620,922 | |||||
| 19,090 | 6.50 | 04/15/2026 | 17,939 | ||||||
| 905,295 | 6.50 | 03/15/2028 | 848,152 | ||||||
| 584,362 | 6.50 | 07/15/2028 | 547,477 | ||||||
| 461,456 | 6.50 | 01/15/2029 | 432,182 | ||||||
| 2,260,398 | 6.50 | 02/15/2029 | 2,116,998 | ||||||
| $ 14,387,239 | |||||||||
| Collateralized Mortgage Obligations – 20.5% | |||||||||
| Interest Only· – 0.1% | |||||||||
| FNMA Interest-Only Stripped Security Series 151, Class 2 | |||||||||
| $ 242,109 | 9.50 | % | 07/01/2022 | $ 65,142 | |||||
| Inverse Floater# – 2.2% | |||||||||
| FNMA Remic Trust Series 1993-138, Class SM | |||||||||
| $ 921,052 | 8.91 | % | 12/25/2021 | $ 910,847 | |||||
| FNMA Remic Trust Series 1993-164, Class SD | |||||||||
| 500,000 | 5.51 | 09/25/2008 | 426,435 | ||||||
| FNMA Remic Trust Series 1993-231, Class SA | |||||||||
| 1,251,277 | 4.03 | 12/25/2008 | 1,060,945 | ||||||
| $ 2,398,227 | |||||||||
| Inverse Floating Rate – Interest Only#· – 0.1% | |||||||||
| Salomon
Brothers Mortgage Securities VII Series 1996-6E,
Class A2 |
|||||||||
| $ 5,826,830 | 2.40 | % | 03/30/2025 | $ 129,006 | |||||
| Non-Agency CMOs – 1.3% | |||||||||
| Commercial Mortgage Asset Trust Series 1999-C1, Class A3 | |||||||||
| $ 250,000 | 6.64 | % | 09/17/2010 | $ 232,195 | |||||
| CS First
Boston Mortgage Securities Corp. Series 1997-C2,
Class A2 |
|||||||||
| 800,000 | 6.52 | 07/17/2007 | 758,955 | ||||||
| First
Union-Lehman Brothers Commercial Mortgage Services
Series 1997-C1, Class A2 |
|||||||||
| 400,000 | 7.30 | 12/18/2006 | 394,788 | ||||||
| $ 1,385,938 | |||||||||
| Planned Amortization Class (PAC) CMOs – 5.1% | |||||||||
| FHLMC Series 2055, Class OD | |||||||||
| $ 4,000,000 | 6.00 | % | 01/15/2012 | $ 3,707,480 | |||||
| FNMA Remic Trust Series 1997-84, Class PB | |||||||||
| 2,000,000 | 5.50 | 01/25/2008 | 1,854,360 | ||||||
| $ 5,561,840 | |||||||||
| Planned Amortization – Interest Only· – 1.0% | |||||||||
| FHLMC Series 2205, Class PI | |||||||||
| $ 4,424,000 | 7.50 | % | 05/15/2027 | $ 1,075,032 | |||||
| Principal Only° – 0.2% | |||||||||
| FNMA Remic Trust Series G-35, Class N | |||||||||
| $ 204,583 | 6.50 | % | 10/25/2021 | $ 158,799 | |||||
| Sequential Fixed Rate CMOs – 1.9% | |||||||||
| Citicorp Mortgage Securities, Inc. Series 1993-11, Class A6 | |||||||||
| $ 348,405 | 6.25 | % | 09/25/2008 | $ 335,340 | |||||
| Principal
Amount |
Interest
Rate |
Maturity
Date |
Value | |||||
|---|---|---|---|---|---|---|---|---|
| Mortgage Backed Obligations – (continued) | ||||||||
| Sequential Fixed Rate CMOs – (continued) | ||||||||
| FNMA Remic Trust Series 1998-58, Class VA | ||||||||
| $ 877,823 | 6.00 | % | 10/25/2008 | $ 832,729 | ||||
| GE Capital Mortgage Services, Inc. Series 1995-1, Class A8 | ||||||||
| 870,885 | 8.40 | 02/25/2025 | 870,806 | |||||
| $ 2,038,875 | ||||||||
| Support – 2.9% | ||||||||
| FHLMC Series 16, Class M | ||||||||
| $ 1,000,000 | 7.00 | % | 08/25/2023 | $ 920,620 | ||||
| Housing Securities, Inc. Series 1994-1, Class A13 | ||||||||
| 1,455,585 | 6.50 | 03/25/2009 | 1,314,597 | |||||
| Salomon
Brothers Mortgage Securities VII Series 1996-6H,
Class A1 |
||||||||
| 1,000,000 | 6.00 | 09/30/2008 | 922,720 | |||||
| $ 3,157,937 | ||||||||
| Target Amortization Class (TAC) – 5.7% | ||||||||
| FNMA Remic Trust Series 1999-29, Class MA | ||||||||
| $ 6,688,318 | 6.00 | % | 06/25/2029 | $ 6,241,003 | ||||
| TOTAL
COLLATERALIZED MORTGAGE
OBLIGATIONS |
$ 22,211,799 | |||||||
| TOTAL MORTGAGE BACKED OBLIGATIONS | ||||||||
| (Cost $71,476,474) | $ 69,503,060 | |||||||
| Agency Debentures – 11.2% | ||||||||
| Federal Home Loan Bank | ||||||||
| $ 1,000,000 | 5.68 | % | 12/03/2007 | $ 982,530 | ||||
| Federal Home Loan Mortgage Corp. | ||||||||
| 1,000,000 | 5.00 | 01/15/2004 | 926,917 | |||||
| Federal National Mortgage Association | ||||||||
| 3,000,000 | 5.45 | 02/05/2004 | 2,811,570 | |||||
| Financing Corp. Stripped Securities-Principal Only° | ||||||||
| 2,000,000 | 7.09 | 03/07/2013 | 823,420 | |||||
| Small Business Administration | ||||||||
| 1,700,345 | 6.70 | 12/01/2016 | 1,625,821 | |||||
| 1,427,227 | 7.15 | 03/01/2017 | 1,414,339 | |||||
| 1,207,211 | 7.50 | 04/01/2017 | 1,219,139 | |||||
| 667,270 | 7.30 | 05/01/2017 | 657,849 | |||||
| 917,912 | 6.30 | 05/01/2018 | 864,059 | |||||
| 923,833 | 6.30 | 06/01/2018 | 869,690 | |||||
| TOTAL AGENCY DEBENTURES | ||||||||
| (Cost $12,497,857) | $ 12,195,334 | |||||||
| Asset-Backed Securities – 15.3% | ||||||||
| Auto – 1.9% | ||||||||
| Americredit Automobile Receivables Trust Series 1997-D,
Class A3 |
||||||||
| $ 1,288,950 | 6.24 | % | 09/05/2003 | $ 1,279,206 | ||||
| CPS Auto Grantor Trust Series 1996-3, Class A | ||||||||
| 624,379 | 6.30 | 08/15/2002 | 620,477 | |||||
| Principal
Amount |
Interest
Rate |
Maturity
Date |
Value | |||||
|---|---|---|---|---|---|---|---|---|
| Asset-Backed Securities – (continued) | ||||||||
| Auto – (continued) | ||||||||
| Fasco Auto Trust Series 1996-1, Class A | ||||||||
| $ 130,901 | 6.65 | % | 11/15/2001 | $ 130,509 | ||||
| $ 2,030,192 | ||||||||
| Credit Card – 9.2% | ||||||||
| Discover Card Master Trust I Series 1999-2, Class A | ||||||||
| $ 2,500,000 | 5.90 | % | 10/15/2004 | $ 2,438,075 | ||||
| Discover Card Master Trust I Series 1999-6, Class A | ||||||||
| 3,000,000 | 6.85 | 07/17/2007 | 2,959,680 | |||||
| Fingerhut Master Trust Series 1998-2, Class A | ||||||||
| 2,750,000 | 6.23 | 02/15/2007 | 2,645,115 | |||||
| MBNA Master Credit Card Trust Series 1998-C, Class A # | ||||||||
| 2,000,000 | 6.21 | 11/15/2005 | 1,997,500 | |||||
| $ 10,040,370 | ||||||||
| Home Equity – 0.3% | ||||||||
| First Franklin Mortgage Loan Series 1997-FF2, Class A # | ||||||||
| $ 296,596 | 6.05 | % | 08/25/2028 | $ 296,502 | ||||
| First Franklin Mortgage Loan Series 1997-FF3, Class A2 # | ||||||||
| 77,874 | 6.10 | 11/20/2027 | 77,826 | |||||
| $ 374,328 | ||||||||
| Lease – 3.2% | ||||||||
| AESOP Funding II LLC Series 1998-1, Class A† | ||||||||
| $ 2,000,000 | 6.14 | % | 05/20/2006 | $ 1,876,300 | ||||
| First Sierra Receivables Series 1998-1, Class A4 | ||||||||
| 1,600,000 | 5.63 | 08/12/2004 | 1,541,663 | |||||
| $ 3,417,963 | ||||||||
| Manufactured Housing – 0.7% | ||||||||
| Mid-State Trust Series 4, Class A | ||||||||
| $ 779,742 | 8.33 | % | 04/01/2030 | $ 769,613 | ||||
| TOTAL ASSET-BACKED SECURITIES | ||||||||
| (Cost $17,091,785) | $ 16,632,466 | |||||||
| Insured Revenue Bond – 1.8% | ||||||||
| New Jersey Economic Development Authority Series A | ||||||||
| $ 2,000,000 | 7.43 | % | 02/15/2029 | $ 1,940,840 | ||||
| TOTAL INSURED REVENUE BOND | ||||||||
| (Cost $2,000,000) | $ 1,940,840 | |||||||
| U.S. Treasury Obligations – 9.3% | ||||||||
| United States Treasury Interest-Only Stripped Security· | ||||||||
| $ 2,100,000 | 6.28 | % | 02/15/2014 | $ 881,433 | ||||
| United States Treasury Principal-Only Stripped Securities° | ||||||||
| 2,590,000 | 8.00 | 11/15/2009 | 1,384,536 | |||||
| 5,450,000 | 6.15 | 05/15/2017 | 1,919,327 | |||||
| 3,000,000 | 6.08 | 08/15/2020 | 875,940 | |||||
| 380,000 | 5.93 | 08/15/2025 | 83,554 | |||||
| Principal
Amount |
Interest
Rate |
Maturity
Date |
Value | |||||
|---|---|---|---|---|---|---|---|---|
| U.S. Treasury Obligations – (continued) | ||||||||
| United States Treasury Bond | ||||||||
| $ 1,600,000 | 8.75 | % | 08/15/2020 | $ 2,045,744 | ||||
| United States Treasury Note | ||||||||
| 3,000,000 | 5.75 | 11/30/2002 | 2,934,840 | |||||
| TOTAL U.S. TREASURY OBLIGATIONS | ||||||||
| (Cost $10,014,900) | $ 10,125,374 | |||||||
| Repurchase Agreement – 6.1% | ||||||||
| Joint Repurchase Agreement AccountÙ | ||||||||
| $ 6,600,000 | 5.85 | % | 05/01/2000 | 6,600,000 | ||||
| TOTAL REPURCHASE AGREEMENT | ||||||||
| (Cost $6,600,000) | $ 6,600,000 | |||||||
| TOTAL INVESTMENTS | ||||||||
| (Cost $119,681,016) | $ 116,997,074 | |||||||
®
|
TBA (To
Be Assigned) securities are purchased on a forward commitment
basis with an approximate (generally +/-2.5%) principal amount
and no definite maturity date. The actual principal amount and
maturity date will be determined upon settlement when the
specific mortgage pools are assigned.
|
·
|
Represents security with notional or nominal principal
amount. The actual effective yield of this security is
different than the stated coupon due to the amortization of
related premiums.
|
#
|
Variable rate security. Coupon rate disclosed is that
which is in effect at April 30, 2000.
|
°
|
Security is issued with a zero coupon. The interest
rate disclosed represents effective yield to
maturity.
|
†
|
Security is exempt from registration under Rule 144A of
the Securities Act of 1933. Such securities may be resold,
normally to qualified institutional buyers in transactions
exempt from registration. Total market value of 144A
securities amounted to $1,876,300 as of April 30,
2000.
|
Ù
|
A
portion of this security is segregated as collateral for
initial margin requirement on futures
transactions.
|
| The
percentage shown for each investment category reflects the
value of investments in that category as a percentage of net
assets.
|
| The
following graph shows the value as of April 30, 2000, of a
$10,000 investment made on January 5, 1994 (commencement of
operations) in the Institutional shares of the Goldman Sachs
Core Fixed Income Fund. For comparative purposes, the
performance of the Fund’s benchmark (the Lehman Brothers
Aggregate Bond Index (“Lehman Aggregate Index”)) is
shown. This performance data represents past performance and
should not be considered indicative of future performance
which will fluctuate with changes in market conditions. These
performance fluctuations will cause an investor’s shares,
when redeemed, to be worth more or less than their original
cost. Performance of Class A, Class B, Class C, and Service
shares will vary from Institutional shares due to differences
in fees and loads.
|
| Core Fixed
Income Fund’s Lifetime Performance
|
| Growth of a
$10,000 Investment, Distributions Reinvested January 5, 1994
to April 30, 2000.
|
| |
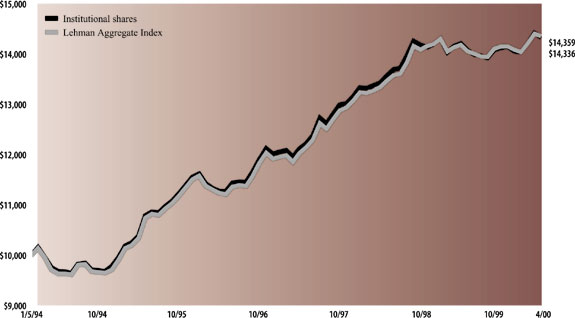
| Average Annual Total Return through April 30, 2000 | Since Inception | Five Years | One Year | Six Months (a) | |||||
|---|---|---|---|---|---|---|---|---|---|
| Class A shares (commenced May 1, 1997) | |||||||||
| Excluding sales charges | 5.36% | n/a | 0.48% | 1.27% | |||||
| Including sales charges | 3.75% | n/a | -4.00% | -3.31% | |||||
| Class B shares (commenced May 1, 1997) | |||||||||
| Excluding contingent deferred sales charges | 4.63% | n/a | -0.22% | 1.01% | |||||
| Including contingent deferred sales charges | 3.57% | n/a | -5.20% | -4.04% | |||||
| Class C shares (commenced August 15, 1997) | |||||||||
| Excluding contingent deferred sales charges | 3.69% | n/a | -0.26% | 1.01% | |||||
| Including contingent deferred sales charges | 3.69% | n/a | -1.25% | -0.00% | |||||
| Institutional shares (commenced January 5, 1994) | 5.86% | 6.65% | 0.89% | 1.48% | |||||
| Service shares (commenced March 13, 1996) | 5.38% | n/a | 0.39% | 1.33% | |||||
(a)
|
Not
annualized.
|
| Principal
Amount |
Interest
Rate |
Maturity
Date |
Value | |||||
|---|---|---|---|---|---|---|---|---|
| Corporate Bonds – 32.8% | ||||||||
| Aerospace/Defense – 0.4% | ||||||||
| Raytheon Co. | ||||||||
| $ 250,000 | 6.45 | % | 08/15/2002 | $ 241,750 | ||||
| 1,300,000 | 5.70 | 11/01/2003 | 1,205,568 | |||||
| $ 1,447,318 | ||||||||
| Airlines – 1.0% | ||||||||
| Continental Airlines, Inc. | ||||||||
| $ 516,004 | 8.56 | % | 07/02/2014 | $ 522,129 | ||||
| 347,218 | 7.26 | 03/15/2020 | 320,052 | |||||
| Northwest Airlines, Inc. | ||||||||
| 1,933,595 | 8.97 | 01/02/2015 | 1,929,322 | |||||
| NWA Trust | ||||||||
| 130,055 | 8.26 | 03/10/2006 | 128,183 | |||||
| US Airways, Inc. | ||||||||
| 518,888 | 6.76 | 04/15/2008 | 456,445 | |||||
| $ 3,356,131 | ||||||||
| Automotive – 3.2% | ||||||||
| Chrysler Financial Corp. | ||||||||
| $ 430,000 | 6.09 | % | 04/06/2001 | $ 426,341 | ||||
| DaimlerChrysler NA Holding Corp. | ||||||||
| 2,500,000 | 6.90 | 09/01/2004 | 2,434,970 | |||||
| Ford Capital BV | ||||||||
| 325,000 | 9.88 | 05/15/2002 | 337,763 | |||||
| Ford Motor Co. | ||||||||
| 785,000 | 6.63 | 10/01/2028 | 671,622 | |||||
| Ford Motor Credit Co. | ||||||||
| 800,000 | 5.75 | 02/23/2004 | 747,760 | |||||
| General Motors Acceptance Corp. | ||||||||
| 375,000 | 9.63 | 12/15/2001 | 385,740 | |||||
| 1,500,000 | 5.91 | 03/11/2002 | 1,458,705 | |||||
| 1,400,000 | 7.48 | 02/28/2003 | 1,392,090 | |||||
| The Hertz Corp. | ||||||||
| 1,075,000 | 6.70 | 06/15/2002 | 1,052,672 | |||||
| 1,200,000 | 6.00 | 01/15/2003 | 1,143,432 | |||||
| 500,000 | 7.00 | 07/15/2003 | 488,945 | |||||
| $10,540,040 | ||||||||
| Automotive Parts – 0.6% | ||||||||
| The Pep Boys-Manny, Moe & Jack | ||||||||
| $ 550,000 | 6.75 | % | 03/10/2004 | $ 454,157 | ||||
| 100,000 | 6.52 | 07/16/2007 | 86,063 | |||||
| TRW, Inc.† | ||||||||
| 1,600,000 | 6.63 | 06/01/2004 | 1,505,979 | |||||
| $ 2,046,199 | ||||||||
| Broker Dealer – 0.1% | ||||||||
| World Financial Properties† | ||||||||
| $ 464,491 | 6.91 | % | 09/01/2013 | $ 437,848 | ||||
| Building Materials – 0.4% | ||||||||
| Owens Corning | ||||||||
| $1,445,000 | 7.50 | % | 05/01/2005 | $ 1,329,617 | ||||
| Principal
Amount |
Interest
Rate |
Maturity
Date |
Value | |||||
|---|---|---|---|---|---|---|---|---|
| Corporate Bonds – (continued) | ||||||||
| Commercial Banks – 4.1% | ||||||||
| Bank of America Corp. | ||||||||
| $ 110,000 | 7.75 | % | 07/15/2002 | $ 110,417 | ||||
| 400,000 | 7.50 | 10/15/2002 | 399,792 | |||||
| 730,000 | 7.88 | 12/01/2002 | 736,395 | |||||
| 1,200,000 | 9.20 | 05/15/2003 | 1,247,748 | |||||
| 700,000 | 6.38 | 05/15/2005 | 661,759 | |||||
| 810,000 | 7.25 | 10/15/2025 | 735,415 | |||||
| Citicorp | ||||||||
| 900,000 | 8.00 | 02/01/2003 | 909,801 | |||||
| Dime Bancorp, Inc. | ||||||||
| 810,000 | 6.38 | 01/30/2001 | 801,673 | |||||
| First Union Corp. | ||||||||
| 1,200,000 | 7.10 | 08/15/2004 | 1,173,732 | |||||
| Long Island Savings Bank | ||||||||
| 2,650,000 | 6.20 | 04/02/2001 | 2,611,575 | |||||
| Security Pacific Corp. | ||||||||
| 995,000 | 11.50 | 11/15/2000 | 1,017,706 | |||||
| The Bank of New York Co., Inc. | ||||||||
| 1,100,000 | 7.88 | 11/15/2002 | 1,110,692 | |||||
| The Money Store, Inc. | ||||||||
| 630,000 | 7.30 | 12/01/2002 | 625,722 | |||||
| Wells Fargo & Co. | ||||||||
| 1,440,000 | 6.63 | 07/15/2004 | 1,386,015 | |||||
| $13,528,442 | ||||||||
| Conglomerates – 0.8% | ||||||||
| Tyco International Group SA | ||||||||
| $ 975,000 | 5.88 | % | 11/01/2004 | $ 896,308 | ||||
| 1,850,000 | 6.38 | 06/15/2005 | 1,720,888 | |||||
| $ 2,617,196 | ||||||||
| Consumer Cyclicals – 0.4% | ||||||||
| Cendant Corp. | ||||||||
| $1,250,000 | 7.75 | % | 12/01/2003 | $ 1,218,175 | ||||
| Credit Card Banks – 1.1% | ||||||||
| Capital One Bank | ||||||||
| $ 800,000 | 6.58 | % | 04/17/2001 | $ 793,656 | ||||
| 650,000 | 6.15 | 06/01/2001 | 637,162 | |||||
| 1,000,000 | 6.48 | 01/28/2002 | 977,430 | |||||
| 350,000 | 6.38 | 02/15/2003 | 335,607 | |||||
| Capital One Financial Corp. | ||||||||
| 355,000 | 7.25 | 12/01/2003 | 340,790 | |||||
| Providian National Bank | ||||||||
| 705,000 | 6.65 | 02/01/2004 | 664,561 | |||||
| $ 3,749,206 | ||||||||
| Electric – 0.7% | ||||||||
| Edison Mission Energy Funding Corp.† | ||||||||
| $ 103,756 | 6.77 | % | 09/15/2003 | $ 101,258 | ||||
| Mid American Energy Holdings Corp. | ||||||||
| 1,000,000 | 7.23 | 09/15/2005 | 956,170 | |||||
| Niagara Mohawk Power Corp. | ||||||||
| 650,000 | 6.88 | 04/01/2003 | 629,701 | |||||
| 400,000 | 7.38 | 08/01/2003 | 397,256 | |||||
| 314,000 | 8.00 | 06/01/2004 | 311,422 | |||||
| Salton Sea Funding Corp. | ||||||||
| 12,429 | 7.02 | 05/30/2000 | 12,428 | |||||
| $ 2,408,235 | ||||||||
| Principal
Amount |
Interest
Rate |
Maturity
Date |
Value | |||||
|---|---|---|---|---|---|---|---|---|
| Corporate Bonds – (continued) | ||||||||
| Energy – 1.3% | ||||||||
| Norsk Hydro ASA | ||||||||
| $ 260,000 | 7.15 | % | 01/15/2029 | $ 234,226 | ||||
| Occidental Petroleum Corp. | ||||||||
| 505,000 | 6.50 | 04/01/2005 | 468,913 | |||||
| 425,000 | 7.65 | 02/15/2006 | 414,116 | |||||
| 375,000 | 7.20 | 04/01/2028 | 317,707 | |||||
| The Williams Cos., Inc. | ||||||||
| 2,030,000 | 6.13 | 02/15/2012 | 1,975,495 | |||||
| Tosco Corp. | ||||||||
| 800,000 | 8.13 | 02/15/2030 | 766,008 | |||||
| $4,176,465 | ||||||||
| Environmental – 1.0% | ||||||||
| Republic Services, Inc. | ||||||||
| $1,545,000 | 6.63 | % | 05/15/2004 | $1,400,650 | ||||
| Waste Management, Inc. | ||||||||
| 1,225,000 | 6.25 | 10/15/2000 | 1,208,622 | |||||
| 700,000 | 6.13 | 07/15/2001 | 669,543 | |||||
| $3,278,815 | ||||||||
| Finance Companies – 2.0% | ||||||||
| Associates Corp. of North America | ||||||||
| $ 950,000 | 5.75 | % | 11/01/2003 | $ 893,672 | ||||
| 1,000,000 | 6.00 | 07/15/2005 | 921,310 | |||||
| Comdisco, Inc. | ||||||||
| 3,000,000 | 6.13 | 01/15/2003 | 2,853,480 | |||||
| Household Finance Corp. | ||||||||
| 900,000 | 5.88 | 11/01/2002 | 863,395 | |||||
| 1,300,000 | 7.25 | 07/15/2003 | 1,280,292 | |||||
| $6,812,149 | ||||||||
| Food – 0.5% | ||||||||
| Nabisco, Inc. # | ||||||||
| $1,650,000 | 6.00 | % | 02/15/2001 | $1,607,958 | ||||
| Industrial-Other – 0.2% | ||||||||
| AMETEK, Inc. | ||||||||
| $ 600,000 | 7.20 | % | 07/15/2008 | $ 533,514 | ||||
| Insurance Companies – 0.9% | ||||||||
| American General Finance Corp. | ||||||||
| $1,200,000 | 7.49 | % | 03/03/2003 | $1,188,888 | ||||
| 780,000 | 5.75 | 11/01/2003 | 731,547 | |||||
| Conseco, Inc. | ||||||||
| 1,190,000 | 8.50 | 10/15/2002 | 737,800 | |||||
| MIC Financing Trust I† | ||||||||
| 360,000 | 8.38 | 02/01/2027 | 330,205 | |||||
| $2,988,440 | ||||||||
| Media-Cable – 1.3% | ||||||||
| Time Warner Entertainment Co. | ||||||||
| $2,850,000 | 9.63 | % | 05/01/2002 | $2,939,974 | ||||
| Time Warner, Inc. | ||||||||
| 400,000 | 7.98 | 08/15/2004 | 403,672 | |||||
| 1,000,000 | 6.85 | 01/15/2026 | 968,870 | |||||
| $4,312,516 | ||||||||
| Principal
Amount |
Interest
Rate |
Maturity
Date |
Value | |||||
|---|---|---|---|---|---|---|---|---|
| Corporate Bonds – (continued) | ||||||||
| Media-Non Cable – 2.9% | ||||||||
| CBS Corp. | ||||||||
| $ 665,000 | 6.88 | % | 09/01/2003 | $ 644,578 | ||||
| J. Seagram & Sons, Inc. | ||||||||
| 1,050,000 | 6.25 | 12/15/2001 | 1,022,511 | |||||
| News America Holdings, Inc. | ||||||||
| 1,000,000 | 8.63 | 02/01/2003 | 1,011,570 | |||||
| 1,500,000 | 8.50 | 02/15/2005 | 1,516,725 | |||||
| 1,040,000 | 8.00 | 10/17/2016 | 970,185 | |||||
| 600,000 | 7.13 | 04/08/2028 | 509,040 | |||||
| PanAmSat Corp. | ||||||||
| 1,380,000 | 6.13 | 01/15/2005 | 1,230,463 | |||||
| Viacom, Inc. | ||||||||
| 2,250,000 | 6.75 | 01/15/2003 | 2,195,460 | |||||
| 455,000 | 7.75 | 06/01/2005 | 450,973 | |||||
| $9,551,505 | ||||||||
| Mortgage Banks – 1.7% | ||||||||
| Countrywide Capital Corp. III | ||||||||
| $1,080,000 | 8.05 | % | 06/15/2027 | $ 975,305 | ||||
| Countrywide Funding Corp. | ||||||||
| 1,000,000 | 6.97 | 03/28/2003 | 981,550 | |||||
| Countrywide Home Loans, Inc. | ||||||||
| 400,000 | 6.45 | 02/27/2003 | 387,504 | |||||
| 200,000 | 6.70 | 03/10/2005 | 191,232 | |||||
| Homeside Lending, Inc. | ||||||||
| 1,760,000 | 6.20 | 05/15/2003 | 1,678,882 | |||||
| 1,360,000 | 6.75 | 08/01/2004 | 1,301,710 | |||||
| $5,516,183 | ||||||||
| REIT – 1.1% | ||||||||
| Developers Diversified Realty Corp. | ||||||||
| $1,400,000 | 6.84 | % | 12/16/2004 | $1,275,484 | ||||
| Highwoods Properties, Inc. | ||||||||
| 835,000 | 6.75 | 12/01/2003 | 774,763 | |||||
| Liberty Property LP | ||||||||
| 115,000 | 7.10 | 08/15/2004 | 108,085 | |||||
| Meditrust Cos. | ||||||||
| 355,000 | 7.82 | 09/10/2026 | 237,850 | |||||
| Simon Property Group LP | ||||||||
| 1,495,000 | 6.63 | 06/15/2003 | 1,414,865 | |||||
| $3,811,047 | ||||||||
| Retailers – 0.6% | ||||||||
| Federated Department Stores, Inc. | ||||||||
| $1,400,000 | 8.50 | % | 06/15/2003 | $1,421,140 | ||||
| Sears Roebuck Acceptance Corp. | ||||||||
| 500,000 | 6.41 | 11/19/2002 | 487,650 | |||||
| $1,908,790 | ||||||||
| Supermarkets – 0.8% | ||||||||
| Fred Meyer, Inc. | ||||||||
| $ 700,000 | 7.38 | % | 03/01/2005 | $ 678,797 | ||||
| 450,000 | 7.45 | 03/01/2008 | 428,445 | |||||
| Safeway, Inc. | ||||||||
| 1,565,000 | 6.05 | 11/15/2003 | 1,483,698 | |||||
| $2,590,940 | ||||||||
| Principal
Amount |
Interest
Rate |
Maturity
Date |
Value | |||||
|---|---|---|---|---|---|---|---|---|
| Corporate Bonds – (continued) | ||||||||
| Telecommunications – 4.0% | ||||||||
| 360 Communications Co. | ||||||||
| $1,015,000 | 7.13 | % | 03/01/2003 | $ 999,308 | ||||
| Bellsouth Capital Funding Corp. | ||||||||
| 1,055,000 | 7.88 | 02/15/2030 | 1,060,317 | |||||
| Cable & Wireless Communications PLC | ||||||||
| 1,360,000 | 6.38 | 03/06/2003 | 1,338,091 | |||||
| MCI WorldCom, Inc. | ||||||||
| 1,400,000 | 6.25 | 08/15/2003 | 1,347,584 | |||||
| 1,125,000 | 6.40 | 08/15/2005 | 1,065,116 | |||||
| 450,000 | 8.88 | 01/15/2006 | 467,883 | |||||
| Metronet Communications Corp.§ | ||||||||
| 1,045,000 | 0.00/9.95 | 06/15/2008 | 815,100 | |||||
| Sprint Capital Corp. | ||||||||
| 1,440,000 | 5.88 | 05/01/2004 | 1,353,701 | |||||
| 400,000 | 6.88 | 11/15/2028 | 346,692 | |||||
| Telecom de Puerto Rico† | ||||||||
| 470,000 | 6.15 | 05/15/2002 | 453,583 | |||||
| 590,000 | 6.65 | 05/15/2006 | 548,057 | |||||
| US West Capital Funding, Inc.† | ||||||||
| 1,500,000 | 6.88 | 08/15/2001 | 1,488,135 | |||||
| 600,000 | 6.88 | 07/15/2028 | 514,740 | |||||
| Vodafone AirTouch PLC† | ||||||||
| 1,550,000 | 7.75 | 02/15/2010 | 1,557,843 | |||||
| $ 13,356,150 | ||||||||
| Tobacco – 1.1% | ||||||||
| Philip Morris Cos., Inc. | ||||||||
| $ 550,000 | 8.75 | % | 06/01/2001 | $ 548,071 | ||||
| 2,250,000 | 7.13 | 08/15/2002 | 2,198,857 | |||||
| R.J. Reynolds Tobacco Holdings, Inc. | ||||||||
| 1,030,000 | 7.38 | 05/15/2003 | 910,417 | |||||
| $ 3,657,345 | ||||||||
| Yankee Banks – 0.6% | ||||||||
| Bayerische Landesbank Girozentrale | ||||||||
| $ 600,000 | 5.88 | % | 12/01/2008 | $ 532,218 | ||||
| Merita Bank Ltd. | ||||||||
| 650,000 | 6.50 | 04/01/2009 | 586,313 | |||||
| National Westminster Bank PLC | ||||||||
| 790,000 | 7.38 | 10/01/2009 | 756,409 | |||||
| $ 1,874,940 | ||||||||
| TOTAL CORPORATE BONDS | ||||||||
| (Cost $114,035,523) | $108,655,164 | |||||||
| Agency Debentures – 1.0% | ||||||||
| AID-Israel° | ||||||||
| $6,000,000 | 6.66 | % | 05/15/2023 | $ 1,261,291 | ||||
| Small Business Administration | ||||||||
| 2,309,582 | 6.30 | 06/01/2018 | 2,174,225 | |||||
| TOTAL AGENCY DEBENTURES | ||||||||
| (Cost $3,798,507) | $ 3,435,516 | |||||||
| Principal
Amount |
Interest
Rate |
Maturity
Date |
Value | |||||
|---|---|---|---|---|---|---|---|---|
| Asset-Backed Securities – 11.7% | ||||||||
| Auto – 2.3% | ||||||||
| Americredit Automobile Receivables Trust Series 1998-A,
Class A3 |
||||||||
| $2,500,000 | 5.88 | % | 12/05/2003 | $ 2,473,828 | ||||
| Onyx Acceptance Auto Trust Series 1999-D, Class A4 | ||||||||
| 2,600,000 | 7.00 | 11/15/2004 | 2,580,240 | |||||
| Rental Car Finance Corp. Series 1997-1, Class A2† | ||||||||
| 2,500,000 | 6.45 | 08/25/2005 | 2,436,225 | |||||
| $ 7,490,293 | ||||||||
| Credit Card – 3.1% | ||||||||
| American Express Credit Account Master Trust I Series
1999-1, Class A |
||||||||
| $5,000,000 | 5.60 | % | 11/15/2006 | $ 4,705,000 | ||||
| Citibank Credit Card Master Trust I Series 1999-7, Class A | ||||||||
| 5,000,000 | 6.65 | 11/15/2006 | 4,843,750 | |||||
| Discover Card Master Trust I Series 1996-4, Class B # | ||||||||
| 850,000 | 6.55 | 10/16/2013 | 847,875 | |||||
| $10,396,625 | ||||||||
| Home Equity – 2.5% | ||||||||
| Aames Mortgage Trust Series 1998-B, Class A6F | ||||||||
| $3,500,000 | 6.45 | % | 09/15/2028 | $ 3,290,000 | ||||
| First Franklin Mortgage Loan Series 1997-FF3, Class A2 # | ||||||||
| 48,671 | 6.10 | 11/20/2027 | 48,641 | |||||
| IMC Home Equity Loan Trust Series 1998-3, Class A8 | ||||||||
| 5,200,000 | 6.34 | 08/20/2029 | 4,900,324 | |||||
| $ 8,238,965 | ||||||||
| Lease – 1.0% | ||||||||
| AESOP Funding II LLC Series 1998-1, Class A† | ||||||||
| $3,400,000 | 6.14 | % | 05/20/2006 | $ 3,189,710 | ||||
| Manufactured Housing – 2.8% | ||||||||
| Green Tree Financial Corp. Series 1997-6, Class A8 | ||||||||
| $3,251,803 | 7.07 | % | 01/15/2029 | $ 3,059,622 | ||||
| Green Tree Financial Corp. Series 1998-6, Class M1 | ||||||||
| 4,250,000 | 6.63 | 06/01/2030 | 3,724,062 | |||||
| Mid-State Trust Series 4, Class A | ||||||||
| 2,599,139 | 8.33 | 04/01/2030 | 2,565,377 | |||||
| $ 9,349,061 | ||||||||
| TOTAL ASSET-BACKED SECURITIES | ||||||||
| (Cost $40,466,021) | $38,664,654 | |||||||
| Emerging Market Debt – 2.4% | ||||||||
| Korea Electric Power Corp. | ||||||||
| $ 760,000 | 7.75 | % | 04/01/2013 | $ 698,858 | ||||
| Pemex Finance Ltd. | ||||||||
| 600,000 | 8.02 | 05/15/2007 | 578,664 | |||||
| 700,000 | 9.15 | 11/15/2018 | 698,054 | |||||
| Republic of Korea | ||||||||
| 810,000 | 8.88 | 04/15/2008 | 835,385 | |||||
| Republic of Poland # | ||||||||
| 1,160,000 | 6.00 | 10/27/2014 | 1,046,900 | |||||
| 1,910,000 | 4.00 | 10/27/2024 | 1,262,988 | |||||
| Principal
Amount |
Interest
Rate |
Maturity
Date |
Value | |||||
|---|---|---|---|---|---|---|---|---|
| Emerging Market Debt – (continued) | ||||||||
| State of Qatar | ||||||||
| $ 750,000 | 9.50 | % | 05/21/2009 | $ 777,390 | ||||
| United Mexican States | ||||||||
| 710,000 | 9.88 | 02/01/2010 | 733,075 | |||||
| YPF Sociedad Anonima | ||||||||
| 59,534 | 7.00 | 10/26/2002 | 58,490 | |||||
| 1,095,970 | 7.50 | 10/26/2002 | 1,084,188 | |||||
| TOTAL EMERGING MARKET DEBT | ||||||||
| (Cost $7,908,247) | $ 7,773,992 | |||||||
| Mortgage Backed Obligations – 45.5% | ||||||||
| Federal Home Loan Mortgage Corp. (FHLMC) – 7.2% | ||||||||
| $ 123,406 | 8.00 | % | 08/01/2010 | $ 124,102 | ||||
| 241,906 | 6.00 | 03/01/2014 | 226,709 | |||||
| 1,579,765 | 6.00 | 06/01/2014 | 1,480,524 | |||||
| 114,685 | 7.00 | 10/01/2017 | 110,528 | |||||
| 3,994,859 | 7.00 | 04/01/2028 | 3,827,554 | |||||
| 894,219 | 6.00 | 07/01/2028 | 810,386 | |||||
| 102,788 | 6.00 | 08/01/2028 | 93,152 | |||||
| 969,954 | 7.00 | 08/01/2028 | 928,731 | |||||
| 994,905 | 6.00 | 11/01/2028 | 901,633 | |||||
| 1,999,999 | 6.00 | 01/01/2029 | 1,812,499 | |||||
| 993,276 | 6.00 | 04/01/2029 | 900,157 | |||||
| 2,000,048 | 6.00 | 05/01/2029 | 1,793,925 | |||||
| 2,000,000 | 6.50 | TBA-30 yr® | 1,873,740 | |||||
| 9,000,000 | 8.00 | TBA-30 yr® | 8,969,040 | |||||
| $23,852,680 | ||||||||
| Federal National Mortgage Association (FNMA) – 15.5% | ||||||||
| $ 65,982 | 6.50 | % | 02/01/2026 | $ 61,940 | ||||
| 164,570 | 6.50 | 08/01/2026 | 154,490 | |||||
| 149,946 | 6.50 | 09/01/2027 | 140,199 | |||||
| 271,085 | 6.50 | 10/01/2027 | 253,464 | |||||
| 1,860,144 | 6.50 | 11/01/2027 | 1,739,333 | |||||
| 2,168,759 | 6.50 | 12/01/2027 | 2,027,790 | |||||
| 34,308 | 6.00 | 09/01/2028 | 31,060 | |||||
| 38,586 | 6.00 | 10/01/2028 | 34,932 | |||||
| 103,103 | 6.00 | 12/01/2028 | 93,340 | |||||
| 1,474,269 | 6.00 | 01/01/2029 | 1,334,671 | |||||
| 383,855 | 6.50 | 01/01/2029 | 358,547 | |||||
| 1,941,154 | 6.00 | 02/01/2029 | 1,757,346 | |||||
| 249,145 | 6.50 | 02/01/2029 | 232,719 | |||||
| 473,711 | 6.00 | 03/01/2029 | 428,855 | |||||
| 409,382 | 6.50 | 03/01/2029 | 382,392 | |||||
| 976,294 | 6.00 | 04/01/2029 | 883,849 | |||||
| 3,623,958 | 6.50 | 04/01/2029 | 3,385,030 | |||||
| 960,759 | 6.50 | 05/01/2029 | 897,416 | |||||
| 170,215 | 6.00 | 06/01/2029 | 154,045 | |||||
| 15,822,109 | 6.50 | 06/01/2029 | 14,774,109 | |||||
| 1,012,928 | 6.00 | 07/01/2029 | 916,787 | |||||
| 2,688,251 | 6.50 | 07/01/2029 | 2,508,603 | |||||
| 95,889 | 6.50 | 08/01/2029 | 89,476 | |||||
| 275,879 | 6.00 | 10/01/2029 | 251,740 | |||||
| 12,000,000 | 6.00 | TBA-30 yr® | 10,870,000 | |||||
| 3,999,204 | 6.50 | TBA-30 yr® | 3,731,737 | |||||
| 4,000,000 | 7.00 | TBA-30 yr® | 3,826,240 | |||||
| $51,320,110 | ||||||||
| Principal
Amount |
Interest
Rate |
Maturity
Date |
Value | |||||
|---|---|---|---|---|---|---|---|---|
| Mortgage Backed Obiligations – (continued) | ||||||||
| Government National Mortgage Association (GNMA) – 12.4% | ||||||||
| $ 161,062 | 8.00 | % | 02/15/2017 | $ 162,572 | ||||
| 20,301 | 7.00 | 11/15/2022 | 19,630 | |||||
| 761,399 | 7.00 | 12/15/2022 | 736,212 | |||||
| 469,379 | 7.00 | 01/15/2023 | 453,959 | |||||
| 113,490 | 7.00 | 03/15/2023 | 109,731 | |||||
| 712,322 | 7.00 | 04/15/2023 | 688,281 | |||||
| 1,506,124 | 7.00 | 05/15/2023 | 1,455,293 | |||||
| 510,994 | 6.50 | 06/15/2023 | 482,092 | |||||
| 53,826 | 7.00 | 06/15/2023 | 52,010 | |||||
| 1,495,235 | 7.00 | 07/15/2023 | 1,444,770 | |||||
| 540,332 | 6.50 | 08/15/2023 | 509,771 | |||||
| 791,397 | 7.00 | 08/15/2023 | 764,687 | |||||
| 1,264,220 | 6.50 | 09/15/2023 | 1,192,716 | |||||
| 2,937,667 | 6.50 | 10/15/2023 | 2,771,512 | |||||
| 1,878,823 | 7.00 | 10/15/2023 | 1,814,352 | |||||
| 3,290,756 | 6.50 | 11/15/2023 | 3,104,631 | |||||
| 30,427 | 7.00 | 11/15/2023 | 29,401 | |||||
| 8,948,917 | 6.50 | 12/15/2023 | 8,442,503 | |||||
| 895,175 | 7.00 | 12/15/2023 | 864,370 | |||||
| 227,331 | 6.50 | 01/15/2024 | 214,260 | |||||
| 441,505 | 6.50 | 02/15/2024 | 416,119 | |||||
| 352,849 | 6.50 | 03/15/2024 | 332,560 | |||||
| 3,101,899 | 6.50 | 04/15/2024 | 2,923,540 | |||||
| 1,410,340 | 6.50 | 05/15/2024 | 1,329,245 | |||||
| 29,868 | 6.50 | 02/15/2026 | 28,067 | |||||
| 2,926,307 | 6.50 | 03/15/2026 | 2,749,822 | |||||
| 180,605 | 6.50 | 01/15/2028 | 169,205 | |||||
| 380,425 | 6.50 | 02/15/2028 | 356,412 | |||||
| 450,113 | 6.50 | 03/15/2028 | 421,702 | |||||
| 2,591,952 | 6.50 | 04/15/2028 | 2,428,348 | |||||
| 500,778 | 6.50 | 07/15/2028 | 469,169 | |||||
| 2,352,975 | 6.50 | 01/15/2029 | 2,204,258 | |||||
| 2,080,724 | 6.50 | 02/15/2029 | 1,949,308 | |||||
| $ 41,090,508 | ||||||||
| Collateralized Mortgage Obligations – 10.4% | ||||||||
| Inverse Floater# – 1.2% | ||||||||
| FNMA Remic Trust Series 1993-138, Class SM | ||||||||
| $3,000,000 | 8.39 | % | 12/25/2021 | $ 2,966,760 | ||||
| Prudential Home Mortgage Securities Co. Series 1992-99,
Class A5 |
||||||||
| 923,957 | 6.85 | 12/25/2007 | 917,757 | |||||
| $ 3,884,517 | ||||||||
| IOette·# – 0.1% | ||||||||
| FNMA Series 1992-24, Class N | ||||||||
| $ 13,954 | 11.72 | % | 03/25/2007 | $ 246,846 | ||||
| Non-Agency CMOs – 6.0% | ||||||||
| Asset Securitization Corp. Series 1997-D4, Class A1D | ||||||||
| $ 900,000 | 7.49 | % | 04/14/2029 | $ 884,076 | ||||
| Chase
Commercial Mortgage Securities Corp. Series 1997-2
Class A2 |
||||||||
| 3,100,000 | 6.60 | 11/19/2007 | 2,916,511 | |||||
| Chase
Commercial Mortgage Securities Corp. Series 1998-1,
Class A2 |
||||||||
| 3,000,000 | 6.56 | 05/18/2008 | 2,795,730 | |||||
| Principal
Amount |
Interest
Rate |
Maturity
Date |
Value | |||||
|---|---|---|---|---|---|---|---|---|
| Mortgage Backed Obligations – (continued) | ||||||||
| Non-Agency CMOs – (continued) | ||||||||
| Commercial Mortgage Acceptance Corp. Series 1998-C1,
Class A2 |
||||||||
| $2,200,000 | 6.49 | % | 05/15/2008 | $ 2,037,882 | ||||
| Commercial Mortgage Asset Trust Series 1999-C1, Class A3 | ||||||||
| 400,000 | 6.64 | 09/17/2010 | 371,513 | |||||
| CS
First Boston Mortgage Sercurities Corp. Series 1997-C2,
Class A3 |
||||||||
| 3,250,000 | 6.55 | 11/17/2007 | 3,025,080 | |||||
| First
Union-Lehman Brothers Commercial Mortgage Services
Series 1997-C1, Class A2 |
||||||||
| 600,000 | 7.30 | 12/18/2006 | 592,183 | |||||
| First
Union-Lehman Brothers Commercial Mortgage Services
Series 1997-C2, Class A2 |
||||||||
| 1,000,000 | 6.60 | 05/18/2007 | 952,132 | |||||
| JP
Morgan Commercial Mortgage Finance Corp. Series
1999-C8, Class A2 |
||||||||
| 3,000,000 | 7.40 | 07/15/2031 | 2,920,548 | |||||
| Merrill
Lynch Mortgage Investors, Inc. Series 1998-C2
Class A2 |
||||||||
| 3,690,000 | 6.39 | 02/15/2030 | 3,413,619 | |||||
| $ 19,909,274 | ||||||||
| Planned Amortization Class (PAC) CMOs – 1.4% | ||||||||
| FHLMC Series 2055, Class OD | ||||||||
| $3,000,000 | 6.00 | % | 01/15/2012 | $ 2,780,610 | ||||
| FHLMC Series 2149, Class TF | ||||||||
| 1,250,000 | 6.50 | 05/15/2024 | 1,187,375 | |||||
| FNMA Remic Trust Series G93-31, Class PJ | ||||||||
| 750,000 | 6.55 | 10/25/2020 | 727,192 | |||||
| $ 4,695,177 | ||||||||
| Sequential Fixed Rate CMOs – 1.7% | ||||||||
| Bank of
America Mortgage Securities, Inc. Series 1999-7,
Class A21 |
||||||||
| $2,401,000 | 6.50 | % | 07/25/2029 | $ 2,108,894 | ||||
| Residential Funding Mortgage Securities I Series
1998-S2,
Class A3 |
||||||||
| 4,000,000 | 7.00 | 01/25/2028 | 3,581,760 | |||||
| $ 5,690,654 | ||||||||
| TOTAL
COLLATERALIZED MORTGAGE
OBLIGATIONS |
$ 34,426,468 | |||||||
| TOTAL
MORTGAGE BACKED
OBLIGATIONS |
||||||||
| (Cost $153,838,340) | $150,689,766 | |||||||
| Sovereign Credit – 0.9% | ||||||||
| Province of Quebec | ||||||||
| $2,485,000 | 7.50 | % | 07/15/2023 | $ 2,434,895 | ||||
| 320,000 | 5.74 | # | 03/02/2026 | 316,157 | ||||
| Province of Saskatchewan | ||||||||
| 275,000 | 8.50 | 07/15/2022 | 303,831 | |||||
| TOTAL SOVEREIGN CREDIT | ||||||||
| (Cost $3,249,070) | $ 3,054,883 | |||||||
| Principal
Amount |
Interest
Rate |
Maturity
Date |
Value | |||||
|---|---|---|---|---|---|---|---|---|
| U.S. Treasury Obligations – 5.6% | ||||||||
| United States Treasury Interest-Only Stripped Security· | ||||||||
| $ 2,600,000 | 6.35 | % | 05/15/2008 | $ 1,555,372 | ||||
| United States Treasury Principal-Only Stripped Securities° | ||||||||
| 11,880,000 | 8.00 | 11/15/2009 | 6,350,692 | |||||
| 4,550,000 | 6.15 | 05/15/2017 | 1,602,373 | |||||
| 2,500,000 | 6.08 | 05/15/2020 | 741,225 | |||||
| 7,410,000 | 5.93 | 08/15/2025 | 1,629,311 | |||||
| United States Treasury Bonds | ||||||||
| 310,000 | 7.50 | 11/15/2016 | 347,250 | |||||
| 2,390,000 | 8.75 | 08/15/2020 | 3,055,830 | |||||
| 2,000,000 | 7.88 | 02/15/2021 | 2,365,940 | |||||
| 45,000 | 6.13 | 08/15/2029 | 45,105 | |||||
| United States Treasury Notes | ||||||||
| 365,000 | 6.50 | 05/31/2002 | 363,690 | |||||
| 245,000 | 5.88 | 09/30/2002 | 240,712 | |||||
| 300,000 | 5.88 | 11/15/2004 | 292,077 | |||||
| 60,000 | 6.50 | 02/15/2010 | 61,191 | |||||
| TOTAL U.S. TREASURY OBLIGATIONS | ||||||||
| (Cost $18,565,551) | $ 18,650,768 | |||||||
| Repurchase Agreement – 7.6% | ||||||||
| Joint Repurchase Agreement AccountÙ | ||||||||
| $25,300,000 | 5.85 | % | 05/01/2000 | $ 25,300,000 | ||||
| TOTAL REPURCHASE AGREEMENT | ||||||||
| (Cost $25,300,000) | $ 25,300,000 | |||||||
| TOTAL INVESTMENTS | ||||||||
| (Cost $367,161,259) | $356,224,743 | |||||||
†
|
Securities are exempt from registration under Rule 144A
of the Securities Act of 1933. Such securities may be resold,
normally to qualified institutional buyers in transactions
exempt from registration. Total market value of Rule 144A
securities amounted to $12,563,583 as of April 30,
2000.
|
#
|
Variable rate security. Coupon rate disclosed is that
which is in effect at April 30, 2000.
|
a
|
TBA (To
Be Assigned) securities are purchased on a forward commitment
basis with an approximate (generally +/ -2.5%) principal
amount and no definite maturity date. The actual principal
amount and maturity date will be determined upon settlement
when the specific mortgage pools are assigned.
|
·
|
Represents security with notional or nominal principal
amount. The actual effective yield of this security is
different than the stated coupon due to amortization of
related premiums.
|
§
|
These
securities are issued with a zero coupon which increases to
the stated rate at a set date in the future.
|
°
|
This
security is issued with a zero coupon. The interest rate
disclosed for this security represents effective yield to
maturity.
|
Ù
|
A
portion of this security is segregated as collateral for
initial margin requirement on futures
transactions.
|
| The
percentage shown for each investment category reflects the
value of investments in that category as a percentage of net
assets.
|
| The
following graph shows the value as of April 30, 2000, of a
$10,000 investment made on September 1, 1991 in Class A shares
(with the maximum sales charge of 4.5%) of the Goldman Sachs
Global Income Fund. For comparative purposes, the performance
of the Fund’s benchmark (the J.P. Morgan Global
Government Bond Index hedged to U.S. Dollars (the “J.P.
Morgan GGB Index - $ Hedged”)) is shown. This performance
data represents past performance and should not be considered
indicative of future performance which will fluctuate with
changes in market conditions. These performance fluctuations
will cause an investor’s shares, when redeemed, to be
worth more or less than their original cost. Performance of
Class B, Class C, Institutional and Service shares will vary
from Class A due to differences in fees and loads.
|
| Global
Income Fund’s Lifetime Performance
|
| Growth of a
$10,000 Investment, Distributions Reinvested September 1, 1991
to April 30, 2000.(a)
|
| |
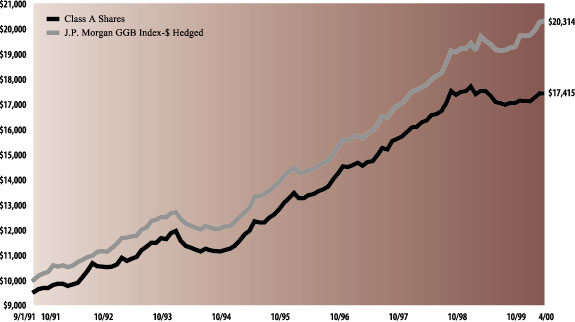
| Average Annual Total Return through April 30, 2000 | Since Inception | Five Years | One Year | Six Months (b) | |||||
|---|---|---|---|---|---|---|---|---|---|
| Class A shares (commenced August 2, 1991) | |||||||||
| Excluding sales charges | 7.27% | 7.95% | -0.53% | 2.16% | |||||
| Including sales charges | 6.70% | 6.96% | -5.00% | -2.42% | |||||
| Class B shares (commenced May 1, 1996) | |||||||||
| Excluding contingent deferred sales charges | 6.44% | n/a | -1.07% | 1.92% | |||||
| Including contingent deferred sales charges | 5.66% | n/a | -6.01% | -3.18% | |||||
| Class C shares (commenced August 15, 1997) | |||||||||
| Excluding contingent deferred sales charges | 5.03% | n/a | -1.10% | 1.91% | |||||
| Including contingent deferred sales charges | 5.03% | n/a | -2.08% | 0.89% | |||||
| Institutional shares (commenced August 1, 1995) | 8.38% | n/a | 0.06% | 2.43% | |||||
| Service shares (commenced March 12, 1997) | 5.99% | 8.02% | -0.50% | 2.18% | |||||
(a)
|
For
comparative purposes, initial investments are assumed to be
made on the first day of the month following commencement of
operations.
|
(b)
|
Not
annualized.
|
| Principal
AmountÎ |
Interest
Rate |
Maturity
Date |
Value | |||||
|---|---|---|---|---|---|---|---|---|
| Foreign Debt Obligations – 59.0% | ||||||||
| British Pound Sterling – 10.7% | ||||||||
| Abbey National Treasury | ||||||||
| GBP 4,000,000 | 8.00 | % | 04/02/2003 | $ 6,392,043 | ||||
| Eastern Electricity PLC | ||||||||
| 550,000 | 8.38 | 03/31/2004 | 882,824 | |||||
| General Motors Acceptance Corp. | ||||||||
| 450,000 | 6.50 | 03/23/2004 | 689,418 | |||||
| ICI Investments BV | ||||||||
| 1,600,000 | 7.63 | 08/21/2007 | 2,541,193 | |||||
| Lehman Brothers Holdings PLC | ||||||||
| 2,900,000 | 6.95 | 06/22/2004 | 4,432,982 | |||||
| Lloyds Bank PLC | ||||||||
| 2,900,000 | 7.75 | 06/18/2007 | 4,735,371 | |||||
| North American Capital Corp. | ||||||||
| 1,300,000 | 8.25 | 11/17/2003 | 2,045,025 | |||||
| Royal Bank of Scotland PLC | ||||||||
| 1,500,000 | 8.38 | 01/29/2007 | 2,497,739 | |||||
| United Kingdom Treasury | ||||||||
| 5,000,000 | 9.75 | 08/27/2002 | 8,372,153 | |||||
| 8,300,000 | 6.50 | 12/07/2003 | 13,171,661 | |||||
| 2,300,000 | 9.00 | 08/06/2012 | 4,821,208 | |||||
| 1,500,000 | 8.00 | 06/07/2021 | 3,392,207 | |||||
| 2,600,000 | 6.00 | 12/07/2028 | 5,075,069 | |||||
| Vodafone AirTouch PLC | ||||||||
| 1,500,000 | 7.50 | 03/19/2004 | 2,364,619 | |||||
| $ 61,413,512 | ||||||||
| Canadian Dollar – 2.0% | ||||||||
| Government of Canada | ||||||||
| CAD18,200,000 | 5.50 | % | 06/01/2009 | $ 11,718,347 | ||||
| Danish Krone – 1.6% | ||||||||
| Kingdom of Denmark | ||||||||
| DKK69,000,000 | 8.00 | % | 05/15/2003 | $ 9,015,317 | ||||
| Euro Currency – 22.2% | ||||||||
| Countrywide Home Loans, Inc. | ||||||||
| EUR 2,500,000 | 4.13 | % | 07/22/2002 | $ 2,212,749 | ||||
| Federal Republic of Germany | ||||||||
| 2,450,000 | 6.00 | 07/04/2007 | 2,311,874 | |||||
| General Motors Acceptance Corp. | ||||||||
| 4,800,000 | 5.00 | 01/18/2005 | 4,245,861 | |||||
| Government of France | ||||||||
| 31,000,000 | 3.50 | 07/12/2004 | 26,666,241 | |||||
| 42,800,000 | 4.00 | 10/25/2009 | 34,943,164 | |||||
| 800,000 | 8.50 | 04/25/2023 | 980,385 | |||||
| 5,500,000 | 5.50 | 04/25/2029 | 4,873,369 | |||||
| Republic of Italy | ||||||||
| 31,400,000 | 4.75 | 07/01/2005 | 27,940,571 | |||||
| 19,600,000 | 6.50 | 11/01/2027 | 19,244,078 | |||||
| Standard Chartered Bank PLC | ||||||||
| 1,449,000 | 5.38 | 05/06/2009 | 1,204,394 | |||||
| Tecnost International NV | ||||||||
| 2,200,000 | 5.38 | 07/30/2004 | 1,951,824 | |||||
| $126,574,510 | ||||||||
| Principal
AmountÎ |
Interest
Rate |
Maturity
Date |
Value | |||||
|---|---|---|---|---|---|---|---|---|
| Foreign Debt Obligations – (continued) | ||||||||
| German Mark – 1.5% | ||||||||
| Citicorp | ||||||||
| DEM 4,500,000 | 6.25 | % | 09/19/2009 | $ 2,059,439 | ||||
| 1,100,000 | 5.50 | 06/30/2010 | 472,394 | |||||
| Gallaher Group | ||||||||
| 10,300,000 | 5.88 | 08/06/2008 | 4,494,531 | |||||
| Royal Bank of Scotland PLC | ||||||||
| 3,700,000 | 5.25 | 07/22/2008 | 1,623,653 | |||||
| $ 8,650,017 | ||||||||
| Japanese Yen – 17.5% | ||||||||
| Asian Development Bank | ||||||||
| JPY1,300,000,000 | 5.63 | % | 02/18/2002 | $ 13,168,736 | ||||
| European Investment Bank | ||||||||
| 200,000,000 | 2.13 | 09/20/2007 | 1,918,656 | |||||
| Government of Japan | ||||||||
| 470,000,000 | 1.60 | 09/20/2005 | 4,434,792 | |||||
| 5,480,000,000 | 0.90 | 12/22/2008 | 47,229,924 | |||||
| 940,000,000 | 1.50 | 03/20/2019 | 7,790,247 | |||||
| International Bank for Reconstruction & Development | ||||||||
| 350,000,000 | 5.25 | 03/20/2002 | 3,539,305 | |||||
| 430,000,000 | 2.00 | 02/18/2008 | 4,133,175 | |||||
| Kingdom of Spain | ||||||||
| 220,000,000 | 4.75 | 03/14/2005 | 2,385,823 | |||||
| Oesterreichische Kontrollbank AG | ||||||||
| 180,000,000 | 1.80 | 03/22/2010 | 1,666,935 | |||||
| Republic of Italy | ||||||||
| 550,000,000 | 5.13 | 07/29/2003 | 5,806,685 | |||||
| 750,000,000 | 3.75 | 06/08/2005 | 7,810,061 | |||||
| $ 99,884,339 | ||||||||
| South African Rand – 1.7% | ||||||||
| Republic of South Africa | ||||||||
| ZAR 70,000,000 | 13.00 | % | 08/31/2010 | $ 9,487,160 | ||||
| Swedish Krona – 1.8% | ||||||||
| Kingdom of Sweden | ||||||||
| SEK 95,000,000 | 5.00 | % | 01/15/2004 | $ 10,484,626 | ||||
| TOTAL FOREIGN DEBT OBLIGATIONS | ||||||||
| (Cost $359,309,873) | $337,227,828 | |||||||
| Asset-Backed Securities – 2.7% | ||||||||
| Auto – 0.6% | ||||||||
| ALAC Automobile Receivables Trust Series 1997-1, Class A† | ||||||||
| USD 92,662 | 6.29 | % | 12/15/2002 | $ 92,266 | ||||
| Americredit Automobile Receivables Trust Series 1997-D,
Class A3 |
||||||||
| 446,175 | 6.24 | 09/05/2003 | 442,802 | |||||
| Arcadia Automobile Receivables Series 1999-C, Class A3 | ||||||||
| 1,087,562 | 7.20 | 06/15/2007 | 1,089,261 | |||||
| Rental Car Finance Corp. Series 1997-1, Class A2† | ||||||||
| 2,000,000 | 6.45 | 08/25/2005 | 1,948,980 | |||||
| $ 3,573,309 | ||||||||
| Principal
AmountÎ |
Interest
Rate |
Maturity
Date |
Value | |||||
|---|---|---|---|---|---|---|---|---|
| Asset-Backed Securities – (continued) | ||||||||
| Credit Card – 0.4% | ||||||||
| Citibank Credit Card Master Trust I Series 1998-3, Class A | ||||||||
| USD1,000,000 | 5.80 | % | 02/07/2005 | $ 959,370 | ||||
| Fingerhut Master Trust Series 1998-2, Class A | ||||||||
| 1,000,000 | 6.23 | 02/15/2007 | 961,860 | |||||
| $ 1,921,230 | ||||||||
| Home Equity – 0.9% | ||||||||
| American Business Financial Services Series 1998-2, Class A6 | ||||||||
| USD2,250,000 | 6.46 | % | 09/25/2029 | $ 2,113,242 | ||||
| BankBoston Home Equity Loan Trust Series 1998-2, Class A7 | ||||||||
| 1,750,000 | 6.14 | 06/25/2013 | 1,650,196 | |||||
| Saxon Asset Securities Trust Series 1998-1, Class AF6 | ||||||||
| 1,500,000 | 6.52 | 11/25/2027 | 1,432,500 | |||||
| $ 5,195,938 | ||||||||
| Lease – 0.3% | ||||||||
| AESOP Funding II LLC Series 1998-1, Class A† | ||||||||
| USD1,000,000 | 6.14 | % | 05/20/2006 | $ 938,150 | ||||
| First Sierra Receivables Series 1998-1, Class A4 | ||||||||
| 900,000 | 5.63 | 08/12/2004 | 867,185 | |||||
| $ 1,805,335 | ||||||||
| Manufactured Housing – 0.2% | ||||||||
| Mid-State Trust Series 4, Class A | ||||||||
| USD1,155,173 | 8.33 | % | 04/01/2030 | $ 1,140,167 | ||||
| Student Loans – 0.3% | ||||||||
| Union Financial Services Series 1998-A, Class A9 | ||||||||
| USD2,000,000 | 5.73 | % | 12/01/2005 | $ 1,844,745 | ||||
| TOTAL ASSET-BACKED SECURITIES | ||||||||
| (Cost $16,139,372) | $15,480,724 | |||||||
| Corporate Bonds – 12.9% | ||||||||
| Aerospace/Defense – 0.1% | ||||||||
| Raytheon Co. | ||||||||
| USD 85,000 | 6.30 | % | 08/15/2000 | $ 84,832 | ||||
| 310,000 | 5.70 | 11/01/2003 | 287,482 | |||||
| $ 372,314 | ||||||||
| Airlines – 0.2% | ||||||||
| Continental Airlines, Inc. | ||||||||
| USD 283,273 | 6.54 | % | 09/15/2009 | $ 265,699 | ||||
| Northwest Airlines, Inc. | ||||||||
| 237,073 | 8.07 | 01/02/2015 | 226,353 | |||||
| 230,190 | 8.97 | 01/02/2015 | 229,681 | |||||
| 263,556 | 7.67 | 07/02/2016 | 252,929 | |||||
| $ 974,662 | ||||||||
| Automotive – 1.6% | ||||||||
| Chrysler Financial Corp. | ||||||||
| USD 445,000 | 6.09 | % | 04/06/2001 | $ 441,213 | ||||
| Principal
AmountÎ |
Interest
Rate |
Maturity
Date |
Value | |||||
|---|---|---|---|---|---|---|---|---|
| Corporate Bonds – continued | ||||||||
| Automotive – (continued) | ||||||||
| Ford Motor Credit Co. | ||||||||
| USD 135,000 | 7.25 | % | 01/15/2003 | $ 133,516 | ||||
| 5,000,000 | 6.13 | 04/28/2003 | 4,798,800 | |||||
| 185,000 | 5.75 | 02/23/2004 | 172,920 | |||||
| General Motors Acceptance Corp. | ||||||||
| 2,500,000 | 5.50 | 01/14/2002 | 2,412,250 | |||||
| 770,000 | 5.75 | 11/10/2003 | 723,384 | |||||
| The Hertz Corp. | ||||||||
| 485,000 | 6.70 | 06/15/2002 | 474,927 | |||||
| 250,000 | 6.00 | 01/15/2003 | 238,215 | |||||
| $9,395,225 | ||||||||
| Automotive Parts – 0.5% | ||||||||
| The Pep Boys-Manny, Moe & Jack | ||||||||
| USD 480,000 | 6.75 | % | 03/10/2004 | $ 396,355 | ||||
| TRW, Inc.† | ||||||||
| 375,000 | 6.63 | 06/01/2004 | 352,964 | |||||
| 2,000,000 | 7.13 | 06/01/2009 | 1,825,338 | |||||
| $2,574,657 | ||||||||
| Building Materials – 0.1% | ||||||||
| Owens Corning | ||||||||
| USD 375,000 | 7.50 | % | 05/01/2005 | $ 345,056 | ||||
| Commercial Banks – 1.5% | ||||||||
| Bank of America Corp. | ||||||||
| USD 320,000 | 7.75 | % | 07/15/2002 | $ 321,213 | ||||
| 300,000 | 9.20 | 05/15/2003 | 311,937 | |||||
| 2,000,000 | 6.63 | 06/15/2004 | 1,930,300 | |||||
| 200,000 | 6.38 | 05/15/2005 | 189,074 | |||||
| 150,000 | 7.25 | 10/15/2025 | 136,188 | |||||
| Citicorp | ||||||||
| 300,000 | 8.00 | 02/01/2003 | 303,267 | |||||
| DBS Group Holdings Ltd. | ||||||||
| 4,000,000 | 7.88 | 08/10/2009 | 3,902,000 | |||||
| Dime Bancorp, Inc. | ||||||||
| 215,000 | 6.38 | 01/30/2001 | 212,790 | |||||
| First Union Corp. | ||||||||
| 200,000 | 7.10 | 08/15/2004 | 195,622 | |||||
| Long Island Savings Bank | ||||||||
| 300,000 | 7.00 | 06/13/2002 | 293,247 | |||||
| The Money Store, Inc. | ||||||||
| 225,000 | 7.30 | 12/01/2002 | 223,472 | |||||
| Wells Fargo & Co. | ||||||||
| 360,000 | 6.63 | 07/15/2004 | 346,503 | |||||
| $8,365,613 | ||||||||
| Conglomerates – 1.4% | ||||||||
| Rothmans Nederland Holdings BV | ||||||||
| USD3,300,000 | 6.50 | % | 05/06/2003 | $3,089,460 | ||||
| Tyco International Group SA | ||||||||
| 385,000 | 5.88 | 11/01/2004 | 353,927 | |||||
| 190,000 | 6.38 | 06/15/2005 | 176,740 | |||||
| 5,120,000 | 6.13 | 04/04/2007 | 4,586,169 | |||||
| $8,206,296 | ||||||||
| Principal
AmountÎ |
Interest
Rate |
Maturity
Date |
Value | |||||
|---|---|---|---|---|---|---|---|---|
| Corporate Bonds – (continued) | ||||||||
| Consumer Cyclicals – 0.0% | ||||||||
| Cendant Corp. | ||||||||
| USD 200,000 | 7.75 | % | 12/01/2003 | $ 194,908 | ||||
| Credit Card Banks – 0.2% | ||||||||
| Capital One Bank | ||||||||
| USD 275,000 | 6.39 | % | 03/05/2001 | $ 272,739 | ||||
| 250,000 | 6.48 | 01/28/2002 | 244,358 | |||||
| 180,000 | 6.48 | 06/28/2002 | 174,055 | |||||
| Providian National Bank | ||||||||
| 250,000 | 6.65 | 02/01/2004 | 235,660 | |||||
| $ 926,812 | ||||||||
| Electric – 0.1% | ||||||||
| Mid American Energy Holdings Corp. | ||||||||
| USD 180,000 | 7.23 | % | 09/15/2005 | $ 172,110 | ||||
| Niagara Mohawk Power Corp. | ||||||||
| 250,000 | 6.88 | 04/01/2003 | 242,193 | |||||
| 275,000 | 8.00 | 06/01/2004 | 272,742 | |||||
| Salton Sea Funding Corp. | ||||||||
| 15,750 | 7.02 | 05/30/2000 | 15,750 | |||||
| $ 702,795 | ||||||||
| Energy – 0.2% | ||||||||
| Norsk Hydro ASA | ||||||||
| USD 60,000 | 7.15 | % | 01/15/2029 | $ 54,052 | ||||
| Occidental Petroleum Corp. | ||||||||
| 115,000 | 6.50 | 04/01/2005 | 106,782 | |||||
| 75,000 | 7.65 | 02/15/2006 | 73,079 | |||||
| 90,000 | 7.20 | 04/01/2028 | 76,250 | |||||
| The Williams Cos., Inc. | ||||||||
| 200,000 | 6.13 | 02/01/2001 | 198,062 | |||||
| 390,000 | 6.13 | 02/15/2012 | 379,529 | |||||
| Tosco Corp. | ||||||||
| 200,000 | 8.13 | 02/15/2030 | 191,502 | |||||
| $ 1,079,256 | ||||||||
| Environmental – 0.1% | ||||||||
| Republic Services, Inc. | ||||||||
| USD 430,000 | 6.63 | % | 05/15/2004 | $ 389,825 | ||||
| Finance Companies – 1.2% | ||||||||
| Associates Corp. of North America | ||||||||
| USD 750,000 | 5.75 | % | 11/01/2003 | $ 705,530 | ||||
| Beneficial Corp. | ||||||||
| 500,000 | 6.43 | 04/10/2002 | 490,715 | |||||
| Comdisco, Inc. | ||||||||
| 450,000 | 6.13 | 01/15/2003 | 428,022 | |||||
| Household Financial Corp. | ||||||||
| 4,000,000 | 6.00 | 05/01/2004 | 3,765,120 | |||||
| MEPC Finance, Inc. | ||||||||
| 1,500,000 | 7.50 | 05/01/2003 | 1,486,680 | |||||
| $ 6,876,067 | ||||||||
| Principal
AmountÎ |
Interest
Rate |
Maturity
Date |
Value | |||||
|---|---|---|---|---|---|---|---|---|
| Corporate Bonds – (continued) | ||||||||
| Food – 0.1% | ||||||||
| Nabisco, Inc. # | ||||||||
| USD 700,000 | 6.00 | % | 02/15/2001 | $ 682,164 | ||||
| Industrial-Other – 0.0% | ||||||||
| AMETEK, Inc. | ||||||||
| USD 130,000 | 7.20 | % | 07/15/2008 | $ 115,595 | ||||
| Insurance Companies – 0.4% | ||||||||
| American General Finance Corp. | ||||||||
| USD 490,000 | 5.75 | % | 11/01/2003 | $ 459,561 | ||||
| Conseco, Inc. | ||||||||
| 225,000 | 8.50 | 10/15/2002 | 139,500 | |||||
| Prudential Insurance Co. of America | ||||||||
| 1,900,000 | 6.38 | 07/23/2006 | 1,735,840 | |||||
| $2,334,901 | ||||||||
| Media-Cable – 0.2% | ||||||||
| Time Warner Entertainment Co. | ||||||||
| USD 900,000 | 9.63 | % | 05/01/2002 | $ 928,413 | ||||
| Time Warner, Inc. | ||||||||
| 250,000 | 6.85 | 01/15/2026 | 242,218 | |||||
| $1,170,631 | ||||||||
| Media-Non Cable – 0.4% | ||||||||
| CBS Corp. | ||||||||
| USD 170,000 | 6.88 | % | 09/01/2003 | $ 164,779 | ||||
| J. Seagram & Sons, Inc. | ||||||||
| 175,000 | 6.25 | 12/15/2001 | 170,419 | |||||
| News America Holdings, Inc. | ||||||||
| 400,000 | 8.50 | 02/15/2005 | 404,460 | |||||
| 140,000 | 8.00 | 10/17/2016 | 130,602 | |||||
| 200,000 | 7.43 | 10/01/2026 | 192,120 | |||||
| 100,000 | 7.13 | 04/08/2028 | 84,840 | |||||
| PanAmSat Corp. | ||||||||
| 330,000 | 6.13 | 01/15/2005 | 294,241 | |||||
| Paramount Communications, Inc. | ||||||||
| 300,000 | 7.50 | 01/15/2002 | 297,834 | |||||
| Viacom, Inc. | ||||||||
| 450,000 | 7.75 | 06/01/2005 | 446,017 | |||||
| $2,185,312 | ||||||||
| Mortgage Banks – 0.2% | ||||||||
| Countrywide Home Loans, Inc. | ||||||||
| USD 450,000 | 6.45 | % | 02/27/2003 | $ 435,942 | ||||
| 200,000 | 6.84 | 10/22/2004 | 193,004 | |||||
| Homeside Lending, Inc. | ||||||||
| 400,000 | 6.20 | 05/15/2003 | 381,564 | |||||
| $1,010,510 | ||||||||
| Principal
AmountÎ |
Interest
Rate |
Maturity
Date |
Value | |||||
|---|---|---|---|---|---|---|---|---|
| Corporate Bonds – (continued) | ||||||||
| REIT – 0.2% | ||||||||
| Chelsea GCA Realty, Inc. | ||||||||
| USD250,000 | 7.75 | % | 01/26/2001 | $ 248,255 | ||||
| Developers Diversified Realty Corp. | ||||||||
| 125,000 | 6.84 | 12/16/2004 | 113,882 | |||||
| Liberty Property LP | ||||||||
| 235,000 | 6.97 | 12/11/2003 | 222,853 | |||||
| Simon Property Group LP | ||||||||
| 450,000 | 6.63 | 06/15/2003 | 425,879 | |||||
| $1,010,869 | ||||||||
| Retailers – 0.1% | ||||||||
| Federated Department Stores, Inc. | ||||||||
| USD350,000 | 8.13 | % | 10/15/2002 | $ 354,379 | ||||
| Sears Roebuck Acceptance Corp. | ||||||||
| 240,000 | 6.72 | 09/17/2003 | 232,951 | |||||
| $ 587,330 | ||||||||
| Supermarkets – 0.1% | ||||||||
| Fred Meyer, Inc. | ||||||||
| USD325,000 | 7.38 | % | 03/01/2005 | $ 315,156 | ||||
| Safeway, Inc. | ||||||||
| 315,000 | 5.88 | 11/15/2001 | 306,882 | |||||
| 170,000 | 6.05 | 11/15/2003 | 161,169 | |||||
| $ 783,207 | ||||||||
| Telecommunications – 1.1% | ||||||||
| 360 Communications Co. | ||||||||
| USD300,000 | 7.13 | % | 03/01/2003 | $ 295,362 | ||||
| Ameritech Capital Funding | ||||||||
| 2,500,000 | 5.88 | 02/19/2003 | 2,392,500 | |||||
| Bellsouth Capital Funding Corp. | ||||||||
| 250,000 | 7.88 | 02/15/2030 | 251,260 | |||||
| Cable & Wireless Communications PLC | ||||||||
| 565,000 | 6.38 | 03/06/2003 | 555,898 | |||||
| MCI WorldCom, Inc. | ||||||||
| 405,000 | 6.13 | 08/15/2001 | 399,261 | |||||
| 380,000 | 6.40 | 08/15/2005 | 359,773 | |||||
| Metronet Communications Corp.§ | ||||||||
| 240,000 | 0.00/9.95 | 06/15/2008 | 187,200 | |||||
| Sprint Capital Corp. | ||||||||
| 650,000 | 5.88 | 05/01/2004 | 611,045 | |||||
| Tele-Communications, Inc. | ||||||||
| 280,000 | 8.25 | 01/15/2003 | 286,401 | |||||
| Telecom de Puerto Rico† | ||||||||
| 135,000 | 6.15 | 05/15/2002 | 130,284 | |||||
| 155,000 | 6.65 | 05/15/2006 | 143,981 | |||||
| US West Capital Funding, Inc.† | ||||||||
| 400,000 | 6.88 | 08/15/2001 | 396,836 | |||||
| 150,000 | 6.88 | 07/15/2028 | 128,685 | |||||
| Vodafone AirTouch PLC† | ||||||||
| 360,000 | 7.75 | 02/15/2010 | 361,822 | |||||
| $6,500,308 | ||||||||
| Principal
AmountÎ |
Interest
Rate |
Maturity Date | Value | |||||
|---|---|---|---|---|---|---|---|---|
| Corporate Bonds – (continued) | ||||||||
| Tobacco – 0.6% | ||||||||
| Imperial Tobacco Overseas BV | ||||||||
| USD 2,800,000 | 7.13 | % | 04/01/2009 | $ 2,447,200 | ||||
| Philip Morris Cos., Inc. | ||||||||
| 180,000 | 9.00 | 01/01/2001 | 180,039 | |||||
| 100,000 | 8.75 | 06/01/2001 | 99,649 | |||||
| 350,000 | 7.50 | 04/01/2004 | 333,060 | |||||
| 95,000 | 6.95 | 06/01/2006 | 93,855 | |||||
| R.J. Reynolds Tobacco Holdings, Inc.† | ||||||||
| 285,000 | 7.38 | 05/15/2003 | 251,911 | |||||
| $ 3,405,714 | ||||||||
| Yankee Banks – 2.3% | ||||||||
| Asian Development Bank | ||||||||
| USD 4,000,000 | 5.82 | % | 06/16/2008 | $ 3,632,480 | ||||
| Bayerische Landesbank Girozentrale | ||||||||
| 250,000 | 5.88 | 12/01/2008 | 221,757 | |||||
| Merita Bank Ltd. | ||||||||
| 3,010,000 | 6.50 | 04/01/2009 | 2,717,272 | |||||
| National Westminster Bank PLC | ||||||||
| 3,800,000 | 7.38 | 10/01/2009 | 3,638,424 | |||||
| Nordbanken AB†# | ||||||||
| 1,200,000 | 8.95 | 11/29/2049 | 1,172,248 | |||||
| Sparebanken Rogaland†# | ||||||||
| 1,800,000 | 9.20 | 08/18/2009 | 1,812,017 | |||||
| 13,194,198 | ||||||||
| TOTAL CORPORATE BONDS | ||||||||
| (Cost $77,234,051) | $73,384,225 | |||||||
| Mortgage Backed Obligations – 4.8% | ||||||||
| Federal Home Loan Mortgage Corp. (FHLMC) – 0.3% | ||||||||
| USD 930,604 | 6.00 | % | 06/01/2014 | $ 872,143 | ||||
| 994,905 | 6.00 | 11/01/2028 | 901,633 | |||||
| $ 1,773,776 | ||||||||
| Federal National Mortgage Association (FNMA) – 0.4% | ||||||||
| USD 83,710 | 6.00 | % | 01/01/2029 | $ 75,783 | ||||
| 159,999 | 6.00 | 04/01/2029 | 144,849 | |||||
| 740,151 | 6.00 | 05/01/2029 | 670,067 | |||||
| 599,999 | 6.00 | 09/01/2029 | 543,185 | |||||
| 1,000,000 | 6.00 | TBA-30 yr® | 905,000 | |||||
| $ 2,338,884 | ||||||||
| Government National Mortgage Association (GNMA) – 1.3% | ||||||||
| USD 67,511 | 9.00 | % | 03/15/2005 | $ 68,629 | ||||
| 98,632 | 9.00 | 02/15/2006 | 100,235 | |||||
| 324,986 | 9.00 | 02/15/2010 | 330,166 | |||||
| 662,115 | 6.00 | 01/15/2011 | 630,631 | |||||
| 489,730 | 7.00 | 07/15/2023 | 473,201 | |||||
| 527,137 | 7.00 | 08/15/2023 | 509,346 | |||||
| 291,750 | 7.00 | 09/15/2023 | 281,904 | |||||
| 392,754 | 7.00 | 10/15/2023 | 379,499 | |||||
| 216,434 | 7.00 | 11/15/2023 | 209,129 | |||||
| Principal
Amount€ |
Interest
Rate |
Maturity
Date |
Value | |||||
|---|---|---|---|---|---|---|---|---|
| Mortgage Backed Obligations – (continued) | ||||||||
| Government National Mortgage Association (GNMA) – (continued) | ||||||||
| USD 1,422,386 | 6.00 | % | 11/15/2028 | $ 1,291,697 | ||||
| 3,270,936 | 6.00 | 12/15/2028 | 2,970,402 | |||||
| 26,571 | 6.50 | 01/15/2029 | 24,912 | |||||
| $ 7,269,751 | ||||||||
| Collateralized Mortgage Obligations – 2.8% | ||||||||
| Inverse Floater# – 0.3% | ||||||||
| FNMA Remic Trust Series 1993-164, Class SD | ||||||||
| USD 500,000 | 5.51 | % | 09/25/2008 | $ 426,435 | ||||
| FNMA Remic Trust Series 1994-13, Class SH | ||||||||
| 962,660 | 5.68 | 02/25/2009 | 844,128 | |||||
| GE Capital Mortgage Services, Inc. Series 1994-2, Class A9 | ||||||||
| 564,879 | 3.96 | 01/25/2009 | 513,418 | |||||
| $ 1,783,981 | ||||||||
| Non-Agency CMOs – 1.0% | ||||||||
| Asset Securitization Corp. Series 1997-D5, Class A1B | ||||||||
| USD 450,000 | 6.66 | % | 02/14/2041 | $ 430,075 | ||||
| Chase
Commercial Mortgage Securities Corp. Series 1997-1,
Class A2 |
||||||||
| 300,000 | 7.37 | 02/19/2007 | 295,041 | |||||
| Chase
Commercial Mortgage Securities Corp. Series 1997-2
Class A2 |
||||||||
| 2,300,000 | 6.60 | 11/19/2007 | 2,163,863 | |||||
| Commercial Mortgage Asset Trust Series 1999-C1, Class A3 | ||||||||
| 250,000 | 6.64 | 09/17/2010 | 232,195 | |||||
| First
Union Commercial Mortgage Trust Series 1999-C1,
Class A2 |
||||||||
| 1,500,000 | 6.07 | 10/15/2008 | 1,349,452 | |||||
| First
Union-Lehman Brothers Commercial Mortgage Services
Series 1997-C1, Class A2 |
||||||||
| 200,000 | 7.30 | 12/18/2006 | 197,394 | |||||
| GMAC
Commercial Mortgage Securities, Inc. Series 1997-C1,
Class A2 |
||||||||
| 450,000 | 6.85 | 09/15/2006 | 437,048 | |||||
| Merrill
Lynch Mortgage Investors, Inc. Series 1998-C2
Class A2 |
||||||||
| 750,000 | 6.39 | 02/15/2030 | 693,825 | |||||
| $ 5,798,893 | ||||||||
| Regular Floater CMOs# – 0.3% | ||||||||
| FNMA Series 1993-203, Class FA | ||||||||
| USD 1,804,343 | 7.41 | % | 10/25/2023 | $ 1,827,462 | ||||
| Sequential Fixed Rate CMOs – 0.5% | ||||||||
| FHLMC Series 2152, Class AB | ||||||||
| USD 2,842,645 | 6.25 | % | 01/15/2026 | $ 2,683,173 | ||||
| Support – 0.5% | ||||||||
| GE Capital Mortgage Services, Inc. Series 1994-6, Class A9 | ||||||||
| USD 3,078,266 | 6.50 | % | 09/25/2022 | $ 2,904,744 | ||||
| Target Amortization Class (TAC) – 0.2% | ||||||||
| Countrywide Funding Corp. Series 1994-2, Class A10A | ||||||||
| USD 1,000,000 | 6.50 | % | 02/25/2009 | $ 962,500 | ||||
| Principal
Amount€ |
Interest
Rate |
Maturity
Date |
Value | |||||
|---|---|---|---|---|---|---|---|---|
| Mortgage Backed Obligations – (continued) | ||||||||
| TOTAL COLLATERALIZED MORTGAGE | ||||||||
| OBLIGATIONS | $15,960,753 | |||||||
| TOTAL MORTGAGE BACKED OBLIGATIONS | ||||||||
| (Cost $28,579,645) | $27,343,164 | |||||||
| Sovereign Credit – 0.1% | ||||||||
| Province of Quebec | ||||||||
| USD 585,000 | 7.50 | % | 07/15/2023 | $ 573,205 | ||||
| 80,000 | 5.74 | # | 03/02/2026 | 79,039 | ||||
| Province of Saskatchewan | ||||||||
| 65,000 | 8.50 | 07/15/2022 | 71,815 | |||||
| TOTAL SOVEREIGN CREDIT | ||||||||
| (Cost $779,205) | $ 724,059 | |||||||
| U.S. Treasury Obligations – 16.9% | ||||||||
| United States Inflation-Indexed Treasury Note | ||||||||
| USD 5,874,232 | 3.63 | % | 01/15/2008 | $ 5,723,675 | ||||
| United States Treasury Interest-Only Stripped Security· | ||||||||
| 400,000 | 6.28 | 02/15/2014 | 167,892 | |||||
| United States Treasury Principal-Only Stripped Securities° | ||||||||
| 1,520,000 | 8.00 | 11/15/2009 | 812,546 | |||||
| 2,500,000 | 6.15 | 05/15/2017 | 880,425 | |||||
| 3,690,000 | 6.13 | 11/15/2018 | 1,190,763 | |||||
| 6,760,000 | 6.08 | 05/15/2020 | 2,004,273 | |||||
| 1,200,000 | 5.93 | 08/15/2025 | 263,856 | |||||
| 1,500,000 | 5.92 | 02/15/2026 | 320,895 | |||||
| 1,000,000 | 5.89 | 08/15/2026 | 209,200 | |||||
| 2,170,000 | 6.19 | 11/15/2026 | 430,441 | |||||
| United States Treasury Bonds | ||||||||
| 4,000,000 | 6.75 | 08/15/2026 | 4,272,480 | |||||
| 10,900,000 | 6.13 | 11/15/2027 | 10,784,133 | |||||
| 12,000,000 | 5.25 | 02/15/2029 | 10,541,280 | |||||
| 2,700,000 | 6.13 | 08/15/2029 | 2,706,318 | |||||
| 1,700,000 | 6.25 | 05/15/2030 | 1,766,929 | |||||
| United States Treasury Notes | ||||||||
| 36,300,000 | 5.88 | 11/15/2004 | 35,341,317 | |||||
| 7,400,000 | 4.75 | 11/15/2008 | 6,607,978 | |||||
| 12,800,000 | 6.00 | 08/15/2009 | 12,503,936 | |||||
| TOTAL U.S. TREASURY OBLIGATIONS | ||||||||
| (Cost $95,885,841) | $96,528,337 | |||||||
| Principal
Amount€ |
Interest
Rate |
Maturity
Date |
Value | |||||
|---|---|---|---|---|---|---|---|---|
| Short-Term Obligation – 2.7% | ||||||||
| State Street Bank & Trust Euro-Time Deposit Ù | ||||||||
| USD15,370,000 | 6.00 | % | 05/01/2000 | $ 15,370,000 | ||||
| TOTAL SHORT-TERM OBLIGATION | ||||||||
| (Cost $15,370,000) | $ 15,370,000 | |||||||
| TOTAL INVESTMENTS | ||||||||
| (Cost $593,297,987) | $566,058,337 | |||||||
Î
|
The
principal amount of each security is stated in the currency in
which the bond is denominated. See below.
|
CAD
|
= Canadian Dollar
|
DKK
|
= Danish Krone
|
DEM
|
= German Mark
|
EUR
|
= Euro Currency
|
GBP
|
= Great Britain Pound
|
JPY
|
= Japanese Yen
|
SEK
|
= Swedish Krona
|
USD
|
= United States Dollar
|
ZAR
|
= South African Rand
|
†
|
Securities are exempt from registration under Rule 144A
of the Securities Act of 1933. Such securities may be resold,
normally to qualified institutional buyers in transactions
exempt from registration. Total market value of Rule 144A
securities amounted to $9,555,482 as of April 30,
2000.
|
#
|
Variable rate security. Coupon rate disclosed is that
which is in effect at April 30, 2000.
|
a
|
TBA (To
Be Assigned) securities are purchased on a forward commitment
basis with an approximate (generally +/-2.5%) principal amount
and no definite maturity date. The actual principal amount and
maturity date will be determined upon settlement when the
specific mortgage pools are assigned.
|
§
|
These
securities are issued with a zero coupon rate which increases
to the stated rate at a set date in the future.
|
·
|
Represents security with notional or nominal amount.
The actual effective yield of this security is different than
the stated coupon due to the amortization of related
premiums.
|
°
|
Security is issued with a zero coupon. The interest
rate disclosed for this security represents effective yield to
maturity.
|
Ù
|
A
portion of this security is segregated as collateral for
initial margin requirement on futures
transactions.
|
| The
percentage shown for each investment category reflects the
value of investments in that category as a percentage of net
assets.
|
| Adjustable Rate
Government Fund |
|||||||
|---|---|---|---|---|---|---|---|
| Assets: | |||||||
| Investment in securities, at value (identified cost
$244,578,606, $180,601,669, $119,681,016, $367,161,259, and
$593,297,987, respectively) |
$241,014,509 | ||||||
| Cash, at value | 41,807 | ||||||
| Receivables: | |||||||
| Investment securities sold | 973,134 | ||||||
| Interest, at value | 1,706,480 | ||||||
| Fund shares sold | 5,049,990 | ||||||
| Forward foreign currency exchange contracts | — | ||||||
| Variation margin | — | ||||||
| Reimbursement from adviser | 15,959 | ||||||
| Other assets | 5,768 | ||||||
| Total assets | 248,807,647 | ||||||
| Liabilities: | |||||||
| Due to Bank | — | ||||||
| Payables: | |||||||
| Investment securities purchased | — | ||||||
| Income distribution | 726,217 | ||||||
| Fund shares repurchased | 127,171 | ||||||
| Amounts owed to affiliates | 97,659 | ||||||
| Forward foreign currency exchange contracts | — | ||||||
| Variation margin | 22,584 | ||||||
| Forward sale contract, at value | — | ||||||
| Accrued expenses and other liabilities | 53,696 | ||||||
| Total liabilities | 1,027,327 | ||||||
| Net Assets: | |||||||
| Paid-in capital | 303,267,750 | ||||||
| Accumulated undistributed net investment income | 74,192 | ||||||
| Accumulated net realized gain (loss) on investment, futures and foreign currency related transactions | (51,791,514 | ) | |||||
| Net unrealized loss on investments, futures and translation of assets and liabilities denominated in foreign currencies | (3,770,108 | ) | |||||
| NET ASSETS | $247,780,320 | ||||||
| Net asset value, offering and redemption price per share (a) | |||||||
| Class A | $9.63 | ||||||
| Class B | — | ||||||
| Class C | — | ||||||
| Institutional | $9.64 | ||||||
| Service | $9.64 | ||||||
| Shares outstanding: | |||||||
| Class A | 2,053,193 | ||||||
| Class B | — | ||||||
| Class C | — | ||||||
| Institutional | 23,648,708 | ||||||
| Service | 418 | ||||||
| Total shares outstanding, $.001 par value (unlimited number of shares authorized) | 25,702,319 | ||||||
(a)
|
Maximum
public offering price per share for Class A shares of
Adjustable Rate Government (NAV per share multiplied by
1.0152), for Class A shares of Short Duration Government (NAV
per share multiplied by $1.0204), for Class A shares of
Government Income, Core Fixed Income, and Global Income (NAV
per share multiplied by 1.0471) is $9.78, $9.58, $14.16,
$9.78, and $15.18, respectively. At redemption, Class B and
Class C shares may be subject to a contingent sales charge,
assessed on the amount equal to the lesser of the current net
asset value or the original purchase price of the
shares.
|
| Short
Duration
Government Fund |
Government
Income Fund |
Core Fixed
Income Fund |
Global
Income Fund |
||||||||||||||||
|---|---|---|---|---|---|---|---|---|---|---|---|---|---|---|---|---|---|---|---|
| $175,469,889 | $116,997,074 | $356,224,743 | $566,058,337 | ||||||||||||||||
| — | 32,141 | 75,035 | 872,330 | ||||||||||||||||
| 13,743,246 | 14,895,849 | 34,483,161 | 12,732,027 | ||||||||||||||||
| 1,507,694 | 894,667 | 3,751,343 | 10,888,705 | ||||||||||||||||
| 116,695 | 256,001 | 839,841 | 1,586,790 | ||||||||||||||||
| — | — | — | 5,144,613 | ||||||||||||||||
| — | 18,641 | 123,474 | 2,009,214 | ||||||||||||||||
| 25,890 | 24,755 | 3,929 | 50,575 | ||||||||||||||||
| 18,746 | 15,069 | 26,576 | 33,342 | ||||||||||||||||
| 190,882,060 | 133,134,197 | 395,528,102 | 599,375,933 | ||||||||||||||||
| 1,048,930 | — | — | — | ||||||||||||||||
| 7,802,218 | 19,459,179 | 51,608,844 | 24,036,559 | ||||||||||||||||
| 377,815 | 68,203 | 543,469 | — | ||||||||||||||||
| 1,994,129 | 249,254 | 311,539 | 1,580,773 | ||||||||||||||||
| 106,677 | 98,140 | 160,833 | 489,932 | ||||||||||||||||
| — | — | — | 905,750 | ||||||||||||||||
| 97,422 | — | — | — | ||||||||||||||||
| — | 4,581,257 | 11,323,290 | 814,636 | ||||||||||||||||
| 41,256 | 64,423 | 101,984 | 151,563 | ||||||||||||||||
| 11,468,447 | 24,520,456 | 64,049,959 | 27,979,213 | ||||||||||||||||
| 203,234,388 | 115,562,532 | 351,213,201 | 582,723,655 | ||||||||||||||||
| 219,755 | 52,208 | 182,408 | 2,344,351 | ||||||||||||||||
| (17,628,079) | (4,439,562 | ) | (9,373,858 | ) | 9,322,551 | ||||||||||||||
| (6,412,451) | (2,561,437 | ) | (10,543,608 | ) | (22,993,837 | ) | |||||||||||||
| $179,413,613 | $108,613,741 | $331,478,143 | $571,396,720 | ||||||||||||||||
| $9.39 | $13.52 | $9.34 | $14.50 | ||||||||||||||||
| $9.37 | $13.53 | $9.37 | $14.46 | ||||||||||||||||
| $9.35 | $13.52 | $9.37 | $14.44 | ||||||||||||||||
| $9.38 | $13.51 | $9.36 | $14.48 | ||||||||||||||||
| $9.37 | $13.50 | $9.37 | $14.47 | ||||||||||||||||
| 3,853,658 | 5,632,580 | 7,427,254 | 18,227,310 | ||||||||||||||||
| 621,647 | 1,306,663 | 1,420,286 | 1,308,358 | ||||||||||||||||
| 632,667 | 505,896 | 646,866 | 444,271 | ||||||||||||||||
| 13,259,972 | 561,480 | 25,061,574 | 19,334,684 | ||||||||||||||||
| 760,163 | 25,946 | 863,585 | 123,972 | ||||||||||||||||
| 19,128,107 | 8,032,565 | 35,419,565 | 39,438,595 | ||||||||||||||||
| Adjustable
Rate
Government Fund |
|||||||||
|---|---|---|---|---|---|---|---|---|---|
| Investment income: | |||||||||
| Interest (a) | $9,112,418 | ||||||||
| Total income | 9,112,418 | ||||||||
| Expenses: | |||||||||
| Management fees | 578,038 | ||||||||
| Distribution and Service fees (b) | 25,670 | ||||||||
| Transfer Agent fees (c) | 73,206 | ||||||||
| Custodian fees | 60,395 | ||||||||
| Registration fees | 34,409 | ||||||||
| Professional fees | 24,528 | ||||||||
| Trustee fees | 4,921 | ||||||||
| Service share fees | 2,236 | ||||||||
| Other | 39,942 | ||||||||
| Total expenses | 843,345 | ||||||||
| Less — expenses reimbursed and fees waived | (86,160 | ) | |||||||
| Net Expenses | 757,185 | ||||||||
| NET INVESTMENT INCOME | 8,355,233 | ||||||||
| Realized and unrealized gain (loss) on investment, futures and foreign currency transactions: | |||||||||
| Net realized gain (loss) from: | |||||||||
| Investment transactions | (2,172,544 | ) | |||||||
| Futures transactions | 234,772 | ||||||||
| Foreign currency related transactions | — | ||||||||
| Net change in unrealized gain (loss) on: | |||||||||
| Investments | 1,737,674 | ||||||||
| Futures | (2,384 | ) | |||||||
| Translation of assets and liabilities denominated in foreign currencies | — | ||||||||
| Net realized and unrealized gain (loss) on investment, futures and foreign currency transactions: | (202,482 | ) | |||||||
| NET INCREASE IN NET ASSETS RESULTING FROM OPERATIONS | $8,152,751 | ||||||||
(a)
|
Net of
$15,185 in foreign withholding tax for the Global Income
Fund.
|
(b)
|
Class
A, Class B and Class C of the following funds had Distribution
and Service fees of:
|
| Adjustable Rate Government
Fund — $25,670 for Class A only.
|
| Short
Duration Government Fund — $62,060, $32,033 and
$36,929, respectively.
|
| Government Income Fund — $94,775,
$92,148 and $41,707, respectively.
|
| Core
Fixed Income Fund — $90,570, $69,460 and
$33,282, respectively.
|
| Global
Income Fund — $666,187, $88,051 and $34,558,
respectively.
|
(c)
|
The
following funds had Transfer Agency fees of:
|
| Adjustable Rate Government
Fund — $19,509, $53,518 and $179 for Class A,
Institutional Class, and Service Class,
respectively.
|
| Short
Duration Government Fund — $47,167, $6,086,
$7,016, $27,331 and $1,308 for Class A, Class B, Class C,
Institutional Class, and Service Class,
respectively.
|
| Government Income Fund — $72,031,
$17,508, $7,924, $1,379 and $42 for Class A, Class B, Class C,
Institutional Class and Service Class,
respectively.
|
| Core
Fixed Income Fund — $68,833, $13,197, $6,324,
$42,855 and $1,678 for Class A, Class B, Class C,
Institutional Class, and Service Class,
respectively.
|
| Global
Income Fund — $253,151, $16,730, $6,566,
$56,342 and $223 for Class A, Class B, Class C, Institutional
Class and Service Class, respectively.
|
| Short
Duration
Government Fund |
Government
Income Fund |
Core Fixed
Income Fund |
Global
Income Fund |
|||||||
|---|---|---|---|---|---|---|---|---|---|---|
| $7,264,674 | $3,803,163 | $10,969,776 | $15,715,635 | |||||||
| 7,264,674 | 3,803,163 | 10,969,776 | 15,715,635 | |||||||
| 516,595 | 356,524 | 631,338 | 2,582,208 | |||||||
| 131,022 | 228,630 | 193,312 | 788,796 | |||||||
| 88,908 | 98,884 | 132,887 | 333,012 | |||||||
| 58,380 | 56,573 | 84,714 | 197,827 | |||||||
| 33,237 | 28,856 | 39,812 | 52,744 | |||||||
| 24,839 | 24,839 | 24,839 | 27,644 | |||||||
| 4,921 | 4,921 | 4,922 | 4,920 | |||||||
| 16,354 | 526 | 20,979 | 2,787 | |||||||
| 38,970 | 36,660 | 40,098 | 34,671 | |||||||
| 913,226 | 836,413 | 1,172,901 | 4,024,609 | |||||||
| (161,020) | (209,991 | ) | (30,237 | ) | (1,023,610) | |||||
| 752,206 | 626,422 | 1,142,664 | 3,000,999 | |||||||
| 6,512,468 | 3,176,741 | 9,827,112 | 12,714,636 | |||||||
| (798,869 | ) | (1,982,162 | ) | (2,504,220 | ) | (9,051,581) | ||||
| (410,194 | ) | (20,948 | ) | (4,443 | ) | (203,344) | ||||
| — | — | 5,422 | 24,160,975 | |||||||
| (1,904,928 | ) | 242,906 | (3,527,067 | ) | (20,091,804) | |||||
| (600,983 | ) | 126,113 | 380,508 | (601,375) | ||||||
| — | — | (5,926 | ) | 6,188,147 | ||||||
| (3,714,974 | ) | (1,634,091 | ) | (5,655,726 | ) | 401,018 | ||||
| $2,797,494 | $1,542,650 | $ 4,171,386 | $13,115,654 | |||||||
| Adjustable
Rate
Government Fund |
||||
|---|---|---|---|---|
| From operations: | ||||
| Net investment income | $ 8,355,233 | |||
| Net realized gain (loss) on investment, futures and foreign currency related transactions | (1,937,772 | ) | ||
| Net
change in unrealized gain (loss) on investments, futures and
translation of assets and liabilities denominated in foreign
currencies |
1,735,290 | |||
| Net increase in net assets resulting from operations | 8,152,751 | |||
| Distributions to shareholders: | ||||
| From net investment income | ||||
| Class A shares | (543,007 | ) | ||
| Class B shares | — | |||
| Class C shares | — | |||
| Institutional shares | (7,714,629 | ) | ||
| Service shares | (23,405 | ) | ||
| Total distributions to shareholders | (8,281,041 | ) | ||
| From share transactions: | ||||
| Proceeds from sales of shares | 96,925,962 | |||
| Reinvestment of dividends and distributions | 4,130,309 | |||
| Cost of shares repurchased | (191,830,460 | ) | ||
| Net increase (decrease) in net assets resulting from share transactions | (90,774,189 | ) | ||
| TOTAL INCREASE (DECREASE) | (90,902,479 | ) | ||
| Net assets: | ||||
| Beginning of period | 338,682,799 | |||
| End of period | $247,780,320 | |||
| Accumulated net investment income | $ 74,192 | |||
| Short
Duration
Government Fund |
Government
Income Fund |
Core Fixed
Income Fund |
Global
Income Fund |
|||||||
|---|---|---|---|---|---|---|---|---|---|---|
| $ 6,512,468 | $ 3,176,741 | $ 9,827,112 | $ 12,714,636 | |||||||
| (1,209,063 | ) | (2,003,110 | ) | (2,503,241 | ) | 14,906,050 | ||||
| (2,505,911 | ) | 369,019 | (3,152,485 | ) | (14,505,032) | |||||
| 2,797,494 | 1,542,650 | 4,171,386 | 13,115,654 | |||||||
| (1,627,195 | ) | (2,252,750 | ) | (2,169,590 | ) | (5,505,904) | ||||
| (187,806 | ) | (479,444 | ) | (361,351 | ) | (327,085) | ||||
| (204,544 | ) | (217,784 | ) | (173,831 | ) | (124,532) | ||||
| (4,680,859 | ) | (217,596 | ) | (6,816,512 | ) | (6,782,059) | ||||
| (207,905 | ) | (6,217 | ) | (246,120 | ) | (26,220) | ||||
| (6,908,309 | ) | (3,173,791 | ) | (9,767,404 | ) | (12,765,800) | ||||
| 41,846,277 | 45,113,175 | 117,056,445 | 88,220,624 | |||||||
| 4,092,427 | 2,658,589 | 6,351,578 | 7,452,829 | |||||||
| (81,282,263 | ) | (55,279,696 | ) | (98,943,731 | ) | (101,705,043) | ||||
| (35,343,559 | ) | (7,507,932 | ) | 24,464,292 | (6,031,590) | |||||
| (39,454,374 | ) | (9,139,073 | ) | 18,868,274 | (5,681,736) | |||||
| 218,867,987 | 117,752,814 | 312,609,869 | 577,078,456 | |||||||
| $179,413,613 | $108,613,741 | $331,478,143 | $571,396,720 | |||||||
| $ 219,755 | $ 52,208 | $ 182,408 | $ 2,344,351 | |||||||
| Adjustable
Rate
Government Fund |
||||
|---|---|---|---|---|
| From operations: | ||||
| Net investment income | $ 21,741,895 | |||
| Net realized loss on investment, futures and foreign currency related transactions | (752,580 | ) | ||
| Net
change in unrealized gain (loss) on investments, futures and
translation of assets and liabilities denominated in foreign
currencies |
(1,219,471 | ) | ||
| Net increase (decrease) in net assets resulting from operations | 19,769,844 | |||
| Distributions to shareholders: | ||||
| From net investment income | ||||
| Class A shares | (1,554,543 | ) | ||
| Class B shares | — | |||
| Class C shares | — | |||
| Institutional shares | (17,799,251 | ) | ||
| Administration shares | (156,305 | ) | ||
| Service shares | (33,888 | ) | ||
| From capital | ||||
| Class A shares | (199,076 | ) | ||
| Class B shares | — | |||
| Class C shares | — | |||
| Institutional shares | (2,279,391 | ) | ||
| Administration shares | (20,017 | ) | ||
| Service shares | (4,340 | ) | ||
| From net realized gain on investment, futures and foreign currency transactions | ||||
| Class A shares | — | |||
| Class B shares | — | |||
| Class C shares | — | |||
| Institutional shares | — | |||
| Administration shares | — | |||
| Service shares | — | |||
| Total distributions to shareholders | (22,046,811 | ) | ||
| From share transactions: | ||||
| Proceeds from sales of shares | 505,773,211 | |||
| Reinvestment of dividends and distributions | 11,575,172 | |||
| Cost of shares repurchased | (685,219,828 | ) | ||
| Net increase (decrease) in net assets resulting from share transactions | (167,871,445 | ) | ||
| TOTAL INCREASE (DECREASE) | (170,148,412 | ) | ||
| Net assets: | ||||
| Beginning of year | 508,831,211 | |||
| End of year | $338,682,799 | |||
| Accumulated undistributed net investment income | $ — | |||
| Short
Duration
Government Fund |
Government
Income Fund |
Core Fixed
Income Fund |
Global
Income Fund |
|||||||
|---|---|---|---|---|---|---|---|---|---|---|
| $ 13,380,044 | $ 6,563,309 | $ 17,029,832 | $ 22,635,219 | |||||||
| (1,966,703 | ) | (2,232,045) | (6,434,738 | ) | (6,101,567 | ) | ||||
| (6,265,046 | ) | (5,231,809) | (11,888,878 | ) | (22,918,010 | ) | ||||
| 5,148,295 | (900,545) | (1,293,784 | ) | (6,384,358 | ) | |||||
| (2,885,366 | ) | (4,701,931) | (3,111,344 | ) | (10,433,058 | ) | ||||
| (267,022 | ) | (881,113) | (579,641 | ) | (456,703 | ) | ||||
| (316,483 | ) | (489,690) | (337,695 | ) | (263,007 | ) | ||||
| (8,877,237 | ) | (267,417) | (11,800,204 | ) | (11,462,739 | ) | ||||
| (278,181 | ) | — | (495,974 | ) | — | |||||
| (341,400 | ) | (484) | (368,926 | ) | (40,207 | ) | ||||
| — | — | — | (457,628 | ) | ||||||
| — | — | — | (20,032 | ) | ||||||
| — | — | — | (11,536 | ) | ||||||
| — | — | — | (502,793 | ) | ||||||
| — | — | — | — | |||||||
| — | — | — | (1,764 | ) | ||||||
| — | (1,930,242) | (896,935 | ) | (5,398,726 | ) | |||||
| — | (406,494) | (144,240 | ) | (219,025 | ) | |||||
| — | (228,993) | (92,870 | ) | (129,352 | ) | |||||
| — | (63,106) | (2,576,039 | ) | (4,630,914 | ) | |||||
| — | — | (181,000 | ) | — | ||||||
| — | (39) | (84,628 | ) | (17,604 | ) | |||||
| (12,965,689 | ) | (8,969,509) | (20,669,496 | ) | (34,045,088 | ) | ||||
| 285,443,513 | 249,312,834 | 303,446,837 | 348,114,845 | |||||||
| 8,005,144 | 7,441,375 | 13,487,926 | 20,654,882 | |||||||
| (292,142,829 | ) | (258,554,530) | (265,160,385 | ) | (160,439,290 | ) | ||||
| 1,305,828 | (1,800,321) | 51,774,378 | 208,330,437 | |||||||
| (6,511,566 | ) | (11,670,375) | 29,811,098 | 167,900,991 | ||||||
| 225,379,553 | 129,423,189 | 282,798,771 | 409,177,465 | |||||||
| $218,867,987 | $117,752,814 | $312,609,869 | $577,078,456 | |||||||
| $ 615,596 | $ 49,258 | $ 122,700 | $ 2,395,515 | |||||||
|
1. ORGANIZATION
|
| Goldman
Sachs Trust (the “Trust”) is a Delaware business
trust registered under the Investment Company Act of 1940 (as
amended) as an open-end, management investment company. The
Trust includes Goldman Sachs Adjustable Rate Government Fund
(Adjustable Rate Government), Goldman Sachs Short Duration
Government Fund (Short Duration Government), Goldman Sachs
Government Income Fund (Government Income), Goldman Sachs Core
Fixed Income Fund (Core Fixed Income) and Goldman Sachs Global
Income Fund (Global Income), collectively, “the
Funds” or individually a “Fund.” Adjustable
Rate Government, Short Duration Government, Government Income,
and Core Fixed Income are diversified portfolios of the Trust
whereas Global Income is a non-diversified portfolio.
Adjustable Rate Government offers three classes of
shares — Class A, Institutional and Service.
Government Income, Short Duration Government, Core Fixed
Income and Global Income offer five classes of
shares — Class A, Class B, Class C,
Institutional and Service. On July 20, 1999, Administration
Class shares for Adjustable Rate Government, Short Duration
Government, and Core Fixed Income were liquidated and are no
longer offered.
|
| 2. SIGNIFICANT ACCOUNTING
POLICIES
|
| The
following is a summary of significant accounting policies
consistently followed by the Funds. The preparation of
financial statements in conformity with generally accepted
accounting principles requires management to make estimates
and assumptions that may affect the reported amounts. Actual
results could differ from those estimates.
|
| A. Investment
Valuation — Portfolio securities for which accurate market
quotations are readily available are valued on the basis of
quotations furnished by a pricing service or provided by
dealers in such securities. Portfolio securities for which
accurate market quotations are not readily available are
valued based on yield equivalents, pricing matrices or other
sources, under valuation procedures established by the
Trust’s Board of Trustees. Short-term debt obligations
maturing in sixty days or less are valued at amortized
cost.
|
| B. Security Transactions and Investment
Income — Security transactions are recorded as of the trade
date. Realized gains and losses on sales of portfolio
securities are calculated using the identified cost basis.
Interest income is recorded on the basis of interest accrued.
Premiums on interest-only securities and on collateralized
mortgage obligations with nominal principal amounts are
amortized, on an effective yield basis, over the expected
lives of the respective securities.
|
| Certain
mortgage security paydown gains and losses are taxable as
ordinary income. Such paydown gains and losses increase or
decrease taxable ordinary income available for distribution
and are classified as interest income in the accompanying
Statements of Operations. Original issue discounts
(“OID”) on debt securities are amortized to interest
income over the life of the security with a corresponding
increase in the cost basis of that security. OID amortization
on mortgage backed REMIC securities is initially recorded
based on estimates of principal paydowns using the most recent
OID factors available from the issuer. Recorded amortization
amounts are adjusted when actual OID factors are received.
Market discounts and market premiums on debt securities, other
than mortgage backed REMIC securities, are amortized to
interest income over the life of the security with a
corresponding adjustment in the cost basis of that security
for Core Fixed Income. Global Income amortizes only market
discounts on debt securities other than REMIC mortgage backed
securities.
|
| C. Federal
Taxes — It is
each Fund’s policy to comply with the requirements of the
Internal Revenue Code applicable to regulated investment
companies and to distribute each year substantially all of its
investment company taxable and tax-
exempt income and capital gains to its shareholders. Accordingly, no federal tax provisions are required. |
|
2. SIGNIFICANT ACCOUNTING
POLICIES — continued
|
| The
characterization of distributions to shareholders for
financial reporting purposes is determined in accordance with
income tax rules. Therefore, the source of a Fund’s
distributions may be shown in the accompanying financial
statements as either from or in excess of net investment
income or net realized gain on investment transactions, or
from paid-in-capital, depending on the type of book/tax
differences that may exist.
|
| The
Funds, at their most recent tax year-ends of October 31, 1999,
had approximately the following amounts of capital loss
carryforward for U.S. federal tax purposes. These amounts are
available to be carried forward to offset future capital gains
to the extent permitted by applicable laws or
regulations.
|
| Fund | Amount | Years of
Expiration |
|||
|---|---|---|---|---|---|
| Adjustable Rate Government | $50,033,000 | 2000-2007 | |||
| Short Duration Government | 17,097,000 | 2002-2007 | |||
| Government Income | 2,397,000 | 2007 | |||
| Core Fixed Income | 6,931,000 | 2007 | |||
| Global Income | 4,047,000 | 2007 | |||
| At
April 30, 2000 the Funds’ aggregate unrealized gains and
losses based on cost for federal income tax purposes was as
follows:
|
| Fund | Tax Cost | Gross
Unrealized Gain |
Gross
Unrealized Loss |
Net
Unrealized
Loss |
|||||
|---|---|---|---|---|---|---|---|---|---|
| Adjustable Rate Government | $244,603,106 | $ 152,596 | $ (3,741,193) | $ (3,588,597) | |||||
| Short Duration Government | 180,602,955 | 283,640 | (5,416,706) | (5,135,066) | |||||
| Government Income | 119,764,455 | 335,851 | (3,103,232) | (2,767,381) | |||||
| Core Fixed Income | 367,210,734 | 688,212 | (11,674,203) | (10,985,991) | |||||
| Global Income | 594,519,508 | 6,443,160 | (34,904,331) | (28,461,171) | |||||
| D. Expenses —
Expenses incurred by the Trust that do not specifically
relate to an individual Fund of the Trust are allocated to the
Funds on a straight-line or pro rata basis depending upon the
nature of the expense.
|
| Class
A, Class B and Class C shareholders of the Funds bear all
expenses and fees relating to their respective distribution
and service plans. Shareholders of Service shares bear all
expenses and fees paid to service organizations. Each class of
shares of the Funds separately bears its respective
class-specific transfer agency fees.
|
| E. Foreign Currency
Translations — The
books and records of the Funds are maintained in U.S. dollars.
Amounts denominated in foreign currencies are translated into
U.S. dollars on the following basis: (i) investment
valuations, foreign currency and other assets and liabilities
initially expressed in foreign currencies are converted each
business day into U.S. dollars based upon current exchange
rates; (ii) purchases and sales of foreign investments, income
and expenses are converted into U.S. dollars based upon
currency exchange rates prevailing on the respective dates of
such transactions.
|
| Net
realized and unrealized gain (loss) on foreign currency
transactions will represent: (i) foreign exchange gains and
losses from the sale and holdings of foreign currencies and
sale of investments; (ii) gains and losses between trade date
and
2. SIGNIFICANT ACCOUNTING
POLICIES — continued
|
| settlement date on investment securities transactions
and forward exchange contracts; and (iii) gains and losses
from the difference between amounts of interest recorded and
the amounts actually received.
|
| F. Mortgage Dollar
Rolls — The
Funds may enter into mortgage “dollar rolls” in
which the Funds sell securities in the current month for
delivery and simultaneously contract with the same
counterparty to repurchase similar (same type, coupon and
maturity) but not identical securities on a specified future
date. For financial reporting and tax reporting purposes, the
Funds treat mortgage dollar rolls as two separate
transactions; one involving the purchase of a security and a
separate transaction involving a sale.
|
| G. Segregation
Transactions — The
Funds may enter into certain derivative transactions to seek
to increase total return. Forward foreign currency exchange
contracts, futures contracts, written options, mortgage dollar
rolls, when-issued securities and forward commitments
represent examples of such transactions. As a result of
entering into those transactions, the Funds are required to
segregate liquid assets on the accounting records equal to or
greater than the market value of the corresponding
transactions.
|
| 3. AGREEMENTS
|
| Pursuant to the Investment Management Agreements (the
“Agreements”), Goldman Sachs Funds Management, L.P.
(“GSFM”), an affiliate of Goldman, Sachs & Co.
(“Goldman Sachs”), serves as the investment adviser
for Adjustable Rate Government and Short Duration Government.
Goldman Sachs Asset Management (“GSAM”), a unit of
the Investment Management Division of Goldman Sachs, serves as
the investment adviser for Government Income and Core Fixed
Income. Goldman Sachs Asset Management International
(“GSAMI”), an affiliate of GSAM, serves as the
investment adviser for Global Income. Under the Agreements,
the respective adviser, subject to the general supervision of
the Trust’s Board of Trustees, manages the Funds’
portfolios. As compensation for the services rendered pursuant
to the Agreements, the assumption of the expenses related
thereto and administering the Funds’ business affairs,
including providing facilities, the adviser is entitled to a
fee, computed daily and payable monthly at an annual rate
equal to .40%, .50%, .65%, .40% and .90% of average daily net
assets of Adjustable Rate Government, Short Duration
Government, Government Income, Core Fixed Income and Global
Income, respectively. For the six months ended April 30, 2000,
the advisers for Government Income and Global Income
voluntarily have agreed to waive a portion of their management
fee equal annually to .11% and .25%, respectively, of each
Fund’s average daily net assets. The advisers may
discontinue or modify these waivers in the future at their
discretion.
|
| Each
adviser has voluntarily agreed to limit “Other
Expenses” (excluding management fees, distribution and
service fees, transfer agent fees, taxes, interest, brokerage,
litigation, service share fees, indemnification costs and
other extraordinary expenses) to the extent that such expenses
exceed, on an annual basis, .05%, .00%, .00%, .10% and .00% of
the average daily net assets of Adjustable Rate Government,
Short Duration Government, Government Income, Core Fixed
Income and Global Income, respectively.
|
| Goldman
Sachs serves as Distributor of the shares of the Funds
pursuant to a Distribution Agreement. Goldman Sachs may
receive a portion of the Class A sales load and Class B and
Class C contingent deferred sales charges and has advised the
Funds that it retained approximately $6,000, $4,000, $19,000,
$31,000 and $53,000 for the period ended April 30, 2000 for
Adjustable Rate Government, Short Duration Government,
Government Income, Core Fixed Income and Global Income,
respectively.
|
| The
Trust, on behalf of each Fund, has adopted Distribution and
Service Plans. Under the Distribution and Service Plans,
Goldman Sachs and/or Authorized Dealers are entitled to a
monthly fee from each fund for distribution services and
shareholder maintenance equal, on an annual basis, to .50%,
1.00% and 1.00% for Global Income and .25%, 1.00% and
3. AGREEMENTS —
continued
|
| 1.00%
of each of the other funds’ average daily net assets
attributable to Class A, Class B and Class C shares,
respectively. For the six months ended April 30, 2000, Goldman
Sachs has voluntarily agreed to waive a portion of the
Distribution and Service fees equal to .15% of the average
daily net assets attributable to the Class B shares of Short
Duration Government. Goldman Sachs may discontinue or modify
this waiver in the future at its discretion.
|
| Goldman
Sachs also serves as Transfer Agent of the Funds for a fee.
Fees charged for such transfer agency services are calculated
daily and payable monthly at an annual rate as follows: .19%
of the average daily net assets for Class A, Class B and Class
C shares and .04% of the average daily net assets for
Institutional and Service shares.
|
| The
Trust, on behalf of the Funds, has adopted Service Plans.
These plans allow for Service shares to compensate service
organizations for providing varying levels of account
administration and shareholder liaison services to their
customers who are beneficial owners of such shares. The
Service Plans provide for compensation to the service
organizations in an amount up to, on an annual basis, .50% of
the average daily net asset value of the share
class.
|
| For the
six months ended April 30, 2000, the advisors and distributor
have voluntarily agreed to waive certain fees and reimburse
other expenses as follows (in thousands):
|
| Waivers |
|||||||||
|---|---|---|---|---|---|---|---|---|---|
| Fund | Management | Class B
Distribution and Service |
Expense
Reimbursement |
Total | |||||
| Adjustable Rate Government | $ — | $ — | $ 86 | $ 86 | |||||
| Short Duration Government | — | 5 | 156 | 161 | |||||
| Government Income | 60 | — | 150 | 210 | |||||
| Core Fixed Income | — | — | 30 | 30 | |||||
| Global Income | 717 | — | 307 | 1,024 | |||||
| At
April 30, 2000, the amounts owed to affiliates were as follows
(in thousands):
|
| Fund | Management | Distribution
and Service |
Transfer
Agent |
Total | |||||
|---|---|---|---|---|---|---|---|---|---|
| Adjustable Rate Government | $ 83 | $ 4 | $11 | $ 98 | |||||
| Short Duration Government | 77 | 17 | 13 | 107 | |||||
| Government Income | 47 | 35 | 16 | 98 | |||||
| Core Fixed Income | 108 | 31 | 22 | 161 | |||||
| Global Income | 306 | 129 | 55 | 490 | |||||
|
4. PORTFOLIO SECURITY
TRANSACTIONS
|
| Purchases and proceeds of sales or maturities of
long-term securities for the six months ended April 30, 2000,
were as follows:
|
| Fund | Purchases of
U.S. Government and agency obligations |
Purchases
(excluding U.S. Government and agency obligations) |
Sales or
maturities of U.S. Government and agency obligations |
Sales or maturities
(excluding U.S. Government and agency obligations) |
|||||
|---|---|---|---|---|---|---|---|---|---|
| Adjustable Rate Government | $ 13,584,835 | $ — | $121,444,542 | $ — | |||||
| Short Duration Government | 125,510,132 | — | 165,896,767 | — | |||||
| Government Income | 171,844,104 | 2,996,790 | 172,260,994 | 8,266,796 | |||||
| Core Fixed Income | 319,182,384 | 50,475,560 | 296,125,100 | 35,314,075 | |||||
| Global Income | 140,174,896 | 416,762,507 | 100,597,570 | 425,798,095 | |||||
| Forward Foreign
Currency Exchange Contracts — Core
Fixed Income and Global Income may enter into forward foreign
currency exchange contracts for the purchase or sale of a
specific foreign currency at a fixed price on a future date as
a hedge or cross-hedge against either specific transactions or
portfolio positions. Core Fixed Income and Global Income may
also purchase and sell forward contracts to seek to increase
total return. All commitments are “marked-to-market”
daily at the applicable translation rates and any resulting
unrealized gains or losses are recorded in the Funds’
financial statements.
The Funds record realized gains or losses at the time a forward contract is offset by entry into a closing transaction or extinguished by delivery of the currency. Risks may arise upon entering into these contracts from the potential inability of counterparties to meet the terms of their contracts and from unanticipated movements in the value of a foreign currency relative to the U.S. dollar. |
|
4. PORTFOLIO SECURITY
TRANSACTIONS — continued
|
| At
April 30, 2000, Global Income had outstanding forward foreign
currency exchange contracts, both to purchase and sell foreign
currencies as follows:
|
| Open Foreign Currency
Sale Contracts |
Value on
Settlement Date |
Current Value | Unrealized
Gain |
Unrealized
Loss |
|||||
|---|---|---|---|---|---|---|---|---|---|
| British Pounds | |||||||||
| expiring 6/15/2000 | $ 77,649,496 | $ 76,706,430 | $ 943,066 | $ — | |||||
| Canadian Dollar | |||||||||
| expiring 5/25/2000 | 4,922,076 | 4,873,371 | 48,705 | — | |||||
| expiring 5/25/2000 | 7,208,883 | 7,227,447 | — | 18,564 | |||||
| Danish Krone | |||||||||
| expiring 7/19/2000 | 10,189,968 | 9,631,605 | 558,363 | — | |||||
| Euro Currency | |||||||||
| expiring 5/19/2000 | 77,993 | 73,770 | 4,223 | — | |||||
| expiring 6/15/2000 | 7,737,860 | 7,666,816 | 71,044 | — | |||||
| expiring 6/16/2000 | 13,177,276 | 12,371,428 | 805,848 | — | |||||
| expiring 7/13/2000 | 121,476,989 | 120,153,593 | 1,323,396 | — | |||||
| Japanese Yen | |||||||||
| expiring 5/17/2000 | 101,269,356 | 100,507,512 | 761,844 | — | |||||
| South African Rand | |||||||||
| expiring 7/13/2000 | 9,997,143 | 9,726,156 | 270,987 | — | |||||
| Swedish Krona | |||||||||
| expiring 6/16/2000 | 10,789,109 | 10,487,169 | 301,940 | — | |||||
| Total Open
Foreign Currency
Sale Contracts |
$364,496,149 | $359,425,297 | $5,089,416 | $ 18,564 | |||||
| Closed but
Unsettled Foreign
Currency Contracts |
Purchase
Value |
Sale Value | Realized
Gain |
Realized
Loss |
|||||
| Australian Dollar | |||||||||
| expiring 6/19/2000 | $ 7,118,000 | $ 6,951,929 | $ — | $166,071 | |||||
| British Pounds | |||||||||
| expiring 6/15/2000 | 3,814,755 | 3,712,404 | — | 102,351 | |||||
| expiring 6/15/2000 | 30,192,949 | 29,989,086 | — | 203,863 | |||||
| expiring 6/15/2000 | 3,321,245 | 3,284,421 | — | 36,824 | |||||
| expiring 6/15/2000 | 1,069,831 | 1,069,679 | — | 152 | |||||
| expiring 6/15/2000 | 732,662 | 730,495 | — | 2,167 | |||||
| expiring 6/15/2000 | 7,205,429 | 7,176,624 | — | 28,805 | |||||
| expiring 6/15/2000 | 7,219,960 | 7,250,441 | 30,481 | — | |||||
| Canadian Dollar | |||||||||
| expiring 5/25/2000 | 4,866,558 | 4,879,810 | 13,252 | — | |||||
| expiring 5/25/2000 | 2,278,441 | 2,278,923 | 482 | — | |||||
| expiring 5/25/2000 | 7,612,140 | 7,546,045 | — | 66,095 | |||||
| Euro Currency | |||||||||
| expiring 5/19/2000 | 7,113,174 | 7,121,389 | 8,215 | — | |||||
| expiring 6/15/2000 | 394,930 | 390,512 | — | 4,418 | |||||
| expiring 6/15/2000 | 6,743,704 | 6,687,530 | — | 56,174 | |||||
| expiring 6/15/2000 | 7,140,443 | 7,050,723 | — | 89,720 | |||||
| Japanese Yen | |||||||||
| expiring 5/17/2000 | 755,000 | 757,767 | 2,767 | — | |||||
| expiring 5/17/2000 | 3,810,844 | 3,770,122 | — | 40,722 | |||||
| expiring 5/17/2000 | 2,314,278 | 2,310,661 | — | 3,617 | |||||
| Swiss Franc | |||||||||
| expiring 5/19/2000 | 7,199,381 | 7,113,174 | — | 86,207 | |||||
| Total Closed
but Unsettled
Foreign Currency Contracts |
$110,903,724 | $110,071,735 | $ 55,197 | $887,186 | |||||
|
4. PORTFOLIO SECURITY
TRANSACTIONS — continued
|
| The
contractual amounts of forward foreign currency exchange
contracts do not necessarily represent the amounts potentially
subject to risk. The measurement of the risks associated with
these instruments is meaningful only when all related and
offsetting transactions are considered. At April 30, 2000,
Global Income and Core Fixed Income had sufficient cash and/or
securities to cover any commitments under these
contracts.
|
| Futures
Contracts — The
Funds may enter into futures transactions to hedge against
changes in interest rates, securities prices, currency
exchange rates (in the case of Core Fixed Income and Global
Income) or to seek to increase total return. Upon entering
into a futures contract, the Funds are required to deposit
with a broker an amount of cash or securities equal to the
minimum “initial margin” requirement of the
associated futures exchange. Subsequent payments for futures
contracts (“variation margin”) are paid or received
by the Funds daily, dependent on the daily fluctuations in the
value of the contracts, and are recorded for financial
reporting purposes as unrealized gains or losses. When
contracts are closed, the Funds realize a gain or loss which
is reported in the Statements of Operations.
|
| The use
of futures contracts involve, to varying degrees, elements of
market and counterparty risk which may exceed the amounts
recognized in the Statements of Assets and Liabilities.
Changes in the value of the futures contract may not directly
correlate with changes in the value of the underlying
securities. This risk may decrease the effectiveness of the
Funds’ strategies and potentially result in a
loss.
|
| For the
six months ended April 30, 2000, Adjustable Rate Government,
Short Duration Government, Government Income, Core Fixed
Income and Global Income incurred commission expenses of
approximately $9,000, $11,000, $2,000, $9,000 and $29,000,
respectively, in connection with futures contracts entered
into with Goldman Sachs.
|
|
4. PORTFOLIO SECURITY
TRANSACTIONS — continued
|
| At
April 30, 2000, open futures contracts were as
follows:
|
| Fund | Type | Number of
Contracts Long (Short) |
Settlement
Month |
Market Value | Unrealized
Gain (Loss) |
||||||||
|---|---|---|---|---|---|---|---|---|---|---|---|---|---|
| Adjustable Rate Government Fund | Euro Dollars | 200 | June 2000 | $46,610,000 | $ (250,968 | ) | |||||||
| Euro Dollars | 20 | September 2000 | 4,644,750 | (14,127 | ) | ||||||||
| Euro Dollars | 20 | December 2000 | 4,635,000 | (4,877 | ) | ||||||||
| 5 Year U.S. Treasury Notes | 5 | June 2000 | 487,891 | (91 | ) | ||||||||
| Euro Dollars | (70) | March 2001 | (16,216,375 | ) | 98,819 | ||||||||
| 10 Year U.S. Treasury Notes | (71) | June 2000 | (6,883,672 | ) | (34,767 | ) | |||||||
| $33,277,594 | $ (206,011 | ) | |||||||||||
| Short Duration Government Fund | Euro Dollars | 65 | June 2000 | $15,148,250 | $ (309,163 | ) | |||||||
| Euro Dollars | 55 | September 2000 | 12,773,063 | (295,037 | ) | ||||||||
| Euro Dollars | 40 | December 2000 | 9,270,000 | (86,244 | ) | ||||||||
| 2 Year U.S. Treasury Notes | 341 | June 2000 | 67,256,922 | (202,798 | ) | ||||||||
| 5 Year U.S. Treasury Notes | (256) | June 2000 | (24,980,000 | ) | (27,552 | ) | |||||||
| 10 Year U.S. Treasury Notes | (203) | June 2000 | (19,681,484 | ) | (237,338 | ) | |||||||
| U.S. Treasury 30 Year Bond | (193) | June 2000 | (6,373,125 | ) | (122,539 | ) | |||||||
| $53,413,626 | $(1,280,671 | ) | |||||||||||
| Government Income Fund | Euro Dollars | 10 | September 2000 | $ 2,322,375 | $ (38,439 | ) | |||||||
| 2 Year U.S. Treasury Notes | 5 | June 2000 | 986,172 | (2,213 | ) | ||||||||
| 5 Year U.S. Treasury Notes | (68) | June 2000 | (6,635,313 | ) | 9,999 | ||||||||
| 10 Year U.S. Treasury Notes | 65 | June 2000 | 6,301,953 | 86,490 | |||||||||
| 30 Year U.S. Treasury Bonds | 19 | June 2000 | 1,834,688 | 26,528 | |||||||||
| $ 4,809,875 | $ 82,365 | ||||||||||||
| Core Fixed Income Fund | Eurodollars | 20 | June 2000 | $ 4,661,000 | $ (28,622 | ) | |||||||
| Eurodollars | 39 | September 2002 | 9,037,275 | (14,000 | ) | ||||||||
| Eurodollars | 39 | December 2002 | 9,033,863 | (14,000 | ) | ||||||||
| Eurodollars | 39 | March 2003 | 9,039,712 | (14,487 | ) | ||||||||
| Eurodollars | 39 | June 2003 | 9,038,250 | (15,950 | ) | ||||||||
| Eurodollars | 39 | September 2003 | 9,037,275 | (16,788 | ) | ||||||||
| Eurodollars | 39 | December 2003 | 9,031,913 | (16,788 | ) | ||||||||
| Eurodollars | 39 | March 2004 | 9,035,812 | (17,800 | ) | ||||||||
| Eurodollars | 39 | June 2004 | 9,032,400 | (18,287 | ) | ||||||||
| 5 Year U.S. Treasury Notes | (470) | June 2000 | (45,861,719 | ) | 127,959 | ||||||||
| 10 Year U.S. Treasury Notes | 30 | June 2000 | 2,908,594 | 34,769 | |||||||||
| 30 Year U.S. Treasury Bonds | 211 | June 2000 | 20,374,688 | 264,270 | |||||||||
| $54,369,063 | $ 270,276 | ||||||||||||
| Global Income Fund | Euro Dollars | 7 | June 2000 | $ 1,631,350 | $ (10,763 | ) | |||||||
| Euro-Bund | (58) | June 2000 | 5,538,001 | (106,510 | ) | ||||||||
| 5 Year U.S. Treasury Notes | (315) | June 2000 | (30,737,110 | ) | (101,812 | ) | |||||||
| 10 Year U.S. Treasury Notes | (248) | June 2000 | (24,044,375 | ) | (311,938 | ) | |||||||
| 10 Year U.S. Treasury Notes | 56 | June 2000 | 5,429,376 | 50,492 | |||||||||
| 20 Year U.S. Treasury Bond | 78 | June 2000 | 7,531,876 | 143,469 | |||||||||
| 20 Year U.S. Treasury Bond | (50) | June 2000 | (4,828,125 | ) | (86,719 | ) | |||||||
| $(39,479,007 | ) | $ (423,781 | ) | ||||||||||
|
5. REPURCHASE AGREEMENTS
|
| During
the term of a repurchase agreement, the value of the
underlying securities, including accrued interest, is required
to equal or exceed the value of the repurchase agreement. The
underlying securities for all repurchase agreements are held
in safekeeping by a bank custodian.
|
| 6. JOINT REPURCHASE AGREEMENT
ACCOUNT
|
| The
Funds, together with other registered investment companies
having management agreements with GSFM, GSAMI and GSAM or
their affiliates, transfer uninvested cash into joint
accounts, the daily aggregate balance of which is invested in
one or more repurchase agreements.
|
| At
April 30, 2000, Adjustable Rate Government, Government Income
and Core Fixed Income had undivided interests in the
repurchase agreements in the following joint account which
equaled $22,200,000, $6,600,000, and $25,300,000,
respectively, in principal amount. At April 30, 2000, the
following repurchase agreements held in this joint account
were fully collateralized by Federal Agency
obligations.
|
| Repurchase Agreements | Principal
Amount |
Interest
Rate |
Maturity
Date |
Amortized
Cost |
||||||
|---|---|---|---|---|---|---|---|---|---|---|
| ABN/AMRO, Inc. | $ 703,700,000 | 5.85 | % | 05/01/2000 | $ 703,700,000 | |||||
| Banc of America Securities LLC | 1,300,000,000 | 5.85 | 05/01/2000 | 1,300,000,000 | ||||||
| Bear Stearns Companies, Inc. | 500,000,000 | 5.85 | 05/01/2000 | 500,000,000 | ||||||
| Chase Securities, Inc. | 400,000,000 | 5.85 | 05/01/2000 | 400,000,000 | ||||||
| SG Cowen Securities | 200,000,000 | 5.85 | 05/01/2000 | 200,000,000 | ||||||
| TOTAL JOINT REPURCHASE AGREEMENT ACCOUNT | $3,103,700,000 | |||||||||
| 7. LINE OF CREDIT
FACILITY
|
| The
Funds participates in a $250,000,000 uncommitted and a
$250,000,000 committed, unsecured revolving line of credit
facility. Under the most restrictive arrangement, each Fund
must own securities having a market value in excess of 400% of
the total bank borrowings. These facilities are to be used
solely for temporary or emergency purposes. The interest rate
on borrowings is based on the Federal Funds rate. The
committed facility also requires a fee to be paid by the Funds
based on the amount of the commitment. During the six months
ended April 30, 2000, the Funds did not have any borrowings
under any of these facilities.
|
| 8. OTHER MATTERS
|
| As of
April 30, 2000, the Goldman, Sachs & Co. Profit Sharing
Master Trust was the beneficial owner of approximately 23% and
9% of the outstanding shares of Short Duration Government and
Global Income, respectively. The Goldman Sachs Balanced
Strategy Portfolio was the beneficial owner of approximately
17% of Short Duration Government. The Goldman Sachs Growth and
Income Strategy Portfolio was the beneficial owner of
approximately 15% and 15% of Core Fixed Income and Global
Income, respectively. The Goldman Sachs Growth Strategy
Portfolio was the beneficial owner of approximately 7% of
Global Income. The Goldman Sachs Conservative Strategy
Portfolio was the beneficial owner of approximately 5% of
Short Duration Government.
|
|
9. CHANGE IN INDEPENDENT
AUDITORS
|
| On
October 26, 1999 the Board of Trustees of the Funds, upon the
recommendation of the Board’s audit committee, determined
not to retain Arthur Andersen LLP and approved a change of the
Funds’ independent auditors to Ernst & Young LLP. For
the fiscal years ended October 31, 1999 and October 31, 1998,
Arthur Andersen LLP’s audit reports contained no adverse
opinion or disclaimer of opinion; nor were their reports
qualified or modified as to uncertainty, audit scope, or
accounting principles. Further, there were no disagreements
between the Funds and Arthur Andersen LLP on accounting
principles or practices, financial statement disclosure or
audit scope or procedure, which if not resolved to the
satisfaction of Arthur Andersen LLP would have caused them to
make reference to the disagreement in their
report.
|
|
10. SUMMARY OF SHARE
TRANSACTIONS
|
| Share
activity for the six months ended April 30, 2000 is as
follows:
|
| Adjustable Rate Government | Short Duration Government | ||||||||||||
|---|---|---|---|---|---|---|---|---|---|---|---|---|---|
| Shares | Dollars | Shares | Dollars | ||||||||||
| Class A Shares | |||||||||||||
| Shares sold | 1,988,642 | $ 19,120,093 | 2,153,943 | $20,535,288 | |||||||||
| Reinvestment of dividends and distributions | 47,105 | 455,197 | 118,916 | 1,124,204 | |||||||||
| Shares repurchased | (2,356,412 | ) | (22,668,656 | ) | (3,876,723 | ) | (36,679,783 | ) | |||||
| (320,665 | ) | (3,093,366 | ) | (1,603,864 | ) | (15,020,291 | ) | ||||||
| Class B Shares | |||||||||||||
| Shares sold | — | — | 328,988 | 3,112,710 | |||||||||
| Reinvestment of dividends and distributions | — | — | 13,804 | 130,254 | |||||||||
| Shares repurchased | — | — | (447,227 | ) | (4,225,308 | ) | |||||||
| — | — | (104,435 | ) | (982,344 | ) | ||||||||
| Class C Shares | |||||||||||||
| Shares sold | — | — | 509,953 | 4,822,201 | |||||||||
| Reinvestment of dividends and distributions | — | — | 18,658 | 175,592 | |||||||||
| Shares repurchased | — | — | (632,821 | ) | (5,971,194 | ) | |||||||
| — | — | (104,210 | ) | (973,401 | ) | ||||||||
| Institutional Shares | |||||||||||||
| Shares sold | 8,054,768 | 77,639,700 | 1,233,711 | 11,669,041 | |||||||||
| Reinvestment of dividends and distributions | 379,240 | 3,651,725 | 259,868 | 2,454,392 | |||||||||
| Shares repurchased | (17,451,447 | ) | (168,179,257 | ) | (3,503,632 | ) | (33,143,941 | ) | |||||
| (9,017,439 | ) | (86,887,832 | ) | (2,010,053 | ) | (19,020,508 | ) | ||||||
| Service Shares | |||||||||||||
| Shares sold | 17,249 | 166,169 | 180,965 | 1,707,037 | |||||||||
| Reinvestment of dividends and distributions | 2,428 | 23,387 | 22,043 | 207,985 | |||||||||
| Shares repurchased | (101,810 | ) | (982,547 | ) | (133,975 | ) | (1,262,037 | ) | |||||
| (82,133 | ) | (792,991 | ) | 69,033 | 652,985 | ||||||||
| NET INCREASE (DECREASE) | (9,420,237 | ) | $ (90,774,189 | ) | (3,753,529 | ) | $(35,343,559 | ) | |||||
| Government Income | Core Fixed Income | Global Income | ||||||||||||||
|---|---|---|---|---|---|---|---|---|---|---|---|---|---|---|---|---|
| Shares | Dollars | Shares | Dollars | Shares | Dollars | |||||||||||
| 2,684,703 | $36,432,356 | 6,380,788 | $59,961,951 | 3,860,068 | $56,005,714 | |||||||||||
| 148,427 | 2,007,225 | 181,637 | 1,702,228 | 316,318 | 4,575,340 | |||||||||||
| (3,191,246 | ) | (43,246,906) | (6,019,173 | ) | (56,378,353 | ) | (4,712,553 | ) | (68,410,078 | ) | ||||||
| (358,116 | ) | (4,807,325) | 543,252 | 5,285,826 | (536,167 | ) | (7,829,024 | ) | ||||||||
| 385,703 | 5,246,021 | 238,162 | 2,241,783 | 336,158 | 4,871,785 | |||||||||||
| 23,139 | 316,730 | 24,007 | 225,599 | 18,774 | 271,398 | |||||||||||
| (537,342 | ) | (7,285,413) | (381,062 | ) | (3,582,404 | ) | (203,614 | ) | (2,945,537 | ) | ||||||
| (128,500 | ) | (1,722,662) | (118,893 | ) | (1,115,022 | ) | 151,318 | 2,197,646 | ||||||||
| 63,924 | 866,639 | 97,625 | 922,083 | 73,405 | 1,060,776 | |||||||||||
| 13,336 | 180,381 | 12,183 | 114,519 | 6,305 | 90,837 | |||||||||||
| (304,821 | ) | (4,120,580) | (244,507 | ) | (2,295,801 | ) | (174,880 | ) | (2,530,048 | ) | ||||||
| (227,561 | ) | (3,073,560) | (134,699 | ) | (1,259,199 | ) | (95,170 | ) | (1,378,435 | ) | ||||||
| 166,392 | 2,236,072 | 5,561,015 | 52,538,497 | 1,754,226 | $25,453,316 | |||||||||||
| 11,081 | 149,689 | 433,649 | 4,073,484 | 172,241 | 2,489,033 | |||||||||||
| (46,802 | ) | (626,797) | (3,729,574 | ) | (35,115,664 | ) | (1,906,745 | ) | (27,645,881 | ) | ||||||
| 130,671 | 1,758,964 | 2,265,090 | 21,496,317 | 19,722 | 296,468 | |||||||||||
| 24,500 | 332,087 | 147,068 | 1,392,131 | 57,054 | 829,033 | |||||||||||
| 338 | 4,564 | 25,089 | 235,748 | 1,815 | 26,221 | |||||||||||
| — | — | (166,893 | ) | (1,571,509 | ) | (11,956 | ) | (173,499 | ) | |||||||
| 24,838 | 336,651 | 5,264 | 56,370 | 46,913 | 681,755 | |||||||||||
| (558,668 | ) | $ (7,507,932) | 2,560,014 | $24,464,292 | (413,384 | ) | $ (6,031,590 | ) | ||||||||
|
10. SUMMARY OF SHARE
TRANSACTIONS
|
| Share
activity for the year ended October 31, 1999 is as
follows:
|
| Adjustable Rate Government | Short Duration Government | ||||||||||||
|---|---|---|---|---|---|---|---|---|---|---|---|---|---|
| Shares | Dollars | Shares | Dollars | ||||||||||
| Class A Shares | |||||||||||||
| Shares sold | 31,904,130 | $307,792,374 | 10,095,040 | $ 98,117,271 | |||||||||
| Reinvestment of dividends and distributions | 119,965 | 1,158,237 | 216,498 | 2,098,601 | |||||||||
| Shares repurchased | (35,923,098 | ) | (346,731,900 | ) | (10,580,288 | ) | (102,834,224 | ) | |||||
| (3,899,003 | ) | (37,781,289 | ) | (268,750 | ) | (2,618,352 | ) | ||||||
| Class B Shares | |||||||||||||
| Shares sold | — | — | 536,977 | 5,189,723 | |||||||||
| Reinvestment of dividends and distributions | — | — | 19,167 | 185,709 | |||||||||
| Shares repurchased | — | — | (338,423 | ) | (3,279,805 | ) | |||||||
| — | — | 217,721 | 2,095,627 | ||||||||||
| Class C Shares | |||||||||||||
| Shares sold | — | — | 8,886,376 | 86,234,626 | |||||||||
| Reinvestment of dividends and distributions | — | — | 20,160 | 197,199 | |||||||||
| Shares repurchased | — | — | (8,627,888 | ) | (83,700,711 | ) | |||||||
| — | — | 278,648 | 2,731,114 | ||||||||||
| Institutional Shares | |||||||||||||
| Shares sold | 20,323,432 | 196,917,377 | 9,547,581 | 92,884,069 | |||||||||
| Reinvestment of dividends and distributions | 1,061,620 | 10,265,385 | 513,104 | 4,969,995 | |||||||||
| Shares repurchased | (34,221,185 | ) | (331,249,902 | ) | (9,495,933 | ) | (92,157,561 | ) | |||||
| (12,836,133 | ) | (124,067,140 | ) | 564,752 | 5,696,503 | ||||||||
| Administration Shares | |||||||||||||
| Shares sold | 68,624 | 664,460 | 89,932 | 879,455 | |||||||||
| Reinvestment of dividends and distributions | 11,849 | 114,653 | 21,750 | 212,241 | |||||||||
| Shares repurchased | (699,098 | ) | (6,780,446 | ) | (853,809 | ) | (8,273,964 | ) | |||||
| (618,625 | ) | (6,001,333 | ) | (742,127 | ) | (7,182,268 | ) | ||||||
| Service Shares | |||||||||||||
| Shares sold | 41,184 | 399,000 | 220,831 | 2,138,369 | |||||||||
| Reinvestment of dividends and distributions | 3,813 | 36,897 | 35,301 | 341,399 | |||||||||
| Shares repurchased | (47,218 | ) | (457,580 | ) | (195,427 | ) | (1,896,564 | ) | |||||
| (2,221 | ) | (21,683 | ) | 60,705 | 583,204 | ||||||||
| NET INCREASE (DECREASE) | (17,355,982 | ) | $(167,871,445 | ) | 110,949 | $ 1,305,828 | |||||||
| Government Income | Core Fixed Income | Global Income | ||||||||||||||
|---|---|---|---|---|---|---|---|---|---|---|---|---|---|---|---|---|
| Shares | Dollars | Shares | Dollars | Shares | Dollars | |||||||||||
| 15,480,704 | $221,875,202 | 15,664,674 | $153,790,343 | 11,408,207 | $172,565,659 | |||||||||||
| 399,303 | 5,661,524 | 364,578 | 3,579,460 | 893,424 | 13,446,916 | |||||||||||
| (16,666,682 | ) | (239,289,704) | (14,632,982 | ) | (143,984,124 | ) | (7,423,402 | ) | (111,559,802 | ) | ||||||
| (786,675 | ) | (11,752,978) | 1,396,270 | 13,385,679 | 4,878,229 | 74,452,773 | ||||||||||
| 995,374 | 14,092,144 | 1,292,427 | 12,801,294 | 799,694 | 11,962,762 | |||||||||||
| 63,277 | 898,159 | 45,231 | 443,248 | 37,347 | 559,007 | |||||||||||
| (704,136 | ) | (9,886,884) | (499,533 | ) | (4,888,859 | ) | (200,617 | ) | (2,973,643 | ) | ||||||
| 354,515 | 5,103,419 | 838,125 | 8,355,683 | 636,424 | 9,548,126 | |||||||||||
| 584,857 | 8,274,255 | 731,786 | 7,234,043 | 427,735 | 6,481,148 | |||||||||||
| 44,022 | 624,389 | 26,464 | 260,185 | 19,764 | 296,195 | |||||||||||
| (541,898 | ) | (7,636,754) | (519,952 | ) | (5,098,447 | ) | (170,181 | ) | (2,517,755 | ) | ||||||
| 86,981 | 1,261,890 | 238,298 | 2,395,781 | 277,318 | 4,259,588 | |||||||||||
| 357,908 | 5,057,233 | 12,407,934 | 122,028,595 | 10,355,146 | 156,504,371 | |||||||||||
| 18,233 | 257,175 | 849,565 | 8,328,838 | 419,045 | 6,293,031 | |||||||||||
| (122,650 | ) | (1,741,188) | (9,506,792 | ) | (94,135,666 | ) | (2,870,867 | ) | (42,857,412 | ) | ||||||
| 253,491 | 3,573,220 | 3,750,707 | 36,221,767 | 7,903,324 | 119,939,990 | |||||||||||
| — | — | 285,215 | 2,874,182 | — | — | |||||||||||
| — | — | 43,863 | 435,986 | — | — | |||||||||||
| — | — | (1,569,648 | ) | (15,306,734 | ) | — | — | |||||||||
| — | — | (1,240,570 | ) | (11,996,566 | ) | — | — | |||||||||
| 987 | 14,000 | 480,043 | 4,718,380 | 39,802 | 600,905 | |||||||||||
| 9 | 128 | 44,910 | 440,209 | 3,980 | 59,733 | |||||||||||
| — | — | (178,571 | ) | (1,746,555 | ) | (34,363 | ) | (530,678 | ) | |||||||
| 996 | 14,128 | 346,382 | 3,412,034 | 9,419 | 129,960 | |||||||||||
| (90,692 | ) | $ (1,800,321) | 5,329,212 | $ 51,774,378 | 13,704,714 | $208,330,437 | ||||||||||
|
Income (loss) from investment operations(a) |
Distributions to shareholders |
|||||||||||||||||||
|---|---|---|---|---|---|---|---|---|---|---|---|---|---|---|---|---|---|---|---|---|
| Net asset
value at beginning of period |
Net
investment income |
Net realized
and unrealized gain (loss) |
From net
investment income |
In excess
of net investment income |
From capital |
Net
increase (decrease) in net asset value |
||||||||||||||
| FOR THE SIX MONTHS ENDED APRIL 30 (UNAUDITED), | ||||||||||||||||||||
| 2000 - Class A Shares | $9.63 | $0.26 | $ 0.00 | $(0.26 | ) | $ — | $ — | $(0.00 | ) | |||||||||||
| 2000 - Institutional Shares | 9.64 | 0.28 | (0.00 | ) | (0.28 | ) | — | — | (0.00 | ) | ||||||||||
| 2000 - Service Shares | 9.65 | 0.26 | (0.02 | ) | (0.25 | ) | — | — | (0.01 | ) | ||||||||||
| FOR THE YEARS ENDED OCTOBER 31, | ||||||||||||||||||||
| 1999 - Class A Shares | 9.69 | 0.49 | (0.05 | ) | (0.44 | ) | — | (0.06 | ) | (0.06 | ) | |||||||||
| 1999 - Institutional Shares | 9.70 | 0.53 | (0.05 | ) | (0.48 | ) | — | (0.06 | ) | (0.06 | ) | |||||||||
| 1999 - Administration Shares (g) | 9.70 | 0.37 | (e) | 0.01 | (e) | (0.33 | ) | — | (0.04 | ) | 0.01 | |||||||||
| 1999 - Service Shares | 9.70 | 0.48 | (0.04 | ) | (0.43 | ) | — | (0.06 | ) | (0.05 | ) | |||||||||
| 1998 - Class A Shares | 9.88 | 0.53 | (0.17 | ) | (0.53 | ) | (0.02 | ) | — | (0.19 | ) | |||||||||
| 1998 - Institutional Shares | 9.88 | 0.55 | (0.16 | ) | (0.55 | ) | (0.02 | ) | — | (0.18 | ) | |||||||||
| 1998 - Administration Shares | 9.88 | 0.53 | (0.16 | ) | (0.53 | ) | (0.02 | ) | — | (0.18 | ) | |||||||||
| 1998 - Service Shares | 9.88 | 0.51 | (0.16 | ) | (0.51 | ) | (0.02 | ) | — | (0.18 | ) | |||||||||
| 1997 - Class A Shares | 9.83 | 0.57 | (e) | 0.05 | (e) | (0.57 | ) | — | — | 0.05 | ||||||||||
| 1997 - Institutional Shares | 9.83 | 0.59 | (e) | 0.05 | (e) | (0.59 | ) | — | — | 0.05 | ||||||||||
| 1997 - Administration Shares | 9.83 | 0.57 | (e) | 0.05 | (e) | (0.57 | ) | — | — | 0.05 | ||||||||||
| 1997 - Service Shares (commenced March 27) | 9.84 | 0.33 | (e) | 0.04 | (e) | (0.33 | ) | — | — | 0.04 | ||||||||||
| 1996 - Class A Shares | 9.77 | 0.55 | (e) | 0.08 | (e) | (0.55 | ) | (0.02 | ) | — | 0.06 | |||||||||
| 1996 - Institutional Shares | 9.77 | 0.57 | (e) | 0.08 | (e) | (0.57 | ) | (0.02 | ) | — | 0.06 | |||||||||
| 1996 - Administration Shares | 9.77 | 0.55 | (e) | 0.08 | (e) | (0.55 | ) | (0.02 | ) | — | 0.06 | |||||||||
| 1995 - Class A Shares (commenced May 15) | 9.79 | 0.27 | (e) | (0.01 | ) (e) | (0.27 | ) | (0.01 | ) | — | (0.02 | ) | ||||||||
| 1995 - Institutional Shares | 9.74 | 0.56 | (e) | 0.07 | (e) | (0.57 | ) | (0.03 | ) | — | 0.03 | |||||||||
| 1995 - Administration Shares | 9.74 | 0.54 | (e) | 0.07 | (e) | (0.55 | ) | (0.03 | ) | — | 0.03 | |||||||||
(a)
|
Includes the balancing effect of calculating per share
amounts.
|
(b)
|
Assumes
investment at the net asset value at the beginning of the
period, reinvestment of all distributions, a complete
redemption of the investment at the net asset value
at the end of period and no sales charge. Total return would be reduced if a sales charge for Class A shares were taken into account. |
(c)
|
Annualized.
|
(d)
|
Not
annualized.
|
(e)
|
Calculated based on the average shares outstanding
methodology.
|
(f)
|
Includes the effect of mortgage dollar roll
transactions.
|
(g)
|
Administration Class shares were liquidated on July 20,
1999. Ending net asset value shown as of July 20,
1999.
|
|
Ratios assuming no voluntary waiver of fees or expense limitations |
|||||||||||||||||||||
|---|---|---|---|---|---|---|---|---|---|---|---|---|---|---|---|---|---|---|---|---|---|
| Net asset
value, end of period |
Total
return(b) |
Net assets
at end of period (in 000s) |
Ratio of
net expenses to average net assets |
Ratio of
net investment income to average net assets |
Ratio of
expenses to average net assets |
Ratio of
net investment income to average net assets |
Portfolio
turnover rate(f) |
||||||||||||||
| $9.63 | 2.70 | % (d) | $ 19,772 | 0.89 | % (c) | 5.33 | % (c) | 0.95 | % (c) | 5.27 | % (c) | 4.84 | % (d) | ||||||||
| 9.64 | 2.90 | (d) | 228,004 | 0.49 | (c) | 5.82 | (c) | 0.55 | (c) | 5.76 | (c) | 4.84 | (d) | ||||||||
| 9.64 | 2.48 | (d) | 4 | 0.99 | (c) | 5.30 | (c) | 1.05 | (c) | 5.24 | (c) | 4.84 | (d) | ||||||||
| 9.63 | 4.65 | 22,862 | 0.89 | 5.15 | 0.93 | 5.11 | 38.86 | ||||||||||||||
| 9.64 | 5.06 | 315,024 | 0.49 | 5.49 | 0.53 | 5.45 | 38.86 | ||||||||||||||
| 9.71 (g) | 4.02 | (d) | — | 0.74 | (c) | 5.35 | (c) | 0.78 | (c) | 5.31 | (c) | 38.86 | |||||||||
| 9.65 | 4.65 | 797 | 0.99 | 4.99 | 1.03 | 4.95 | 38.86 | ||||||||||||||
| 9.69 | 3.71 | 60,782 | 0.80 | 5.40 | 1.02 | 5.18 | 33.64 | ||||||||||||||
| 9.70 | 4.09 | 441,228 | 0.53 | 5.63 | 0.53 | 5.63 | 33.64 | ||||||||||||||
| 9.70 | 3.83 | 5,999 | 0.78 | 5.33 | 0.78 | 5.33 | 33.64 | ||||||||||||||
| 9.70 | 3.57 | 822 | 1.03 | 5.09 | 1.03 | 5.09 | 33.64 | ||||||||||||||
| 9.88 | 6.43 | 43,393 | 0.74 | 5.60 | 1.02 | 5.32 | 46.58 | ||||||||||||||
| 9.88 | 6.70 | 463,511 | 0.49 | 5.99 | 0.52 | 5.96 | 46.58 | ||||||||||||||
| 9.88 | 6.43 | 2,793 | 0.74 | 5.73 | 0.77 | 5.70 | 46.58 | ||||||||||||||
| 9.88 | 3.81 | (d) | 346 | 1.05 | (c) | 5.64 | (c) | 1.08 | (c) | 5.61 | (c) | 46.58 | |||||||||
| 9.83 | 6.60 | 10,728 | 0.70 | 5.59 | 1.01 | 5.28 | 52.36 | ||||||||||||||
| 9.83 | 6.86 | 613,149 | 0.45 | 5.85 | 0.51 | 5.79 | 52.36 | ||||||||||||||
| 9.83 | 6.60 | 3,792 | 0.70 | 5.59 | 0.76 | 5.53 | 52.36 | ||||||||||||||
| 9.77 | 2.74 | (d) | 15,203 | 0.69 | (c) | 5.87 | (c) | 1.01 | (c) | 5.55 | (c) | 24.12 | |||||||||
| 9.77 | 6.75 | 657,358 | 0.46 | 5.77 | 0.53 | 5.70 | 24.12 | ||||||||||||||
| 9.77 | 6.48 | 3,572 | 0.71 | 5.50 | 0.78 | 5.43 | 24.12 | ||||||||||||||
| Income (loss) from
investment operations(a) |
Distributions to
shareholders |
|||||||||||||
|---|---|---|---|---|---|---|---|---|---|---|---|---|---|---|
| Net asset
value at beginning of period |
Net
investment income |
Net realized
and unrealized gain (loss) |
From net
investment income |
Net increase
(decrease) in net asset value |
||||||||||
| FOR THE SIX MONTHS ENDED APRIL 30 (UNAUDITED), | ||||||||||||||
| 2000 - Class A Shares | $9.57 | $0.27 | $(0.15 | ) | $(0.30 | ) | $(0.18 | ) | ||||||
| 2000 - Class B Shares | 9.56 | 0.25 | (0.17 | ) | (0.27 | ) | (0.19 | ) | ||||||
| 2000 - Class C Shares | 9.54 | 0.26 | (0.18 | ) | (0.27 | ) | (0.19 | ) | ||||||
| 2000 - Institutional Shares | 9.57 | 0.31 | (0.18 | ) | (0.32 | ) | (0.19 | ) | ||||||
| 2000 - Service Shares | 9.56 | 0.28 | (0.17 | ) | (0.30 | ) | (0.19 | ) | ||||||
| FOR THE YEARS ENDED OCTOBER 31, | ||||||||||||||
| 1999 - Class A Shares | 9.91 | 0.55 | (0.36 | ) | (0.53 | ) | (0.34 | ) | ||||||
| 1999 - Class B Shares | 9.88 | 0.48 | (0.33 | ) | (0.47 | ) | (0.32 | ) | ||||||
| 1999 - Class C Shares | 9.88 | 0.47 | (0.36 | ) | (0.45 | ) | (0.34 | ) | ||||||
| 1999 - Institutional Shares | 9.90 | 0.59 | (0.35 | ) | (0.57 | ) | (0.33 | ) | ||||||
| 1999 - Administration Shares (h) | 9.91 | 0.40 | (e) | (0.25 | ) (e) | (0.39 | ) | (0.24 | ) | |||||
| 1999 - Service Shares | 9.89 | 0.54 | (0.35 | ) | (0.52 | ) | (0.33 | ) | ||||||
| 1998 - Class A Shares | 9.88 | 0.57 | 0.04 | (0.58 | ) | 0.03 | ||||||||
| 1998 - Class B Shares | 9.86 | 0.51 | 0.03 | (0.52 | ) | 0.02 | ||||||||
| 1998 - Class C Shares | 9.86 | 0.49 | 0.03 | (0.50 | ) | 0.02 | ||||||||
| 1998 - Institutional Shares | 9.86 | 0.58 | 0.06 | (0.60 | ) | 0.04 | ||||||||
| 1998 - Administration Shares | 9.89 | 0.55 | 0.05 | (0.58 | ) | 0.02 | ||||||||
| 1998 - Service Shares | 9.86 | 0.55 | 0.04 | (0.56 | ) | 0.03 | ||||||||
| 1997 - Class A Shares (commenced May 1) | 9.78 | 0.31 | (e) | 0.09 | (e) | (0.30 | ) | 0.10 | ||||||
| 1997 - Class B Shares (commenced May 1) | 9.75 | 0.28 | (e) | 0.10 | (e) | (0.27 | ) | 0.11 | ||||||
| 1997 - Class C Shares (commenced August 15) | 9.83 | 0.12 | (e) | 0.02 | (e) | (0.11 | ) | 0.03 | ||||||
| 1997 - Institutional Shares | 9.83 | 0.64 | (e) | 0.03 | (e) | (0.64 | ) | 0.03 | ||||||
| 1997 - Administration Shares | 9.85 | 0.62 | (e) | 0.04 | (e) | (0.62 | ) | 0.04 | ||||||
| 1997 - Service Shares | 9.82 | 0.59 | (e) | 0.04 | (e) | (0.59 | ) | 0.04 | ||||||
| 1996 - Institutional Shares | 9.82 | 0.63 | (e) | 0.01 | (e) | (0.63 | ) | 0.01 | ||||||
| 1996 - Administration Shares (g) | 9.86 | 0.38 | (e) | — | (e) | (0.39 | ) | (0.01 | ) | |||||
| 1996 - Service Shares (Commenced April 10) | 9.72 | 0.31 | (e) | 0.10 | (e) | (0.31 | ) | 0.10 | ||||||
| 1995 - Institutional Shares | 9.64 | 0.66 | (e) | 0.17 | (e) | (0.65 | ) | 0.18 | ||||||
| 1995 - Administration Shares (g) | 9.64 | 0.24 | (e) | (0.04 | ) (e) | (0.21 | ) | (0.01 | ) | |||||
(a)
|
Includes the balancing effect of calculating per share
amounts.
|
(b)
|
Assumes
investment at the net asset value at the beginning of the
period, reinvestment of all distributions, a complete
redemption of the investment at the net asset value at the end
of the period and no sales charge. Total return would be
reduced if a sales or redemption charge were taken into
account.
|
(c)
|
Annualized.
|
(d)
|
Not
annualized.
|
(e)
|
Calculated based on the average shares outstanding
methodology.
|
(f)
|
Includes the effect of mortgage dollar roll
transactions.
|
(g)
|
Short
Duration Government Fund Administration shares commenced
activity on April 15, 1993, were redeemed in full on February
23, 1995 and re-commenced on February 28, 1996 at
$9.86.
|
(h)
|
Administration Class shares were liquidated on July 20,
1999. Ending net asset value shown as of July 20,
1999.
|
| Ratios
assuming no voluntary waiver
of fees or expense limitations |
|||||||||||||||||||||
|---|---|---|---|---|---|---|---|---|---|---|---|---|---|---|---|---|---|---|---|---|---|
| Net asset
value, end of period |
Total
return(b) |
Net assets
at end of period (in 000s) |
Ratio of
net expenses to average net assets |
Ratio of
net investment income to average net assets |
Ratio of
expenses to average net assets |
Ratio of
net investment income to average net assets |
Portfolio
turnover rate(f) |
||||||||||||||
| $9.39 | 1.31 | % (d) | $ 36,203 | 0.94 | % (c) | 6.12 | % (c) | 1.09 | % (c) | 5.97 | % (c) | 61.15 | % (d) | ||||||||
| 9.37 | 0.90 | (d) | 5,824 | 1.54 | (c) | 5.47 | (c) | 1.84 | (c) | 5.17 | (c) | 61.15 | (d) | ||||||||
| 9.35 | 0.82 | (d) | 5,918 | 1.69 | (c) | 5.31 | (c) | 1.84 | (c) | 5.16 | (c) | 61.15 | (d) | ||||||||
| 9.38 | 1.41 | (d) | 124,347 | 0.54 | (c) | 6.48 | (c) | 0.69 | (c) | 6.33 | (c) | 61.15 | (d) | ||||||||
| 9.37 | 1.15 | (d) | 7,122 | 1.04 | (c) | 5.99 | (c) | 1.19 | (c) | 5.84 | (c) | 61.15 | (d) | ||||||||
| 9.57 | 1.97 | 52,235 | 0.94 | 5.61 | 1.07 | 5.48 | 172.61 | ||||||||||||||
| 9.56 | 1.56 | 6,937 | 1.54 | 5.04 | 1.82 | 4.76 | 172.61 | ||||||||||||||
| 9.54 | 1.21 | 7,029 | 1.69 | 4.83 | 1.82 | 4.70 | 172.61 | ||||||||||||||
| 9.57 | 2.49 | 146,062 | 0.54 | 6.03 | 0.67 | 5.90 | 172.61 | ||||||||||||||
| 9.67 (h) | 1.57 | (d) | — | 0.79 | (c) | 5.76 | (c) | 0.92 | (c) | 5.63 | (c) | 172.61 | |||||||||
| 9.56 | 1.97 | 6,605 | 1.04 | 5.54 | 1.17 | 5.41 | 172.61 | ||||||||||||||
| 9.91 | 6.36 | 56,725 | 0.81 | 5.68 | 1.32 | 5.17 | 119.89 | ||||||||||||||
| 9.88 | 5.62 | 5,025 | 1.41 | 5.12 | 1.87 | 4.66 | 119.89 | ||||||||||||||
| 9.88 | 5.46 | 4,527 | 1.56 | 4.64 | 1.87 | 4.33 | 119.89 | ||||||||||||||
| 9.90 | 6.75 | 145,514 | 0.53 | 6.06 | 0.84 | 5.75 | 119.89 | ||||||||||||||
| 9.91 | 6.27 | 7,357 | 0.78 | 5.76 | 1.09 | 5.45 | 119.89 | ||||||||||||||
| 9.89 | 6.12 | 6,232 | 1.03 | 5.56 | 1.34 | 5.25 | 119.89 | ||||||||||||||
| 9.88 | 4.14 | (d) | 9,491 | 0.70 | (c) | 6.05 | (c) | 1.32 | (c) | 5.43 | (c) | 102.58 | |||||||||
| 9.86 | 3.94 | (d) | 747 | 1.30 | (c) | 5.52 | (c) | 1.82 | (c) | 5.00 | (c) | 102.58 | |||||||||
| 9.86 | 1.44 | (d) | 190 | 1.45 | (c) | 5.52 | (c) | 1.82 | (c) | 5.15 | (c) | 102.58 | |||||||||
| 9.86 | 7.07 | 103,729 | 0.45 | 6.43 | 0.82 | 6.06 | 102.58 | ||||||||||||||
| 9.89 | 6.91 | 1,060 | 0.70 | 6.19 | 1.07 | 5.82 | 102.58 | ||||||||||||||
| 9.86 | 6.63 | 3,337 | 0.95 | 5.92 | 1.32 | 5.55 | 102.58 | ||||||||||||||
| 9.83 | 6.75 | 99,944 | 0.45 | 6.44 | 0.71 | 6.18 | 115.45 | ||||||||||||||
| 9.85 | 4.00 | (d) | 252 | 0.70 | (c) | 5.97 | (c) | 0.96 | (c) | 5.71 | (c) | 115.45 | |||||||||
| 9.82 | 4.35 | (d) | 1,822 | 0.95 | (c) | 6.05 | (c) | 1.21 | (c) | 5.79 | (c) | 115.45 | |||||||||
| 9.82 | 8.97 | 103,760 | 0.45 | 6.87 | 0.72 | 6.60 | 292.56 | ||||||||||||||
| 9.63 | 2.10 | (d) | — | 0.70 | (c) | 7.91 | (c) | 0.90 | (c) | 7.71 | (c) | 292.56 | |||||||||
| Income
(loss) from
investment operations (a) |
Distributions to shareholders |
|||||||||||||||||||
|---|---|---|---|---|---|---|---|---|---|---|---|---|---|---|---|---|---|---|---|---|
| Net asset
value, beginning of period |
Net
investment income |
Net realized
and unrealized gain (loss) |
From net
investment income |
In excess
of net investment income |
From
net realized gains |
|||||||||||||||
| FOR THE SIX MONTHS ENDED APRIL 30 (UNAUDITED), | ||||||||||||||||||||
| 2000 - Class A Shares | $13.70 | $0.40 | $(0.18 | ) | $(0.40 | ) | $ — | $ — | ||||||||||||
| 2000 - Class B Shares | 13.72 | 0.35 | (0.19 | ) | (0.35 | ) | — | — | ||||||||||||
| 2000 - Class C Shares | 13.71 | 0.35 | (0.19 | ) | (0.35 | ) | — | — | ||||||||||||
| 2000 - Institutional Shares | 13.69 | 0.43 | (0.18 | ) | (0.43 | ) | — | — | ||||||||||||
| 2000 - Service Shares | 13.63 | 0.39 | (0.13 | ) | (0.39 | ) | — | — | ||||||||||||
| FOR THE YEARS ENDED OCTOBER 31, | ||||||||||||||||||||
| 1999 - Class A Shares | 14.91 | 0.80 | (0.89 | ) | (0.77 | ) | — | (0.35 | ) | |||||||||||
| 1999 - Class B Shares | 14.92 | 0.69 | (0.87 | ) | (0.67 | ) | — | (0.35 | ) | |||||||||||
| 1999 - Class C Shares | 14.91 | 0.69 | (0.88 | ) | (0.66 | ) | — | (0.35 | ) | |||||||||||
| 1999 - Institutional Shares | 14.90 | 0.85 | (0.88 | ) | (0.83 | ) | — | (0.35 | ) | |||||||||||
| 1999 - Service Shares | 14.88 | 0.77 | (0.92 | ) | (0.75 | ) | — | (0.35 | ) | |||||||||||
| 1998 - Class A Shares | 14.59 | 0.81 | 0.45 | (0.81 | ) | (0.07) | (0.06 | ) | ||||||||||||
| 1998 - Class B Shares | 14.61 | 0.72 | 0.42 | (0.72 | ) | (0.05) | (0.06 | ) | ||||||||||||
| 1998 - Class C Shares | 14.60 | 0.74 | 0.40 | (0.74 | ) | (0.03) | (0.06 | ) | ||||||||||||
| 1998 - Institutional Shares | 14.59 | 0.87 | 0.42 | (0.87 | ) | (0.05) | (0.06 | ) | ||||||||||||
| 1998 - Service Shares | 14.59 | 0.80 | 0.40 | (0.80 | ) | (0.05) | (0.06 | ) | ||||||||||||
| 1997 - Class A Shares | 14.36 | 0.91 | 0.29 | (0.90 | ) | — | (0.07 | ) | ||||||||||||
| 1997 - Class B Shares | 14.37 | 0.80 | 0.30 | (0.79 | ) | — | (0.07 | ) | ||||||||||||
| 1997 - Class C Shares (commenced August 15) | 14.38 | 0.17 | 0.22 | (0.17 | ) | — | — | |||||||||||||
| 1997 - Institutional Shares (commenced August 15) | 14.37 | 0.20 | 0.22 | (0.20 | ) | — | — | |||||||||||||
| 1997 - Service Shares (commenced August 15) | 14.37 | 0.20 | 0.21 | (0.19 | ) | — | — | |||||||||||||
| 1996 - Class A shares | 14.47 | 0.92 | (0.11 | ) | (0.92 | ) | — | — | ||||||||||||
| 1996 - Class B shares (commenced May 1) | 14.11 | 0.41 | 0.26 | (0.41 | ) | — | — | |||||||||||||
| 1995 - Class A shares | 13.47 | 0.94 | 1.00 | (0.94 | ) | — | — | |||||||||||||
(a)
|
Includes the balancing effect of calculating per share
amounts.
|
(b)
|
Assumes
investment at the net asset value at the beginning of the
period, reinvestment of all distributions, a complete
redemption of the investment at the net asset value at the end
of the period and no sales charge. Total return would be
reduced if a sales or redemption charge were taken into
account.
|
(c)
|
Annualized.
|
(d)
|
Not
annualized.
|
(e)
|
Includes the effect of mortgage dollar roll
transactions.
|
| Ratios
assuming no voluntary waiver
of fees or expense limitations |
||||||||||||||||||||||||
|---|---|---|---|---|---|---|---|---|---|---|---|---|---|---|---|---|---|---|---|---|---|---|---|---|
| Net increase
(decrease) in net asset value |
Net asset
value, end of period |
Total
return(b) |
Net assets
at end of period (in 000s) |
Ratio of
net expenses to average net assets |
Ratio of
net investment income to average net assets |
Ratio of
expenses to average net assets |
Ratio of
net investment income to average net assets |
Portfolio
turnover rate(e) |
||||||||||||||||
| $(0.18 | ) | $13.52 | 1.65 | %(d) | $ 76,156 | 0.98 | %(c) | 5.95 | %(c) | 1.36 | %(c) | 5.57 | %(c) | 159.93 | %(d) | |||||||||
| (0.19 | ) | 13.53 | 1.20 | (d) | 17,682 | 1.73 | (c) | 5.19 | (c) | 2.11 | (c) | 4.81 | (c) | 159.93 | (d) | |||||||||
| (0.19 | ) | 13.52 | 1.20 | (d) | 6,841 | 1.73 | (c) | 5.20 | (c) | 2.11 | (c) | 4.82 | (c) | 159.93 | (d) | |||||||||
| (0.18 | ) | 13.51 | 1.85 | (d) | 7,585 | 0.58 | (c) | 6.35 | (c) | 0.96 | (c) | 5.97 | (c) | 159.93 | (d) | |||||||||
| (0.13 | ) | 13.50 | 1.97 | (d) | 350 | 1.08 | (c) | 5.97 | (c) | 1.46 | (c) | 5.59 | (c) | 159.93 | (d) | |||||||||
| (1.21 | ) | 13.70 | (0.63 | ) | 82,102 | 0.98 | 5.63 | 1.33 | 5.28 | 277.64 | ||||||||||||||
| (1.20 | ) | 13.72 | (1.29 | ) | 19,684 | 1.73 | 4.88 | 2.08 | 4.53 | 277.64 | ||||||||||||||
| (1.20 | ) | 13.71 | (1.29 | ) | 10,053 | 1.73 | 4.89 | 2.08 | 4.54 | 277.64 | ||||||||||||||
| (1.21 | ) | 13.69 | (0.23 | ) | 5,899 | 0.58 | 6.07 | 0.93 | 5.72 | 277.64 | ||||||||||||||
| (1.25 | ) | 13.63 | (1.01 | ) | 15 | 1.08 | 5.56 | 1.43 | 5.21 | 277.64 | ||||||||||||||
| 0.32 | 14.91 | 8.98 | 101,015 | 0.76 | 5.53 | 1.53 | 4.76 | 315.43 | ||||||||||||||||
| 0.31 | 14.92 | 8.09 | 16,125 | 1.51 | 4.76 | 2.05 | 4.22 | 315.43 | ||||||||||||||||
| 0.31 | 14.91 | 8.09 | 9,639 | 1.51 | 4.59 | 2.05 | 4.05 | 315.43 | ||||||||||||||||
| 0.31 | 14.90 | 9.19 | 2,642 | 0.51 | 5.82 | 1.05 | 5.28 | 315.43 | ||||||||||||||||
| 0.29 | 14.88 | 8.53 | 2 | 1.01 | 5.48 | 1.55 | 4.94 | 315.43 | ||||||||||||||||
| 0.23 | 14.59 | 8.72 | 68,859 | 0.50 | 6.38 | 1.82 | 5.06 | 395.75 | ||||||||||||||||
| 0.24 | 14.61 | 7.96 | 8,041 | 1.25 | 5.59 | 2.32 | 4.52 | 395.75 | ||||||||||||||||
| 0.22 | 14.60 | 2.72 | (d) | 1,196 | 1.25 | (c) | 5.45 | (c) | 2.32 | (c) | 4.38 | (c) | 395.75 | |||||||||||
| 0.22 | 14.59 | 2.94 | (d) | 1,894 | 0.25 | (c) | 7.03 | (c) | 1.32 | (c) | 5.96 | (c) | 395.75 | |||||||||||
| 0.22 | 14.59 | 2.85 | (d) | 2 | 0.75 | (c) | 6.49 | (c) | 1.82 | (c) | 5.42 | (c) | 395.75 | |||||||||||
| (0.11 | ) | 14.36 | 5.80 | 30,603 | 0.50 | 6.42 | 1.89 | 5.03 | 485.09 | |||||||||||||||
| 0.26 | 14.37 | 4.85 | (d) | 234 | 1.25 | (c) | 5.65 | (c) | 2.39 | (c) | 4.51 | (c) | 485.09 | |||||||||||
| 1.00 | 14.47 | 14.90 | 29,503 | 0.47 | 6.67 | 2.34 | 4.80 | 449.53 | ||||||||||||||||
| Income
(loss) from
investment operations (a) |
Distributions to shareholders |
|||||||||||||||||||
|---|---|---|---|---|---|---|---|---|---|---|---|---|---|---|---|---|---|---|---|---|
| Net asset
value at beginning of period |
Net
investment income |
Net realized
and unrealized gain (loss) |
From net
investment income |
In excess
of net investment income |
From net
realized gains |
Net increase
(decrease) in net asset value |
||||||||||||||
| FOR THE SIX MONTHS ENDED APRIL 30 (UNAUDITED), | ||||||||||||||||||||
| 2000 - Class A Shares | $ 9.50 | $ 0.28 | $(0.16 | ) | $(0.28 | ) | $ — | $ — | $(0.16 | ) | ||||||||||
| 2000 - Class B Shares | 9.52 | 0.24 | (0.15 | ) | (0.24 | ) | — | — | (0.15 | ) | ||||||||||
| 2000 - Class C Shares | 9.52 | 0.24 | (0.15 | ) | (0.24 | ) | — | — | (0.15 | ) | ||||||||||
| 2000 - Institutional Shares | 9.52 | 0.31 | (0.17 | ) | (0.30 | ) | — | — | (0.16 | ) | ||||||||||
| 2000 - Service Shares | 9.52 | 0.27 | (0.15 | ) | (0.27 | ) | — | — | (0.15 | ) | ||||||||||
| FOR THE YEARS ENDED OCTOBER 31, | ||||||||||||||||||||
| 1999 - Class A Shares | 10.25 | 0.54 | (0.61 | ) | (0.53 | ) | — | (0.15 | ) | (0.75 | ) | |||||||||
| 1999 - Class B Shares | 10.28 | 0.48 | (0.62 | ) | (0.47 | ) | — | (0.15 | ) | (0.76 | ) | |||||||||
| 1999 - Class C Shares | 10.28 | 0.47 | (0.62 | ) | (0.46 | ) | — | (0.15 | ) | (0.76 | ) | |||||||||
| 1999 - Institutional Shares | 10.28 | 0.58 | (0.62 | ) | (0.57 | ) | — | (0.15 | ) | (0.76 | ) | |||||||||
| 1999 - Administration Shares(g) | 10.27 | 0.40 | (e) | (0.41 | ) (e) | (0.40 | ) | — | (0.15 | ) | (0.56 | ) | ||||||||
| 1999 - Service Shares | 10.28 | 0.54 | (0.62 | ) | (0.53 | ) | — | (0.15 | ) | (0.76 | ) | |||||||||
| 1998 - Class A Shares | 10.06 | 0.59 | 0.27 | (0.59 | ) | (0.02 | ) | (0.06 | ) | 0.19 | ||||||||||
| 1998 - Class B Shares | 10.09 | 0.52 | 0.27 | (0.52 | ) | (0.02 | ) | (0.06 | ) | 0.19 | ||||||||||
| 1998 - Class C Shares | 10.09 | 0.52 | 0.27 | (0.52 | ) | (0.02 | ) | (0.06 | ) | 0.19 | ||||||||||
| 1998 - Institutional Shares | 10.08 | 0.61 | 0.29 | (0.61 | ) | (0.03 | ) | (0.06 | ) | 0.20 | ||||||||||
| 1998 - Administration Shares | 10.07 | 0.57 | 0.29 | (0.57 | ) | (0.03 | ) | (0.06 | ) | 0.20 | ||||||||||
| 1998 - Service Shares | 10.09 | 0.56 | 0.27 | (0.56 | ) | (0.02 | ) | (0.06 | ) | 0.19 | ||||||||||
| 1997 - Class A Shares (commenced May 1) | 9.70 | 0.30 | 0.36 | (0.30 | ) | — | — | 0.36 | ||||||||||||
| 1997 - Class B Shares (commenced May 1) | 9.72 | 0.27 | 0.37 | (0.27 | ) | — | — | 0.37 | ||||||||||||
| 1997 - Class C Shares (commenced August 15) | 9.93 | 0.11 | 0.16 | (0.11 | ) | — | — | 0.16 | ||||||||||||
| 1997 - Institutional Shares | 9.85 | 0.64 | 0.23 | (0.64 | ) | — | — | 0.23 | ||||||||||||
| 1997 - Administration Shares | 9.84 | 0.62 | 0.23 | (0.62 | ) | — | — | 0.23 | ||||||||||||
| 1997 - Service Shares | 9.86 | 0.59 | 0.23 | (0.59 | ) | — | — | 0.23 | ||||||||||||
| 1996 - Institutional Shares | 10.00 | 0.64 | (0.07 | ) | (0.64 | ) | — | (0.08 | ) | (0.15 | ) | |||||||||
| 1996 - Administrative Shares (commenced February 28) | 9.91 | 0.41 | (0.07 | ) | (0.41 | ) | — | — | (0.07 | ) | ||||||||||
| 1996 - Service Shares (commenced March 13) | 9.77 | 0.38 | 0.09 | (0.38 | ) | — | — | 0.09 | ||||||||||||
| 1995 - Institutional Shares | 9.24 | 0.64 | 0.76 | (0.64 | ) | — | — | 0.76 | ||||||||||||
(a)
|
Includes the balancing effect of calculating per share
amounts.
|
(b)
|
Assumes
investment at the net asset value at the beginning of the
period, reinvestment of all distributions, a complete
redemption of the investment at the net asset value at the end
of period and no sales charge. Total return would be reduced
if a sales or redemption charge were taken into
account.
|
(c)
|
Annualized.
|
(d)
|
Not
annualized.
|
(e)
|
Calculated based on average shares outstanding
methodology.
|
(f)
|
Includes the effect of mortgage dollar roll
transactions.
|
(g)
|
Administration Class shares were liquidated on July 20,
1999. Ending net asset value shown as of July 20,
1999.
|
| Ratios
assuming no voluntary waiver
of fees or expense limitations |
||||||||||||||||||||
|---|---|---|---|---|---|---|---|---|---|---|---|---|---|---|---|---|---|---|---|---|
| Net asset
value, end of period |
Total
return(b) |
Net assets
at end of period (in 000s) |
Ratio of
net expenses to average net assets |
Ratio of
net investment income to average net assets |
Ratio of
expenses to average net assets |
Ratio of
net investment income to average net assets |
Portfolio
turnover rate(f) |
|||||||||||||
| $ 9.34 | 1.27 | %(d) | $ 69,384 | 0.94 | %(c) | 6.00 | %(c) | 0.96 | %(c) | 5.98 | %(c) | 108.97 | %(d) | |||||||
| 9.37 | 1.01 | (d) | 13,301 | 1.69 | (c) | 5.24 | (c) | 1.71 | (c) | 5.22 | (c) | 108.97 | (d) | |||||||
| 9.37 | 1.01 | (d) | 6,062 | 1.69 | (c) | 5.25 | (c) | 1.71 | (c) | 5.23 | (c) | 108.97 | (d) | |||||||
| 9.36 | 1.48 | (d) | 234,643 | 0.54 | (c) | 6.41 | (c) | 0.56 | (c) | 6.39 | (c) | 108.97 | (d) | |||||||
| 9.37 | 1.33 | (d) | 8,088 | 1.04 | (c) | 5.91 | (c) | 1.06 | (c) | 5.89 | (c) | 108.97 | (d) | |||||||
| 9.50 | (0.68 | ) | 65,368 | 0.94 | 5.57 | 0.98 | 5.53 | 279.67 | ||||||||||||
| 9.52 | (1.47 | ) | 14,654 | 1.69 | 4.83 | 1.73 | 4.79 | 279.67 | ||||||||||||
| 9.52 | (1.51 | ) | 7,443 | 1.69 | 4.82 | 1.73 | 4.78 | 279.67 | ||||||||||||
| 9.52 | (0.37 | ) | 216,973 | 0.54 | 5.97 | 0.58 | 5.93 | 279.67 | ||||||||||||
| 9.71 (g) | (0.13 | ) (d) | — | 0.79 | (c) | 5.63 | (c) | 0.83 | (c) | 5.59 | (c) | 279.67 | ||||||||
| 9.52 | (0.87 | ) | 8,172 | 1.04 | 5.50 | 1.08 | 5.46 | 279.67 | ||||||||||||
| 10.25 | 8.76 | 56,267 | 0.74 | 5.58 | 1.21 | 5.11 | 271.50 | |||||||||||||
| 10.28 | 7.94 | 7,209 | 1.49 | 4.82 | 1.75 | 4.56 | 271.50 | |||||||||||||
| 10.28 | 7.94 | 5,587 | 1.49 | 4.81 | 1.75 | 4.55 | 271.50 | |||||||||||||
| 10.28 | 9.15 | 195,730 | 0.46 | 5.95 | 0.72 | 5.69 | 271.50 | |||||||||||||
| 10.27 | 8.88 | 12,743 | 0.71 | 5.70 | 0.97 | 5.44 | 271.50 | |||||||||||||
| 10.28 | 8.50 | 5,263 | 0.96 | 5.44 | 1.22 | 5.18 | 271.50 | |||||||||||||
| 10.06 | 6.94 | (d) | 9,336 | 0.70 | (c) | 6.13 | (c) | 1.33 | (c) | 5.50 | (c) | 361.27 | ||||||||
| 10.09 | 6.63 | (d) | 621 | 1.45 | (c) | 5.28 | (c) | 1.83 | (c) | 4.90 | (c) | 361.27 | ||||||||
| 10.09 | 2.74 | (d) | 272 | 1.45 | (c) | 4.84 | (c) | 1.83 | (c) | 4.46 | (c) | 361.27 | ||||||||
| 10.08 | 9.19 | 79,230 | 0.45 | 6.53 | 0.83 | 6.15 | 361.27 | |||||||||||||
| 10.07 | 8.92 | 6,176 | 0.70 | 6.27 | 1.08 | 5.89 | 361.27 | |||||||||||||
| 10.09 | 8.65 | 1,868 | 0.95 | 6.00 | 1.33 | 5.62 | 361.27 | |||||||||||||
| 9.85 | 5.98 | 72,061 | 0.45 | 6.51 | 0.83 | 6.13 | 414.20 | |||||||||||||
| 9.84 | 3.56 | (d) | 702 | 0.70 | (c) | 6.41 | (c) | 1.08 | (c) | 6.03 | (c) | 414.20 | ||||||||
| 9.86 | 4.90 | (d) | 381 | 0.95 | (c) | 6.37 | (c) | 1.33 | (c) | 5.99 | (c) | 414.20 | ||||||||
| 10.00 | 15.72 | 55,502 | 0.45 | 6.56 | 0.96 | 6.05 | 382.26 | |||||||||||||
| Income
(loss) from
investment operations (a) |
Distributions to shareholders |
||||||||||||||||||||||||
|---|---|---|---|---|---|---|---|---|---|---|---|---|---|---|---|---|---|---|---|---|---|---|---|---|---|
| Net asset
value, beginning of period |
Net
investment income |
Net realized
and unrealized gain (loss) |
From net
investment income |
From
capital |
From
net realized gains |
Net increase
(decrease) in net asset value |
|||||||||||||||||||
| FOR THE SIX MONTHS ENDED APRIL 30 (UNAUDITED), | |||||||||||||||||||||||||
| 2000 - Class A Shares | $14.49 | $0.31 | $ — | $(0.30 | ) | $ — | $ — | $ 0.01 | |||||||||||||||||
| 2000 - Class B Shares | 14.45 | 0.26 | 0.01 | (0.26 | ) | — | — | 0.01 | |||||||||||||||||
| 2000 - Class C Shares | 14.43 | 0.26 | 0.01 | (0.26 | ) | — | — | 0.01 | |||||||||||||||||
| 2000 - Institutional Shares | 14.48 | 0.35 | — | (0.35 | ) | — | — | — | |||||||||||||||||
| 2000 - Service Shares | 14.47 | 0.29 | 0.02 | (0.31 | ) | — | — | — | |||||||||||||||||
| FOR THE YEARS ENDED OCTOBER 31, | |||||||||||||||||||||||||
| 1999 - Class A Shares | 15.65 | 0.62 | (e) | (0.78 | ) (e) | (0.61 | ) | (0.03 | ) | (0.36 | ) | (1.16 | ) | ||||||||||||
| 1999 - Class B Shares | 15.63 | 0.53 | (0.78 | ) | (0.55 | ) | (0.02 | ) | (0.36 | ) | (1.18 | ) | |||||||||||||
| 1999 - Class C Shares | 15.60 | 0.53 | (0.77 | ) | (0.55 | ) | (0.02 | ) | (0.36 | ) | (1.17 | ) | |||||||||||||
| 1999 - Institutional Shares | 15.64 | 0.71 | (0.77 | ) | (0.71 | ) | (0.03 | ) | (0.36 | ) | (1.16 | ) | |||||||||||||
| 1999 - Service Shares | 15.64 | 0.64 | (0.79 | ) | (0.63 | ) | (0.03 | ) | (0.36 | ) | (1.17 | ) | |||||||||||||
| 1998 - Class A Shares | 15.10 | 0.72 | (e) | 0.90 | (e) | (1.01 | ) | — | (0.06 | ) | 0.55 | ||||||||||||||
| 1998 - Class B Shares | 15.08 | 0.63 | (e) | 0.92 | (e) | (0.94 | ) | — | (0.06 | ) | 0.55 | ||||||||||||||
| 1998 - Class C Shares | 15.06 | 0.63 | (e) | 0.91 | (e) | (0.94 | ) | — | (0.06 | ) | 0.54 | ||||||||||||||
| 1998 - Institutional Shares | 15.09 | 0.82 | (e) | 0.90 | (e) | (1.11 | ) | — | (0.06 | ) | 0.55 | ||||||||||||||
| 1998 - Service Shares | 15.09 | 0.74 | (e) | 0.91 | (e) | (1.04 | ) | — | (0.06 | ) | 0.55 | ||||||||||||||
| 1997 - Class A shares | 14.53 | 0.59 | 0.77 | (0.79 | ) | — | — | 0.57 | |||||||||||||||||
| 1997 - Class B shares | 14.53 | 0.72 | 0.56 | (0.73 | ) | — | — | 0.55 | |||||||||||||||||
| 1997 - Class C shares (commenced August 15) | 14.80 | 0.16 | 0.29 | (0.19 | ) | — | — | 0.26 | |||||||||||||||||
| 1997 - Institutional Shares | 14.52 | 0.88 | 0.56 | (0.87 | ) | — | — | 0.57 | |||||||||||||||||
| 1997 - Service Shares (commenced March 12) | 14.69 | 0.53 | 0.39 | (0.52 | ) | — | — | 0.40 | |||||||||||||||||
| 1996 - Class A shares | 14.45 | 0.71 | 0.80 | (1.43 | ) | — | — | 0.08 | |||||||||||||||||
| 1996 - Class B shares (commenced May 1) | 14.03 | 0.34 | 0.52 | (0.36 | ) | — | — | 0.50 | |||||||||||||||||
| 1996 - Institutional shares | 14.45 | 1.15 | 0.42 | (1.50 | ) | — | — | 0.07 | |||||||||||||||||
| 1995 - Class A shares | 13.43 | 0.89 | 1.07 | (0.94 | ) | — | — | 1.02 | |||||||||||||||||
| 1995 - Institutional shares (commenced August 1) | 14.09 | 0.22 | 0.40 | (0.26 | ) | — | — | 0.36 | |||||||||||||||||
(a)
|
Includes the balancing effect of calculating per share
amounts.
|
(b)
|
Assumes
investment at the net asset value at the beginning of the
period, reinvestment of all distributions, a complete
redemption of the investment at the net asset value at the end
of period and no sales charge. Total return would be reduced
if a sales or redemption charge were taken into
account.
|
(c)
|
Annualized.
|
(d)
|
Not
annualized.
|
(e)
|
Calculated based on the average shares outstanding
methodology.
|
| Ratios assuming no voluntary
waiver
of fees or expense limitations |
|||||||||||||||||||||
|---|---|---|---|---|---|---|---|---|---|---|---|---|---|---|---|---|---|---|---|---|---|
| Net asset
value, end of period |
Total
return(b) |
Net assets
at end of period (in 000s) |
Ratio of
net expenses to average net assets |
Ratio of
net investment income to average net assets |
Ratio of
expenses to average net assets |
Ratio of
net investment income to average net assets |
Portfolio
turnover rate |
||||||||||||||
| $14.50 | 2.16 | % (d) | $264,221 | 1.34 | % (c) | 4.13 | % (c) | 1.70 | % (c) | 3.77 | % (c) | 97.43 | % (d) | ||||||||
| 14.46 | 1.92 | (d) | 18,922 | 1.84 | (c) | 3.64 | (c) | 2.20 | (c) | 3.28 | (c) | 97.43 | (d) | ||||||||
| 14.44 | 1.91 | (d) | 6,416 | 1.84 | (c) | 3.62 | (c) | 2.20 | (c) | 3.26 | (c) | 97.43 | (d) | ||||||||
| 14.48 | 2.43 | (d) | 280,044 | 0.69 | (c) | 4.79 | (c) | 1.05 | (c) | 4.43 | (c) | 97.43 | (d) | ||||||||
| 14.47 | 2.18 | (d) | 1,794 | 1.19 | (c) | 4.31 | (c) | 1.55 | (c) | 3.95 | (c) | 97.43 | (d) | ||||||||
| 14.49 | (1.14 | ) | 271,832 | 1.34 | 4.12 | 1.72 | 3.74 | 158.27 | |||||||||||||
| 14.45 | (1.74 | ) | 16,724 | 1.84 | 3.60 | 2.22 | 3.22 | 158.27 | |||||||||||||
| 14.43 | (1.68 | ) | 7,786 | 1.84 | 3.60 | 2.22 | 3.22 | 158.27 | |||||||||||||
| 14.48 | (0.49 | ) | 279,621 | 0.69 | 4.75 | 1.07 | 4.37 | 158.27 | |||||||||||||
| 14.47 | (1.06 | ) | 1,115 | 1.19 | 4.28 | 1.57 | 3.90 | 158.27 | |||||||||||||
| 15.65 | 11.21 | 217,362 | 1.31 | 4.71 | 1.75 | 4.27 | 229.91 | ||||||||||||||
| 15.63 | 10.66 | 8,135 | 1.83 | 4.19 | 2.24 | 3.78 | 229.91 | ||||||||||||||
| 15.60 | 10.65 | 4,090 | 1.83 | 4.20 | 2.24 | 3.79 | 229.91 | ||||||||||||||
| 15.64 | 11.95 | 178,532 | 0.66 | 5.40 | 1.07 | 4.99 | 229.91 | ||||||||||||||
| 15.64 | 11.43 | 1,058 | 1.16 | 4.92 | 1.57 | 4.51 | 229.91 | ||||||||||||||
| 15.10 | 9.66 | 167,096 | 1.17 | 5.19 | 1.60 | 4.76 | 383.72 | ||||||||||||||
| 15.08 | 9.04 | 3,465 | 1.71 | 4.76 | 2.10 | 4.37 | 383.72 | ||||||||||||||
| 15.06 | 3.03 | (d) | 496 | 1.71 | (c) | 4.98 | (c) | 2.10 | (c) | 4.59 | (c) | 383.72 | |||||||||
| 15.09 | 10.26 | 60,929 | 0.65 | 5.72 | 1.04 | 5.33 | 383.72 | ||||||||||||||
| 15.09 | 6.42 | (d) | 151 | 1.15 | (c) | 5.33 | (c) | 1.54 | (c) | 4.94 | (c) | 383.72 | |||||||||
| 14.53 | 11.05 | 198,665 | 1.16 | 5.81 | 1.64 | 5.33 | 232.15 | ||||||||||||||
| 14.53 | 6.24 | (d) | 256 | 1.70 | (c) | 5.16 | (c) | 2.14 | (c) | 4.72 | (c) | 232.15 | |||||||||
| 14.52 | 11.55 | 54,254 | 0.65 | 6.35 | 1.11 | 5.89 | 232.15 | ||||||||||||||
| 14.45 | 15.08 | 245,835 | 1.29 | 6.23 | 1.58 | 5.94 | 265.86 | ||||||||||||||
| 14.45 | 4.42 | (d) | 31,619 | 0.65 | (c) | 6.01 | (c) | 1.08 | (c) | 5.58 | (c) | 265.86 | |||||||||
GOLDMAN SACHS FUND PROFILE
Goldman Sachs
Taxable Investment Grade Funds
Generally speaking, bond investments may help individuals mitigate overall portfolio volatility, without sacrificing attractive returns.
Goldman Sachs Taxable Investment Grade Funds offer investors access to the benefits associated with fixed income investing. The Funds seek current income from portfolios that invest in a variety of fixed income securities.
Target Your Needs
Goldman Sachs Taxable Investment Grade Funds have distinct investment objectives and defined positions on the risk/return spectrum. As your investment objectives change, you can exchange shares within Goldman Sachs Funds without any additional charge. Please note: in general, greater returns are associated with greater risk.*
Goldman Sachs Fixed Income Funds
| |
HIGH YEILD
|
|
| Higher
Risk/Return
|
||
|
n High Yield Fund
|
| n Global Income Fund |
| TAXABLE
|
n Core Fixed Income Fund |
| n Government Income Fund |
| n Short Duration Government Fund |
| n Adjustable Rate Government Fund |
| TAX-FREE
|
n High Yield Municipal Fund |
| Lower
Risk/Return
|
n Municipal Income Fund |
| n Short Duration Tax-Free Fund |
For More Information
To learn more about Goldman Sachs Taxable Investment Grade Funds and other Goldman Sachs Funds, call your investment professional today.
THE GOLDMAN
SACHS ADVANTAGE
When you invest in Goldman Sachs Taxable Investment Grade Funds, you can capitalize on Goldman Sachs' 131-year history of excellence while benefiting from the firm's leadership in three areas:
1 Global Resources
With professionals based through-out the Americas, Europe and Asia, Goldman Sachs possesses first-hand knowledge of the world's markets and economies.
2 Fundamental Research
Goldman Sachs is recognized by the managements of corporations worldwide as a leader in investment research. As a result, we obtain face-to-face meetings with managers on a timely, regular basis.
3 Risk Management
Goldman, Sachs & Co. excels in understanding,monitoring and managing investment risk - a process that is integrated into all Goldman Sachs investment products.
*The exchange privilege is subject to termination and its terms are subject to change.
GOLDMAN SACHS ASSET MANAGEMENT 32 OLD SLIP, 17TH FLOOR, NEW YORK, NEW YORK 10005
| T R U S T E E S | O F F I C E R S |
| Ashok N. Bakhru, Chairman | Douglas C. Grip, President |
| David B. Ford | Jesse H. Cole, Vice President |
| Douglas C. Grip | Kerry Daniels, Vice President |
| John P. McNulty | James A. Fitzpatrick, Vice President |
| Mary P. McPherson | Mary Hoppa, Vice President |
| Alan A. Shuch | Nancy L. Mucker, Vice President |
| Jackson W. Smart, Jr. | John M. Perlowski, Treasurer |
| William H. Springer | Philip V. Giuca, Jr., Assistant Treasurer |
| Richard P. Strubel | Michael J. Richman, Secretary |
| Amy E. Belanger, Assistant Secretary | |
| Howard B. Surloff, Assistant Secretary | |
| Valerie A. Zondorak, Assistant Secretary | |
| GOLDMAN, SACHS & CO. | |
| Distributor and Transfer Agent | |
| GOLDMAN SACHS ASSET MANAGEMENT | |
| Investment Adviser | |
| GOLDMAN SACHS INTERNATIONAL | |
| Investment Adviser | |
| 133 Peterborough Court | |
| London, England EC4A 2BB |
Visit our internet address: www.gs.com/funds
This material is not authorized for distribution to prospective investors unless preceded or accompanied by a current Prospectus. Investors should read the Prospectus carefully before investing or sending money.
Goldman, Sachs & Co. is the distributor of the Funds.
Goldman Sachs Government Income Fund's, Goldman Sachs Short Duration Government Fund's and Goldman Sachs Adjustable Rate Government Fund's net asset values and yields are not guaranteed by the U.S. Government or by its agencies, instrumentalities or sponsored enterprises.
Goldman Sachs Global Income Fund's and Goldman Sachs Core Fixed Income Fund's foreign investments may be more volatile than an investment in U.S. securities and are subject to the risks of currency fluctuations and political developments.
Copyright 2000 Goldman, Sachs & Co. All rights reserved. Date of first use: June 30, 2000 / 00-924
|
|