
|
|
|
|
|
|
|
|
|
Goldman Sachs Funds
H I G H Y I E L D F U N D
Semiannual Report April 30, 2000
A high level of current income through a diversified portfolio of high yield securities.
[GRAPHIC]
[LOGO OF GOLDMAN SACHS FUNDS]
GOLDMAN SACHS HIGH YIELD FUND
Market Overview
Dear Shareholder:
During the period under review, U.S. bond markets generally posted lackluster results, due to expanding economies and higher interest rates.
Market Review
Another major factor affecting the U.S. bond market was the U.S. Treasury's decision to buy back long maturity debt. The reduction in supply is aimed at reducing the average maturity and interest cost of Treasury debt. This led to a sharp increase in demand for 30-year bonds, resulting in a strong rally and an inverted yield curve.
Outlook
Looking ahead, we fully expect the Fed to remain steadfast in its resolve to cool the economy and preempt inflation. The Fed has raised interest rates on five different occasions since the end of last June, yet economic growth shows no signs of abating. Based on recent economic data it now appears the Fed will need to tighten financial conditions more quickly, and by a greater amount, to prevent the economy from overheating. We now believe that the Fed will raise its Federal Funds rate target in the months to follow. When it appears that the economy has sufficiently slowed we would expect spreads to tighten.
As always, we appreciate your support and look forward to serving your investment needs in the years to come.
Sincerely,
| /s/ David B. Ford | /s/ David W. Blood | /s/ Sharmin Mossavar-Rahmani | ||
| David B. Ford | David W. Blood | Sharmin Mossavar-Rahmani | ||
| Co-Head, Goldman Sachs | Co-Head, Goldman Sachs | CIO, Fixed Income Investments, | ||
| Asset Management | Asset Management | Goldman Sachs Asset Management |
May 9, 2000
| NOT FDIC-INSURED | |
| May Lose Value | |
| No Bank Guarantee |
Fund Basics
as of April 30, 2000
Assets Under Management
$789.1 Million
Number of Holdings
322
NASDAQ SYMBOLS
Class A Shares
GSHAX
Class B Shares
GSHBX
Class C Shares
GSHCX
Institutional Shares
GSHIX
Service Shares
GSHSX
| PERFORMANCE REVIEW | |||
| October 31,1999- |
Fund Total Return |
30-Day |
Lehman High |
| April 30,2000 |
(based on NAV)1 |
Standardized Yield2 |
Yield Bond Index3 |
| Class A |
2.87% |
10.48% |
0.08% |
| Class B |
2.37% |
10.23% |
0.08% |
| Class C |
2.38% |
10.25% |
0.08% |
| Institutional |
3.07% |
11.40% |
0.08% |
| Service |
2.82% |
N/A |
0.08% |
1 The net asset value represents the net assets of the Fund (ex-dividend) divided by the total number of shares outstanding. The Fund's performance reflects the reinvestment of dividends and other distributions.
2 The 30-Day Standardized Yield of the Fund is calculated by dividing the net investment income per share (as defined by securities industry regulations) earned by the Fund over a 30-day period (ending on the stated month-end date) by the maximum public offering price per share of the Fund on the last day of the period. This number is compounded semiannually and then annualized. This yield does not necessarily reflect income actually earned and distributed by the Fund and, therefore, may not be correlated with the dividends or other distributions paid to shareholders.
3 The Lehman High Yield Bond Index figures do not reflect any fees or expenses. Investors cannot invest directly in the Index.
| STANDARDIZED TOTAL RETURNS4 | |||||
| For the period ending 3/31/00 |
Class A |
Class B |
Class C |
Institutional |
Service |
| One Year |
-5.09% |
-6.30% |
-2.37% |
-0.23% |
-0.73% |
| Since Inception |
2.13% |
1.96% |
3.20% |
4.30% |
3.80% |
| (8/1/97) |
(8/1/97) |
(8/15/97) |
(8/1/97) |
(8/1/97) |
|
4 The Standardized Total Returns are average annual returns as of the most recent calendar quarter-end. They assume reinvestment of all distributions at net asset value. These returns reflect a maximum initial sales charge of 4.5% for Class A shares, the assumed deferred sales charge for Class B shares (5% maximum declining to 0% after six years) and the assumed deferred sales charge for Class C shares (1% if redeemed within 12 months of purchase). Because Institutional and Service shares do not involve sales charges, such charges have not been applied to their Standardized Total Returns.
| TOP 10 HOLDINGS AS OF 4/30/005 | ||||
| Company |
Line of Business |
% of Portfolio |
||
| Telewest Communications PLC |
Media-Cable |
3.5% |
||
| Nextel Communications, Inc. |
Telecommunications-Cellular |
2.4% |
||
| Riverwood International Corp. |
Paper |
2.2% |
||
| CSC Holdings, Inc. |
Media-Cable |
2.0% |
||
| Crown Castle International Corp. |
Media-Non Cable |
1.9% |
||
| NTL Communications Corp. |
Telecommunications-Cellular |
1.7% |
||
| Avecia Group PLC |
Chemicals |
1.5% |
||
| Kappa Beheer B.V. |
Packaging |
1.4% |
||
| Viasystems Group, Inc. |
Technology |
1.3% |
||
| SCG Holding & Semiconductor Corp. |
Technology |
1.3% |
||
| Credit Allocation: AAA 3.1% |
BBB 2.2% |
BB 8.6% |
B 78.5% |
CCC 6.1% |
5 The Fund is actively managed and, as such, its composition may differ over time.
Total return figures represent past performance and do not indicate future results, which will vary. The investment return and principal value of an investment will fluctuate and, therefore, an investor's shares, when redeemed, may be worth more or less than their original cost. Performance reflects expense limitations in effect. In their absence, performance would be reduced.
GOLDMAN SACHS HIGH YIELD FUND
Performance Overview
Dear Shareholder,
We are pleased to report on the performance of the Goldman Sachs High Yield Fund for the six month period that
ended April 30, 2000.
Performance Review
Over the six month reporting period that ended April 30, 2000, the Fund's Class A, B, C, Institutional and Service shares generated cumulative total returns, at net asset value, of 2.87%, 2.37%, 2.38%, 3.07% and 2.82%, respectively. These figures handily outperformed the 0.08% total return of the Fund's benchmark, the Lehman High Yield Bond Index.
The Fund benefited from astute sector allocation and from a broadening of investor interest beyond the telecommunications sector. This resulted in stronger demand for many of the Fund's industrial holdings. In addition, careful credit selection minimized losses from defaults during a period of time when default rates were on the rise.
High Yield Market
After poor performance during the third quarter of 1999, the high yield market ended the year on a positive note. Investor confidence improved on the heels of a rally in the stock market, in spite of concerns over rising interest rates. However, this reversal of fortune was short lived, as high yield bonds again faltered during the first quarter of 2000. After the traditional New Year rally failed to materialize, February was dominated by credit-specific events. In March, returns were hurt by a sharp sell-off. Rising short-term interest rates and accelerating outflows from U.S. mutual funds were the main culprits.
As the reporting period came to a close, the high yield market stabilized. Selling pressure abated, mutual fund redemptions slowed and new investors began funding portfolios. The lack of new supply also helped, with the new issue market coming to an almost complete halt.
Investment Objective
The Fund seeks a high level of current income and may also consider the potential for capital appreciation. The Fund invests primarily in high yield, fixed income securities rated, at the time of investment, below investment grade.
Portfolio Composition
As of April 30, 2000, the Fund was diversified among 322 companies. Holdings in the top 10 companies represented 19.2% of the portfolio.
In the first half of the reporting period, the Fund's overweight position in cyclical industries, such as paper and chemicals, fared well in the wake of the economic rebound in Asia. The Fund's overweight exposure to European companies also augmented performance.
GOLDMAN SACHS HIGH YIELD FUND
FIXED INCOME
INVESTMENT
PROCESS OVERVIEW
Sector
Allocation
1
Our sector specialists work
together to assess relative
value among sectors
and create investment
strategies to meet each
fund's objectives.
Security
Selection
2
In selecting securities for
each portfolio, our fixed
income teams have access
to the vast resources of
Goldman Sachs.
H
Yield Curve
Strategies
3
We adjust the term
structure of our portfolios
based on our expectations
of the relationship between
short- and long-term
interest rates, while keep-
ing each fund's duration
close to its benchmark.
During the second half of the period, Fund activity was focused on existing investments. The new issue market was relatively subdued, with more attractive opportunities originating in Europe. The Fund carefully added to its portfolio from a select group of securities in this region.
Portfolio Highlights
Viasystems Group, Inc.(1.3% of the portfolio) - Viasystems has transformed itself through a series of acquisitions from a printed circuit board manufacturer to an electronics manufacturing services company. This new business profile enabled the firm to successfully complete an equity offering in March at a higher valuation than previously warranted. This, in turn, helped its bonds to rally despite the weak market.
Kappa Beheer B.V.(1.4% of the portfolio) - Kappa Beheer, a leading European producer of linerboard, has delivered solid results since its leveraged buyout and August bond issue. Brighter prospects for most paper companies, coupled with an increase in merger activity in the sector, have caused Kappa's bonds to significantly outperform. During the reporting period, Kappa's euro-denominated bonds have returned over 8%, and its zero coupon bonds more than 16%.
New Acquisitions
Ineos Acrylics Finance PLC (0.3 % of the portfolio) - Ineos Acrylics, a European chemical producer, was added to the portfolio in April. The firm recently raised 200 million euro to refinance debt incurred in its leveraged buyout from Imperial Chemical Industries (ICI).
Portfolio Outlook
Despite the likelihood for short-term interest rate increases, we believe the near-term outlook for the high yield market is favorable. The liquidity pressures of recent months has spurred interest from new investors, and the market is now more technically balanced. In addition, fundamental news is also supportive, as early first quarter earnings reports exceeded expectations. Upbeat earnings across the board also has caused investors to re-evaluate bonds of industrial companies that has been overlooked in recent months.
We thank you for your investment and look forward to your continued confidence.
Goldman Sachs High Yield Investment Management Team
May 9, 2000
GOLDMAN SACHS HIGH YIELD FUND
The Goldman Sachs Advantage
Founded in 1869, Goldman, Sachs & Co. is a premier financial services firm traditionally known on Wall Street and around the world for its institutional expertise.
Today, the firm's Investment Management Division provides individual investors the opportunity to tap the resources of a global institutional powerhouse — and put this expertise to work in their individual portfolios.
What Sets Goldman Sachs Funds Apart?
1
Resources and Relationships
Our portfolio management teams are located on-site, around the world, in New York, London, Tokyo and Singapore. Their understanding of local economies, markets, industries and cultures helps deliver what many investors want: access to global investment opportunities and consistent, risk-adjusted performance.
2
In-Depth Research
Our portfolio management teams make on-site visits to hundreds of companies each month, then construct selective portfolios with an emphasis on their best ideas. Our teams also have access to Goldman, Sachs & Co.'s Global Investment Research Department.
3
Risk Management
In this, our institutional heritage is clear. Institutions, as well as many individual investors, often look to us to manage the risks of global investing over time in different market environments.
To learn more about the Goldman Sachs Funds, call your investment professional today.
| The following
graph shows the value as of April 30, 2000, of a $10,000 investment made
on August 1, 1997 (commencement of operations) in Class A shares (with the
maximum sales charge of 4.5%) of the Goldman Sachs High Yield Fund. For
comparative purposes, the performance of the Fund’s benchmark (the
Lehman High Yield Bond Index) is shown. This performance data represents
past performance and should not be considered indicative of future
performance which will fluctuate with changes in market conditions. These
performance fluctuations will cause an investor’s shares, when
redeemed, to be worth more or less than their original cost. Performance
of Class B, Class C, Institutional and Service shares will vary from Class
A due to differences in fees and loads.
|
| High Yield Fund’s
Lifetime Performance
|
| Growth of a $10,000
Investment, Distributions Reinvested August 1, 1997 to April 30,
2000.
|
| |
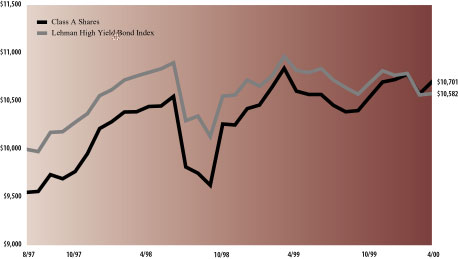
| Average Annual Total Return through April 30, 2000 | Since Inception | One Year | Six Months(a) | |||||
|---|---|---|---|---|---|---|---|---|
| Class A (commenced August 1, 1997) | ||||||||
| Excluding sales charges | 4.22 | % | -1.31% | 2.87% | ||||
| Including sales charges | 2.49 | % | -5.78% | -1.79% | ||||
| Class B (commenced August 1, 1997) | ||||||||
| Excluding contingent deferred sales charges | 3.45 | % | -2.05% | 2.37% | ||||
| Including contingent deferred sales charges | 2.31 | % | -6.93% | -2.75% | ||||
| Class C (commenced August 15, 1997) | ||||||||
| Excluding contingent deferred sales charges | 3.51 | % | -2.05% | 2.38% | ||||
| Including contingent deferred sales charges | 3.51 | % | -3.03% | 1.35% | ||||
| Institutional Class (commenced August 1, 1997) | 4.62 | % | -0.81% | 3.07% | ||||
| Service Class (commenced August 1, 1997) | 4.11 | % | -1.41% | 2.82% | ||||
| (a) Not
annualized.
|
| Principal
Amount |
Interest
Rate |
Maturity
Date |
Value | |||||
|---|---|---|---|---|---|---|---|---|
| Corporate Bonds – 74.5% | ||||||||
| Aerospace – 2.7% | ||||||||
| Argo-Tech Corp. (B-/B3) | ||||||||
| $ 7,500,000 | 8.63 | % | 10/01/2007 | $ 5,600,000 | ||||
| Burke Industries, Inc. (B-/Caa1) | ||||||||
| 2,000,000 | 10.00 | 08/15/2007 | 820,000 | |||||
| Communications Instruments, Inc. (B-/B3) | ||||||||
| 2,500,000 | 10.00 | 09/15/2004 | 1,887,500 | |||||
| Dunlop Standard Aerospace Holdings (B-/B3) | ||||||||
| 3,000,000 | 11.88 | 05/15/2009 | 2,940,000 | |||||
| Hexcel Corp. (B/B2) | ||||||||
| 5,000,000 | 9.75 | 01/15/2009 | 4,250,000 | |||||
| K&F Industries, Inc. (B-/Caa1) | ||||||||
| 5,000,000 | 9.25 | 10/15/2007 | 4,675,000 | |||||
| Transdigm, Inc. (B-/B3) | ||||||||
| 1,000,000 | 10.38 | 12/01/2008 | 790,000 | |||||
| Worldwide Flight Services, Inc. (B/B3)† | ||||||||
| 750,000 | 12.25 | 08/15/2007 | 600,000 | |||||
| 21,562,500 | ||||||||
| Automotive Parts – 2.8% | ||||||||
| Accuride Corp. (B-/B2) | ||||||||
| 3,000,000 | 9.25 | 02/01/2008 | 2,557,500 | |||||
| American Axle & Manufacturing, Inc. (B/B2) | ||||||||
| 3,750,000 | 9.75 | 03/01/2009 | 3,571,875 | |||||
| Anchor Lamina, Inc. (B-/B3) | ||||||||
| 1,500,000 | 9.88 | 02/01/2008 | 1,110,000 | |||||
| Federal-Mogul Corp. (BB+/Ba2) | ||||||||
| 2,000,000 | 7.50 | 01/15/2009 | 1,522,760 | |||||
| Hayes Lemmerz International, Inc. (B/B2) | ||||||||
| 3,500,000 | 9.13 | 07/15/2007 | 3,202,500 | |||||
| JL French Automotive Castings (B-/B3) | ||||||||
| 1,500,000 | 11.50 | 06/01/2009 | 1,481,250 | |||||
| Prestolite Electric, Inc. (B+/B3) | ||||||||
| 3,259,000 | 9.63 | 02/01/2008 | 1,955,400 | |||||
| Stanadyne Automotive Corp. (B/Caa1) | ||||||||
| 4,000,000 | 10.25 | 12/15/2007 | 3,250,000 | |||||
| Venture Holdings Trust (B/B2) | ||||||||
| 4,000,000 | 9.50 | 07/01/2005 | 3,320,000 | |||||
| 21,971,285 | ||||||||
| Building Materials – 2.9% | ||||||||
| Amatek Industries, Inc. (B/B3) | ||||||||
| 3,500,000 | 12.00 | 02/15/2008 | 3,255,000 | |||||
| Atrium Cos., Inc. (B-/B3) | ||||||||
| 2,000,000 | 10.50 | 05/01/2009 | 1,885,000 | |||||
| Better Minerals & Aggregates (B-/B3)† | ||||||||
| 2,500,000 | 13.00 | 09/15/2009 | 2,475,000 | |||||
| Nortek, Inc. (B+/B1) | ||||||||
| 3,000,000 | 9.13 | 09/01/2007 | 2,775,000 | |||||
| 2,125,000 | 8.88 | 08/01/2008 | 1,917,812 | |||||
| Nortek, Inc. (B-/B3) | ||||||||
| 2,000,000 | 9.88 | 03/01/2004 | 1,895,000 | |||||
| Principal
Amount |
Interest
Rate |
Maturity
Date |
Value | |||||
|---|---|---|---|---|---|---|---|---|
| Corporate Bonds – (continued) | ||||||||
| Building Materials – (continued) | ||||||||
| Republic Group, Inc. (B/B2) | ||||||||
| $ 3,000,000 | 9.50 | % | 07/15/2008 | $ 2,460,000 | ||||
| Werner Holdings Co., Inc. (B-/B2) | ||||||||
| 7,000,000 | 10.00 | 11/15/2007 | 6,545,000 | |||||
| 23,207,812 | ||||||||
| Capital Goods – 2.9% | ||||||||
| Axiohm Transaction Solutions, Inc. (D/Ca)D | ||||||||
| 3,000,000 | 9.75 | 10/01/2007 | 600,000 | |||||
| International Wire Group, Inc. (B-/B3) | ||||||||
| 2,500,000 | 11.75 | 06/01/2005 | 2,568,750 | |||||
| Packard BioScience Co. (B-/B3) | ||||||||
| 9,250,000 | 9.38 | 03/01/2007 | 8,140,000 | |||||
| Simonds Industries, Inc. (B-/B3) | ||||||||
| 750,000 | 10.25 | 07/01/2008 | 532,500 | |||||
| Thermadyne Holdings Corp. (CCC+/Caa1)§ | ||||||||
| 4,000,000 | 0.00/12.50 | 06/01/2008 | 1,680,000 | |||||
| Thermadyne Manufacturing LLC (CCC+/B3) | ||||||||
| 6,750,000 | 9.88 | 06/01/2008 | 5,467,500 | |||||
| Trench Electric S.A. (B-/B3) | ||||||||
| 5,000,000 | 10.25 | 12/15/2007 | 3,750,000 | |||||
| 22,738,750 | ||||||||
| Chemicals – 3.9% | ||||||||
| Avecia Group PLC (B/B2) | ||||||||
| 9,000,000 | 11.00 | 07/01/2009 | 9,112,500 | |||||
| Brunner Mond PLC (CCC/Caa2) | ||||||||
| 1,000,000 | 11.00 | 07/15/2008 | 520,000 | |||||
| Equistar Chemicals LP (BBB-/Baa3) | ||||||||
| 2,000,000 | 7.55 | 02/15/2026 | 1,618,860 | |||||
| General Chemicals Industries (B+/B3) | ||||||||
| 3,000,000 | 10.63 | 05/01/2009 | 2,580,000 | |||||
| Huntsman ICI Holdings LLC (B+/B2) | ||||||||
| 2,500,000 | 10.13 | 07/01/2009 | 2,487,500 | |||||
| Huntsman ICI Holdings LLC (B+/B3)@† | ||||||||
| 7,125,000 | 12.27 | 12/31/2009 | 2,244,375 | |||||
| Lyondell Chemical Co. (BB/Ba3) | ||||||||
| 4,500,000 | 9.88 | 05/01/2007 | 4,455,000 | |||||
| Lyondell Chemical Co. (B+/B2) | ||||||||
| 2,000,000 | 10.88 | 05/01/2009 | 1,980,000 | |||||
| Polymer Group, Inc. (B/B2) | ||||||||
| 1,750,000 | 9.00 | 07/01/2007 | 1,575,000 | |||||
| 3,000,000 | 8.75 | 03/01/2008 | 2,692,500 | |||||
| Sovereign Specialty Chemicals, Inc. (B-/B3)† | ||||||||
| 1,250,000 | 11.88 | 03/15/2010 | 1,262,500 | |||||
| Trans-Resources, Inc. (B-/B3)§ | ||||||||
| 1,000,000 | 0.00/12.00 | 03/15/2008 | 190,000 | |||||
| 30,718,235 | ||||||||
| Conglomerates – 0.7% | ||||||||
| Eagle-Picher Industries, Inc. (B-/B3) | ||||||||
| 6,500,000 | 9.38 | 03/01/2008 | 5,492,500 | |||||
| Principal
Amount |
Interest
Rate |
Maturity
Date |
Value | |||||
|---|---|---|---|---|---|---|---|---|
| Corporate Bonds – (continued) | ||||||||
| Consumer Cyclicals – 5.7% | ||||||||
| APCOA, Inc. (CCC+/Caa1) | ||||||||
| $ 5,000,000 | 9.25 | % | 03/15/2008 | $ 2,250,000 | ||||
| Fisher Scientific International, Inc. (B-/B3) | ||||||||
| 13,250,000 | 9.00 | 02/01/2008 | 12,190,000 | |||||
| Intertek Finance PLC (B-/B2) | ||||||||
| 7,000,000 | 10.25 | 11/01/2006 | 5,810,000 | |||||
| MSX International, Inc. (B-/B3) | ||||||||
| 1,000,000 | 11.38 | 01/15/2008 | 940,000 | |||||
| National Equipment Services, Inc. (B/B3) | ||||||||
| 4,000,000 | 10.00 | 11/30/2004 | 3,600,000 | |||||
| United Rentals, Inc. (BB-/B1) | ||||||||
| 4,750,000 | 9.50 | 06/01/2008 | 4,346,250 | |||||
| 4,000,000 | 8.80 | 08/15/2008 | 3,500,000 | |||||
| Volume Services America, Inc. (B-/B3) | ||||||||
| 2,750,000 | 11.25 | 03/01/2009 | 2,557,500 | |||||
| Wesco Distribution, Inc. (B/B2) | ||||||||
| 10,000,000 | 9.13 | 06/01/2008 | 9,050,000 | |||||
| Williams Scotsman, Inc. (B-/B3) | ||||||||
| 1,000,000 | 9.88 | 06/01/2007 | 910,000 | |||||
| 45,153,750 | ||||||||
| Consumer Products – 2.3% | ||||||||
| Cabot Safety Corp. (B/B3) | ||||||||
| 4,000,000 | 12.50 | 07/15/2005 | 4,030,000 | |||||
| Corning Consumer Products Co. (B/B3) | ||||||||
| 6,250,000 | 9.63 | 05/01/2008 | 3,968,750 | |||||
| Generac Portable Products LLC (B-/B3) | ||||||||
| 2,000,000 | 11.25 | 07/01/2006 | 1,985,000 | |||||
| Imperial Home Decor Group (D/C)D | ||||||||
| 2,000,000 | 11.00 | 03/15/2008 | 20,000 | |||||
| Polaroid Corp. (BB-/Ba3) | ||||||||
| 2,000,000 | 11.50 | 02/15/2006 | 2,035,000 | |||||
| Sealy Mattress Co. (B-/B3) | ||||||||
| 1,500,000 | 0.00/10.88 | § | 12/15/2007 | 1,050,000 | ||||
| 2,500,000 | 9.88 | 12/15/2007 | 2,375,000 | |||||
| The Scotts Co. (B+/B2)† | ||||||||
| 1,000,000 | 8.63 | 01/15/2009 | 950,000 | |||||
| United Industries Corp. (B-/B3) | ||||||||
| 1,750,000 | 9.88 | 04/01/2009 | 1,277,500 | |||||
| 17,691,250 | ||||||||
| Defense – 0.6% | ||||||||
| Condor Systems, Inc. (B-/B3)† | ||||||||
| 2,000,000 | 11.88 | 05/01/2009 | 970,000 | |||||
| Newport News Shipbuilding, Inc. (B+/Ba3) | ||||||||
| 4,000,000 | 9.25 | 12/01/2006 | 3,960,000 | |||||
| 4,930,000 | ||||||||
| Energy – 1.5% | ||||||||
| Benton Oil & Gas Co. (B/B3) | ||||||||
| 2,250,000 | 9.38 | 11/01/2007 | 1,350,000 | |||||
| Cross Timbers Oil Co. (B/B2) | ||||||||
| 2,750,000 | 8.75 | 11/01/2009 | 2,557,500 | |||||
| Principal
Amount |
Interest
Rate |
Maturity
Date |
Value | |||||
|---|---|---|---|---|---|---|---|---|
| Corporate Bonds – (continued) | ||||||||
| Energy – (continued) | ||||||||
| P&L Coal Holdings Corp. (B/B2) | ||||||||
| $ 4,250,000 | 9.63 | % | 05/15/2008 | $ 3,782,500 | ||||
| R&B Falcon Corp. (B+/Ba3) | ||||||||
| 500,000 | 6.75 | 04/15/2005 | 437,500 | |||||
| 500,000 | 9.50 | 12/15/2008 | 485,000 | |||||
| RBF Finance Co. (BB-/Ba3) | ||||||||
| 1,000,000 | 11.38 | 03/15/2009 | 1,070,000 | |||||
| Vintage Petroleum, Inc. (BB-/B1) | ||||||||
| 2,000,000 | 9.75 | 06/30/2009 | 2,020,000 | |||||
| 11,702,500 | ||||||||
| Entertainment – 0.9% | ||||||||
| Advanstar Communications, Inc. (B-/B2) | ||||||||
| 3,000,000 | 9.25 | 05/01/2008 | 2,730,000 | |||||
| Premier Parks, Inc. (B-/B3) | ||||||||
| 2,250,000 | 9.25 | 04/01/2006 | 2,115,000 | |||||
| SFX Entertainment, Inc. (B-/B3) | ||||||||
| 2,000,000 | 9.13 | 02/01/2008 | 2,000,000 | |||||
| V2 Music Holdings PLC (CCCg)†§ | ||||||||
| 1,750,000 | 0.00/14.00 | 04/15/2008 | 463,750 | |||||
| 7,308,750 | ||||||||
| Environmental – 1.7% | ||||||||
| Allied Waste North America, Inc. (BB-/Ba3) | ||||||||
| 2,500,000 | 7.63 | 01/01/2006 | 1,875,000 | |||||
| 5,750,000 | 7.88 | 01/01/2009 | 4,255,000 | |||||
| Allied Waste North America, Inc. (B+/B2) | ||||||||
| 8,000,000 | 10.00 | 08/01/2009 | 5,480,000 | |||||
| The IT Group, Inc. (B+/B3) | ||||||||
| 2,000,000 | 11.25 | 04/01/2009 | 1,800,000 | |||||
| 13,410,000 | ||||||||
| Food – 2.7% | ||||||||
| Agrilink Foods, Inc. (B-/B3) | ||||||||
| 1,500,000 | 11.88 | 11/01/2008 | 1,335,000 | |||||
| Aurora Foods, Inc. (CCC+/Caa1) | ||||||||
| 3,750,000 | 9.88 | 02/15/2007 | 2,100,000 | |||||
| 1,000,000 | 8.75 | 07/01/2008 | 550,000 | |||||
| Del Monte Foods Co. (B-/Caa1)§ | ||||||||
| 5,350,000 | 0.00/12.50 | 12/15/2007 | 4,012,500 | |||||
| Domino’s, Inc. (B-/B3) | ||||||||
| 5,000,000 | 10.38 | 01/15/2009 | 4,662,500 | |||||
| Eagle Family Foods (CCC+/B3) | ||||||||
| 5,000,000 | 8.75 | 01/15/2008 | 3,400,000 | |||||
| International Home Foods, Inc. (B-/B2) | ||||||||
| 2,750,000 | 10.38 | 11/01/2006 | 2,722,500 | |||||
| New World Pasta Co. (B-/B2) | ||||||||
| 1,000,000 | 9.25 | 02/15/2009 | 740,000 | |||||
| Premier International Foods PLC (B-/B3)† | ||||||||
| 1,500,000 | 12.00 | 09/01/2009 | 1,428,750 | |||||
| 20,951,250 | ||||||||
| Principal
Amount |
Interest
Rate |
Maturity
Date |
Value | |||||
|---|---|---|---|---|---|---|---|---|
| Corporate Bonds – (continued) | ||||||||
| Health Care – 1.3% | ||||||||
| ALARIS Medical, Inc. (B-)§ | ||||||||
| $ 4,000,000 | 0.00/11.13 | % | 08/01/2008 | $ 1,080,000 | ||||
| Genesis Eldercare, Inc. (C/C)D | ||||||||
| 2,000,000 | 9.00 | 08/01/2007 | 60,000 | |||||
| Genesis Health Ventures, Inc. (C/C)D | ||||||||
| 1,000,000 | 9.88 | 01/15/2009 | 130,000 | |||||
| Genesis Health Ventures, Inc. (D/C)D | ||||||||
| 500,000 | 9.25 | 10/01/2006 | 75,000 | |||||
| Hudson Respiratory Care, Inc. (B-/B3) | ||||||||
| 3,500,000 | 9.13 | 04/15/2008 | 2,695,000 | |||||
| Iasis Healthcare Corp. (B-/B3)† | ||||||||
| 2,000,000 | 13.00 | 10/15/2009 | 1,985,000 | |||||
| Integrated Health Services, Inc. (C)D | ||||||||
| 3,750,000 | 9.25 | 01/15/2008 | 75,000 | |||||
| Kinetic Concepts, Inc. (CCC+/B3) | ||||||||
| 5,000,000 | 9.63 | 11/01/2007 | 3,625,000 | |||||
| Universal Hospital Services, Inc. (B/B3) | ||||||||
| 1,000,000 | 10.25 | 03/01/2008 | 400,000 | |||||
| 10,125,000 | ||||||||
| Home Construction – 0.1% | ||||||||
| D.R. Horton, Inc. (BB/Ba1) | ||||||||
| 1,000,000 | 8.00 | 02/01/2009 | 852,500 | |||||
| Insurance Companies – 0.7% | ||||||||
| Willis Corroon Corp. (B+/Ba3) | ||||||||
| 7,500,000 | 9.00 | 02/01/2009 | 5,662,500 | |||||
| Media-Cable – 5.3% | ||||||||
| Adelphia Communications Corp. (B+/B1) | ||||||||
| 3,000,000 | 9.38 | 11/15/2009 | 2,812,500 | |||||
| Charter Communications Holdings LLC (B+/B2) | ||||||||
| 1,000,000 | 8.25 | 04/01/2007 | 890,000 | |||||
| 2,000,000 | 8.63 | 04/01/2009 | 1,740,000 | |||||
| 13,750,000 | 0.00/9.92 | § | 04/01/2011 | 7,528,125 | ||||
| Echostar DBS Corp. (B/B2) | ||||||||
| 4,000,000 | 9.38 | 02/01/2009 | 3,870,000 | |||||
| Frontiervision Holdings LP (B+/B1)§ | ||||||||
| 5,000,000 | 0.00/11.88 | 09/15/2007 | 4,362,500 | |||||
| Ono Finance PLC (CCC+)† | ||||||||
| 1,250,000 | 13.00 | 05/01/2009 | 1,275,000 | |||||
| Renaissance Media Group LLC (B-/B2)§ | ||||||||
| 3,000,000 | 0.00/10.00 | 04/15/2008 | 2,040,000 | |||||
| Telewest Communications PLC (B+/B1) | ||||||||
| 7,500,000 | 0.00/11.00 | § | 10/01/2007 | 7,050,000 | ||||
| 5,000,000 | 11.25 | 11/01/2008 | 5,125,000 | |||||
| 1,000,000 | 0.00/9.78 | § | 04/15/2009 | 560,000 | ||||
| 2,000,000 | 0.00/11.38 | †§ | 02/01/2010 | 1,150,000 | ||||
| 1,000,000 | 9.88 | † | 02/01/2010 | 980,000 | ||||
| United Pan-Europe Communications N.V. (B/B2)† | ||||||||
| 1,000,000 | 0.00/13.75 | § | 02/01/2010 | 485,000 | ||||
| 2,000,000 | 11.25 | 02/01/2010 | 1,860,000 | |||||
| 41,728,125 | ||||||||
| Principal
Amount |
Interest
Rate |
Maturity
Date |
Value | |||||
|---|---|---|---|---|---|---|---|---|
| Corporate Bonds – (continued) | ||||||||
| Media-Non Cable – 4.0% | ||||||||
| Chancellor Media Corp. (B/B1) | ||||||||
| $ 2,000,000 | 8.13 | % | 12/15/2007 | $ 1,992,500 | ||||
| 2,000,000 | 9.00 | 10/01/2008 | 2,020,000 | |||||
| Crown Castle International Corp. (B/B3)§ | ||||||||
| 10,500,000 | 0.00/10.63 | 11/15/2007 | 7,560,000 | |||||
| 6,000,000 | 0.00/10.38 | 05/15/2011 | 3,540,000 | |||||
| 5,500,000 | 0.00/11.25 | 08/01/2011 | 3,300,000 | |||||
| Lin Holdings Corp. (B-/B3)§ | ||||||||
| 5,000,000 | 0.00/10.00 | 03/01/2008 | 2,950,000 | |||||
| Pinnacle Holdings, Inc. (B/B3)§ | ||||||||
| 5,000,000 | 0.00/10.00 | 03/15/2008 | 3,312,500 | |||||
| PX Escrow Corp. (B-/B3)§ | ||||||||
| 1,000,000 | 0.00/9.63 | 02/01/2006 | 510,000 | |||||
| Spectrasite Holdings, Inc. (B-/B3)§ | ||||||||
| 3,500,000 | 0.00/11.25 | 04/15/2009 | 1,925,000 | |||||
| Young Broadcasting, Inc. (B/B2) | ||||||||
| 5,000,000 | 8.75 | 06/15/2007 | 4,425,000 | |||||
| 31,535,000 | ||||||||
| Metals – 0.9% | ||||||||
| Earle M. Jorgensen Co. (B-/B3) | ||||||||
| 3,500,000 | 9.50 | 04/01/2005 | 3,220,000 | |||||
| Haynes International, Inc. (B-/B3) | ||||||||
| 1,500,000 | 11.63 | 09/01/2004 | 810,000 | |||||
| Republic Technologies International (B/C)† | ||||||||
| 2,000,000 | 13.75 | 07/15/2009 | 440,000 | |||||
| WHX Corp. (B-/B3) | ||||||||
| 2,500,000 | 10.50 | 04/15/2005 | 2,318,750 | |||||
| 6,788,750 | ||||||||
| Packaging – 2.4% | ||||||||
| AEP Industries, Inc. (B/B2) | ||||||||
| 3,000,000 | 9.88 | 11/15/2007 | 2,475,000 | |||||
| Graham Packaging Co. (B-/B3) | ||||||||
| 3,500,000 | 8.75 | 01/15/2008 | 2,992,500 | |||||
| Graham Packaging Co. (B-/Caa1)§ | ||||||||
| 3,500,000 | 0.00/10.75 | 01/15/2009 | 1,960,000 | |||||
| Printpack, Inc. (B/Caa1) | ||||||||
| 3,000,000 | 10.63 | 08/15/2006 | 2,865,000 | |||||
| Printpack, Inc. (B+/B3) | ||||||||
| 3,000,000 | 9.88 | 08/15/2004 | 2,910,000 | |||||
| Tekni-Plex, Inc. (B-/B3) | ||||||||
| 3,000,000 | 11.25 | 04/01/2007 | 3,090,000 | |||||
| 3,000,000 | 9.25 | 03/01/2008 | 2,880,000 | |||||
| 19,172,500 | ||||||||
| Paper – 4.1% | ||||||||
| Ainsworth Lumber Co. Ltd. (B/B2) | ||||||||
| 6,000,000 | 12.50 | 07/15/2007 | 6,270,000 | |||||
| Packaging Corp. of America (B+/B2) | ||||||||
| 8,000,000 | 9.63 | 04/01/2009 | 8,040,000 | |||||
| Principal
Amount |
Interest
Rate |
Maturity
Date |
Value | |||||
|---|---|---|---|---|---|---|---|---|
| Corporate Bonds – (continued) | ||||||||
| Paper – (continued) | ||||||||
| Repap New Brunswick, Inc (CCC+/Caa) | ||||||||
| $ 1,500,000 | 10.63 | % | 04/15/2005 | $ 1,402,500 | ||||
| Riverwood International Corp. (B-/B3) | ||||||||
| 8,000,000 | 10.25 | 04/01/2006 | 7,880,000 | |||||
| Riverwood International Corp. (CCC+/Caa1) | ||||||||
| 9,500,000 | 10.88 | 04/01/2008 | 8,977,500 | |||||
| 32,570,000 | ||||||||
| Publishing – 1.6% | ||||||||
| American Lawyer Media, Inc. (B/B1) | ||||||||
| 3,500,000 | 9.75 | 12/15/2007 | 3,237,500 | |||||
| Day International Group, Inc. (B-/B3) | ||||||||
| 3,250,000 | 9.50 | 03/15/2008 | 2,795,000 | |||||
| Merrill Corp. (B/B3) | ||||||||
| 1,500,000 | 12.00 | 05/01/2009 | 1,410,000 | |||||
| Transwestern Publishing Co. (B-/B2) | ||||||||
| 3,000,000 | 9.63 | 11/15/2007 | 2,895,000 | |||||
| WRC Media Corp. (B-/B3) | ||||||||
| 2,250,000 | 12.75 | 11/15/2009 | 2,160,000 | |||||
| 12,497,500 | ||||||||
| Retailers – 0.8% | ||||||||
| Advance Holdings Corp. (B-/Caa2)§ | ||||||||
| 2,000,000 | 0.00/12.88 | 04/15/2009 | 930,000 | |||||
| Duane Reade, Inc. (B-/B3) | ||||||||
| 1,750,000 | 9.25 | 02/15/2008 | 1,636,250 | |||||
| Mattress Discounters Corp. (B+/B2) | ||||||||
| 750,000 | 12.63 | 07/15/2007 | 682,500 | |||||
| Musicland Stores Corp. (B+/B2) | ||||||||
| 3,250,000 | 9.00 | 06/15/2003 | 2,925,000 | |||||
| 6,173,750 | ||||||||
| Supermarkets – 0.1% | ||||||||
| Pathmark Stores, Inc. (C/Caa) | ||||||||
| 625,000 | 9.63 | 05/01/2003 | 443,750 | |||||
| Technology – 3.8% | ||||||||
| Details, Inc. (B+/Caa1)§ | ||||||||
| 2,000,000 | 0.00/12.50 | 11/15/2007 | 1,260,000 | |||||
| Details, Inc. (B-/B3) | ||||||||
| 5,000,000 | 10.00 | 11/15/2005 | 4,675,000 | |||||
| Integrated Circuit Systems, Inc. (B-/B3) | ||||||||
| 1,500,000 | 11.50 | 05/15/2009 | 1,650,000 | |||||
| Intersil Corp. (B/B3) | ||||||||
| 812,000 | 13.25 | 08/15/2009 | 909,440 | |||||
| Intira Corp. (CCCg)§ | ||||||||
| 2,000,000 | 0.00/13.00 | 02/01/2010 | 1,065,800 | |||||
| MCMS, Inc. (CCC+/Caa3) | ||||||||
| 2,000,000 | 9.75 | 03/01/2008 | 1,000,000 | |||||
| SCG Holding & Semiconductor Corp. (B/B2) | ||||||||
| 9,000,000 | 12.00 | 08/01/2009 | 9,517,500 | |||||
| Principal
Amount |
Interest
Rate |
Maturity
Date |
Value | |||||
|---|---|---|---|---|---|---|---|---|
| Corporate Bonds – (continued) | ||||||||
| Technology – (continued) | ||||||||
| Viasystems Group, Inc. (B/B3) | ||||||||
| $11,250,000 | 9.75 | % | 06/01/2007 | $ 9,618,750 | ||||
| 29,696,490 | ||||||||
| Telecommunications – 13.1% | ||||||||
| Allegiance Telecom, Inc. (B/B3) | ||||||||
| 1,500,000 | 0.00/11.75 | § | 02/15/2008 | 1,050,000 | ||||
| 1,000,000 | 12.88 | 05/15/2008 | 1,080,000 | |||||
| Birch Telecom, Inc. (CCCg) | ||||||||
| 1,000,000 | 14.00 | 06/15/2008 | 1,000,000 | |||||
| Carrier1 International S.A. (B-/B3)† | ||||||||
| 2,250,000 | 13.25 | 02/15/2009 | 2,250,000 | |||||
| Colt Telecom Group PLC (B+/B1)§ | ||||||||
| 5,500,000 | 0.00/12.00 | 12/15/2006 | 4,730,000 | |||||
| Completel Europe N.V. (CCC+/Caa1)§ | ||||||||
| 2,250,000 | 0.00/14.00 | 02/15/2009 | 1,125,000 | |||||
| Econophone, Inc. (CCCg)† | ||||||||
| 2,000,000 | 13.50 | 07/15/2007 | 2,082,500 | |||||
| Energis PLC (B/B1)† | ||||||||
| 4,500,000 | 9.75 | 06/15/2009 | 4,500,000 | |||||
| Exodus Communications, Inc. (B-) | ||||||||
| 3,000,000 | 11.25 | 07/01/2008 | 3,037,500 | |||||
| 1,250,000 | 10.75 | 12/15/2009 | 1,246,875 | |||||
| FLAG Telecom Holdings Ltd. (B/B2) | ||||||||
| 2,500,000 | 11.63 | 03/30/2010 | 2,125,021 | |||||
| Global Crossing Holdings Ltd. (BB/Ba2) | ||||||||
| 1,500,000 | 9.13 | † | 11/15/2006 | 1,451,250 | ||||
| 2,750,000 | 9.63 | 05/15/2008 | 2,688,125 | |||||
| 2,500,000 | 9.50 | † | 11/15/2009 | 2,425,000 | ||||
| GST Equipment Funding, Inc. | ||||||||
| 2,000,000 | 13.25 | 05/01/2007 | 1,100,000 | |||||
| GST Network Funding, Inc.§ | ||||||||
| 2,000,000 | 0.00/10.50 | 05/01/2008 | 770,000 | |||||
| GST Telecommunications, Inc. | ||||||||
| 1,000,000 | 12.75 | 11/15/2007 | 600,000 | |||||
| Hermes Europe Railtel B.V. (B/B3) | ||||||||
| 3,500,000 | 11.50 | 08/15/2007 | 3,150,000 | |||||
| 1,500,000 | 10.38 | 01/15/2009 | 1,260,000 | |||||
| ICG Holdings, Inc. (B-/B3)§ | ||||||||
| 500,000 | 0.00/12.00 | 05/01/2006 | 404,820 | |||||
| 5,000,000 | 0.00/11.63 | 03/15/2007 | 3,465,950 | |||||
| Intermedia Communications, Inc. (B/B2) | ||||||||
| 7,250,000 | 0.00/11.25 | § | 07/15/2007 | 5,600,625 | ||||
| 1,000,000 | 8.88 | 11/01/2007 | 935,000 | |||||
| 1,000,000 | 9.50 | 03/01/2009 | 957,500 | |||||
| Intermedia Communications, Inc. (CCC+/B3)§ | ||||||||
| 1,000,000 | 0.00/12.25 | 03/01/2009 | 600,000 | |||||
| Jazztel PLC (CCC+/Caa1) | ||||||||
| 750,000 | 14.00 | 04/01/2009 | 768,750 | |||||
| Leap Wireless International, Inc. (CCC/Caa2) | ||||||||
| 1,000,000 | 0.00/14.50 | § | 04/15/2010 | 482,500 | ||||
| 500,000 | 12.50 | 04/15/2010 | 488,750 | |||||
| Principal
Amount |
Interest
Rate |
Maturity
Date |
Value | |||||
|---|---|---|---|---|---|---|---|---|
| Corporate Bonds – (continued) | ||||||||
| Telecommunications – (continued) | ||||||||
| Level 3 Communications, Inc. (B/B3) | ||||||||
| $ 3,000,000 | 9.13 | % | 05/01/2008 | $ 2,610,000 | ||||
| McLeodUSA, Inc. (B+/B1) | ||||||||
| 1,000,000 | 0.00/10.50 | § | 03/01/2007 | 795,000 | ||||
| 2,000,000 | 9.50 | 11/01/2008 | 1,932,500 | |||||
| 750,000 | 8.13 | 02/15/2009 | 663,750 | |||||
| Metromedia Fiber Network, Inc. (B+/B2) | ||||||||
| 3,000,000 | 10.00 | 11/15/2008 | 2,865,000 | |||||
| 2,000,000 | 10.00 | 12/15/2009 | 1,905,000 | |||||
| Metronet Communications Corp. (BBB/Baa3) | ||||||||
| 7,000,000 | 0.00/9.95 | § | 06/15/2008 | 5,460,000 | ||||
| 750,000 | 10.63 | 11/01/2008 | 844,688 | |||||
| NEXTLINK Communications, Inc. (B/B2) | ||||||||
| 2,000,000 | 9.63 | 10/01/2007 | 1,860,000 | |||||
| 2,250,000 | 9.00 | 03/15/2008 | 2,053,125 | |||||
| 1,500,000 | 10.75 | 06/01/2009 | 1,473,750 | |||||
| Pathnet, Inc. | ||||||||
| 1,875,000 | 12.25 | 04/15/2008 | 1,200,000 | |||||
| PSINet, Inc. (B-/B3) | ||||||||
| 3,750,000 | 10.00 | 02/15/2005 | 3,300,000 | |||||
| 1,500,000 | 11.50 | 11/01/2008 | 1,372,500 | |||||
| 1,000,000 | 11.00 | 08/01/2009 | 900,000 | |||||
| RSL Communications PLC (B-/B2) | ||||||||
| 1,000,000 | 12.25 | 11/15/2006 | 990,000 | |||||
| 2,000,000 | 0.00/10.13 | § | 03/01/2008 | 1,025,000 | ||||
| 625,000 | 9.13 | 03/01/2008 | 487,500 | |||||
| 2,000,000 | 10.50 | 11/15/2008 | 1,660,000 | |||||
| Verio, Inc. (B-/B3) | ||||||||
| 1,500,000 | 11.25 | 12/01/2008 | 1,477,500 | |||||
| 2,000,000 | 10.63 | 11/15/2009 | 1,910,000 | |||||
| Versatel Telecom International N.V. (B-/B3) | ||||||||
| 1,000,000 | 13.25 | 05/15/2008 | 1,015,000 | |||||
| Viatel, Inc. (B-/B3) | ||||||||
| 1,343,000 | 11.50 | 03/15/2009 | 1,222,130 | |||||
| WAM!Net, Inc. (CCC+)§ | ||||||||
| 1,250,000 | 0.00/13.25 | 03/01/2005 | 812,500 | |||||
| Williams Communications Group, Inc. (BB-/B2) | ||||||||
| 2,000,000 | 10.70 | 10/01/2007 | 2,035,000 | |||||
| 3,000,000 | 10.88 | 10/01/2009 | 3,022,500 | |||||
| World Access, Inc. | ||||||||
| 2,250,000 | 13.25 | 01/15/2008 | 2,047,500 | |||||
| Worldwide Fiber, Inc. (B+/B3) | ||||||||
| 5,250,000 | 12.50 | 12/15/2005 | 5,197,500 | |||||
| 103,512,609 | ||||||||
| Telecommunications-Cellular – 4.6% | ||||||||
| Alamosa PCS Holdings, Inc. (CCC+/Caa1)§ | ||||||||
| 2,500,000 | 0.00/12.75 | 02/15/2010 | 1,281,250 | |||||
| Centennial Cellular Corp. (B-/B3) | ||||||||
| 5,000,000 | 10.75 | 12/15/2008 | 4,975,000 | |||||
| East Telecom Group PLC (B+/Aa1) | ||||||||
| 4,000,000 | 11.88 | 12/01/2008 | 4,680,000 | |||||
| Millicom International Cellular S.A. (B-/B3)§ | ||||||||
| 5,000,000 | 0.00/13.50 | 06/01/2006 | 4,225,000 | |||||
| Principal
Amount |
Interest
Rate |
Maturity
Date |
Value | |||||
|---|---|---|---|---|---|---|---|---|
| Corporate Bonds – (continued) | ||||||||
| Telecommunications-Cellular – (continued) | ||||||||
| Nextel Communications, Inc. (B/B1) | ||||||||
| $ 3,000,000 | 0.00/10.65 | %§ | 09/15/2007 | $ 2,272,500 | ||||
| 750,000 | 0.00/9.75 | § | 10/31/2007 | 538,125 | ||||
| 16,000,000 | 0.00/9.95 | § | 02/15/2008 | 11,240,000 | ||||
| 3,000,000 | 9.38 | 11/15/2009 | 2,842,500 | |||||
| Nextel Partners, Inc. (CCC+/B3)§ | ||||||||
| 650,000 | 0.00/14.00 | 02/01/2009 | 432,250 | |||||
| Orange PLC (BBB+/Ba3) | ||||||||
| 3,000,000 | 9.00 | 06/01/2009 | 3,090,000 | |||||
| Triton PCS Holdings, Inc. (CCC+/B3)§ | ||||||||
| 1,250,000 | 0.00/11.00 | 05/01/2008 | 893,750 | |||||
| 36,470,375 | ||||||||
| Textiles – 0.4% | ||||||||
| Delta Mills, Inc. (B+/B3) | ||||||||
| 3,000,000 | 9.63 | 09/01/2007 | 2,280,000 | |||||
| Galey & Lord, Inc. (B/Ca) | ||||||||
| 2,000,000 | 9.13 | 03/01/2008 | 920,000 | |||||
| Globe Manufacturing Corp. (CCC+/Ca) | ||||||||
| 2,000,000 | 10.00 | 08/01/2008 | 200,000 | |||||
| 3,400,000 | ||||||||
| TOTAL CORPORATE BONDS | ||||||||
| (Cost $679,818,299) | $587,467,431 | |||||||
| Emerging Market Debt – 3.7% | ||||||||
| APP China Group Ltd. (CCC+/B3) | ||||||||
| $ 670,000 | 14.00 | % | 03/15/2010 | $ 542,700 | ||||
| Cablevision S.A. (BB/B1)† | ||||||||
| 1,000,000 | 13.75 | 05/01/2009 | 950,000 | |||||
| Cellco Finance N.V. (B-/B1) | ||||||||
| 1,250,000 | 12.75 | 08/01/2005 | 1,282,813 | |||||
| Federal Republic of Brazil (B+/B2) | ||||||||
| 1,171,000 | 14.50 | 10/15/2009 | 1,230,721 | |||||
| Federal Republic of Brazil C-Bonds (B+/B2) | ||||||||
| 4,532,811 | 8.00 | 04/15/2014 | 3,240,960 | |||||
| Grupo Industrial Durango SA (BB-/B2) | ||||||||
| 2,100,000 | 12.63 | 08/01/2003 | 2,121,000 | |||||
| Grupo Isuacell S.A. de C.V. (B+/B1) | ||||||||
| 2,000,000 | 14.25 | 12/01/2006 | 2,080,000 | |||||
| Hanvit Bank (B/B1) | ||||||||
| 1,990,000 | 11.75 | 03/01/2010 | 1,980,050 | |||||
| Indah Kiat Finance Mauritius (CCC+/B3) | ||||||||
| 1,240,000 | 10.00 | 07/01/2007 | 827,080 | |||||
| MRS Logistica S.A. (B) † | ||||||||
| 120,000 | 10.63 | 08/15/2005 | 98,400 | |||||
| Multicanal S.A. (BB+/B1) † | ||||||||
| 1,000,000 | 13.13 | 04/15/2009 | 1,020,000 | |||||
| National Power Corp. (BB) | ||||||||
| 500,000 | 7.63 | 11/15/2000 | 498,125 | |||||
| National Republic of Bulgaria (B2) # | ||||||||
| 1,120,000 | 2.75 | 07/28/2012 | 772,800 | |||||
| Principal
Amount |
Interest
Rate |
Maturity
Date |
Value | |||||
|---|---|---|---|---|---|---|---|---|
| Emerging Market Debt – (continued) | ||||||||
| Pemex Finance Ltd. (BBB+/Baa1) | ||||||||
| $ 990,000 | 9.03 | % | 02/15/2011 | $ 995,841 | ||||
| PTC International Finance B.V. (B+/B2)§ | ||||||||
| 840,000 | 0.00/10.75 | 07/01/2007 | 562,800 | |||||
| Republic of Panama (BB+/Ba1)# | ||||||||
| 1,342,349 | 7.00 | 05/10/2002 | 1,315,502 | |||||
| Republic of Peru (BBB+/Ba3) | ||||||||
| 4,320,000 | 3.75 | 03/07/2017 | 2,624,400 | |||||
| Republic of Philippines (BB+/Ba1) | ||||||||
| 2,760,000 | 9.50 | 10/21/2024 | 2,622,000 | |||||
| Republic of Poland (BBB+/Baa1)# | ||||||||
| 3,010,000 | 3.50 | 10/27/2024 | 1,869,962 | |||||
| 650,000 | 4.00 | 10/27/2024 | 429,813 | |||||
| Slovak Wireless Finance Co. (B/B2) | ||||||||
| 750,000 | 11.25 | 03/30/2007 | 684,143 | |||||
| United Mexican States (BB+/Baa3) | ||||||||
| 2,100,000 | 6.25 | 12/31/2019 | 1,728,573 | |||||
| TOTAL EMERGING MARKET DEBT | ||||||||
| (Cost $29,474,064) | $ 29,477,683 | |||||||
| Foreign Debt ObligationsE – 12.5% | ||||||||
| British Pound Sterling – 3.5% | ||||||||
| Coral Group Holdings PLC (B-/B3) † | ||||||||
| GBP 1,500,000 | 10.00 | % | 02/15/2009 | $ 2,417,166 | ||||
| 2,206,255 | 13.50 | 09/30/2009 | 3,563,845 | |||||
| IPC Magazines Group PLC (B-/B3) | ||||||||
| 3,250,000 | 0.00/10.75 | § | 03/15/2008 | 2,896,902 | ||||
| 3,750,000 | 9.63 | 03/15/2008 | 4,991,974 | |||||
| Telewest Communications PLC (B+/B1)§ | ||||||||
| 12,500,000 | 0.00/9.88 | 04/15/2009 | 11,433,858 | |||||
| William Hill Finance PLC (B-/B3) | ||||||||
| 1,500,000 | 10.63 | 04/30/2008 | 2,370,458 | |||||
| 27,674,203 | ||||||||
| Euro Currency – 7.3% | ||||||||
| BSN Financing Co., S.A. (B/B1) | ||||||||
| EUR 5,000,000 | 10.25 | 08/01/2009 | 4,772,775 | |||||
| Clondalkin Industries PLC (B-/B3) | ||||||||
| 1,500,000 | 10.63 | 01/15/2010 | 1,418,196 | |||||
| Enitel ASA (B-/B3) | ||||||||
| 2,500,000 | 12.50 | 04/15/2010 | 2,340,933 | |||||
| Esat Telecom Group PLC (B+/Aa1) | ||||||||
| 2,000,000 | 11.88 | 11/01/2009 | 2,239,699 | |||||
| Exodus Communications, Inc. (B-) | ||||||||
| 1,000,000 | 10.75 | 12/15/2009 | 918,191 | |||||
| Huntsman ICI Holdings LLC (B+/B2) | ||||||||
| 4,750,000 | 10.13 | 07/01/2009 | 4,555,727 | |||||
| Ineos Acrylics Finance PLC (B+/B3) | ||||||||
| 2,750,000 | 10.25 | 05/15/2010 | 2,562,526 | |||||
| Jazztel PLC (CCC+/Caa1) | ||||||||
| 2,000,000 | 14.00 | 04/01/2009 | 1,863,655 | |||||
| Principal
Amount |
Interest
Rate |
Maturity
Date |
Value | |||||
|---|---|---|---|---|---|---|---|---|
| Foreign Debt ObligationsE – (continued) | ||||||||
| Euro Currency – (continued) | ||||||||
| Kappa Beheer B.V. (B/B2)† | ||||||||
| EUR 6,500,000 | 0.00/12.50 | %§ | 07/15/2009 | $ 3,929,585 | ||||
| 6,750,000 | 10.63 | 07/15/2009 | 6,535,292 | |||||
| Metromedia Fiber Network, Inc. (B+/B2) | ||||||||
| 2,750,000 | 10.00 | 12/15/2009 | 2,437,524 | |||||
| NTL Communications Corp. (B-/B3) | ||||||||
| 3,800,000 | 0.00/11.50 | § | 11/15/2009 | 1,986,383 | ||||
| 11,750,000 | 9.88 | 11/15/2009 | 10,414,877 | |||||
| Ono Finance PLC (CCC+/Caa1)† | ||||||||
| 5,000,000 | 13.00 | 05/01/2009 | 4,727,320 | |||||
| PTC International Finance II S.A. (B+/B2) | ||||||||
| 2,570,000 | 11.25 | 12/01/2009 | 2,488,252 | |||||
| Tele1 Europe B.V. (B-/B3)† | ||||||||
| 1,000,000 | 13.00 | 05/15/2009 | 927,282 | |||||
| 1,000,000 | 11.88 | 12/01/2009 | 909,100 | |||||
| United Pan-Europe Communications N.V. (B/B2) | ||||||||
| 1,500,000 | 11.25 | 02/01/2010 | 1,302,286 | |||||
| Viatel, Inc. (B-/B3) | ||||||||
| 1,000,000 | 11.50 | 03/15/2009 | 815,917 | |||||
| 57,145,520 | ||||||||
| German Mark – 1.7% | ||||||||
| Colt Telecom Group PLC (B+/B1) | ||||||||
| DEM 5,000,000 | 8.88 | 11/30/2007 | 2,358,938 | |||||
| Impress Metal Pack Holdings (B/B2) | ||||||||
| 10,000,000 | 9.88 | 05/29/2007 | 4,648,155 | |||||
| Ineos PLC (B+/B3) | ||||||||
| 6,500,000 | 8.63 | 04/30/2005 | 3,127,046 | |||||
| Sirona Dental Systems (B/B2)† | ||||||||
| 6,750,000 | 9.13 | 07/15/2008 | 2,619,816 | |||||
| Texon International PLC (B3)† | ||||||||
| 2,250,000 | 10.00 | 02/01/2008 | 979,947 | |||||
| 13,733,902 | ||||||||
| TOTAL FOREIGN DEBT OBLIGATIONS | ||||||||
| (Cost $112,374,185) | $ 98,553,625 | |||||||
| Repurchase Agreement — 0.5% | ||||||||
| Joint Repurchase Agreement Account | ||||||||
| $ 3,800,000 | 5.85 | % | 05/01/2000 | $ 3,800,000 | ||||
| TOTAL REPURCHASE AGREEMENT | ||||||||
| (Cost $3,800,000) | $ 3,800,000 | |||||||
| Shares | Value | |||||||
| Common Stocks — 0.5% | ||||||||
| Colt Telecom Group PLC* | ||||||||
| 59,200 | $ 2,432,259 | |||||||
| Completel Holdings LLC Cl.B† | ||||||||
| 12,500 | 1,125,000 | |||||||
| Shares | Value | |||||||
|---|---|---|---|---|---|---|---|---|
| Common Stocks – (continued) | ||||||||
| McleodUSA, Inc. | ||||||||
| 9,132 | $ 228,300 | |||||||
| RSL Communications Ltd | ||||||||
| 2,881 | 40,154 | |||||||
| Tele1 Europe Holding AB ADR | ||||||||
| 18,792 | 291,276 | |||||||
| World Access, Inc.* | ||||||||
| 7,069 | 111,337 | |||||||
| TOTAL COMMON STOCKS | ||||||||
| (Cost $313,842) | $ 4,228,326 | |||||||
| Shares | Dividend
Rate |
Maturity
Date |
Value | |||||
| Preferred Stocks – 2.9% | ||||||||
| Avecia Group PLC (B-/B3)‡ | ||||||||
| 40,000 | 16.00 | % | 07/01/2010 | $ 1,000,000 | ||||
| CSC Holdings, Inc. (B+/B1)‡ | ||||||||
| 61,551 | 11.75 | 10/01/2007 | 6,709,059 | |||||
| 75,702 | 11.13 | 04/01/2008 | 8,100,114 | |||||
| Eagle-Picher Holdings, Inc. (CCC+/Caa) | ||||||||
| 200 | 11.75 | 03/01/2008 | 600,000 | |||||
| Global Crossing Holdings Ltd. (B+/B1)‡ | ||||||||
| 12,500 | 10.50 | 12/01/2008 | 1,250,000 | |||||
| Intermedia Communications, Inc. (CCC-/Caa)‡ | ||||||||
| 1,388 | 13.50 | 03/31/2009 | 1,353,618 | |||||
| Nextel Communications, Inc. (CCC+/B3)‡ | ||||||||
| 1,392 | 11.13 | 02/15/2010 | 1,301,520 | |||||
| River Holding Corp. (CCC+)‡ | ||||||||
| 4,701 | 11.50 | 04/15/2010 | 357,245 | |||||
| Rural Cellular Corp. (CCC+/Caa)‡ | ||||||||
| 2,062 | 12.25 | 05/15/2011 | 2,020,692 | |||||
| TOTAL PREFERRED STOCKS | ||||||||
| (Cost $20,800,653) | $ 22,692,248 | |||||||
| Shares | Value | |||||||
| Warrants* – 0.6% | ||||||||
| ASAT Finance LLC, expiring November 1, 2006 | ||||||||
| 2,000 | $ 240,000 | |||||||
| Avecia Group PLC, expiring July 1, 2010 | ||||||||
| 80,000 | 900,000 | |||||||
| Birch Telecom, Inc., expiring June 15, 2008 | ||||||||
| 1,000 | 55,000 | |||||||
| Cellnet Data Systems, Inc., expiring September 15, 2007 | ||||||||
| 3,000 | 0 | |||||||
| Coral Group Holdings PLC, expiring September 30, 2009 | ||||||||
| 2,000 | 435,946 | |||||||
| Intira Corp., expiring February 2, 2025 | ||||||||
| 44,618 | 0 | |||||||
| Jazztel PLC, expiring April 1, 2009 | ||||||||
| 10,000 | 2,290,932 | |||||||
| Shares | Value | ||||||
|---|---|---|---|---|---|---|---|
| Warrants* – (continued) | |||||||
| Knology Holdings, Inc., expiring October 15, 2007 | |||||||
| 1,750 | $ 87,500 | ||||||
| Ono Finance PLC, expiring May 31, 2009 | |||||||
| 6,250 | 869,325 | ||||||
| Pathnet, Inc., expiring April 15, 2008 | |||||||
| 1,875 | 18,750 | ||||||
| Republic
Technologies International Inc., expiring
July 15, 2009 |
|||||||
| 2,000 | 20 | ||||||
| V2 Music Holdings PLC, expiring April 15, 2008 | |||||||
| 1,750 | 0 | ||||||
| WAM!Net, Inc., expiring March 1, 2005 | |||||||
| 3,750 | 85,313 | ||||||
| Worldwide Flight Services, Inc., expiring August 15, 2007 | |||||||
| 750 | 75 | ||||||
| TOTAL WARRANTS | |||||||
| (Cost $93,750) | $ 4,982,861 | ||||||
| TOTAL INVESTMENTS | |||||||
| (Cost $846,674,793) | $751,202,174 | ||||||
†
|
Security is exempt
from registration under Rule 144A of the Securities Act of 1933. Such
security may be resold, normally to qualified institutional buyers in
transactions exempt from registration. The market value of 144A securities
amounts to $61,080,878 as of April 30, 2000.
|
§
|
These securities
are issued with a zero coupon or dividend rate which increases to the
stated rate at a set date in the future.
|
E
|
The principal
amount of each security is stated in the currency in which the bond is
denominated. See below.
|
| DEM = German Mark.
|
| EUR = Euro currency.
|
| GBP = Great Britain Pound.
|
#
|
Variable rate
security. Coupon rate disclosed is that which is in effect at April 30,
2000.
|
‡
|
Pay-in-kind
securities.
|
*
|
Non-income
producing security.
|
D
|
Security currently
in default.
|
@
|
Security is issued
with a zero coupon. The interest rate disclosed for this security
represents effective yield to maturity.
|
| The percentage
shown for each investment category reflects the value of investments in
that category as a percentage of total net assets.
|
| |
| Investment Abbreviations: | ||||||
| ADR—American Depositary Receipt | ||||||
| Assets:
|
| Investment in securities, at value (identified cost $846,674,793) | $751,202,174 | ||||||
| Cash, at value | 5,254,892 | ||||||
| Receivables: | |||||||
| Investment securities sold, at value | 3,833,007 | ||||||
| Interest, at value | 19,740,882 | ||||||
| Fund shares sold | 554,309 | ||||||
| Forward foreign currency exchange contracts, at value | 14,458,771 | ||||||
| Reimbursement from investment adviser | 56,737 | ||||||
| Deferred organization expenses, net | 14,488 | ||||||
| Other assets, at value | 42,485 | ||||||
| Total assets | 795,157,745 | ||||||
| Liabilities: | |||||||
| Payables: | |||||||
| Investment securities purchased, at value | 3,140,025 | ||||||
| Income distribution | 1,812,612 | ||||||
| Fund shares repurchased | 334,212 | ||||||
| Amounts owed to affiliates | 688,671 | ||||||
| Forward foreign currency exchange contracts, at value | 13,533 | ||||||
| Accrued expenses and other liabilities, at value | 57,186 | ||||||
| Total liabilities | 6,046,239 | ||||||
| Net Assets: | |||||||
| Paid-in capital | 879,778,645 | ||||||
| Accumulated distributions in excess of net investment income | (1,050,318 | ) | |||||
| Accumulated net realized loss on investment and foreign currency related transactions | (7,610,267 | ) | |||||
| Net unrealized loss on investments and translation of assets and liabilities denominated in foreign currencies | (82,006,554 | ) | |||||
| NET ASSETS | $789,111,506 | ||||||
| Net asset value, offering and redemption price per share: (a) | |||||||
| Class A | $8.81 | ||||||
| Class B | $8.81 | ||||||
| Class C | $8.80 | ||||||
| Institutional | $8.82 | ||||||
| Service | $8.82 | ||||||
| Shares outstanding: | |||||||
| Class A | 56,260,537 | ||||||
| Class B | 4,363,280 | ||||||
| Class C | 1,239,342 | ||||||
| Institutional | 27,651,203 | ||||||
| Service | 53,700 | ||||||
| Total shares outstanding, $.001 par value (unlimited number of shares authorized) | 89,568,062 | ||||||
(a)
|
Maximum public
offering price per share (NAV per share multiplied by 1.0471) for Class
A shares is $9.23. At redemption, Class B and Class C shares may be
subject to a deferred contingent sales charge, assessed on the amount
equal to the lesser of the current net asset value or the original
purchase price of the shares.
|
| Investment income: | |||
| Interest (a) | $43,598,332 | ||
| Dividends | 65,625 | ||
| Total income | 43,663,957 | ||
| Expenses: | |||
| Management fees | 2,877,643 | ||
| Distribution and Service fees (b) | 891,528 | ||
| Transfer Agent fees (c) | 586,318 | ||
| Custodian fees | 108,374 | ||
| Registration fees | 66,825 | ||
| Professional fees | 27,644 | ||
| Trustee fees | 4,921 | ||
| Amortization of deferred organization expenses | 3,207 | ||
| Service share fees | 1,003 | ||
| Other | 54,607 | ||
| Total expenses | 4,622,070 | ||
| Less — expenses reimbursed | (166,916 | ) | |
| Net expenses | 4,455,154 | ||
| NET INVESTMENT INCOME | 39,208,803 | ||
| Realized and unrealized gain (loss) on investment and foreign currency transactions: | |||
| Net realized gain from: | |||
| Investment transactions | 3,159,635 | ||
| Foreign currency related transactions | 339,892 | ||
| Net change in unrealized loss on: | |||
| Investments | (31,470,548 | ) | |
| Translation of assets and liabilities denominated in foreign currencies | 12,424,363 | ||
| Net realized and unrealized loss on investment and foreign currency transactions: | (15,546,658 | ) | |
| NET INCREASE IN NET ASSETS RESULTING FROM OPERATIONS | $23,662,145 | ||
(a)
|
Taxes withheld on
interest were $1,760.
|
(b)
|
Class A, Class B
and Class C had Distribution and Service fees of $640,336, $197,764 and
$53,428, respectively.
|
(c)
|
Class A, Class B,
Class C, Institutional Class and Service Class had Transfer Agent fees
of $486,657, $37,575, $10,151, $51,855 and $80,
respectively.
|
|
|
||||
|---|---|---|---|---|
| From operations: | ||||
| Net investment income | $ 39,208,803 | |||
| Net realized gain on investment and foreign currency transactions | 3,499,527 | |||
| Net change in unrealized loss on investments and foreign currency | (19,046,185 | ) | ||
| Net increase in net assets resulting from operations | 23,662,145 | |||
| Distributions to shareholders: | ||||
| From net investment income | ||||
| Class A shares | (29,011,197 | ) | ||
| Class B shares | (2,092,730 | ) | ||
| Class C shares | (569,974 | ) | ||
| Institutional shares | (15,096,099 | ) | ||
| Service shares | (22,060 | ) | ||
| In excess of net investment income | ||||
| Class A shares | (651,200 | ) | ||
| Class B shares | (46,974 | ) | ||
| Class C shares | (12,794 | ) | ||
| Institutional shares | (338,855 | ) | ||
| Service shares | (495 | ) | ||
| Total distributions to shareholders | (47,842,378 | ) | ||
| From share transactions: | ||||
| Proceeds from sales of shares | 129,543,645 | |||
| Reinvestment of dividends and distributions | 33,682,300 | |||
| Cost of shares repurchased | (182,371,069 | ) | ||
| Net decrease in net assets resulting from share transactions | (19,145,124 | ) | ||
| TOTAL DECREASE | (43,325,357 | ) | ||
| Net assets: | ||||
| Beginning of period | 832,436,863 | |||
| End of period | $789,111,506 | |||
| Accumulated distributions in excess of net investment income | $ (1,050,318 | ) | ||
|
|
||||
|---|---|---|---|---|
| From operations: | ||||
| Net investment income | $ 67,379,988 | |||
| Net realized loss on investment and foreign currency transactions | (2,720,050 | ) | ||
| Net change in unrealized loss on investments and futures | (21,099,547 | ) | ||
| Net increase in net assets resulting from operations | 43,560,391 | |||
| Distributions to shareholders: | ||||
| From net investment income | ||||
| Class A shares | (43,632,406 | ) | ||
| Class B shares | (2,990,090 | ) | ||
| Class C shares | (846,589 | ) | ||
| Institutional shares | (17,700,298 | ) | ||
| Service shares | (34,695 | ) | ||
| Total distributions to shareholders | (65,204,078 | ) | ||
| From share transactions: | ||||
| Proceeds from sales of shares | 479,200,997 | |||
| Reinvestment of dividends and distributions | 47,672,946 | |||
| Cost of shares repurchased | (210,201,224 | ) | ||
| Net increase in net assets resulting from share transactions | 316,672,719 | |||
| TOTAL INCREASE | 295,029,032 | |||
| Net assets: | ||||
| Beginning of year | 537,407,831 | |||
| End of year | $832,436,863 | |||
| Accumulated undistributed net investment income | $ 7,583,257 | |||
|
1. ORGANIZATION
|
| Goldman Sachs
Trust (the “Trust”) is a Delaware business trust registered
under the Investment Company Act of 1940 (as amended) as an open-end,
management investment company. The Trust includes the Goldman Sachs High
Yield Fund (the “Fund”). The Fund is a diversified portfolio
offering five classes of shares — Class A, Class B, Class
C, Institutional and Service.
|
| The Fund
invests primarily in non-investment grade fixed-income securities which
are considered predominantly speculative by traditional investment
standards. Non-investment grade fixed-income securities and unrated
securities of comparable credit quality (commonly known as “junk
bonds”) are subject to the increased risk of an issuer’s
inability to meet principal and interest obligations. These securities,
also referred to as high yield securities, may be subject to greater
price volatility due to such factors as specific corporate developments,
interest rate sensitivity, generally negative perceptions of the junk
bond markets and less secondary market liquidity.
|
| 2. SIGNIFICANT ACCOUNTING
POLICIES
|
| The following is
a summary of significant accounting policies consistently followed by
the Fund. The preparation of financial statements in conformity with
generally accepted accounting principles requires management to make
estimates and assumptions that may affect the reported amounts. Actual
results could differ from those estimates.
|
| A. Investment
Valuation — Portfolio
securities for which accurate market quotations are readily available
are valued on the basis of quotations furnished by a pricing service or
provided by dealers in such securities. Portfolio securities for which
accurate market quotations are not readily available are valued based on
yield equivalents, pricing matrices or other sources, under valuation
procedures established by the Trust’s Board of Trustees. Short-term
debt obligations maturing in sixty days or less are valued at amortized
cost.
|
| B. Security
Transactions and Investment Income — Security
transactions are recorded as of the trade date. Realized gains and
losses on sales of portfolio securities are calculated using the
identified cost basis. Interest income is recorded on the basis of
interest accrued. Market discounts and market premiums on debt
securities, other than mortgage backed securities, are amortized to
interest income over the life of the security with a corresponding
adjustment in the cost basis of that security.
|
| 2. SIGNIFICANT ACCOUNTING
POLICIES – continued
|
| C. Federal
Taxes — It is the
Fund’s policy to comply with the requirements of the Internal
Revenue Code applicable to regulated investment companies and to
distribute each year substantially all of its investment company taxable
income and capital gains to its shareholders. Accordingly, no federal
tax provision is required.
|
| The
characterization of distributions to shareholders for financial
reporting purposes is determined in accordance with income tax rules.
Therefore, the source of the portfolio’s distributions may be shown
in the accompanying financial statements as either from or in excess of
net investment income or net realized gain on investment transactions,
or from paid-in capital, depending on the type of book/tax differences
that may exist.
|
| The Fund,
at its most recent tax year-end of October 31, 1999 had approximately
$10,760,000 capital loss carryforwards expiring in 2006 and 2007 for
U.S. federal tax purposes. This amount is available to be carried
forward to offset future capital gains to the extent permitted by
applicable laws or regulations.
|
| At April
30, 2000, the aggregate cost of portfolio securities for federal income
tax purposes is $846,707,929. Accordingly, the gross unrealized gain on
investments was $14,273,579 and the gross unrealized loss on investments
was $109,779,334 resulting in a net unrealized loss of
$95,505,755.
|
| D. Expenses — Expenses incurred
by the Trust that do not specifically relate to an individual Fund of
the Trust are allocated to the funds on a straight-line or pro rata
basis depending upon the nature of the expense.
|
| Class A,
Class B and Class C shareholders of the Fund bear all expenses and fees
relating to their respective Distribution and Service Plans.
Shareholders of Service shares bear all expenses and fees paid to
service organizations. Each class of shares separately bears its
respective class-specific transfer agency fees.
|
| E. Deferred
Organization Expenses — Organization-related costs are amortized on a straight-line basis
over a period of five years.
|
|
2. SIGNIFICANT ACCOUNTING
POLICIES – continued
|
| F. Foreign
Currency Translations — The books and
records of the Fund are maintained in U.S. dollars. Amounts denominated
in foreign currencies are translated into U.S. dollars on the following
basis (i) investment valuations, foreign currency and other assets and
liabilities initially expressed in foreign currencies are converted each
business day into U.S. dollars based upon current exchange rates; (ii)
purchases and sales of foreign investments, income and expenses are
converted into U.S. dollars based upon currency exchange rates
prevailing on the respective dates of such transactions.
|
| Net
realized and unrealized gain (loss) on foreign currency transactions
will represent: (i) foreign exchange gains and losses from the sale and
holdings of foreign currencies and sale of investments; (ii) gains and
losses between trade date and settlement date on investment securities
transactions and forward exchange contracts; and (iii) gains and losses
from the difference between amounts of dividends, interest and foreign
withholding taxes recorded and the amounts actually
received.
|
| G. Segregation
Transactions — The Fund may
enter into certain derivative transactions to seek to increase total
return. Forward foreign currency exchange contracts, futures contracts,
written options, mortgage dollar rolls, when-issued securities and
forward commitments represent examples of such transactions. As a result
of entering into those transactions, the Fund is required to segregate
liquid assets on the accounting records equal to or greater than the
market value of the corresponding transactions.
|
| 3. AGREEMENTS
|
| Pursuant to the
Investment Management Agreement (the “Agreement”), Goldman
Sachs Asset Management (“GSAM”), a unit of the Investment
Management Division of Goldman, Sachs & Co. (“Goldman
Sachs”), serves as the investment adviser to the Fund. Under the
Agreement, the adviser, subject to the general supervision of the
Trust’s Board of Trustees, manages the Fund’s portfolio. As
compensation for the services rendered pursuant to the Agreement, the
assumption of the expenses related thereto and administering the
Fund’s business affairs, including providing facilities, the
adviser is entitled to a fee, computed daily and payable monthly, at an
annual rate equal to 0.70% of the average daily net assets of the
Fund.
|
| The adviser
has voluntarily agreed to limit certain “Other Expenses” of
the Fund (excluding Management fees, Distribution and Service fees,
Transfer Agent fees, taxes, interest, brokerage, litigation, Service
Share fees, indemnification costs and other extraordinary expenses), to
the extent that such expenses exceed, on an annual basis, 0.02% of the
average daily net assets of the Fund.
|
| The Trust,
on behalf of the Fund, has adopted Distribution and Service Plans. Under
the Distribution and Service Plans, Goldman Sachs and/or authorized
dealers are entitled to a monthly fee from the Fund for distribution and
shareholder maintenance services equal, on an annual basis, to 0.25%,
1.00%, and 1.00% of the Fund’s average daily net assets
attributable to Class A, Class B and Class C Shares,
respectively.
|
|
3. AGREEMENTS – continued
|
| Goldman
Sachs serves as the distributor of shares of the Fund pursuant to a
Distribution Agreement. Goldman Sachs may receive a portion of the Class
A sales load and Class B and Class C contingent deferred sales charges
and has advised the Fund that it retained approximately $309,000 during
the period ended April 30, 2000.
|
| Goldman
Sachs also serves as the transfer agent of the Fund for a fee. The fees
charged for such transfer agency services are calculated daily and
payable monthly at an annual rate as follows: 0.19% of the average daily
net assets for Class A, Class B, and Class C Shares and 0.04% of the
average daily net assets for Institutional and Services
Shares.
|
| The Trust,
on behalf of the Fund, has adopted a Service Plan. The Plan allows for
Service Shares to compensate service organizations for providing varying
levels of account administration and shareholder liaison services to
their customers who are beneficial owners of such shares. The Service
Plan provides for compensation to the service organizations in an amount
up to 0.50%, on an annualized basis, of the average daily net assets of
the Service Shares.
|
| As of April
30, 2000, the amounts owed to affiliates were approximately $455,000,
$141,000 and $93,000 for Management, Distribution and Service, and
Transfer Agent fees, respectively.
|
| 4. PORTFOLIO SECURITIES
TRANSACTIONS
|
| Purchases and
proceeds of sales or maturities of securities (excluding short-term
investments) for the period ended April 30, 2000, were $266,881,278 and
$291,234,971, respectively.
|
| Forward Foreign Currency
Exchange Contracts — The Fund may
enter into forward foreign currency exchange contracts for the purchase
or sale of a specific foreign currency at a fixed price on a future date
as a hedge or cross-hedge against either specific transactions or
portfolio positions. The Fund may also purchase and sell forward
contracts to seek to increase total return. All commitments are
“marked-to-market” daily at the applicable translation rates
and any resulting unrealized gains or losses are recorded in the
Fund’s financial statements. The Fund records realized gains or
losses at the time the forward contract is offset by entry into a
closing transaction or extinguished by delivery of the currency. Risks
may arise upon entering into these contracts from the potential
inability of counterparties to meet the terms of their contracts and
from unanticipated movements in the value of a foreign currency relative
to the U.S. dollar.
|
|
4. PORTFOLIO SECURITIES
TRANSACTIONS – continued
|
| At April
30, 2000, the Fund had outstanding forward foreign currency exchange
contracts as follows:
|
| Open Foreign Currency
Sale Contracts |
Value on
Settlement Date |
Current Value | Unrealized
Gain |
Unrealized
Loss |
|||||
|---|---|---|---|---|---|---|---|---|---|
| British Pound | |||||||||
| expiring 5/2/2000 | $ 2,812,072 | $ 2,721,581 | $ 90,491 | $ — | |||||
| expiring 5/30/2000 | 252,614 | 245,271 | 7,343 | — | |||||
| expiring 6/30/2000 | 3,782,710 | 3,668,833 | 113,877 | — | |||||
| expiring 8/15/2000 | 2,527,088 | 2,455,153 | 71,935 | — | |||||
| expiring 9/15/2000 | 5,174,941 | 4,960,437 | 214,504 | — | |||||
| expiring 10/18/2000 | 14,808,258 | 14,325,731 | 482,527 | — | |||||
| expiring 11/1/2000 | 1,476,969 | 1,443,105 | 33,864 | — | |||||
| expiring 11/30/2000 | 5,069,366 | 4,931,221 | 138,145 | — | |||||
| Euro Currency | |||||||||
| expiring 5/2/2000 | 561,754 | 476,003 | 85,751 | — | |||||
| expiring 5/15/2000 | 647,250 | 560,835 | 86,415 | — | |||||
| expiring 5/30/2000 | 389,228 | 333,408 | 55,820 | — | |||||
| expiring 6/1/2000 | 157,442 | 137,598 | 19,844 | — | |||||
| expiring 6/15/2000 | 120,894 | 105,401 | 15,493 | — | |||||
| expiring 6/30/2000 | 256,268 | 219,535 | 36,733 | — | |||||
| expiring 7/17/2000 | 3,912,729 | 3,597,588 | 315,141 | — | |||||
| expiring 7/18/2000 | 43,561 | 36,423 | 7,138 | — | |||||
| expiring 8/1/2000 | 637,014 | 534,209 | 102,805 | — | |||||
| expiring 9/15/2000 | 2,445,799 | 1,994,298 | 451,501 | — | |||||
| expiring 10/2/2000 | 2,389,952 | 1,966,821 | 423,131 | — | |||||
| expiring 10/30/2000 | 210,808 | 182,721 | 28,087 | — | |||||
| expiring 11/1/2000 | 5,871,132 | 4,903,735 | 967,397 | — | |||||
| expiring 11/15/2000 | 1,793,545 | 1,516,467 | 277,078 | — | |||||
| expiring 11/29/2000 | 5,962,297 | 5,115,561 | 846,736 | — | |||||
| expiring 11/30/2000 | 2,905,922 | 2,463,600 | 442,322 | — | |||||
| expiring 12/1/2000 | 152,492 | 133,401 | 19,091 | — | |||||
| expiring 12/15/2000 | 3,332,240 | 2,913,075 | 419,165 | — | |||||
| expiring 12/29/2000 | 5,395,695 | 4,614,084 | 781,611 | — | |||||
| expiring 1/16/2001 | 10,366,413 | 8,742,694 | 1,623,719 | — | |||||
| expiring 2/1/2001 | 7,021,510 | 5,884,104 | 1,137,406 | — | |||||
| expiring 4/1/2001 | 5,155,277 | 4,475,125 | 680,152 | — | |||||
| expiring 5/1/2001 | 2,804,607 | 2,477,059 | 327,548 | — | |||||
| expiring 5/15/2001 | 15,344,085 | 13,399,772 | 1,944,313 | — | |||||
| expiring 6/1/2001 | 8,834,710 | 7,881,921 | 952,789 | — | |||||
| expiring 7/16/2001 | 6,622,285 | 6,087,151 | 535,134 | — | |||||
| TOTAL OPEN FOREIGN
CURRENCY SALE
CONTRACTS |
$129,238,927 | $115,503,921 | $13,735,006 | $ — | |||||
| Closed but Unsettled
Forward Currency Contracts |
Purchase
Value |
Sale Value | Realized
Gain |
Realized
Loss |
|||||
| Euro Currency | |||||||||
| expiring 6/1/2000 | $ 613,498 | $ 670,267 | $ 56,769 | $ — | |||||
| expiring 6/15/2000 | 91,871 | 92,582 | 711 | — | |||||
| expiring 8/1/2000 | 42,104 | 41,501 | — | 603 | |||||
| expiring 11/1/2000 | 1,447,480 | 1,460,185 | 12,705 | — | |||||
| expiring 12/15/2000 | 1,976,304 | 1,995,880 | 19,576 | — | |||||
| expiring 2/1/2001 | 5,236,536 | 5,851,698 | 615,162 | — | |||||
| expiring 2/1/2001 | 873,904 | 860,974 | — | 12,930 | |||||
| expiring 6/1/2001 | 1,312,845 | 1,331,687 | 18,842 | — | |||||
| TOTAL CLOSED BUT
UNSETTLED FORWARD
CURRENCY CONTRACTS |
$ 11,594,542 | $ 12,304,77 4 | $ 723,765 | $13,533 | |||||
|
4. PORTFOLIO SECURITIES
TRANSACTIONS – continued
|
| The
contractual amounts of forward foreign currency exchange contracts do
not necessarily represent the amounts potentially subject to risk. The
measurement of the risks associated with these instruments is meaningful
only when all related and offsetting transactions are considered. At
April 30, 2000, the Fund had sufficient cash and/or securities to cover
any commitments under these contracts.
|
| Futures
Contracts — The Fund may
enter into futures transactions to hedge against changes in interest
rates, securities prices, currency exchange rates or to seek to increase
total return. Upon entering into a futures contract, the Fund is
required to deposit with a broker an amount of cash or securities equal
to the minimum “initial margin” requirement of the associated
futures exchange. Subsequent payments for futures contracts
(“variation margin”) are paid or received by the Fund daily,
dependent on the daily fluctuations in the value of the contracts, and
are recorded for financial reporting purposes as unrealized gains or
losses. When contracts are closed, the Fund realizes a gain or loss
which is reported in the Statement of Operations.
|
| The use of
futures contracts involves, to varying degrees, elements of market and
counterparty risk which may exceed the amounts recognized in the
Statement of Assets and Liabilities. Changes in the value of the futures
contract may not directly correlate with changes in the value of the
underlying securities. This risk may decrease the effectiveness of the
Fund’s strategies and potentially result in a loss. At April 30,
2000, the Fund had no open futures contracts.
|
| 5. LINE OF
CREDIT FACILITY
|
| The Fund
participates in a $250,000,000 uncommitted and a $250,000,000 committed,
unsecured revolving line of credit facility. Under the most restrictive
arrangement, the Fund must own securities having a market value in
excess of 400% of the total bank borrowings. These facilities are to be
used solely for temporary or emergency purposes. The interest rate on
borrowings is based on the Federal Funds rate. The committed facility
also requires a fee to be paid by the Fund based on the amount of the
commitment. During the period ended April 30, 2000, the Fund did not
have any borrowings under any of these facilities.
|
| 6. REPURCHASE AGREEMENTS
|
| During the term
of a repurchase agreement, the value of the underlying securities,
including accrued interest, is required to equal or exceed the value of
the repurchase agreement. The underlying securities for all repurchase
agreements are held in safekeeping at the Fund’s
custodian.
|
| 7. JOINT
REPURCHASE AGREEMENT ACCOUNT
|
| The Fund,
together with other registered investment companies having management
agreements with GSAM or its affiliates, transfers uninvested cash into
joint accounts, the daily aggregate balance of which is invested in one
or more repurchase agreements.
|
| At April
30, 2000, the Fund had an undivided interest in the repurchase agreement
in the joint account which equaled $3,800,000 in principal amount. At
April 30, 2000, the following repurchase agreements held in this joint
account were fully collateralized by Federal Agency
obligations:
|
| Repurchase Agreements | Principal
Amounts |
Interest
Rate |
Maturity
Date |
Amortized
Cost |
||||||
|---|---|---|---|---|---|---|---|---|---|---|
| ABN / AMRO, Inc. | $ 703,700,000 | 5.85 | % | 05/01/2000 | $ 703,700,000 | |||||
| Banc of America Securities LLC | 1,300,000,000 | 5.85 | 05/01/2000 | 1,300,000,000 | ||||||
| Bear Stearns Companies, Inc. | 500,000,000 | 5.85 | 05/01/2000 | 500,000,000 | ||||||
| Chase Securities, Inc. | 400,000,000 | 5.85 | 05/01/2000 | 400,000,000 | ||||||
| SG Cowen Securities | 200,000,000 | 5.85 | 05/01/2000 | 200,000,000 | ||||||
| TOTAL JOINT REPURCHASE AGREEMENT ACCOUNT | $3,103,700,000 | |||||||||
| 8. CHANGE
IN INDEPENDENT AUDITOR
|
| On October 26,
1999 the Board of Trustees of the Fund, upon the recommendation of the
Board’s audit committee, determined not to retain Arthur Andersen
LLP and approved a change of the Fund’s independent auditors to
Ernst & Young LLP. For the fiscal year ended October 31, 1999,
Arthur Andersen LLP’s audit report contained no adverse opinion or
disclaimer of opinion; nor was their report qualified or modified as to
uncertainty, audit scope, or accounting principles. Further, there were
no disagreements between the Fund and Arthur Andersen LLP on accounting
principles or practices, financial statement disclosure or audit scope
or procedure, which if not resolved to the satisfaction of Arthur
Andersen LLP would have caused them to make reference to the
disagreement in their report.
|
| 9. SUMMARY
OF SHARE TRANSACTIONS
|
| Share activity is
as follows:
|
| For the Period Ended April 30, 2000 (Unaudited) | |||||||
|---|---|---|---|---|---|---|---|
| Shares | Dollars | ||||||
| Class A Shares | |||||||
| Shares sold | 9,999,830 | $ 90,540,531 | |||||
| Reinvestment of dividends and distributions | 2,567,622 | 23,107,030 | |||||
| Shares repurchased | (14,129,723 | ) | (127,935,644 | ) | |||
| (1,562,271 | ) | (14,288,083 | ) | ||||
| Class B Shares | |||||||
| Shares sold | 626,770 | 5,697,359 | |||||
| Reinvestment of dividends and distributions | 124,123 | 1,149,363 | |||||
| Shares repurchased | (788,152 | ) | (7,142,050 | ) | |||
| (37,259 | ) | (295,328 | ) | ||||
| Class C Shares | |||||||
| Shares sold | 488,716 | 4,397,299 | |||||
| Reinvestment of dividends and distributions | 39,026 | 351,235 | |||||
| Shares repurchased | (399,762 | ) | (3,594,252 | ) | |||
| 127,980 | 1,154,282 | ||||||
| Institutional Shares | |||||||
| Shares sold | 3,173,323 | 28,632,456 | |||||
| Reinvestment of dividends and distributions | 1,008,192 | 9,074,607 | |||||
| Shares repurchased | (4,885,683 | ) | (43,629,458 | ) | |||
| (704,168 | ) | (5,922,395 | ) | ||||
| Service Shares | |||||||
| Shares sold | 30,368 | 276,000 | |||||
| Reinvestment of dividends and distributions | 7 | 65 | |||||
| Shares repurchased | (7,536 | ) | (69,665 | ) | |||
| 22,839 | 206,400 | ||||||
| NET DECREASE | (2,152,879 | ) | $ (19,145,124 | ) | |||
| For the Year Ended October 31, 1999 | |||||||
|---|---|---|---|---|---|---|---|
| Shares | Dollars | ||||||
| Class A Shares | |||||||
| Shares sold | 25,318,440 | $241,274,515 | |||||
| Reinvestment of dividends and distributions | 3,487,785 | 33,178,138 | |||||
| Shares repurchased | (14,816,674 | ) | (141,291,530 | ) | |||
| 13,989,551 | 133,161,123 | ||||||
| Class B Shares | |||||||
| Shares sold | 2,175,067 | 20,848,416 | |||||
| Reinvestment of dividends and distributions | 176,076 | 1,642,893 | |||||
| Shares repurchased | (1,143,028 | ) | (10,841,667 | ) | |||
| 1,208,115 | 11,649,642 | ||||||
| Class C Shares | |||||||
| Shares sold | 1,321,781 | 12,726,945 | |||||
| Reinvestment of dividends and distributions | 54,662 | 520,094 | |||||
| Shares repurchased | (1,196,698 | ) | (11,389,250 | ) | |||
| 179,745 | 1,857,789 | ||||||
| Institutional Shares | |||||||
| Shares sold | 21,248,263 | 204,157,121 | |||||
| Reinvestment of dividends and distributions | 1,299,004 | 12,317,045 | |||||
| Shares repurchased | (4,829,091 | ) | (46,289,669 | ) | |||
| 17,718,176 | 170,184,497 | ||||||
| Service Shares | |||||||
| Shares sold | 20,193 | 194,000 | |||||
| Reinvestment of dividends and distributions | 1,518 | 14,776 | |||||
| Shares repurchased | (39,586 | ) | (389,108 | ) | |||
| (17,875 | ) | (180,332 | ) | ||||
| NET INCREASE | 33,077,712 | $316,672,719 | |||||
| Income (loss) from
investment operations (a) |
Distributions to
shareholders |
|||||||||||||||
|---|---|---|---|---|---|---|---|---|---|---|---|---|---|---|---|---|
|
Net asset value, beginning of period |
Net
investment income |
Net realized
and unrealized gain (loss) |
From
net investment income |
In excess
of net investment income |
Net decrease
in net asset value |
|||||||||||
| FOR THE PERIOD ENDED APRIL 30, (UNAUDITED) | ||||||||||||||||
| 2000 - Class A Shares | $ 9.07 | $0.42 | (e) | $(0.16 | ) (e) | $(0.42) | $(0.10 | ) | $(0.26 | ) | ||||||
| 2000 - Class B Shares | 9.08 | 0.39 | (e) | (0.17 | ) (e) | (0.39) | (0.10 | ) | (0.27 | ) | ||||||
| 2000 - Class C Shares | 9.07 | 0.39 | (e) | (0.17 | ) (e) | (0.39) | (0.10 | ) | (0.27 | ) | ||||||
| 2000 - Institutional Shares | 9.08 | 0.44 | (e) | (0.16 | ) (e) | (0.44) | (0.10 | ) | (0.26 | ) | ||||||
| 2000 - Service Shares | 9.08 | 0.41 | (e) | (0.16 | ) (e) | (0.41) | (0.10 | ) | (0.26 | ) | ||||||
| FOR THE YEARS ENDED OCTOBER 31, | ||||||||||||||||
| 1999 - Class A Shares | 9.16 | 0.85 | (0.10 | ) | (0.84) | — | (0.09 | ) | ||||||||
| 1999 - Class B Shares | 9.16 | 0.77 | (0.09 | ) | (0.76) | — | (0.08 | ) | ||||||||
| 1999 - Class C Shares | 9.16 | 0.78 | (0.11 | ) | (0.76) | — | (0.09 | ) | ||||||||
| 1999 - Institutional Shares | 9.17 | 0.90 | (e) | (0.12 | ) (e) | (0.87) | — | (0.09 | ) | |||||||
| 1999 - Service Shares | 9.17 | 0.86 | (e) | (0.12 | ) (e) | (0.83) | — | (0.09 | ) | |||||||
| 1998 - Class A Shares | 9.97 | 0.82 | (0.85 | ) | (0.78) | — | (0.81 | ) | ||||||||
| 1998 - Class B Shares | 9.97 | 0.75 | (0.86 | ) | (0.70) | — | (0.81 | ) | ||||||||
| 1998 - Class C Shares | 9.97 | 0.75 | (0.86 | ) | (0.70) | — | (0.81 | ) | ||||||||
| 1998 - Institutional Shares | 9.97 | 0.84 | (0.83 | ) | (0.81) | — | (0.80 | ) | ||||||||
| 1998 - Service Shares | 9.97 | 0.80 | (0.84 | ) | (0.76) | — | (0.80 | ) | ||||||||
| FOR THE PERIOD ENDED OCTOBER 31, | ||||||||||||||||
| 1997 - Class A Shares (commenced August 1) | 10.00 | 0.17 | (0.02 | ) | (0.17) | (0.01 | ) | (0.03 | ) | |||||||
| 1997 - Class B Shares (commenced August 1) | 10.00 | 0.15 | (0.02 | ) | (0.15) | (0.01 | ) | (0.03 | ) | |||||||
| 1997 - Class C Shares (commenced August 15) | 9.97 | 0.14 | 0.01 | (0.14) | (0.01 | ) | — | |||||||||
| 1997 - Institutional Shares (commenced August 1) | 10.00 | 0.18 | (0.02 | ) | (0.18) | (0.01 | ) | (0.03 | ) | |||||||
| 1997 - Service Shares (commenced August 1) | 10.00 | 0.17 | (0.02 | ) | (0.17) | (0.01 | ) | (0.03 | ) | |||||||
(a)
|
Includes the
balancing effect of calculating per share amounts.
|
(b)
|
Assumes
investment at the net asset value at the beginning of the period,
reinvestment of all distributions, a complete redemption of the
investment at the net asset value at the end of period and no sales
charge. Total return would be reduced if a sales or redemption charge
was taken into account.
|
(c)
|
Annualized.
|
(d)
|
Not
annualized.
|
(e)
|
Calculated based
on the average shares outstanding methodology.
|
| Ratios assuming
no expense limitations |
|||||||||||||||||||||
|---|---|---|---|---|---|---|---|---|---|---|---|---|---|---|---|---|---|---|---|---|---|
| Net asset
value, end of period |
Total
return(b) |
Net assets
at end of period (in 000s) |
Ratio of
net expenses to average net assets |
Ratio of
net investment income to average net assets |
Ratio of
expenses to average net assets |
Ratio of
net investment income to average net assets |
Portfolio
turnover rate |
||||||||||||||
| $8.81 | 2.87 | % (d) | $495,494 | 1.16 | % (c) | 9.46 | % (c) | 1.20 | % (c) | 9.42 | % (c) | 33.99 | % (d) | ||||||||
| 8.81 | 2.37 | (d) | 38,450 | 1.91 | (c) | 8.71 | (c) | 1.95 | (c) | 8.67 | (c) | 33.99 | (d) | ||||||||
| 8.80 | 2.38 | (d) | 10,910 | 1.91 | (c) | 8.69 | (c) | 1.95 | (c) | 8.65 | (c) | 33.99 | (d) | ||||||||
| 8.82 | 3.07 | (d) | 243,784 | 0.76 | (c) | 9.85 | (c) | 0.80 | (c) | 9.81 | (c) | 33.99 | (d) | ||||||||
| 8.82 | 2.82 | (d) | 474 | 1.26 | (c) | 9.20 | (c) | 1.30 | (c) | 9.16 | (c) | 33.99 | (d) | ||||||||
| 9.07 | 8.06 | 524,674 | 1.16 | 9.06 | 1.22 | 9.00 | 59.04 | ||||||||||||||
| 9.08 | 7.38 | 39,907 | 1.91 | 8.30 | 1.97 | 8.24 | 59.04 | ||||||||||||||
| 9.07 | 7.26 | 10,078 | 1.91 | 8.26 | 1.97 | 8.20 | 59.04 | ||||||||||||||
| 9.08 | 8.49 | 257,498 | 0.76 | 9.50 | 0.82 | 9.44 | 59.04 | ||||||||||||||
| 9.08 | 7.95 | 280 | 1.26 | 8.92 | 1.32 | 8.86 | 59.04 | ||||||||||||||
| 9.16 | (0.70 | ) | 401,626 | 1.09 | 8.25 | 1.36 | 7.98 | 113.44 | |||||||||||||
| 9.16 | (1.43 | ) | 29,256 | 1.84 | 7.61 | 1.88 | 7.57 | 113.44 | |||||||||||||
| 9.16 | (1.43 | ) | 8,532 | 1.84 | 7.61 | 1.88 | 7.57 | 113.44 | |||||||||||||
| 9.17 | (0.32 | ) | 97,547 | 0.84 | 9.47 | 0.88 | 9.43 | 113.44 | |||||||||||||
| 9.17 | (0.79 | ) | 447 | 1.34 | 9.17 | 1.38 | 9.13 | 113.44 | |||||||||||||
| 9.97 | 1.50 | (d) | 325,911 | 0.95 | (c) | 7.06 | (c) | 1.57 | (c) | 6.44 | (c) | 44.80 | (d) | ||||||||
| 9.97 | 1.31 | (d) | 10,308 | 1.70 | (c) | 6.28 | (c) | 2.07 | (c) | 5.91 | (c) | 44.80 | (d) | ||||||||
| 9.97 | 1.46 | (d) | 1,791 | 1.70 | (c) | 6.17 | (c) | 2.07 | (c) | 5.80 | (c) | 44.80 | (d) | ||||||||
| 9.97 | 1.58 | (d) | 2 | 0.70 | (c) | 7.16 | (c) | 1.07 | (c) | 6.79 | (c) | 44.80 | (d) | ||||||||
| 9.97 | 1.46 | (d) | 2 | 1.20 | (c) | 6.69 | (c) | 1.57 | (c) | 6.32 | (c) | 44.80 | (d) | ||||||||
GOLDMAN SACHS FUND PROFILE
Goldman Sachs High Yield Fund
THE GOLDMAN SACHS ADVANTAGE
When you invest in the Goldman Sachs High Yield Fund, you can capitalize on Goldman Sachs' 131-year history of excellence while benefiting from the firm's leadership in three areas:
Global Resources
1 With professionals based throughout the Americas, Europe and Asia, Goldman Sachs possesses firsthand knowledge of the world's markets and economies. Fundamental Research
2 Goldman Sachs is recognized by the managements of corporations worldwide as a leader in investment research. As a result, we obtain face-to-face meetings with managers on a timely, regular basis.
Risk Management
3 Goldman, Sachs & Co. excels in understanding, monitoring and managing investment risk - a process that is integrated into all Goldman Sachs investment products.
Goldman Sachs High Yield Fund offers investors access to a potentially attractive risk/reward profile. The Fund seeks a high level of current income and, secondarily, capital appreciation, primarily through fixed income securities rated, at the time of investment, below investment grade.
Target Your Needs
Goldman Sachs High Yield Fund has a distinct investment objective and a defined place on the risk/return spectrum. As your investment objectives change, you can exchange shares within Goldman Sachs Funds without any additional charge.* Please note: in general, greater returns are associated with greater risk.
| Goldman Sachs Fixed Income Funds | ||||
| Higher Risk/Return
|
||||
| HIGH YIELD | ||||
| n High Yield Fund
|
||||
| TAXABLE | ||||
| n Global Income Fund
|
||||
| n Core Fixed Income Fund
|
||||
| n Government Income Fund
|
||||
| n Short Duration Government Fund
|
||||
| n Adjustable Rate Government Fund
|
||||
|
||||
| n High Yield Municipal Fund
|
||||
| n Municipal Income Fund
|
||||
| n Short Duration Tax-Free Fund
|
||||
| Lower Risk/Return |
For More Information
To learn more about the Goldman Sachs High Yield Fund and other Goldman Sachs Funds, call your investment professional today.
GOLDMAN SACHS ASSET MANAGEMENT 32 OLD SLIP, 17TH FLOOR, NEW YORK, NEW YORK 10005
| TRUSTEES | OFFICERS |
| Ashok N. Bakhru, Chairman | Douglas C. Grip, President |
| David B. Ford | Jesse H. Cole, Vice President |
| Douglas C. Grip | Kerry Daniels, Vice President |
| John P. McNulty | James A. Fitzpatrick, Vice President |
| Mary P. McPherson | Mary Hoppa, Vice President |
| Alan A. Shuch | Nancy L. Mucker, Vice President |
| Jackson W. Smart, Jr. | John M. Perlowski, Treasurer |
| William H. Springer | Philip V. Giuca, Jr., Assistant Treasurer |
| Richard P. Strubel | Michael J. Richman, Secretary |
| Amy E. Belanger, Assistant Secretary | |
| Howard B. Surloff, Assistant Secretary | |
| Valerie A. Zondorak, Assistant Secretary |
GOLDMAN, SACHS & CO.
Distributor and Transfer
Agent
GOLDMAN SACHS ASSET MANAGEMENT
Investment Adviser
Visit our internet address: www.gs.com/funds
This material is not authorized for distribution to prospective investors unless preceded or accompanied by a current Prospectus.Investors should read the Prospectus carefully before investing or sending money.
Goldman, Sachs & Co. .is the distributor of the Fund.
Goldman Sachs High Yield Fund invests primarily in high yield, lower rated securities which involve greater price volatility and present greater risks than higher rated fixed income securities. At times, the Fund may be unable to sell certain of its portfolio securities without a substantial drop in price, if at all.
Goldman Sachs High Yield Fund's foreign investments may be more volatile than an investment in U.S .securities and are subject to the risks of currency fluctuations and political developments.
Goldman Sachs High Yield Fund's foreign investments and active management techniques entail risks in addition to those customarily associated with investing in dollar-denominated securities of U.S .issuers. Compared with U.S. securities markets, foreign markets may be less liquid, more volatile and less subject to governmental regulation, and may make available less public information about issuers. The Funds may incur losses because of changes in securities prices expressed in local currencies, movements in exchange rates, or both.
Copyright 2000 Goldman, Sachs & Co. All rights reserved. Date of first use: June 30, 2000 / 00-924 FI/HYSAR /13K / 6-00
|
|