
|
|
|
|
|
|
|
|
|
GOLDMAN SACHS INTERNATIONAL EQUITY FUND
Market Overview
Dear Shareholder:
International equities generated mixed results, as a correction in the technology sector and contrasting country-specific fundamentals impacted the market.
As always, we appreciate your support and we look forward to serving your investment needs in the years to come.
Sincerely,
 |
 |
|
| David B. Ford | David W. Blood | |
| Co-Head, Goldman Sachs Asset Management | Co-Head, Goldman Sachs Asset Management | |
| September 15, 2000 |
GOLDMAN SACHS INTERNATIONAL EQUITY FUND
Fund Basics
as of August 31, 2000
| PERFORMANCE REVIEW | ||||||
| August 31, 1999– | Fund Total Return | MSCI EAFE | FT/S&P Actuaries | |||
| August 31, 2000 | (without sales charge)1 | Index2 | Europe and Pacific Index2 | |||
| |
||||||
| Class A | 14.68 | % | 9.81 | % | 8.88 | % |
| Class B | 14.20 | 9.81 | 8.88 | |||
| Class C | 14.28 | 9.81 | 8.88 | |||
| Institutional | 15.45 | 9.81 | 8.88 | |||
| Service | 15.00 | 9.81 | 8.88 | |||
| |
||||||
1 The net asset value represents the net assets of the Fund (ex-dividend) divided by the total number of shares. The Fund’s performance assumes the reinvestment of dividends and other distributions.
2 The Morgan Stanley Capital International (MSCI) Europe, Australia and Far East (EAFE) Index (with dividends reinvested), an unmanaged index of common stock prices, replaced the FT/S&P Actuaries Europe and Pacific Index (“EuroPac”) as of 11/30/99 as the International Equity Fund’s performance benchmark.The MSCI EAFE Index is widely used throughout the investment management industry to represent the investment opportunities available to a large cap, developed country international equity strategy and, in the Investment Advisor’s opinion, is a more appropriate benchmark against which to measure the performance of the International Equity Fund. The Index figures do not reflect any fees or expenses. The unmanaged EuroPac Index is a market capitalization-weighted composite of approximately 1,500 stocks from 20 countries in the Europe and Asia-Pacific region. The Index figures do not reflect any fees or expenses. In addition, investors cannot invest directly in the Index.
| STANDARDIZED TOTAL RETURNS3 | ||||||||||
| For the period ended 6/30/00 | Class A
|
Class B
|
Class C
|
Institutional
|
Service
|
|||||
| |
||||||||||
| One Year | 18.36 | % | 19.01 | % | 23.62 | % | 26.02 | % | 25.48 | % |
| Five Years | 14.71 | N/A
|
N/A
|
N/A
|
16.15 | 4 | ||||
| Since Inception | 12.21 | 12.29 | 11.39 | 15.36 | 13.14 | 4 | ||||
| (12/1/92 | ) | (5/1/96 | ) | (8/15/97 | ) | (2/7/96 | ) | (12/1/92 | ) | |
| |
||||||||||
3 The Standardized Total Returns are average annual total returns or cumulative total returns (only if the performance period is one year or less) as of the most recent calendar quarter-end. They assume reinvestment of all distributions at net asset value. These returns reflect a maximum initial sales charge of 5.5% for Class A shares, the assumed deferred sales charge for Class B shares (5% maximum declining to 0% after six years) and the assumed deferred sales charge for Class C shares (1% if redeemed within 12 months of purchase). Because Institutional and Service shares do not involve a sales charge, such a charge is not applied to their Standardized Total Returns.
4 Performance data for Service shares prior to 3/6/96 is that of Class A shares (excluding the impact of front-end sales charges applicable to Class A shares since Service shares are not subject to any sales charges). Performance of Class A shares of the International Equity Fund reflects the expenses applicable to the Fund’s Class A shares. The fees applicable to Service shares are different from those applicable to Class A shares which impact performance ratings and rankings for a class of shares.
Total return figures represent past performance and do not indicate future results, which will vary. The investment return and principal value of an investment will fluctuate and, therefore, an investor’s shares, when redeemed, may be worth more or less than their original cost. Performance reflects expense limitations in effect. In their absence, performance would be reduced.
| TOP 10 HOLDINGS AS OF 8/31/00 | ||||
| Holding | % of Total Net Assets | Line of Business | ||
| |
|
|
||
| Vodafone AirTouch PLC | 3.5 | % | Telecommunications | |
| Nokia Oyj | 2.5 | Telecommunications | ||
| Telefonaktiebolaget LM Ericsson AB Series B | 2.2 | Telecommunications | ||
| Nippon Telephone & Telegraph Corp. | 1.6 | Telecommunications | ||
| Royal Dutch Petroleum Co. | 1.6 | Energy Resources | ||
| Glaxo Wellcome PLC | 1.5 | Health | ||
| BP Amoco PLC | 1.5 | Energy Resources | ||
| Telefonica de Espana SA | 1.5 | Telecommunications | ||
| Nestle SA | 1.5 | Food & Beverage | ||
| ING Groep NV | 1.5 | Financial Services | ||
| |
||||
1
The top 10 holdings may not be representative of the Fund’s future investments.
GOLDMAN SACHS INTERNATIONAL EQUITY FUND
Performance Overview
Dear Shareholder,
We are pleased to report on the performance of the Goldman Sachs International Equity Fund for the one year period that ended August 31, 2000.
Performance Review
Over the one-year period that ended August 31, 2000, the Fund’s Class A, B, C, Institutional and Service shares generated cumulative total returns, without sales charges, of 14.68%, 14.20%, 14.28%, 15.45%, and 15.00%, respectively. These figures compare favorably to the 9.81% cumulative total return of the Fund’s benchmark, Morgan Stanley Capital International (MSCI) Europe, Australia and Far East (EAFE) Index (with dividends reinvested).
The Fund’s stronger relative performance versus the benchmark was largely the result of stock selection and regional allocation decisions. Over the last few months, we have also moved to reduce the size of our sector positions (overweight or underweight) in response to high market volatility and intra-market rotation. We have focused instead on our key strength, bottom-up stock selection.
Portfolio Composition
We continue to run a very benign asset allocation strategy, preferring to derive the majority of our excess returns from bottom-up stock selection. We maintain our positive view on the long-term outlook for Continental Europe, while remaining underweight the UK and broadly neutral in Asia as a whole.
Thematically, our positioning in the International Equity fund has remained broadly consistent over the past months, with a continued emphasis on ‘long duration’ assets, typically with visible growth prospects, enduring franchises and strong relative pricing power. The Fund’s core positions — overweight media, pharmaceuticals and consumer staples, and underweight in capital goods and basic materials — remains in place.
Portfolio Highlights
2
GOLDMAN SACHS INTERNATIONAL EQUITY FUND
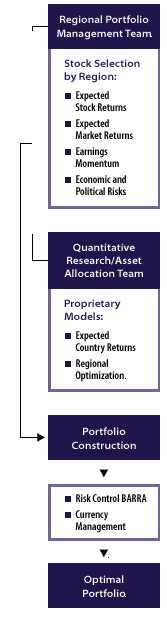
INVESTMENT PROCESS OVERVIEW
The results of our bottom-upstock selection process are enhanced by a top-down review of our regional market views and the views of the quantitative research team.
Portfolio Outlook
Goldman Sachs International Equity Investment Team
London, Tokyo, Singapore
September 15, 2000
3
GOLDMAN SACHS INTERNATIONAL EQUITY FUND
The Goldman Sachs Advantage
Founded in 1869, Goldman, Sachs & Co. is a premier financial services firm traditionally known on Wall Street and around the world for its institutional expertise.
Today, the firm’s Investment Management Division provides individual investors the opportunity to tap the resources of a global institutional powerhouse — and put this expertise to work in their individual portfolios.
What Sets Goldman Sachs Funds Apart?

Our portfolio management teams are located on-site, around the world, in New York, London, Tokyo and Singapore. Their understanding of local economies, markets, industries and cultures helps deliver what many investors want: access to global investment opportunities and consistent, risk-adjusted performance.

Our portfolio management teams make on-site visits to hundreds of companies each month, then construct selective portfolios with an emphasis on their best ideas. Our teams also have access to Goldman, Sachs & Co.’s Global Investment Research Department.

In this, our institutional heritage is clear. Institutions, as well as many individual investors, often look to us to manage the risks of global investing over time in different market environments.
To learn more about the Goldman Sachs Funds, call your investment professional today.
4
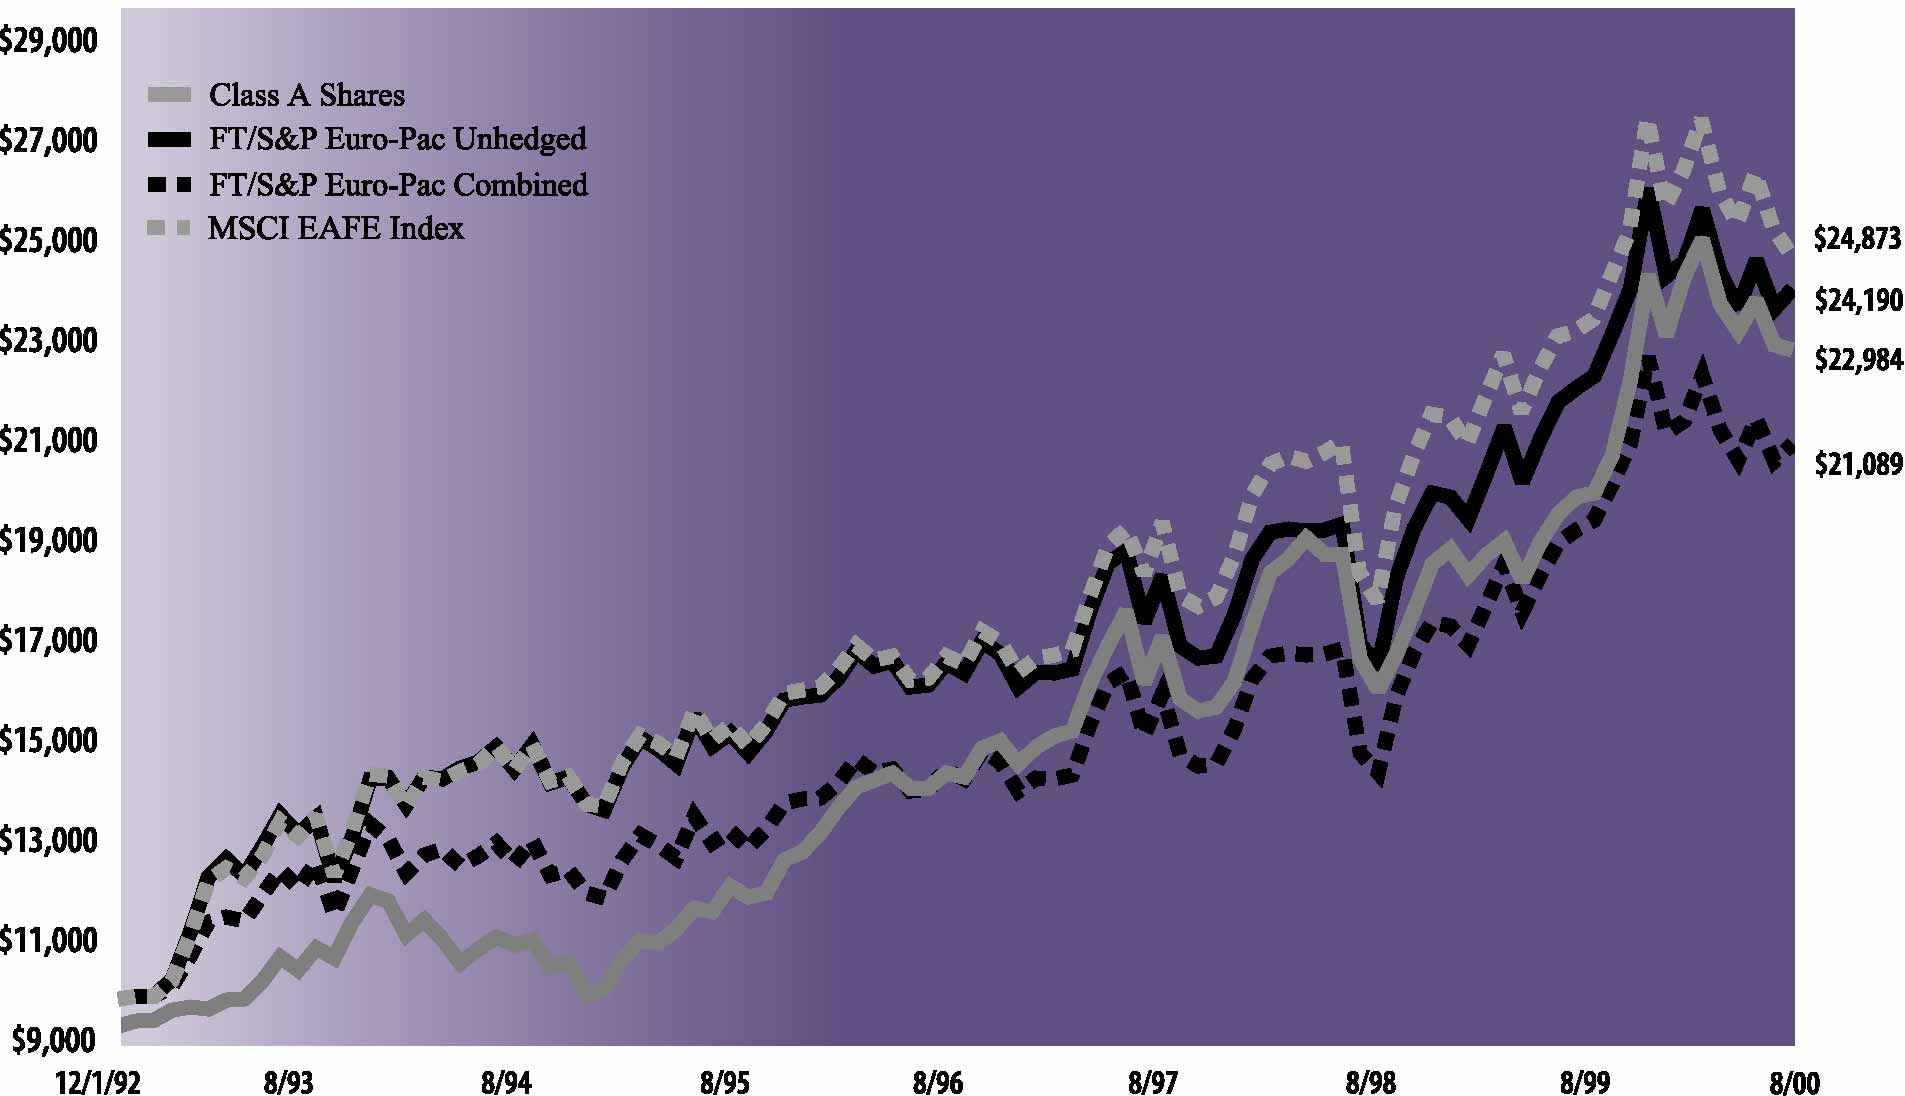
| The following graph shows the value, as of August 31, 2000, of a $10,000 investment made on December 1, 1992 (commencement of
operations) in Class A Shares (maximum sales charge of 5.5%) of the Goldman Sachs International Equity Fund. For comparative purposes, the performance of the Fund’s new benchmark (Morgan Stanley Capital International (MSCI) Europe, Australia and Far
East Index (EAFE)) as of November 30, 1999 and the Fund’s previous benchmarks (the FT/S&P Euro-Pac Unhedged and the FT/S&P Europac Combined) are shown. This performance data represents past performance and should not be considered indicative
of future performance which will fluctuate with changes in market conditions. These performance fluctuations will cause an investor’s shares, when redeemed, to be worth more or less than their original cost. Performance of Class B, Class C,
Institutional and Service Shares will vary from Class A due to differences in fees and loads.
|
| International Equity Fund’s Lifetime Performance
|
| Growth of a $10,000 Investment, Distributions Reinvested December 1, 1992 to August 31, 2000
|
 |
| Average Annual Total Return through August 31, 2000 | Since Inception | Five Years | One Year | ||||||
|---|---|---|---|---|---|---|---|---|---|
| Class A (commenced December 1, 1992) | |||||||||
| Excluding sales charges | 12.14 | % | 14.38 | % | 14.68% | ||||
| Including sales charges | 11.33 | % | 13.08 | % | 8.36% | ||||
| Class B (commenced May 1, 1996) | |||||||||
| Excluding contingent deferred sales charges | 11.10 | % | — | 14.20% | |||||
| Including contingent deferred sales charges | 10.68 | % | — | 8.59% | |||||
| Class C (commenced August 15, 1997) | |||||||||
| Excluding contingent deferred sales charges | 9.18 | % | — | 14.28% | |||||
| Including contingent deferred sales charges | 9.18 | % | — | 13.16% | |||||
| Institutional Class (commenced February 7, 1996) | 13.73 | % | — | 15.45% | |||||
| Service Class (commenced March 6, 1996) | 13.07 | % | — | 15.00% | |||||
|
Shares |
Description | Value | |||
|---|---|---|---|---|---|
| Common Stocks – 94.6% | |||||
| Australia – 2.4% | |||||
| 480,889 | Broken Hill Proprietary Co. Ltd.
(Nonferrous Metals) |
$ 5,259,638 | |||
| 758,410 | News Corp. Ltd. (Media) | 9,894,754 | |||
| 1,384,297 | Tab Corp. Holdings Ltd.
(Entertainment) |
7,862,811 | |||
| 2,998,836 | Telstra Corp. (Utilities) | 10,911,750 | |||
| 2,168,232 | Woolworths Ltd. (Specialty Retail) | 8,564,631 | |||
| 42,493,584 | |||||
| Canada – 0.4% | |||||
| 125,200 | The Seagram Co. Ltd.
(Entertainment) |
7,535,475 | |||
| China – 0.1% | |||||
| 325,000 | China Mobile Ltd. *
(Telecommunications) |
2,500,321 | |||
| Finland – 2.8% | |||||
| 1,009,156 | Nokia Oyj (Telecommunications) | 44,229,519 | |||
| 143,648 | Sonera Oyj (Telecommunications) | 4,794,885 | |||
| 49,024,404 | |||||
| France – 10.8% | |||||
| 151,889 | Accor SA (Hotels) | 6,539,715 | |||
| 84,862 | Air Liquide SA (Chemicals) | 10,810,753 | |||
| 272,279 | Alcatel (Telecommunications) | 22,249,933 | |||
| 297,297 | Alstom (Electrical Equipment) | 6,664,118 | |||
| 145,786 | Aventis SA (Drugs) | 10,936,121 | |||
| 118,711 | Axa (Insurance) | 16,893,330 | |||
| 116,828 | Banque Nationale de Paris (Banks) | 10,734,407 | |||
| 31,131 | Cap Gemini SA (Business
Services) |
6,494,590 | |||
| 136,388 | Carrefour SA (Specialty Retail) | 9,940,543 | |||
| 131,506 | France Telecom SA
(Telecommunications) |
15,001,665 | |||
| 91,189 | Lafarge SA (Construction) | 6,751,485 | |||
| 77,405 | LVMH (Louis Vuitton Moet
Hennessy) * (Conglomerates) |
6,005,805 | |||
| 139,061 | Renault SA (Auto) | 6,044,182 | |||
| 97,547 | STMicroelectronics NV
(Semiconductors) |
5,975,218 | |||
| 173,923 | Total Fina SA Class B (Energy
Resources) |
25,800,270 | |||
| 135,006 | Valeo SA (Auto) | 7,239,037 | |||
| 125,525 | Vivendi (Business Services) | 10,252,006 | |||
| 208,271 | Vivendi Environnement * (Utilities) | 7,146,100 | |||
| 191,479,278 | |||||
| Germany – 5.3% | |||||
| 38,617 | Allianz AG (Insurance) | 13,010,114 | |||
| 74,499 | DaimlerChrysler AG (Auto) | 3,829,303 | |||
| 233,894 | Deutsche Bank AG (Banks) | 20,348,666 | |||
| 343,534 | Deutsche Lufthansa AG (Airlines) | 7,599,912 | |||
| 373,212 | Deutsche Telekom AG
(Telecommunications) |
14,329,548 | |||
| 162,406 | E.On AG (Energy Resources) | 7,779,725 | |||
|
Shares |
Description | Value | |||
|---|---|---|---|---|---|
| Common Stocks – (continued) | |||||
| Germany – (continued) | |||||
| 25,792 | Muenchener Rueckversicherungs-
Gesellschaft AG (Property Insurance) |
$ 7,072,609 | |||
| 128,622 | Siemens AG (Electrical Equipment) | 20,610,249 | |||
| 94,580,126 | |||||
| Hong Kong – 2.1% | |||||
| 5,174,000 | Giordano International Ltd.
(Specialty Retail) |
2,902,455 | |||
| 1,086,700 | Hang Seng Bank Ltd. (Banks) | 11,669,589 | |||
| 1,108,600 | Hutchison Whampoa Ltd.
(Multi-Industrial) |
15,636,107 | |||
| 778,000 | Li & Fung Ltd. (Wholesale) | 3,391,717 | |||
| 1,680,657 | Pacific Century CyberWorks Ltd. *
(Computer Software) |
3,124,699 | |||
| 36,724,567 | |||||
| Ireland – 0.6% | |||||
| 1,767,646 | Bank of Ireland (Banks) | 10,487,043 | |||
| Italy – 3.3% | |||||
| 1,659,582 | Banca Nazionale del Lavoro
(Financial Services) |
6,158,370 | |||
| 1,384,556 | San Paolo-IMI SpA (Banks) | 24,558,215 | |||
| 1,844,500 | Telecom Italia Mobile SpA
(T.I.M.) (Telecommunications) |
15,981,563 | |||
| 1,009,563 | Telecom Italia SpA
(Telecommunications) |
12,403,958 | |||
| 59,102,106 | |||||
| Japan – 24.7% | |||||
| 247,959 | Aderans Co. Ltd. (Specialty Retail) | 9,834,661 | |||
| 76,300 | Advantest Corp. (Electronics
Equipment) |
15,560,479 | |||
| 928,000 | Asahi Chemical Industry Co. Ltd.
(Chemicals) |
5,803,807 | |||
| 1,343,000 | Asahi Glass Co. Ltd. (Home
Products) |
12,554,816 | |||
| 476,000 | Bridgestone Corp. (Auto) | 6,159,213 | |||
| 448,265 | Canon, Inc. (Computer Hardware) | 20,048,984 | |||
| 1,299,000 | Chiba Bank Ltd. (Banks) | 5,310,493 | |||
| 251,700 | Circle K Japan Co. (Specialty
Retail) |
9,039,016 | |||
| 394,000 | Daiwa Securities Group, Inc.
(Financial Services) |
4,913,456 | |||
| 180,600 | FANUC Ltd. (Electronics
Equipment) |
19,643,320 | |||
| 339,000 | Fuji Photo Film Ltd. (Leisure) | 12,142,335 | |||
| 281,000 | Fujitsu Ltd. (Computer Hardware) | 8,141,491 | |||
| 172,000 | Honda Motor Co. Ltd. (Auto) | 6,289,733 | |||
| 252 | Hoya Corp. (Electrical Equipment) | 24,101 | |||
| 506,000 | Kao Corp. (Chemicals) | 13,901,360 | |||
| 960,000 | Kirin Brewery Ltd. (Food &
Beverage) |
10,531,646 | |||
| 2,542,790 | Mitsui Marine & Fire (Insurance) | 12,660,305 | |||
| 452,000 | NEC Corp. (Computer Hardware) | 12,926,396 | |||
|
Shares |
Description | Value | |||
|---|---|---|---|---|---|
| Common Stocks – (continued) | |||||
| Japan – (continued) | |||||
| 450,000 | NGK Insulators Ltd.
(Multi-Industrial) |
$ 6,181,435 | |||
| 28,242 | Nintendo Co. Ltd. (Entertainment) | 4,883,099 | |||
| 2,429 | Nippon Telephone & Telegraph
Corp. (Telecommunications) |
28,924,802 | |||
| 751,000 | Ricoh Co. Ltd. (Computer
Hardware) |
13,132,818 | |||
| 56,000 | Rohm Co. (Electronics Equipment) | 15,936,241 | |||
| 27,500 | Ryohin Keikaku Co. Ltd.
(Specialty Retail) |
2,655,884 | |||
| 936,000 | Sanyo Electric Co. Ltd. (Electrical
Equipment) |
7,942,617 | |||
| 924,000 | Sharp Corp. (Electrical Equipment) | 14,719,888 | |||
| 282,000 | Shin-Etsu Chemical Co. Ltd.
(Chemicals) |
13,855,416 | |||
| 392,000 | Skylark Co. Ltd. (Restaurants) | 14,334,741 | |||
| 23,811 | SMC Corp. (Machinery) | 4,219,671 | |||
| 127,100 | Sony Corp. (Electrical Equipment) | 14,181,810 | |||
| 1,178,000 | Sumitomo Corp. (Wholesale) | 10,272,293 | |||
| 161,000 | Takeda Chemical Industries Ltd.
(Drugs) |
9,525,645 | |||
| 100,600 | Takefuji Corp. (Financial Services) | 9,894,928 | |||
| 169,000 | Terumo Corp. (Medical Products) | 4,674,637 | |||
| 1,438,000 | The Fuji Bank Ltd. (Banks) | 10,935,003 | |||
| 361,000 | The Nomura Securities Co. Ltd.
(Financial Services) |
8,445,336 | |||
| 562,800 | Tokyo Electric Power (Electrical
Utilities) |
12,585,824 | |||
| 453,200 | Toppan Forms Co. Ltd.
(Publishing) |
9,582,429 | |||
| 443,000 | Toyota Motor Corp. (Auto) | 19,273,513 | |||
| 339,000 | Yamanouchi Pharmaceutical Co.
Ltd. (Drugs) |
16,783,123 | |||
| 438,426,765 | |||||
| Netherlands – 7.4% | |||||
| 355,258 | ASM Lithography Holding NV
(Semiconductors) |
13,413,127 | |||
| 250,765 | Fortis Netherlands NV (Financial
Services) |
7,718,120 | |||
| 514,675 | Getronics NV (Business Services) | 6,451,468 | |||
| 393,958 | ING Groep NV (Financial
Services) |
26,370,116 | |||
| 368,171 | Koninklijke Royal Philips
Electronics NV (Appliance) |
17,911,045 | |||
| 423,776 | KPN NV (Telecommunications) | 11,289,979 | |||
| 473,741 | Royal Dutch Petroleum Co.
(Energy Resources) |
28,808,611 | |||
| 367,455 | United Pan-Europe
Communications NV * (Telecommunications) |
8,973,989 | |||
| 195,824 | VNU NV (Media) | 10,430,568 | |||
| 131,367,023 | |||||
|
Shares |
Description | Value | |||
|---|---|---|---|---|---|
| Common Stocks – (continued) | |||||
| Singapore – 1.0% | |||||
| 851,300 | Chartered Semiconductor
Manufacturing Ltd. * (Semiconductors) |
$ 7,122,608 | |||
| 451,847 | DBS Group Holdings Ltd. (Banks) | 5,460,704 | |||
| 280,000 | Singapore Press Holdings Ltd.
(Publishing) |
4,506,420 | |||
| 17,089,732 | |||||
| Spain – 2.6% | |||||
| 214,815 | Acerinox SA (Steel) | 6,293,168 | |||
| 422,243 | Endesa SA (Electrical Utilities) | 8,227,876 | |||
| 257,210 | Repsol SA (Energy Resources) | 5,091,943 | |||
| 1,397,430 | Telefonica de Espana SA *
(Telecommunications) |
26,796,285 | |||
| 46,409,272 | |||||
| Sweden – 5.0% | |||||
| 798,360 | Investor AB (Financial Services) | 11,332,893 | |||
| 1,974,131 | Nordbanken Holding AB (Banks) | 13,697,915 | |||
| 45,607 | Sandvik AB (Machinery) | 995,259 | |||
| 548,311 | Securitas AB Series B (Business
Services) |
12,197,855 | |||
| 569,477 | Skandia Forsakring (Insurance) | 11,522,501 | |||
| 1,901,168 | Telefonaktiebolaget LM Ericsson
AB Series B (Telecommunications) |
38,366,544 | |||
| 88,112,967 | |||||
| Switzerland – 6.9% | |||||
| 133,657 | ABB Ltd. (Business Services) | 14,961,605 | |||
| 10,594 | Adecco SA (Business Services) | 8,118,823 | |||
| 52,442 | Credit Suisse Group (Banks) | 10,958,030 | |||
| 12,334 | Nestle SA (Food & Beverage) | 26,579,699 | |||
| 9,690 | Novartis AG (Health) | 14,651,814 | |||
| 2,227 | Roche Holding AG (Health) | 19,943,284 | |||
| 5,957 | Swiss Re (Property Insurance) | 12,228,606 | |||
| 103,424 | UBS AG (Banks) | 15,050,507 | |||
| 122,492,368 | |||||
| United Kingdom – 19.2% | |||||
| 1,306,185 | Allied Zurich PLC (Insurance) | 15,987,750 | |||
| 556,153 | Amvescap PLC (Financial
Services) |
11,863,401 | |||
| 234,385 | AstraZeneca Group PLC (Health) | 10,679,651 | |||
| 2,937,538 | BP Amoco PLC (Energy
Resources) |
26,876,095 | |||
| 861,731 | British Aerospace PLC
(Defense/Aerospace) |
5,364,467 | |||
| 761,849 | British American Tobacco PLC
(Tobacco) |
4,897,452 | |||
| 1,340,651 | British Telecom PLC
(Telecommunications) |
17,022,423 | |||
| 218,669 | Cable & Wireless PLC
(Telecommunications) |
4,039,366 | |||
| 433,691 | CGNU PLC (Insurance) | 6,670,891 | |||
| 1,586,248 | Diageo PLC (Tobacco) | 13,534,618 | |||
| 951,088 | Glaxo Wellcome PLC (Health) | 27,340,268 | |||
| (continued)
|
|
Shares |
Description | Value | |||
|---|---|---|---|---|---|
| Common Stocks – (continued) | |||||
| United Kingdom – (continued) | |||||
| 1,310,889 | HSBC Holdings PLC (Banks) | $ 18,851,120 | |||
| 725,059 | Imperial Chemical Industries
PLC (Chemicals) |
4,892,422 | |||
| 803,100 | Lloyds TSB Group PLC (Banks) | 7,551,656 | |||
| 449,164 | Marconi PLC
(Telecommunications) |
7,964,779 | |||
| 514,707 | Reuters Group PLC (Business
Services) |
10,307,106 | |||
| 726,149 | Royal Bank of Scotland Group
PLC * (Banks) |
853,509 | |||
| 726,149 | Royal Bank of Scotland Group
PLC (Banks) |
13,108,220 | |||
| 1,055,355 | ScottishPower PLC (Energy
Resources) |
8,039,989 | |||
| 1,794,244 | SmithKline Beecham PLC
(Health) |
23,367,569 | |||
| 3,516,715 | Tesco PLC (Specialty Retail) | 11,060,986 | |||
| 2,914,076 | Unilever PLC (Food & Beverage) | 18,246,487 | |||
| 315,479 | United News & Media PLC
(Publishing) |
3,982,789 | |||
| 15,205,430 | Vodafone AirTouch PLC
(Telecommunications) |
61,394,782 | |||
| 477,868 | WPP Group PLC (Business
Services) |
6,781,791 | |||
| 340,679,587 | |||||
| TOTAL COMMON STOCKS | |||||
| (Cost $1,542,578,392) | $ 1,678,504,618 | ||||
|
Shares |
Description | Value | |||
|---|---|---|---|---|---|
| Preferred Stocks – 0.7% | |||||
| Germany – 0.7% | |||||
| 49,154 | SAP AG (Computer Software) | $ 12,392,759 | |||
| TOTAL PREFERRED STOCKS | |||||
| (Cost $6,915,138) | $ 12,392,759 | ||||
| Principal
Amount |
Interest
Rate |
Maturity
Date |
Value | ||||
|---|---|---|---|---|---|---|---|
| Short-Term Obligation – 3.7% | |||||||
| State Street Bank & Trust Euro-Time Deposit | |||||||
| $65,491,000 | 6.56% | 09/01/2000 | $ 65,491,000 | ||||
| TOTAL SHORT-TERM OBLIGATION | |||||||
| (Cost $65,491,000) | $ 65,491,000 | ||||||
| TOTAL INVESTMENTS | |||||||
| (Cost $1,614,984,530) | $1,756,388,377 | ||||||
*
|
Non-income producing security.
|
| The percentage shown for each investment category reflects the value of investments in that category as a percentage of total net
assets.
|
| Percentage
of Total Net Assets |
||||
|---|---|---|---|---|
| Common and Preferred Stock Industry Classifications | ||||
| Airlines | 0.4 | % | ||
| Appliance | 1.0 | |||
| Auto | 2.8 | |||
| Banks | 10.1 | |||
| Business Services | 4.3 | |||
| Chemicals | 3.4 | |||
| Computer Hardware | 3.1 | |||
| Computer Software | 0.9 | |||
| Conglomerates | 0.3 | |||
| Construction | 0.4 | |||
| Defense/Aerospace | 0.3 | |||
| Drugs | 1.5 | |||
| Electrical Equipment | 3.6 | |||
| Electrical Utilities | 1.2 | |||
| Electronics Equipment | 2.9 | |||
| Energy Resources | 5.8 | |||
| Entertainment | 1.1 | |||
| Financial Services | 4.9 | |||
| Food & Beverage | 3.1 | |||
| Health | 5.4 | |||
| Home Products | 0.7 | |||
| Hotels | 0.4 | |||
| Insurance | 4.3 | |||
| Leisure | 0.7 | |||
| Machinery | 0.3 | |||
| Media | 1.1 | |||
| Medical Products | 0.3 | |||
| Multi-Industrial | 1.2 | |||
| Nonferrous Metals | 0.3 | |||
| Property Insurance | 1.1 | |||
| Publishing | 1.0 | |||
| Restaurants | 0.8 | |||
| Semiconductors | 1.5 | |||
| Specialty Retail | 3.0 | |||
| Steel | 0.4 | |||
| Telecommunications | 18.9 | |||
| Tobacco | 1.0 | |||
| Utilities | 1.0 | |||
| Wholesale | 0.8 | |||
| TOTAL COMMON AND PREFERRED STOCK | 95.3 | % | ||
| Assets: | ||||
| Investment in securities, at value (identified cost $1,614,984,530) | $1,756,388,377 | |||
| Cash, at value | 3,296,292 | |||
| Receivables: | ||||
| Fund shares sold | 14,582,133 | |||
| Dividends and interest, at value | 3,888,191 | |||
| Investment securities sold, at value | 2,948,543 | |||
| Variation margin (a) | 2,892,385 | |||
| Forward foreign currency exchange contracts, at value | 1,677,801 | |||
| Reimbursement from investment adviser | 545,848 | |||
| Other assets | 6,736 | |||
| Total assets | 1,786,226,306 | |||
| Liabilities: | ||||
| Payables: | ||||
| Investment securities purchased, at value | 3,357,057 | |||
| Forward foreign currency exchange contracts, at value | 2,593,826 | |||
| Amounts owed to affiliates | 2,378,429 | |||
| Fund shares repurchased | 2,141,506 | |||
| Accrued expenses and other liabilities | 631,698 | |||
| Total liabilities | 11,102,516 | |||
| Net Assets: | ||||
| Paid-in capital | 1,501,445,561 | |||
| Accumulated distributions in excess of net investment loss | (8,940,186 | ) | ||
| Accumulated net realized gain on investment, futures and foreign currency related transactions | 141,971,105 | |||
| Net unrealized gain on investments, futures and translation of assets and liabilities denominated in foreign currencies | 140,647,310 | |||
| NET ASSETS | $1,775,123,790 | |||
| Net asset value, offering and redemption price per share: (b) | ||||
| Class A | $23.59 | |||
| Class B | $23.14 | |||
| Class C | $22.89 | |||
| Institutional | $24.06 | |||
| Service | $23.65 | |||
| Shares outstanding: | ||||
| Class A | 56,958,617 | |||
| Class B | 3,469,803 | |||
| Class C | 962,518 | |||
| Institutional | 13,512,467 | |||
| Service | 160,182 | |||
| Total shares outstanding, $.001 par value (unlimited number of shares authorized) | 75,063,587 | |||
(a)
|
Includes approximately $2,056,000 relating to initial margin requirements for futures transactions.
|
(b)
|
Maximum public offering price per share (NAV per share multiplied by 1.0582) for Class A Shares is $24.96. At redemption, Class B
and Class C Shares may be subject to a contingent deferred sales charge, assessed on the amount equal to the lesser of the current net asset value or the original purchase price of the shares.
|
| Investment income: | ||||
| Dividends (a) | $ 21,033,572 | |||
| Interest | 5,147,523 | |||
| Total income | 26,181,095 | |||
| Expenses: | ||||
| Management fees | 15,633,003 | |||
| Distribution and Service fees (b) | 6,981,282 | |||
| Transfer Agent fees (c) | 2,573,914 | |||
| Custodian fees | 1,918,064 | |||
| Registration fees | 199,961 | |||
| Professional fees | 67,010 | |||
| Service share fees | 20,398 | |||
| Trustee fees | 8,901 | |||
| Other | 226,450 | |||
| Total expenses | 27,628,983 | |||
| Less — expense reductions | (794,554 | ) | ||
| Net expenses | 26,834,429 | |||
| NET INVESTMENT LOSS | (653,334 | ) | ||
| Realized and unrealized gain (loss) on investment, futures and foreign currency related transactions: | ||||
| Net realized gain (loss) from: | ||||
| Investment transactions | 152,167,182 | |||
| Futures transactions | 17,526,583 | |||
| Foreign currency related transactions | (2,733,931 | ) | ||
| Net change in unrealized gain (loss) on: | ||||
| Investments | 2,670,982 | |||
| Futures | (367,621 | ) | ||
| Translation of assets and liabilities denominated in foreign currencies | (338,987 | ) | ||
| Net realized and unrealized gain on investment, futures and foreign currency related transactions | 168,924,208 | |||
| NET INCREASE IN NET ASSETS RESULTING FROM OPERATIONS | $168,270,874 | |||
(a)
|
Foreign taxes withheld on dividends were $3,097,226.
|
(b)
|
Class A, Class B and Class C had Distribution and Service fees of $6,009,343, $795,433 and $176,506, respectively.
|
(c)
|
Class A, Class B, Class C, Institutional Class and Service Class had Transfer Agent fees of $2,283,550, $151,133, $33,536,
$104,063 and $1,632, respectively.
|
| For the
Year Ended August 31, 2000 |
||||
|---|---|---|---|---|
| From operations: | ||||
| Net investment loss | $ (653,334 | ) | ||
| Net realized gain from investment, futures and foreign currency related transactions | 166,959,834 | |||
| Net change in unrealized gain on investments, futures and translation of assets and liabilities denominated in foreign
currencies |
1,964,374 | |||
| Net increase in net assets resulting from operations | 168,270,874 | |||
| Distributions to shareholders: | ||||
| From net investment income | ||||
| Class A Shares | (4,137,059 | ) | ||
| Class B Shares | (213,456 | ) | ||
| Class C Shares | (50,889 | ) | ||
| Institutional Shares | (1,171,372 | ) | ||
| Service Shares | (16,685 | ) | ||
| In excess of net investment income | ||||
| Class A Shares | (9,786,740 | ) | ||
| Class B Shares | (504,956 | ) | ||
| Class C Shares | (120,385 | ) | ||
| Institutional Shares | (2,771,030 | ) | ||
| Service Shares | (39,469 | ) | ||
| From net realized gains | ||||
| Class A Shares | (105,741,385 | ) | ||
| Class B Shares | (7,678,106 | ) | ||
| Class C Shares | (1,511,693 | ) | ||
| Institutional Shares | (22,154,888 | ) | ||
| Service Shares | (403,458 | ) | ||
| Total distributions to shareholders | (156,301,571 | ) | ||
| From share transactions: | ||||
| Proceeds from sales of shares | 962,871,083 | |||
| Reinvestment of dividends and distributions | 121,561,009 | |||
| Cost of shares repurchased | (529,098,512 | ) | ||
| Net increase in net assets resulting from share transactions | 555,333,580 | |||
| TOTAL INCREASE | 567,302,883 | |||
| Net assets: | ||||
| Beginning of year | $1,207,820,907 | |||
| End of year | $1,775,123,790 | |||
| Accumulated distributions in excess of net investment loss | $ (8,940,186 | ) | ||
| For the
Seven Months Ended August 31, 1999 |
|||||||||||
|---|---|---|---|---|---|---|---|---|---|---|---|
| From operations: | |||||||||||
| Net investment income | $ 2,238,774 | ||||||||||
| Net realized gain on investment, futures and foreign currency related transactions | 98,723,169 | ||||||||||
| Net change in unrealized loss on investments, futures and translation of assets and liabilities denominated in foreign
currencies |
(33,406,060 | ) | |||||||||
| Net increase in net assets resulting from operations | 67,555,883 | ||||||||||
| From share transactions: | |||||||||||
| Proceeds from sales of shares | 1,029,391,946 | ||||||||||
| Cost of shares repurchased | (1,032,832,481 | ) | |||||||||
| Net decrease in net assets resulting from share transactions | (3,440,535 | ) | |||||||||
| TOTAL INCREASE | 64,115,348 | ||||||||||
| Net assets: | |||||||||||
| Beginning of period | 1,143,705,559 | ||||||||||
| End of period | $ 1,207,820,907 | ||||||||||
| Accumulated undistributed net investment income | $ 6,242,794 | ||||||||||
| For the
Year Ended January 31, 1999 |
|||||||||||
|---|---|---|---|---|---|---|---|---|---|---|---|
| From operations: | |||||||||||
| Net investment loss | $ (2,714,406 | ) | |||||||||
| Net realized gain on investment, futures and foreign currency related transactions | 96,004,014 | ||||||||||
| Net change in unrealized gain on investments, futures and translation of assets and liabilities denominated in foreign
currencies |
55,278,283 | ||||||||||
| Net increase in net assets resulting from operations | 148,567,891 | ||||||||||
| Distributions to shareholders: | |||||||||||
| From net realized gains | |||||||||||
| Class A Shares | (41,132,351 | ) | |||||||||
| Class B Shares | (3,418,683 | ) | |||||||||
| Class C Shares | (556,864 | ) | |||||||||
| Institutional Shares | (4,927,209 | ) | |||||||||
| Service Shares | (179,258 | ) | |||||||||
| Total distributions to shareholders | (50,214,365 | ) | |||||||||
| From share transactions: | |||||||||||
| Proceeds from sales of shares | 2,171,378,743 | ||||||||||
| Reinvestment of dividends and distributions | 40,976,198 | ||||||||||
| Cost of shares repurchased | (1,982,583,097 | ) | |||||||||
| Net increase in net assets resulting from share transactions | 229,771,844 | ||||||||||
| TOTAL INCREASE | 328,125,370 | ||||||||||
| Net assets: | |||||||||||
| Beginning of year | 815,580,189 | ||||||||||
| End of year | $ 1,143,705,559 | ||||||||||
| Accumulated undistributed net investment income | $ 1,040,126 | ||||||||||
| 1. ORGANIZATION
|
| Goldman Sachs Trust (the “Trust”) is a Delaware business trust registered under the Investment Company Act of 1940 (as
amended) as an open-end, management investment company. The Trust includes the Goldman Sachs International Equity Fund (the “Fund”). The Fund is a diversified portfolio offering five classes of shares — Class A, Class B, Class C,
Institutional and Service.
|
| 2. SIGNIFICANT ACCOUNTING POLICIES
|
| The following is a summary of the significant accounting policies consistently followed by the Fund. The preparation of financial
statements in conformity with generally accepted accounting principles requires management to make estimates and assumptions that may affect the reported amounts. Actual results could differ from those estimates. Effective for fiscal year 1999, the Board
of Trustees approved a change in the fiscal year end of the Fund from January 31 to August 31. Accordingly, the Statements of Changes in Net Assets, Summary of Share Transactions, and Financial Highlights of the Fund are included for the seven months
ended August 31, 1999 and the year ended January 31, 1999.
|
| A. Investment Valuation — Investments in
securities traded on a U.S. or foreign securities exchange or the NASDAQ system are valued daily at their last sale price on the principal exchange on which they are traded. If no sale occurs, securities are valued at the last bid price. Debt securities
are valued at prices supplied by independent pricing services, broker/dealer-supplied valuations or matrix pricing systems. Unlisted equity and debt securities for which market quotations are available are valued at the last sale price on valuation date,
or if no sale occurs at the last bid price. Short-term debt obligations maturing in sixty days or less are valued at amortized cost, which approximates market value. Securities for which quotations are not readily available are valued at fair value using
methods approved by the Board of Trustees of the Trust.
|
| B. Security Transactions And Investment Income — Security transactions are recorded as of the trade date. Realized gains and losses on sales of portfolio securities are calculated using the identified-cost basis. Dividend income is recorded on the ex-dividend date, net of foreign withholding taxes
where applicable. Dividends for which the Fund has the choice to receive either cash or stock are recognized as investment income in an amount equal to the cash dividend. Interest income is recorded on the basis of interest accrued, premium amortized and
discount earned.
|
| Net investment income (other than class specific expenses) and unrealized and
realized gains or losses are allocated daily to each class of share of the Fund based upon the relative proportion of net assets of each class.
|
| C. Federal Taxes — It is the Fund’s
policy to comply with the requirements of the Internal Revenue Code applicable to regulated investment companies and to distribute each year substantially all of its investment company taxable income and capital gains to its shareholders. Accordingly, no
federal tax provision is required. Income and capital gains distributions, if any, are declared and paid annually.
|
| The characterization of distributions to shareholders for financial reporting
purposes is determined in accordance with income tax rules. Therefore, the source of the Fund’s distributions may be shown in the accompanying financial statements as either from or in excess of net investment income or net realized gain on
investment transactions, or from paid-in capital, depending on the type of book/tax differences that may exist.
|
| At August 31, 2000, the aggregate cost of portfolio securities for federal income
tax purposes is $1,624,611,545. Accordingly gross unrealized gain on investments was $223,254,070 and the gross unrealized loss on investments was $91,477,238 resulting in a net unrealized gain of $131,776,832.
|
| 2. SIGNIFICANT ACCOUNTING POLICIES (continued)
|
| D. Expenses — Expenses incurred by the
Trust which do not specifically relate to an individual Fund of the Trust are allocated to the Funds based on a straight-line or pro rata basis depending upon the nature of the expense.
|
| Class A, Class B and Class C Shares bear all expenses and fees relating to the
Distribution and Service Plans. Shareholders of Service Shares bear all expenses and fees paid to service organizations. Each class of shares separately bears its respective class-specific Transfer Agency fees.
|
| E. Foreign Currency Translations — The
books and records of the Fund are maintained in U.S. dollars. Amounts denominated in foreign currencies are translated into U.S. dollars on the following basis: (i) investment valuations, foreign currency and other assets and liabilities initially
expressed in foreign currencies are converted each business day into U.S. dollars based on current exchange rates; (ii) purchases and sales of foreign investments, income and expenses are converted into U.S. dollars based on currency exchange rates
prevailing on the respective dates of such transactions.
|
| Net realized and unrealized gain (loss) on foreign currency transactions will
represent: (i) foreign exchange gains and losses from the sale and holdings of foreign currencies; and (ii) currency gains and losses between trade date and settlement date on investment securities transactions and forward exchange contracts; and (iii)
gains and losses from the difference between amounts of dividends, interest and foreign withholding taxes recorded and the amounts actually received.
|
| F. Segregation Transactions — The Fund may
enter into certain derivative transactions to seek to increase total return. Forward foreign currency exchange contracts, futures contracts, written options, mortgage dollar rolls, when-issued and forward commitments represent examples of such
transactions. As a result of entering into those transactions the Fund is required to segregate liquid assets on the accounting records equal to or greater than the market value of the corresponding transactions.
|
| 3. AGREEMENTS
|
| Pursuant to the Investment Management Agreement (the “Agreement”), Goldman Sachs Asset Management International (“
GSAMI”), an affiliate of Goldman, Sachs & Co. (“Goldman Sachs”), serves as the investment adviser to the Fund. Under the Agreement, GSAMI, subject to the general supervision of the Trust’s Board of Trustees, manages the Fund’s
portfolio. As compensation for the services rendered under the Agreement, the assumption of the expenses related thereto and administering the Fund’s business affairs, including providing facilities, GSAMI is entitled to a fee, computed daily and
payable monthly, at an annual rate equal to 1.00% of the average daily net assets of the Fund.
|
| The investment adviser has voluntarily agreed to limit certain “Other
Expenses” (excluding Management fees, Distribution and Service fees, Transfer Agent fees, taxes, interest, brokerage, litigation, Service Share fees, indemnification costs and other extraordinary expenses) to the extent such expenses exceed, on an
annual basis, 0.10% of the average daily net assets of the Fund. Goldman Sachs reimbursed approximately $794,000 for the year ended August 31, 2000. In addition, the Fund has entered into certain offset arrangements with the custodian resulting in a
reduction in the Fund’s expenses. For the year ended August 31, 2000, custody fees were reduced by approximately $1,000.
|
| The Trust, on behalf of the Fund, has adopted Distribution and Service Plans.
Under the Distribution and Service Plans, Goldman Sachs and/or authorized dealers are entitled to a monthly fee from the Fund for distribution and shareholder maintenance services equal, on an annual basis, to 0.50%, 1.00% and 1.00% of the Fund’s
average daily net assets attributable to Class A, Class B and Class C Shares, respectively.
|
| Goldman Sachs serves as the distributor of shares of the Fund pursuant to a
Distribution Agreement. Goldman Sachs may receive a portion of the Class A sales load and Class B and Class C contingent deferred sales charges and has advised the Fund that it retained approximately $2,891,000 for the year ended August 31, 2000.
|
| 3. AGREEMENTS (continued)
|
| Goldman Sachs also serves as the Transfer Agent of the Fund for a fee. The fees
charged for such transfer agency services are calculated daily and payable monthly at an annual rate as follows: 0.19% of average daily net assets for Class A, Class B and Class C Shares and 0.04% of average daily net assets for Institutional and Service
shares.
|
| The Trust, on behalf of the Fund, has adopted a Service Plan. This Plan allows for
Service Shares to compensate service organizations for providing varying levels of account administration and shareholder liaison services to their customers who are beneficial owners of such shares. The Service Plan provides for compensation to the
service organizations in an amount up to 0.50% (on an annualized basis), of the average daily net asset value of the Service Shares.
|
| As of August 31, 2000, the amounts owed to affiliates were approximately
$1,483,000, $653,000 and $242,000 for Management, Distribution and Service and Transfer Agent fees, respectively.
|
| 4. PORTFOLIO SECURITIES TRANSACTIONS
|
| The cost of purchases and proceeds of sales and maturities of securities (excluding short-term investments and futures) for the
year ended August 31, 2000, were $1,555,116,959 and $1,170,979,843, respectively. For the year ended August 31, 2000, Goldman Sachs earned approximately $101,000 of brokerage commissions from futures transactions executed on behalf of the Fund.
|
| Forward Foreign Currency Exchange Contracts — The
Fund may enter into forward foreign currency exchange contracts for the purchase or sale of a specific foreign currency at a fixed price on a future date as a hedge or cross-hedge against either specific transactions or portfolio positions. The Fund may
also purchase and sell such contracts to seek to increase total return. All commitments are “marked-to-market” daily at the applicable translation rates and any resulting unrealized gains or losses are recorded in the Fund’s financial
statements. The Fund realizes gains or losses at the time a forward contract is offset by entry into a closing transaction or extinguished by delivery of the currency. Risks may arise upon entering these contracts from the potential inability of
counterparties to meet the terms of their contracts and from unanticipated movements in the value of a foreign currency relative to the U.S. dollar.
|
| At August 31, 2000, the Fund had the following outstanding forward foreign
currency exchange contracts:
|
| Open Foreign Currency | Value on
Settlement Date |
Current Value | Unrealized |
||||||
|---|---|---|---|---|---|---|---|---|---|
| Purchase Contracts | Gain | Loss | |||||||
| Australian Dollar | |||||||||
| expiring 10/13/2000 | $ 3,521,620 | $ 3,443,050 | $ — | $ 78,570 | |||||
| Danish Krone | |||||||||
| expiring 10/19/2000 | 14,605,000 | 14,220,417 | — | 384,583 | |||||
| Euro | |||||||||
| expiring 10/13/2000 | 19,453,483 | 19,129,311 | — | 324,172 | |||||
| Great British Pound | |||||||||
| expiring 9/14/2000 | 504,164 | 482,458 | — | 21,706 | |||||
| expiring 9/14/2000 | 13,028,098 | 12,599,983 | — | 428,115 | |||||
| expiring 9/14/2000 | 5,283,974 | 5,290,512 | 6,538 | — | |||||
| Norwegian Krone | |||||||||
| expiring 9/21/2000 | 6,686,000 | 6,524,793 | — | 161,207 | |||||
| New Zealand Dollar | |||||||||
| expiring 11/15/2000 | 2,465,889 | 2,335,514 | — | 130,375 | |||||
| TOTAL OPEN FOREIGN CURRENCY PURCHASE
CONTRACTS |
$65,548,228 | $64,026,038 | $6,538 | $1,528,728 | |||||
| 4. PORTFOLIO SECURITIES TRANSACTIONS (continued)
|
| Open Forward Foreign Currency | Value on
Settlement Date |
Current Value | Unrealized |
||||||
|---|---|---|---|---|---|---|---|---|---|
| Sale Contracts | Gain | Loss | |||||||
| Euro | |||||||||
| expiring 9/14/2000 | $ 547,073 | $ 509,121 | $ 37,952 | $ — | |||||
| Hong Kong Dollar | |||||||||
| expiring 12/8/2000 | 25,903,974 | 25,912,802 | — | 8,828 | |||||
| Japanese Yen | |||||||||
| expiring 11/17/2000 | 2,714,365 | 2,744,178 | — | 29,813 | |||||
| Swedish Krona | |||||||||
| expiring 10/13/2000 | 27,351,540 | 26,711,268 | 640,272 | — | |||||
| Swiss Franc | |||||||||
| expiring 11/20/2000 | 18,552,168 | 18,232,414 | 319,754 | — | |||||
| TOTAL OPEN FORWARD FOREIGN CURRENCY
SALE CONTRACTS |
$ 75,069,120 | $ 74,109,783 | $997,978 | $ 38,641 | |||||
| Closed but Unsettled | Purchase
Value |
Sale Value | Realized |
||||||
| Forward Foreign Currency Contracts | Gain | Loss | |||||||
| Euro | |||||||||
| expiring 9/14/2000 | $ 11,355,176 | $ 11,292,566 | $ — | $ 62,610 | |||||
| expiring 9/14/2000 | 10,883,308 | 10,811,422 | — | 71,886 | |||||
| expiring 9/14/2000 | 523,596 | 528,388 | 4,792 | — | |||||
| expiring 9/14/2000 | 10,713,362 | 10,832,611 | 119,249 | — | |||||
| expiring 10/13/2000 | 7,467,657 | 7,288,874 | — | 178,783 | |||||
| expiring 10/13/2000 | 642,005 | 637,046 | — | 4,959 | |||||
| expiring 10/13/2000 | 19,324,411 | 19,181,671 | — | 142,740 | |||||
| expiring 10/13/2000 | 14,013,271 | 13,971,080 | — | 42,191 | |||||
| expiring 10/13/2000 | 2,688,391 | 2,715,329 | 26,938 | — | |||||
| expiring 10/13/2000 | 2,766,811 | 2,895,863 | 129,052 | — | |||||
| Great British Pound | |||||||||
| expiring 9/14/2000 | 11,292,566 | 11,215,363 | — | 77,203 | |||||
| expiring 9/14/2000 | 11,267,987 | 11,215,362 | — | 52,625 | |||||
| expiring 9/14/2000 | 71,823 | 71,428 | — | 395 | |||||
| expiring 9/14/2000 | 11,248,496 | 11,165,530 | — | 82,966 | |||||
| expiring 9/14/2000 | 256,886 | 253,017 | — | 3,869 | |||||
| expiring 9/14/2000 | 11,379,685 | 11,240,972 | — | 138,713 | |||||
| expiring 9/14/2000 | 10,910,859 | 10,744,495 | — | 166,364 | |||||
| Japanese Yen | |||||||||
| expiring 10/20/2000 | 22,450,461 | 22,716,000 | 265,539 | — | |||||
| expiring 11/17/2000 | 7,742,000 | 7,869,715 | 127,715 | — | |||||
| Hong Kong Dollar | |||||||||
| expiring 12/8/2000 | 2,192,214 | 2,191,061 | — | 1,153 | |||||
| TOTAL CLOSED BUT UNSETTLED FORWARD
FOREIGN CURRENCY CONTRACTS |
$169,190,965 | $168,837,793 | $673,285 | $1,026,457 | |||||
| 4. PORTFOLIO SECURITIES TRANSACTIONS (continued)
|
| The contractual amounts of forward foreign currency exchange contracts do not necessarily represent the amounts potentially
subject to risk. The measurement of the risks associated with these instruments is meaningful only when all related and offsetting transactions are considered. At August 31, 2000, the Fund had sufficient cash and securities to cover any commitments under
these contracts.
|
| Futures Contracts — The Fund may enter into futures
transactions to hedge against changes in interest rates, securities prices, currency exchange rates or to seek to increase total return. Upon entering into a futures contract, the Fund is required to deposit with a broker or the Fund’s custodian
bank, an amount of cash or securities equal to the minimum “initial margin” requirement of the associated futures exchange. Subsequent payments for futures contracts (“variation margin”) are paid or received by the Fund, depending on
the fluctuations in the value of the contracts, and are recorded for financial reporting purposes as unrealized gains or losses. When contracts are closed, the Fund realizes a gain or loss which is reported in the Statement of Operations.
|
| The use of futures contracts involve, to varying degrees, elements of market and
counterparty risk which may exceed the amounts recognized in the Statement of Assets and Liabilities. Changes in the value of the futures contracts may not directly correlate with changes in the value of the underlying securities. This risk may decrease
the effectiveness of the Fund’s hedging strategies and potentially result in a loss.
|
| At August 31, 2000, open futures contracts were as follows:
|
| Type | Number of Contracts
Long |
Settlement
Month |
Market Value | Unrealized
Loss |
|||||
|---|---|---|---|---|---|---|---|---|---|
| Dow Jones Euro Stoxx 50 | 925 | September 2000 | $42,487,281 | $32,891 | |||||
| Option Accounting Principles — When the Fund writes
call or put options, an amount equal to the premium received is recorded as an asset and as an equivalent liability. The amount of the liability is subsequently marked-to-market to reflect the current market value of the option written. When a written
option expires on its stipulated expiration date or the Fund enters into a closing purchase transaction, the Fund realizes a gain or loss without regard to any unrealized gain or loss on the underlying security, and the liability related to such option is
extinguished. When a written call option is exercised, the Fund realizes a gain or loss from the sale of the underlying security, and the proceeds of the sale are increased by the premium originally received. When a written put option is exercised, the
amount of the premium originally received will reduce the cost of the security which the Fund purchases upon exercise. There is a risk of loss from a change in value of such options which may exceed the related premiums received.
|
| Upon the purchase of a call option or a protective put option by the Fund, the
premium paid is recorded as an investment and subsequently marked-to-market to reflect the current market value of the option. If an option which the Fund has purchased expires on the stipulated expiration date, the Fund will realize a loss in the amount
of the cost of the option. If the Fund enters into a closing sale transaction, the Fund will realize a gain or loss, depending on whether the sale proceeds for the closing sale transaction are greater or less than the cost of the option. If the Fund
exercises a purchased put option, the Fund will realize a gain or loss from the sale of the underlying security, and the proceeds from such sale will be decreased by the premium originally paid. If the Fund exercises a purchased call option, the cost of
the security which the Fund purchases upon exercise will be increased by the premium originally paid. At August 31, 2000, there were no open written option contracts.
|
| 5. LINE OF CREDIT FACILITY
|
| Effective May 31, 2000, the Fund participates in a $350,000,000 committed, unsecured revolving line of credit facility. Prior
thereto, the Fund participated in a $250,000,000 uncommitted and a $250,000,000 committed, unsecured revolving line of credit facility. Under the most restrictive arrangement, the Fund must own securities having a market value in excess of 400% of the
total bank borrowings. This facility is to be used solely for temporary or emergency purposes. The interest rate on borrowings is based on the Federal Funds rate. The committed facility also requires a fee to be paid by the Fund based on the amount of the
commitment. During the year ended August 31, 2000, the Fund did not have any borrowings under any of these facilities.
|
| 6. CHANGE IN INDEPENDENT ACCOUNTANTS
|
| On October 26, 1999 the Board of Trustees of the Fund, upon the recommendation of the Board’s audit committee, determined not
to retain Arthur Andersen LLP and approved a change of the Fund’s independent accountants to PricewaterhouseCoopers LLP. For the period ended August 31, 1999 and the year ended January 31, 1999, Arthur Andersen LLP’s audit reports contained no
adverse opinion or disclaimer of opinion; nor were their reports qualified or modified as to uncertainty, audit scope, or accounting principles. Further, there were no disagreements between the Fund and Arthur Andersen LLP on accounting principles or
practices, financial statement disclosure or audit scope or procedure, which if not resolved to the satisfaction of Arthur Andersen LLP would have caused them to make reference to the disagreement in their report.
|
| 7. CERTAIN RECLASSIFICATIONS
|
| In accordance with AICPA Statement of Position 93-2, the Fund reclassified $4,193,340 from accumulated net realized gain on
investment, futures and foreign currency related transactions to accumulated distributions in excess of net investment loss and $89,055 from paid-in capital to accumulated distributions in excess of net investment loss. These reclassifications have no
impact on the net asset value of the Fund and are designed to present the Fund’s capital accounts on a tax basis. Reclassifications result primarily from the difference in the tax treatment of foreign currency, net operating losses and organization
costs.
|
| Goldman Sachs International Equity Fund — Tax Information (unaudited)
|
| For the distribution
paid during the year ended August 31, 2000, the total amount of income received by the International Equity Fund from sources within foreign countries and possessions of the United States was $0.2593 per share all of which is attributable to qualified
passive income. The total amount of taxes paid by the Fund to such countries was $0.0311 per share. A separate notice containing the country by country components of these totals has been previously mailed to the shareholders.
|
| Pursuant to Section
852 of the Internal Revenue Code, the Fund designated $116,956,804 as capital gains dividends paid during its year ended August 31, 2000.
|
| 8. SUMMARY OF SHARE TRANSACTIONS
|
| Share activity for:
|
| For the Year
Ended August 31, 2000 |
For the Seven Months
Ended August 31, 1999 |
For the Year Ended
January 31, 1999 |
|||||||||||||||||||||||
|---|---|---|---|---|---|---|---|---|---|---|---|---|---|---|---|---|---|---|---|---|---|---|---|---|---|
| Shares | Dollars | Shares | Dollars | Shares | Dollars | ||||||||||||||||||||
| Class A Shares | |||||||||||||||||||||||||
| Shares sold | 29,637,438 | $727,913,986 | 40,503,629 | $878,896,664 | 90,785,418 | $ 1,949,815,404 | |||||||||||||||||||
| Reinvestments of
dividends and distributions |
4,008,202 | 93,992,338 | — | — | 1,669,818 | 34,480,481 | |||||||||||||||||||
| Shares repurchased | (17,502,173 | ) | (431,597,850 | ) | (42,925,516 | ) | (937,796,470 | ) | (84,367,795 | ) | (1,819,683,956) | ||||||||||||||
| 16,143,467 | 390,308,474 | (2,421,887 | ) | (58,899,806 | ) | 8,087,441 | 164,611,929 | ||||||||||||||||||
| Class B Shares | |||||||||||||||||||||||||
| Shares sold | 596,787 | 14,423,566 | 231,545 | 5,004,374 | 794,593 | 17,488,784 | |||||||||||||||||||
| Reinvestments of dividends and
distributions |
335,760 | 7,745,988 | — | — | 156,073 | 3,180,373 | |||||||||||||||||||
| Shares repurchased | (484,425 | ) | (11,699,142 | ) | (410,880 | ) | (8,878,625 | ) | (557,697 | ) | (11,834,003) | ||||||||||||||
| 448,122 | 10,470,412 | (179,335 | ) | (3,874,251 | ) | 392,969 | 8,835,154 | ||||||||||||||||||
| Class C Shares | |||||||||||||||||||||||||
| Shares sold | 1,503,847 | 35,487,591 | 3,386,747 | 71,812,024 | 6,644,608 | 139,922,460 | |||||||||||||||||||
| Reinvestments of dividends and
distributions |
52,340 | 1,194,420 | — | — | 19,517 | 394,623 | |||||||||||||||||||
| Shares repurchased | (1,092,313 | ) | (25,780,443 | ) | (3,429,722 | ) | (73,325,070 | ) | (6,294,716 | ) | (133,220,855) | ||||||||||||||
| 463,874 | 10,901,568 | (42,975 | ) | (1,513,046 | ) | 369,409 | 7,096,228 | ||||||||||||||||||
| Institutional Shares | |||||||||||||||||||||||||
| Shares sold | 7,389,250 | 183,681,326 | 3,229,820 | 73,161,867 | 2,805,737 | 62,386,145 | |||||||||||||||||||
| Reinvestments of dividends and
distributions |
763,388 | 18,168,651 | — | — | 131,238 | 2,741,464 | |||||||||||||||||||
| Shares repurchased | (2,327,895 | ) | (58,028,723 | ) | (556,938 | ) | (12,395,514 | ) | (740,110 | ) | (16,145,728) | ||||||||||||||
| 5,824,743 | 143,821,254 | 2,672,882 | 60,766,353 | 2,196,865 | 48,981,881 | ||||||||||||||||||||
| Service Shares | |||||||||||||||||||||||||
| Shares sold | 55,114 | 1,364,614 | 23,838 | 517,017 | 78,227 | 1,765,950 | |||||||||||||||||||
| Reinvestments of dividends and
distributions |
19,583 | 459,612 | — | — | 8,677 | 179,257 | |||||||||||||||||||
| Shares repurchased | (80,974 | ) | (1,992,354 | ) | (20,037 | ) | (436,802 | ) | (77,199 | ) | (1,698,555) | ||||||||||||||
| (6,277 | ) | (168,128 | ) | 3,801 | 80,215 | 9,705 | 246,652 | ||||||||||||||||||
| NET INCREASE (DECREASE) | 22,873,929 | $555,333,580 | 32,486 | $ (3,440,535 | ) | 11,056,389 | $ 229,771,844 | ||||||||||||||||||
| Income from
investment operations |
Distributions to shareholders |
||||||||||||||||||||||
|---|---|---|---|---|---|---|---|---|---|---|---|---|---|---|---|---|---|---|---|---|---|---|---|
|
Net asset value, beginning of period |
Net
investment income (loss) |
Net realized
and unrealized gain (loss) |
Total from
Investment Operations |
From net
investment income |
In excess
of net investment income |
From net
realized gains |
Total
Distributions |
||||||||||||||||
| FOR THE YEAR ENDED AUGUST 31, | |||||||||||||||||||||||
| 2000 - Class A Shares | $23.12 | $(0.03 | ) (c) | $3.41 | $3.38 | $(0.10 | ) | $(0.24) | $(2.57 | ) | $(2.91 | ) | |||||||||||
| 2000 - Class B Shares | 22.73 | (0.16 | ) (c) | 3.38 | 3.22 | (0.07 | ) | (0.17) | (2.57 | ) | (2.81 | ) | |||||||||||
| 2000 - Class C Shares | 22.54 | (0.14 | ) (c) | 3.35 | 3.21 | (0.09 | ) | (0.20) | (2.57 | ) | (2.86 | ) | |||||||||||
| 2000 - Institutional Shares | 23.49 | 0.14 | (c) | 3.46 | 3.60 | (0.14 | ) | (0.32) | (2.57 | ) | (3.03 | ) | |||||||||||
| 2000 - Service Shares | 23.14 | (0.01 | ) (c) | 3.45 | 3.44 | (0.11 | ) | (0.25) | (2.57 | ) | (2.93 | ) | |||||||||||
| FOR THE SEVEN MONTHS ENDED AUGUST 31, | |||||||||||||||||||||||
| 1999 - Class A Shares | 21.92 | 0.04 | 1.16 | 1.20 | — | — | — | — | |||||||||||||||
| 1999 - Class B Shares | 21.63 | (0.02 | ) | 1.12 | 1.10 | — | — | — | — | ||||||||||||||
| 1999 - Class C Shares | 21.45 | (0.03 | ) | 1.12 | 1.09 | — | — | — | — | ||||||||||||||
| 1999 - Institutional Shares | 22.20 | 0.12 | (c) | 1.17 | (c) | 1.29 | — | — | — | — | |||||||||||||
| 1999 - Service Shares | 21.93 | 0.06 | 1.15 | 1.21 | — | — | — | — | |||||||||||||||
| FOR THE YEARS ENDED JANUARY 31, | |||||||||||||||||||||||
| 1999 - Class A Shares | 19.85 | (0.06 | ) | 3.24 | 3.18 | — | — | (1.11 | ) | (1.11 | ) | ||||||||||||
| 1999 - Class B Shares | 19.70 | (0.17 | ) | 3.21 | 3.04 | — | — | (1.11 | ) | (1.11 | ) | ||||||||||||
| 1999 - Class C Shares | 19.56 | (0.15 | ) | 3.15 | 3.00 | — | — | (1.11 | ) | (1.11 | ) | ||||||||||||
| 1999 - Institutional Shares | 19.97 | 0.03 | 3.31 | 3.34 | — | — | (1.11 | ) | (1.11 | ) | |||||||||||||
| 1999 - Service Shares | 19.84 | (0.04 | ) | 3.24 | 3.20 | — | — | (1.11 | ) | (1.11 | ) | ||||||||||||
| |
|||||||||||||||||||||||
| 1998 - Class A Shares | 19.32 | 0.03 | 2.04 | 2.07 | — | (0.30 | ) | (1.24 | ) | (1.54 | ) | ||||||||||||
| 1998 - Class B Shares | 19.24 | (0.08 | ) | 2.02 | 1.94 | — | (0.25 | ) | (1.23 | ) | (1.48 | ) | |||||||||||
| 1998 - Class C Shares (commenced August 15,
1997) |
22.60 | (0.04 | ) | (1.38 | ) | (1.42 | ) | — | (0.38 | ) | (1.24 | ) | (1.62 | ) | |||||||||
| 1998 - Institutional Shares | 19.40 | 0.10 | 2.11 | 2.21 | (0.07 | ) | (0.33 | ) | (1.24 | ) | (1.64 | ) | |||||||||||
| 1998 - Service Shares | 19.34 | 0.02 | 2.06 | 2.08 | — | (0.35 | ) | (1.23 | ) | (1.58 | ) | ||||||||||||
| |
|||||||||||||||||||||||
| 1997 - Class A Shares | 17.20 | 0.10 | 2.23 | 2.33 | — | — | (0.21 | ) | (0.21 | ) | |||||||||||||
| 1997 - Class B Shares (commenced May 1, 1996) | 18.91 | (0.06 | ) | 0.60 | 0.54 | — | — | (0.21 | ) | (0.21 | ) | ||||||||||||
| 1997 - Institutional Shares (commenced February 7,
1996) |
17.45 | 0.04 | 2.15 | 2.19 | (0.03 | ) | — | (0.21 | ) | (0.24 | ) | ||||||||||||
| 1997 - Service Shares (commenced March 6, 1996) | 17.70 | (0.02 | ) | 1.87 | 1.85 | — | — | (0.21 | ) | (0.21 | ) | ||||||||||||
| |
|||||||||||||||||||||||
| 1996 - Class A Shares | 14.52 | 0.13 | 4.00 | 4.13 | (0.58 | ) | — | (0.87 | ) | (1.45 | ) | ||||||||||||
| |
|||||||||||||||||||||||
(a)
|
Assumes investment at the net asset value at the beginning of the period, reinvestment of all dividends and distributions, a
complete redemption of the investment at the net asset value at the end of the period and no sales or redemption charges. Total return would be reduced if a sales or redemption charge were taken into account. Total returns for periods less than one full
year are not annualized.
|
(b)
|
Annualized.
|
(c)
|
Calculated based on the average shares outstanding methodology.
|
| Ratios assuming no expense
reductions |
|||||||||||||||||||||||
|---|---|---|---|---|---|---|---|---|---|---|---|---|---|---|---|---|---|---|---|---|---|---|---|
| Net asset
value, end of period |
Total
return (a) |
Net assets
at end of period (in 000s) |
Ratio of
net expenses to average net assets |
Ratio of
net investment income (loss) to average net assets |
Ratio of
expenses to average net assets |
Ratio of
net investment income (loss) to average net assets |
Portfolio
turnover rate |
||||||||||||||||
| $23.59 | 14.68 | % | $1,343,869 | 1.79 | % | (0.12 | )% | 1.84 | % | (0.17 | )% | 79.79 | % | ||||||||||
| 23.14 | 14.20 | 80,274 | 2.29 | (0.65 | ) | 2.34 | (0.70 | ) | 79.79 | ||||||||||||||
| 22.89 | 14.28 | 22,031 | 2.29 | (0.59 | ) | 2.34 | (0.64 | ) | 79.79 | ||||||||||||||
| 24.06 | 15.45 | 325,161 | 1.14 | 0.54 | 1.19 | 0.49 | 79.79 | ||||||||||||||||
| 23.65 | 15.00 | 3,789 | 1.64 | (0.02 | ) | 1.69 | (0.07 | ) | 79.79 | ||||||||||||||
| 23.12 | 5.47 | 943,473 | 1.79 | (b) | 0.31 | (b) | 1.84 | (b) | 0.26 | (b) | 61.10 | ||||||||||||
| 22.73 | 5.09 | 68,691 | 2.29 | (b) | (0.19 | ) (b) | 2.34 | (b) | (0.24 | ) (b) | 61.10 | ||||||||||||
| 22.54 | 5.08 | 11,241 | 2.29 | (b) | (0.26 | ) (b) | 2.34 | (b) | (0.31 | ) (b) | 61.10 | ||||||||||||
| 23.49 | 5.81 | 180,564 | 1.14 | (b) | 0.89 | (b) | 1.19 | (b) | 0.84 | (b) | 61.10 | ||||||||||||
| 23.14 | 5.52 | 3,852 | 1.64 | (b) | 0.47 | (b) | 1.69 | (b) | 0.42 | (b) | 61.10 | ||||||||||||
| 21.92 | 16.39 | 947,973 | 1.73 | (0.28 | ) | 1.82 | (0.37 | ) | 113.79 | ||||||||||||||
| 21.63 | 15.80 | 69,231 | 2.24 | (0.79 | ) | 2.32 | (0.87 | ) | 113.79 | ||||||||||||||
| 21.45 | 15.70 | 11,619 | 2.24 | (0.98 | ) | 2.32 | (1.06 | ) | 113.79 | ||||||||||||||
| 22.20 | 17.09 | 111,315 | 1.13 | 0.23 | 1.21 | 0.15 | 113.79 | ||||||||||||||||
| 21.93 | 16.49 | 3,568 | 1.63 | (0.18 | ) | 1.71 | (0.26 | ) | 113.79 | ||||||||||||||
| 19.85 | 11.12 | 697,590 | 1.67 | (0.27 | ) | 1.80 | (0.40 | ) | 40.82 | ||||||||||||||
| 19.70 | 10.51 | 55,324 | 2.20 | (0.90 | ) | 2.30 | (1.00 | ) | 40.82 | ||||||||||||||
| 19.56 | (5.92 | ) | 3,369 | 2.27 | (b) | (1.43 | ) (b) | 2.37 | (b) | (1.53 | ) (b) | 40.82 | |||||||||||
| 19.97 | 11.82 | 56,263 | 1.08 | 0.30 | 1.18 | 0.20 | 40.82 | ||||||||||||||||
| 19.84 | 11.25 | 3,035 | 1.55 | (0.36 | ) | 1.65 | (0.46 | ) | 40.82 | ||||||||||||||
| 19.32 | 13.48 | 536,283 | 1.69 | (0.07 | ) | 1.88 | (0.26 | ) | 38.01 | ||||||||||||||
| 19.24 | 2.83 | 19,198 | 2.23 | (b) | (0.97 | ) (b) | 2.38 | (b) | (1.12 | ) (b) | 38.01 | ||||||||||||
| 19.40 | 12.53 | 68,374 | 1.10 | (b) | 0.43 | (b) | 1.25 | (b) | 0.28 | (b) | 38.01 | ||||||||||||
| 19.34 | 10.42 | 674 | 1.60 | (b) | (0.40 | ) (b) | 1.75 | (b) | (0.55 | ) (b) | 38.01 | ||||||||||||
| 17.20 | 28.68 | 330,860 | 1.52 | 0.26 | 1.77 | 0.01 | 68.48 | ||||||||||||||||
| To the Shareholders and Board of Trustees of
|
| Goldman Sachs Trust — International Equity Fund:
|
| In our opinion, the accompanying statement of assets and liabilities, including the statement of investments, and the related
statements of operations and of changes in net assets and the financial highlights present fairly, in all material respects, the financial position of Goldman Sachs International Equity Fund (“the Fund”), one of the portfolios constituting
Goldman Sachs Trust, at August 31, 2000, the results of its operations, the changes in its net assets and the financial highlights for the year then ended, in conformity with accounting principles generally accepted in the United States of America. These
financial statements and financial highlights (hereafter referred to as “financial statements”) are the responsibility of the Fund’s management; our responsibility is to express an opinion on these financial statements based on our audit.
We conducted our audit of these financial statements in accordance with auditing standards generally accepted in the United States of America, which require that we plan and perform the audit to obtain reasonable assurance about whether the financial
statements are free of material misstatement. An audit includes examining, on a test basis, evidence supporting the amounts and disclosures in the financial statements, assessing the accounting principles used and significant estimates made by management,
and evaluating the overall financial statement presentation. We believe that our audit, which included confirmation of securities at August 31, 2000 by correspondence with the custodian and brokers, provides a reasonable basis for our opinion. The
statements of changes in net assets of the Fund for the period ended August 31, 1999 and the year ended January 31, 1999 and the financial highlights for each of the periods ended on or before August 31, 1999 were audited by other independent accountants
whose report dated October 8, 1999 expressed an unqualified opinion thereon.
|
| PricewaterhouseCoopers LLP
|
| Boston, Massachusetts
|
| October 23, 2000
|
GOLDMAN SACHS FUND PROFILE
Goldman Sachs International Equity Fund
An Investment Idea for the Long Term
History has shown that a long-term plan that includes international stocks can help provide greater protection against market volatility over time than a portfolio that invests only in U.S. stocks.
Goldman Sachs International Equity Fund offers investors access to the benefits associated with international market diversification. The Fund seeks long-term capital growth, primarily through equity securities of companies that are organized outside the United States or whose securities are principally traded outside the United States.
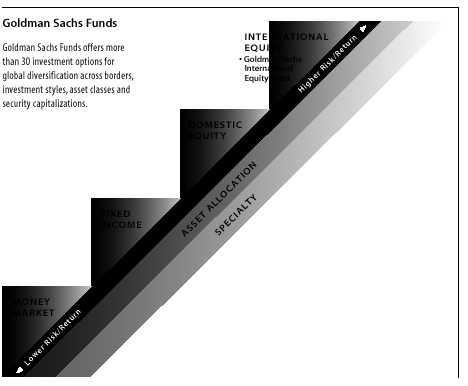
Target Your Needs
The Goldman Sachs International Equity Fund has a distinct investment objective and a defined place on the risk/return spectrum. As your investment objectives change, you can exchange shares within Goldman Sachs Funds without any additional charge.* (Please note: in general, greater returns are associated with greater risk.)
For More Information
To learn more about the Goldman Sachs International Equity Fund and other Goldman Sachs Funds, call your investment professional today.
*The exchange privilege is subject to termination and its terms are subject to change.
|
|