
|
|
|
|
|
|
|
|
|
|
Previous: GOLDMAN SACHS TRUST, N-30D, 2000-11-08 |
Next: OPPENHEIMER MAIN STREET FUNDS INC, N-30D, 2000-11-08 |
Goldman Sachs Funds
G O L D M A N S A C H S E U R O P E A N E Q U I T Y F U N D
Market Overview
Dear Shareholder:
After a strong start, European equities generated lackluster results over the past year, due to a correction in the technology sector and contrasting country-specific fundamentals.
As always, we appreciate your support and we look forward to serving your investment needs in the years to come.
| Sincerely, | |||
 |
 |
||
| David B. Ford
Co-Head, Goldman Sachs Asset Management |
David W. Blood
Co-Head, Goldman Sachs Asset Management |
||
| September 15, 2000 | |||
G O L D M A N S A C H S E U R O P E A N E Q U I T Y F U N D
Fund Basics
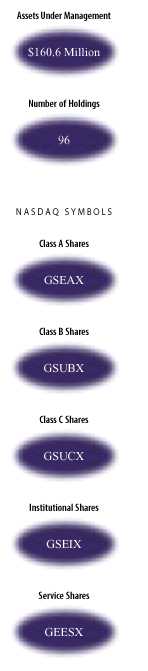
as of August 31, 2000
| PERFORMANCE REVIEW | |||||||||||||
| August 31, 1999– | Fund Total Return
(without sales charge)1 |
MSCI
Europe Index2 |
FT/S&P Actuaries
European Index2 |
||||||||||
| August 31, 2000 | |||||||||||||
| |
|||||||||||||
| Class A | 24.04 | % | 10.07 | % | 8.59 | % | |||||||
| Class B | 23.32 | 10.07 | 8.59 | ||||||||||
| Class C | 23.48 | 10.07 | 8.59 | ||||||||||
| Institutional | 24.85 | 10.07 | 8.59 | ||||||||||
| Service | 24.28 | 10.07 | 8.59 | ||||||||||
| |
|||||||||||||
1 The net asset value represents the net assets of the Fund (ex-dividend) divided by the total number of shares. The Fund’s performance assumes the reinvestment of dividends and other distributions.
2 The Morgan Stanley Capital International (MSCI) Europe Index, an unmanaged index of common stock prices, replaces the FT/S&P Actuaries Europe Index (unhedged) as of 11/30/99 as the European Equity Fund’s performance benchmark. The MSCI Europe Index is widely used throughout the investment management industry to represent the investment opportunities available to a large cap, developed country European equity strategy and, in the Investment Advisor’s opinion, is a more appropriate benchmark against which to measure the performance of the European Equity Fund. The Index figures do not reflect any fees or expenses. The unmanaged FT/S&P Actuaries Europe Index (unhedged) is a market cap italization-weighted composite of approximately 750 stocks from 16 countries in Europe. The Index figures do not reflect any fees or expenses.
| STANDARDIZED TOTAL RETURNS3 | ||||||||||
| For the period ended 6/30/00 | Class A | Class B | Class C | Institutional | Service | |||||
| |
||||||||||
| One Year | 22.29% | 23.50% | 27.77% | 30.21% | 29.74% | |||||
| Since inception | 21.56 | 22.95 | 25.09 | 26.37 | 25.73 | |||||
| (10/1/98) | ||||||||||
| |
||||||||||
|
3 The Standardized Total Returns are average annual total returns or cumulative total returns (only if the performance period is one year or less) as of the most recent calendar quarter-end. They assume reinvestment of all distributions at net asset value. These returns reflect a maximum initial sales charge of 5.5% for Class A shares, the assumed deferred sales charge for Class B shares (5% maximum declining to 0% after six years) and the assumed deferred sales charge for Class C shares (1% if redeemed within 12 months of purchase). Because Institutional and Service shares do not involve a sales charge, such a charge is not applied to their Standardized Total Returns. |
||||
|
Total return figures represent past performance and do not indicate future results, which will vary. The investment return and principal value of an investment will fluctuate and, therefore, an investor’s shares, when redeemed, may be worth more or less than their original cost. Performance reflects expense limitations in effect. In its absence, performance would be reduced. |
||||
| TOP 10 HOLDINGS AS OF 8/31/00 | ||||
| Holding | % of Total Net Assets | Line of Business | ||
| |
||||
| Vodafone AirTouch PLC | 4.4% | Telecommunications | ||
| Nokia Oyj | 3.8 | Telecommunications | ||
| Telefonaktiebolaget LM Ericsson AB Series B | 3.1 | Telecommunications | ||
| Royal Dutch Petroleum Co. | 2.4 | Energy Resources | ||
| BP Amoco PLC | 2.2 | Energy Resources | ||
| Telefonica de Espana SA | 2.1 | Telecommunications | ||
| SmithKline Beecham PLC | 2.0 | Health | ||
| Koninklijke Royal Phillips Electronics NV | 1.9 | Appliance | ||
| Glaxo Wellcome PLC | 1.9 | Health | ||
| ING Groep NV | 1.9 | Financial Services | ||
| |
||||
| The top 10 holdings may not be representative of the Fund’s future investments. | ||||
G O L D M A N S A C H S E U R O P E A N E Q U I T Y F U N D
Performance Overview
Dear Shareholder,
We are pleased to report on the performance of the Goldman Sachs European Equity Fund for the one year period that ended August 31, 2000.
Performance Review
Over the one-year period that ended August 31, 2000, the Fund’s Class A, B, C, Institutional and Service share classes generated cumulative total returns, without sales charges, of 24.04%, 23.32%, 23.48%, 24.85%, and 24.28%, respectively. These returns compare very favourably to the Fund’s benchmark, the MSCI Europe Index, which generated a cumulative total return of 10.07%
The Fund’s strong absolute and relative performance was largely due to astute regional allocations and stock selection.
Portfolio Composition
Thematically, our positioning in the European Equity Fund has remained broadly consistent over the past months, with a continued emphasis on ‘long duration’ assets — typically with visible growth prospects, enduring franchises and strong relative pricing power. The Fund’s core positions, an overweight in media, mobile telecommunications, pharmaceuticals and consumer staples, and an underweight in capital goods and basic materials, remain in place.
As always, stock selection continues to drive our positioning. Our overweighting of technology, media and telecom (TMT) sectors continued throughout the period. We’ve focussed on market leaders, such as Ericsson, Vodafone and ASM Lithography, whose strong market positions give them competitive advantage in innovation, which can be self-sustaining if properly managed. The same is true in the pharmaceutical sector, where our largest holding is Glaxo Wellcome. The firm is in the process of merging with Smithkline Beecham to create an industry powerhouse capable of leveraging a vast research and development budget.
Portfolio Highlights
GOLDMAN SACHS EUROPEAN EQUITY FUND
 Skandia Forsakring —
Swedish insurance group Skandia’s predominant value driver is its AFS unit-linked business, through which the group is the third largest provider of variable annuities in the U.S. Strong share price performance has been propelled by outstanding
results and record inflows into mutual funds in the U.S. We consider Skandia to be a core financial holding in the portfolio.
Skandia Forsakring —
Swedish insurance group Skandia’s predominant value driver is its AFS unit-linked business, through which the group is the third largest provider of variable annuities in the U.S. Strong share price performance has been propelled by outstanding
results and record inflows into mutual funds in the U.S. We consider Skandia to be a core financial holding in the portfolio.
Portfolio Outlook
Positive underlying fundamentals continue to drive our outlook for Continental Europe. Some of the key structural trends we’re focusing on includes the maturing, and hence increased exposure to equities, of the savings and pensions industry, and the evolution of the region from a series of parochial national market places to a single pan-European market.
We are now seeing the beneficial influence of both trends on current forecasts. For example, European financial service company earnings are typically being boosted by strong mutual fund demand. In addition, the creation of a single European market is a key catalyst behind the continuing high level of merger and acquisition activity in the region.
The current business climate in the region is also positive, with the strength of recent upgrades to corporate earnings expectations being matched by only two other periods over the past 15 years. Margins are being helped by strong pricing power. In fact, a recent industrial survey shows selling price expectations to be at their highest level since 1995. The caveat, however, is that this is partly a function of capacity utilisation rates, which are at a ten year high, and strong commodity price levels. Both of these factors could put upward pressure on inflation, particularly if productivity improvements are not delivered on an industry level.
We thank you for your investment and look forward to your continued confidence.
Goldman Sachs European Equity Investment Team
London
September 15, 2000
G O L D M A N S A C H S E U R O P E A N E Q U I T Y F U N D
The Goldman Sachs Advantage
Founded in 1869, Goldman, Sachs & Co. is a premier financial services firm traditionally known on Wall Street and around the world for its institutional expertise.
Today, the firm’s Investment Management Division provides individual investors the opportunity to tap the resources of a global institutional powerhouse — and put this expertise to work in their individual portfolios .
What Sets Goldman Sachs Funds Apart?

To learn more about the Goldman Sachs Funds, call your investment professional today.
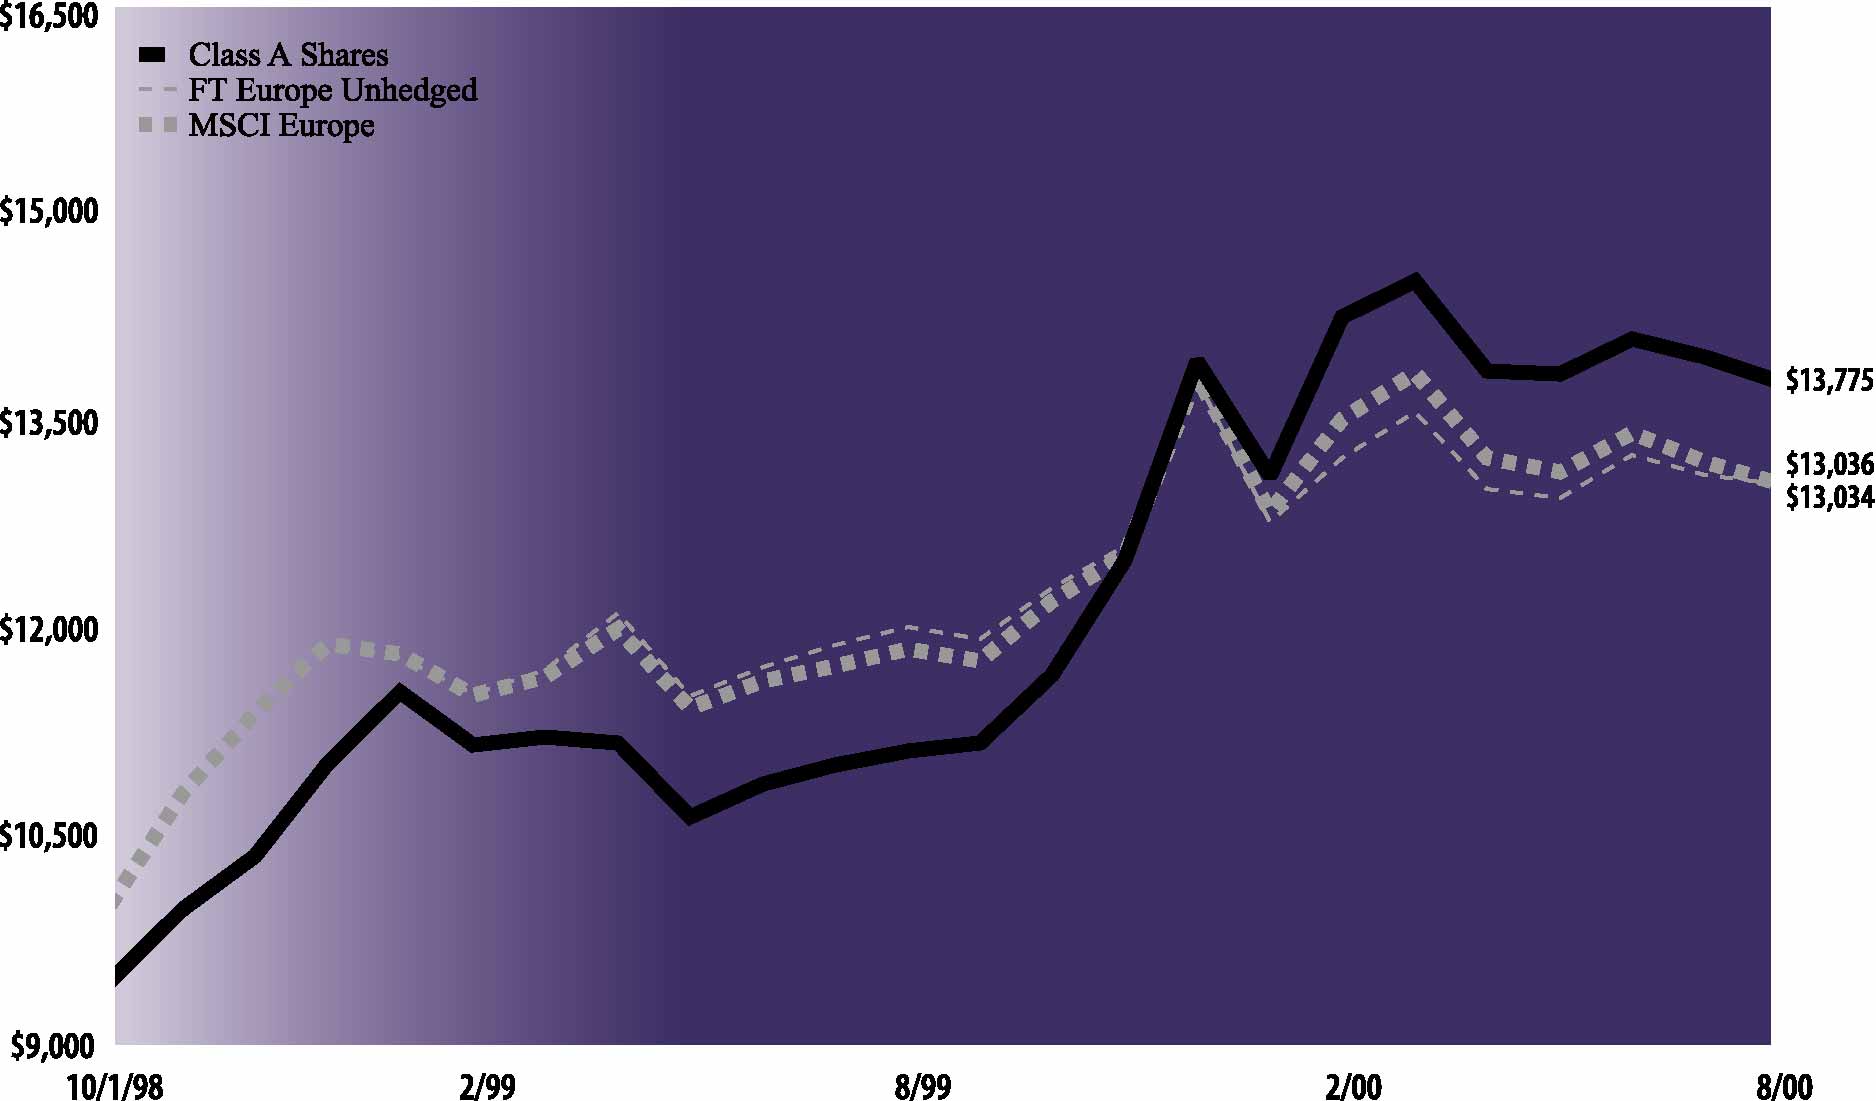
| The following graph shows the value as of August 31, 2000, of a $10,000 investment made on October 1, 1998 (commencement of
operations) in Class A Shares (maximum sales charge of 5.5%) of the Goldman Sachs European Equity Fund. For comparative purposes, the performance of the Fund’s new benchmark (Morgan Stanley Capital International (MSCI) Europe Index (MSCI Europe)) as
of November 30, 1999 and the Fund’s previous benchmark (FT/S&P Europe Unhedged) are shown. This performance data represents past performance and should not be considered indicative of future performance which will fluctuate with changes in market
conditions. These performance fluctuations will cause an investor’s shares, when redeemed, to be worth more or less than their original cost. Performance of Class B, Class C, Institutional and Service Shares will vary from Class A due to differences
in fees and loads.
|
| European Equity Fund’s Lifetime Performance
|
| Growth of a $10,000 Investment, Distributions Reinvested October 1, 1998 to August 31, 2000
|
 |
| Average Annual Total Return through August 31, 2000 (a) | Since Inception | One Year | |||||
|---|---|---|---|---|---|---|---|
| Class A | |||||||
| Excluding sales charges | 21.67 | % | 24.04 | % | |||
| Including sales charges | 18.15 | % | 17.25 | % | |||
| Class B | |||||||
| Excluding contingent deferred sales charges | 21.09 | % | 23.32 | % | |||
| Including contingent deferred sales charges | 19.23 | % | 18.05 | % | |||
| Class C | |||||||
| Excluding contingent deferred sales charges | 21.22 | % | 23.48 | % | |||
| Including contingent deferred sales charges | 21.22 | % | 22.42 | % | |||
| Institutional | 22.46 | % | 24.85 | % | |||
| Service | 21.84 | % | 24.28 | % | |||
(a)
|
Commencement date of operations was October 1, 1998 for all share classes.
|
|
Shares |
Description | Value | |||
|---|---|---|---|---|---|
| Common Stocks – 92.1% | |||||
| Canada – 0.3% | |||||
| 8,000 | The Seagram Co. Ltd. (Entertainment) | $ 481,500 | |||
| Denmark – 0.5% | |||||
| 5,114 | Group 4 Falck A/S (Electrical
Equipment) |
800,880 | |||
| Finland – 4.2% | |||||
| 139,794 | Nokia Oyj (Telecommunications) | 6,126,923 | |||
| 17,406 | Sonera Oyj (Telecommunications) | 581,002 | |||
| 6,707,925 | |||||
| France – 13.7% | |||||
| 17,161 | Accor SA (Hotels) | 738,882 | |||
| 10,021 | Air Liquide SA (Chemicals) | 1,276,597 | |||
| 33,973 | Alcatel (Telecommunications) | 2,776,185 | |||
| 30,817 | Alstom (Electrical Equipment) | 690,784 | |||
| 13,066 | Axa (Insurance) | 1,859,375 | |||
| 10,174 | Banque Nationale de Paris (Banks) | 934,809 | |||
| 2,044 | Cap Gemini SA (Business Services) | 426,422 | |||
| 20,845 | Carrefour SA (Specialty Retail) | 1,519,273 | |||
| 17,887 | France Telecom SA
(Telecommunications) |
2,040,476 | |||
| 18,844 | Lafarge SA (Construction) | 1,395,179 | |||
| 9,552 | LVMH (Louis Vuitton Moet
Hennessy)* (Conglomerates) |
741,134 | |||
| 12,080 | Rhone-Poulenc SA (Chemicals) | 906,180 | |||
| 13,367 | STMicroelectronics NV
(Semiconductors) |
818,792 | |||
| 18,185 | Total Fina SA Class B (Energy
Resources) |
2,697,619 | |||
| 16,577 | Valeo SA (Auto) | 888,861 | |||
| 16,612 | Vivendi (Business Services) | 1,356,752 | |||
| 25,422 | Vivendi Environnement* (Utilities) | 872,268 | |||
| 21,939,588 | |||||
| Germany – 7.3% | |||||
| 4,483 | Allianz AG (Insurance) | 1,510,328 | |||
| 28,812 | Deutsche Bank AG (Banks) | 2,506,630 | |||
| 56,593 | Deutsche Telekom AG
(Telecommunications) |
2,172,899 | |||
| 29,684 | E.On AG (Energy Resources) | 1,421,943 | |||
| 6,464 | Muenchener Rueckversicherungs-
Gesellschaft AG (Property Insurance) |
1,772,540 | |||
| 14,339 | Siemens AG (Electrical Equipment) | 2,297,666 | |||
| 11,682,006 | |||||
| Ireland – 0.6% | |||||
| 168,413 | Bank of Ireland (Banks) | 994,918 | |||
| Italy – 5.1% | |||||
| 346,802 | Banca Nazionale del Lavoro
(Financial Services) |
1,286,911 | |||
| 137,500 | ENI SpA (Energy Resources) | 801,971 | |||
| 146,532 | San Paolo-IMI SpA (Banks) | 2,599,075 | |||
| 90,000 | Telecom Italia Mobile SpA (T.I.M.)
(Telecommunications) |
779,800 | |||
|
Shares |
Description | Value | |||
|---|---|---|---|---|---|
| Common Stocks – (continued) | |||||
| Italy – (continued) | |||||
| 124,796 | Telecom Italia SpA
(Telecommunications) |
$ 1,533,301 | |||
| 218,000 | Unicredito Italiano SpA (Banks) | 1,126,342 | |||
| 8,127,400 | |||||
| Netherlands – 9.9% | |||||
| 31,254 | ASM Lithography Holding NV
(Semiconductors) |
1,180,027 | |||
| 3,542 | Equant NV* (Computer Software) | 137,096 | |||
| 588 | Equant NV* (Computer Software) | 22,707 | |||
| 17,133 | Fortis Netherlands NV (Financial
Services) |
527,325 | |||
| 35,885 | Getronics NV (Business Services) | 449,820 | |||
| 45,879 | ING Groep NV (Financial Services) | 3,070,973 | |||
| 63,518 | Koninklijke Royal Philips Electronics
NV (Appliance) |
3,090,069 | |||
| 48,352 | KPN NV (Telecommunications) | 1,288,164 | |||
| 63,789 | Royal Dutch Petroleum Co. (Energy
Resources) |
3,879,066 | |||
| 38,363 | United Pan-Europe Communications
NV* (Telecommunications) |
936,901 | |||
| 26,475 | VNU NV (Media) | 1,410,191 | |||
| 15,992,339 | |||||
| Spain – 4.8% | |||||
| 17,825 | Acerinox SA (Steel) | 522,197 | |||
| 19,278 | Altadis SA Series A (Consumer
Goods) |
276,392 | |||
| 89,307 | Banco Santander Central Hispano SA
(Banks) |
959,316 | |||
| 75,808 | Endesa SA (Electrical Utilities) | 1,477,203 | |||
| 51,958 | Repsol SA (Energy Resources) | 1,028,604 | |||
| 178,357 | Telefonica de Espana SA*
(Telecommunications) |
3,420,067 | |||
| 7,683,779 | |||||
| Sweden – 6.9% | |||||
| 107,504 | Investor AB (Financial Services) | 1,526,043 | |||
| 134,793 | Nordbanken Holding AB (Banks) | 935,289 | |||
| 32,269 | Sandvik AB (Machinery) | 704,190 | |||
| 67,971 | Securitas AB Series B (Business
Services) |
1,512,099 | |||
| 71,627 | Skandia Forsakring (Insurance) | 1,449,263 | |||
| 246,220 | Telefonaktiebolaget LM Ericsson AB
Series B (Telecommunications) |
4,968,846 | |||
| 11,095,730 | |||||
| Switzerland – 9.3% | |||||
| 16,041 | ABB Ltd. (Business Services) | 1,795,634 | |||
| 878 | Adecco SA (Business Services) | 672,864 | |||
| 5,814 | Credit Suisse Group (Banks) | 1,214,866 | |||
| 1,370 | Nestle SA (Food & Beverage) | 2,952,342 | |||
| 1,699 | Novartis AG (Health) | 2,568,982 | |||
| 268 | Roche Holding AG (Health) | 2,400,000 | |||
|
Shares |
Description | Value | |||
|---|---|---|---|---|---|
| Common Stocks – (continued) | |||||
| Switzerland – (continued) | |||||
| 759 | Swiss Re (Property Insurance) | $ 1,558,085 | |||
| 12,467 | UBS AG (Banks) | 1,814,228 | |||
| 14,977,001 | |||||
| United Kingdom – 29.5% | |||||
| 139,689 | Allied Zurich PLC (Insurance) | 1,709,798 | |||
| 82,668 | Amvescap PLC (Financial Services) | 1,763,406 | |||
| 53,269 | AstraZeneca Group PLC (Health) | 2,427,179 | |||
| 383,048 | BP Amoco PLC (Energy Resources) | 3,504,579 | |||
| 99,414 | British Aerospace PLC
(Defense/Aerospace) |
618,874 | |||
| 174,096 | British American Tobacco PLC
(Tobacco) |
1,119,155 | |||
| 168,183 | British Telecom PLC
(Telecommunications) |
2,135,442 | |||
| 24,506 | Cable & Wireless PLC
(Telecommunications) |
452,687 | |||
| 87,944 | CGNU PLC (Insurance) | 1,352,725 | |||
| 216,039 | Diageo PLC (Tobacco) | 1,843,347 | |||
| 107,019 | Glaxo Wellcome PLC (Health) | 3,076,401 | |||
| 153,195 | HSBC Holdings PLC (Banks) | 2,203,007 | |||
| 103,149 | Imperial Chemical Industries PLC
(Chemicals) |
696,010 | |||
| 192,003 | Lloyds TSB Group PLC (Banks) | 1,805,430 | |||
| 62,190 | Marconi PLC (Telecommunications) | 1,102,781 | |||
| 75,469 | PowerGen PLC (Electrical Utilities) | 639,557 | |||
| 51,334 | Reckitt Benckiser PLC (Food &
Beverage) |
612,314 | |||
| 64,447 | Reuters Group PLC (Business
Services) |
1,290,564 | |||
| 129,288 | Royal Bank of Scotland Group
PLC* (Banks) |
151,964 | |||
| 123,373 | Royal Bank of Scotland Group PLC
(Banks) |
2,227,092 | |||
| 106,037 | Scottish and Southern Energy PLC
(Electrical Utilities) |
858,597 | |||
| 57,141 | ScottishPower PLC (Energy
Resources) |
435,316 | |||
| 243,669 | SmithKline Beecham PLC (Health) | 3,173,455 | |||
| 407,713 | Tesco PLC (Specialty Retail) | 1,282,364 | |||
| 391,558 | Unilever PLC (Food & Beverage) | 2,451,740 | |||
| 43,988 | United News & Media PLC
(Publishing) |
555,330 | |||
| 1,758,218 | Vodafone AirTouch PLC
(Telecommunications) |
7,099,136 | |||
| 53,989 | WPP Group PLC (Business
Services) |
766,199 | |||
| 47,354,449 | |||||
| TOTAL COMMON STOCKS | |||||
| (Cost $139,593,901) | $147,837,515 | ||||
|
Shares |
Description | Value | |||
|---|---|---|---|---|---|
| Preferred Stocks – 0.7% | |||||
| Germany – 0.7% | |||||
| 4,274 | SAP AG (Computer Software) | $ 1,077,566 | |||
| TOTAL PREFERRED STOCKS | |||||
| (Cost $575,529) | $ 1,077,566 | ||||
| Principal Amount | Interest
Rate |
Maturity
Date |
Value | |||||
|---|---|---|---|---|---|---|---|---|
| Short-Term Obligations – 8.2% | ||||||||
| State Street Bank & Trust Euro-Time Deposits € | ||||||||
| EUR7,150,000 | 4.70 | % | 09/01/2000 | $ 6,381,017 | ||||
| 7,730,000 | 4.60 | 09/05/2000 | 6,862,309 | |||||
| TOTAL SHORT-TERM OBLIGATIONS | ||||||||
| (Cost $13,243,326) | $ 13,243,326 | |||||||
| TOTAL INVESTMENTS | ||||||||
| (Cost $153,412,756) | $ 162,158,407 | |||||||
€
|
The principal amount of each security is stated in the currency in which the bond is denominated. See below.
|
| EUR=Euro Currency
|
*
|
Non-income producing security.
|
| The percentage shown for each investment category reflects the value of investments in that category as a percentage of total net
assets.
|
| As a % of
total net assets |
||||
|---|---|---|---|---|
| Common and Preferred Stock Industry Classifications† | ||||
| Appliance | 1.9 | % | ||
| Auto | 0.6 | |||
| Banks | 12.1 | |||
| Business Services | 5.2 | |||
| Chemicals | 1.8 | |||
| Computer Software | 0.8 | |||
| Conglomerates | 0.5 | |||
| Construction | 0.9 | |||
| Consumer Goods | 0.2 | |||
| Defense/Aerospace | 0.4 | |||
| Electrical Equipment | 2.4 | |||
| Electrical Utilities | 1.9 | |||
| Energy Resources | 8.6 | |||
| Entertainment | 0.3 | |||
| Financial Services | 5.1 | |||
| Food & Beverage | 3.7 | |||
| Health | 8.5 | |||
| Hotels | 0.5 | |||
| Insurance | 4.9 | |||
| Machinery | 0.4 | |||
| Media | 0.9 | |||
| Property Insurance | 2.1 | |||
| Publishing | 0.3 | |||
| Semiconductors | 1.2 | |||
| Specialty Retail | 1.7 | |||
| Steel | 0.3 | |||
| Telecommunications | 23.3 | |||
| Tobacco | 1.8 | |||
| Utilities | 0.5 | |||
| TOTAL COMMON AND PREFERRED STOCK | 92.8 | % | ||
†
|
Industry concentrations greater than one tenth of one percent are disclosed.
|
| Assets: | ||||
| Investment in securities, at value (identified cost $153,412,756) | $162,158,407 | |||
| Cash, at value | 1,075,035 | |||
| Receivables: | ||||
| Fund shares sold | 2,686,708 | |||
| Investment securities sold | 900,283 | |||
| Variation margin, at value (a) | 885,229 | |||
| Dividends and interest, at value | 479,965 | |||
| Forward foreign currency exchange contracts, at value | 430,055 | |||
| Reimbursement from investment adviser | 155,402 | |||
| Other assets | 263 | |||
| Total assets | 168,771,347 | |||
| Liabilities: | ||||
| Payables: | ||||
| Investment securities purchased, at value | 7,296,106 | |||
| Forward foreign currency exchange contracts, at value | 428,639 | |||
| Amounts owed to affiliates | 221,635 | |||
| Fund shares repurchased | 93,700 | |||
| Accrued expenses and other liabilities | 112,815 | |||
| Total liabilities | 8,152,895 | |||
| Net Assets: | ||||
| Paid-in capital | 139,349,829 | |||
| Accumulated net investment loss | (1,170,986 | ) | ||
| Accumulated net realized gain from investment, futures and foreign currency related transactions | 13,747,696 | |||
| Net unrealized gain on investments and translation of assets and liabilities denominated in foreign currencies | 8,691,913 | |||
| NET ASSETS | $160,618,452 | |||
| Net asset value, offering and redemption price per share: (b) | ||||
| Class A | $13.82 | |||
| Class B | $13.69 | |||
| Class C | $13.72 | |||
| Institutional | $14.00 | |||
| Service | $13.86 | |||
| Shares outstanding: | ||||
| Class A | 10,131,218 | |||
| Class B | 331,379 | |||
| Class C | 107,992 | |||
| Institutional | 1,045,348 | |||
| Service | 156 | |||
| Total shares outstanding, $.001 par value (unlimited number of shares authorized) | 11,616,093 | |||
(a)
|
Includes approximately $262,300 relating to initial margin requirements for futures transactions.
|
(b)
|
Maximum public offering price per share (NAV per share multiplied by 1.0582) for Class A Shares is $14.62. At redemption, Class B
and Class C Shares may be subject to a contingent deferred sales charge, assessed on the amount equal to the lesser of the current net asset value or the original purchase price of the shares.
|
| Investment income: | ||||
| Dividends (a) | $ 2,063,666 | |||
| Interest | 223,695 | |||
| Total income | 2,287,361 | |||
| Expenses: | ||||
| Management fees | 1,253,575 | |||
| Distribution and Service fees (b) | 608,041 | |||
| Custodian fees | 341,018 | |||
| Transfer Agent fees (c) | 226,736 | |||
| Registration fees | 67,145 | |||
| Professional fees | 55,650 | |||
| Trustee fees | 6,615 | |||
| Other | 135,577 | |||
| Total expenses | 2,694,357 | |||
| Less — expense reductions | (475,621 | ) | ||
| Net expenses | 2,218,736 | |||
| NET INVESTMENT INCOME | 68,625 | |||
| Realized and unrealized gain (loss) on investment, futures and foreign currency related transactions: | ||||
| Net realized gain from: | ||||
| Investment transactions | 11,010,376 | |||
| Futures transactions | 573,892 | |||
| Foreign currency related transactions | 1,925,508 | |||
| Net change in unrealized gain (loss) on: | ||||
| Investments | 4,497,839 | |||
| Futures | 10,514 | |||
| Translation of assets and liabilities denominated in foreign currencies | (18,838 | ) | ||
| Net realized and unrealized gain on investment, futures and foreign currency related transactions | 17,999,291 | |||
| NET INCREASE IN NET ASSETS RESULTING FROM OPERATIONS | $18,067,916 | |||
(a)
|
Foreign taxes withheld on dividends were $331,236.
|
(b)
|
Class A, Class B and Class C had Distribution and Service fees of $569,252, $29,685 and $9,104, respectively.
|
(c)
|
Class A, Class B, Class C, Institutional Class and Service Class had Transfer Agent fees of $216,315, $5,640, $1,730, $3,050 and
$1, respectively.
|
| For the
Year Ended August 31, 2000 |
For the
Seven Months Ended August 31, 1999 |
For the
Period Ended January 31, 1999 (a) |
||||||||
|---|---|---|---|---|---|---|---|---|---|---|
| From operations: | ||||||||||
| Net investment income (loss) | $ 68,625 | $ 400,829 | $ (172,676 | ) | ||||||
| Net realized gain from investment, futures and foreign currency related transactions | 13,509,776 | 1,981,969 | 1,555,106 | |||||||
| Net change in unrealized gain (loss) on investments, futures and translation of assets
and liabilities denominated in foreign currencies |
4,489,515 | (5,072,876 | ) | 9,275,274 | ||||||
| Net increase (decrease) in net assets resulting from operations | 18,067,916 | (2,690,078 | ) | 10,657,704 | ||||||
| Distributions to shareholders: | ||||||||||
| From net realized gains | ||||||||||
| Class A Shares | (4,552,387 | ) | — | — | ||||||
| Class B Shares | (85,427 | ) | — | — | ||||||
| Class C Shares | (18,441 | ) | — | — | ||||||
| Institutional Shares | (214,659 | ) | — | — | ||||||
| Service Shares | (105 | ) | — | — | ||||||
| Total distributions to shareholders | (4,871,019 | ) | — | — | ||||||
| From share transactions: | ||||||||||
| Proceeds from sales of shares | 92,017,420 | 30,108,519 | 65,352,139 | |||||||
| Reinvestment of dividends and distributions | 4,698,363 | — | — | |||||||
| Cost of shares repurchased | (31,390,674 | ) | (20,233,820 | ) | (1,098,018 | ) | ||||
| Net increase in net assets resulting from share transactions | 65,325,109 | 9,874,699 | 64,254,121 | |||||||
| TOTAL INCREASE | 78,522,006 | 7,184,621 | 74,911,825 | |||||||
| Net assets: | ||||||||||
| Beginning of period | $ 82,096,446 | 74,911,825 | — | |||||||
| End of period | $160,618,452 | $82,096,446 | $74,911,825 | |||||||
| Accumulated undistributed (distribution in excess of) net investment income | $ (1,170,986 | ) | $ — | $ (175,403 | ) | |||||
(a)
|
Commencement date of operations was October 1, 1998 for all share classes.
|
| 1. ORGANIZATION
|
| Goldman Sachs Trust (the “Trust”) is a Delaware business trust registered under the Investment Company Act of 1940 (as
amended) as an open-end, management investment company. The Trust includes the Goldman Sachs European Equity Fund (the “Fund”). The Fund is a diversified portfolio offering five classes of shares — Class A, Class B, Class C,
Institutional and Service.
|
| 2. SIGNIFICANT ACCOUNTING POLICIES
|
| The following is a summary of the significant accounting policies consistently followed by the Fund. The preparation of financial
statements in conformity with generally accepted accounting principles requires management to make estimates and assumptions that may affect the reported amounts. Actual results could differ from those estimates. Effective for fiscal year 1999, the Board
of Trustees approved a change in the fiscal year end of the Fund from January 31 to August 31. Accordingly, the Statements of Changes in Net Assets, Summary of Share Transactions, and Financial Highlights of the Fund are included for the seven months
ended August 31, 1999 and the year ended January 31, 1999.
|
| A. Investment Valuation — Investments in
securities traded on a U.S. or foreign securities exchange or the NASDAQ system are valued daily at their last sale price on the principal exchange on which they are traded. If no sale occurs, securities are valued at the last bid price. Debt securities
are valued at prices supplied by independent pricing services, broker/dealer-supplied valuations or matrix pricing systems. Unlisted equity and debt securities for which market quotations are available are valued at the last sale price on valuation date
or, if no sale occurs, at the last bid price. Short-term debt obligations maturing in sixty days or less are valued at amortized cost, which approximates market value. Securities for which quotations are not readily available are valued at fair value
using methods approved by the Board of Trustees of the Trust.
|
| B. Security Transactions and Investment Income — Security transactions are recorded as of the trade date. Realized gains and losses on sales of portfolio securities are calculated using the identified-cost basis. Dividend income is recorded on the ex-dividend date, net of foreign withholding taxes
where applicable. Dividends for which the Fund has the choice to receive either cash or stock are recognized as investment income in an amount equal to the cash dividend. Interest income is recorded on the basis of interest accrued, premium amortized and
discount earned.
|
| Net investment income (other than class specific expenses) and unrealized and
realized gains or losses are allocated daily to each class of shares of the Fund based upon the relative proportion of net assets of each class.
|
| C. Federal Taxes — It is the Fund’s
policy to comply with the requirements of the Internal Revenue Code applicable to regulated investment companies and to distribute each year substantially all of its investment company taxable income and capital gains to its shareholders. Accordingly, no
federal tax provision is required. Income and capital gains distributions, if any, are declared and paid annually.
|
| The characterization of distributions to shareholders for financial reporting
purposes is determined in accordance with income tax rules. Therefore, the source of the Fund’s distributions may be shown in the accompanying financial statements as either from or in excess of net investment income or net realized gain on
investment transactions, or from paid-in capital, depending on the type of book/tax differences that may exist.
|
| At August 31, 2000, the aggregate cost of portfolio securities for federal income
tax purposes is $153,412,756. Accordingly, the gross unrealized gain on investments was $16,786,328 and the gross unrealized loss on investments was $8,040,677 resulting in a net unrealized gain of $8,745,651.
|
| 2. SIGNIFICANT ACCOUNTING POLICIES (continued)
|
| D. Expenses — Expenses incurred by the
Trust which do not specifically relate to an individual Fund of the Trust are allocated to the Funds based on a straight-line or pro rata basis depending upon the nature of the expense.
|
| Class A, Class B and Class C Shares bear all expenses and fees relating to their
respective Distribution and Service Plans. Shareholders of Service Shares bear all expenses and fees paid to service organizations. Each class of shares separately bears its respective class-specific Transfer Agency fees.
|
| E. Foreign Currency Translations — The
books and records of the Fund are maintained in U.S. dollars. Amounts denominated in foreign currencies are translated into U.S. dollars on the following basis: (i) investment valuations, foreign currency and other assets and liabilities initially
expressed in foreign currencies are converted each business day into U.S. dollars based on current exchange rates; (ii) purchases and sales of foreign investments, income and expenses are converted into U.S. dollars based on currency exchange rates
prevailing on the respective dates of such transactions.
|
| Net realized and unrealized gain (loss) on foreign currency transactions will
represent: (i) foreign exchange gains and losses from the sale and holdings of foreign currencies; (ii) currency gains and losses between trade date and settlement date on investment securities transactions and forward exchange contracts; and (iii) gains
and losses from the difference between amounts of dividends, interest and foreign withholding taxes recorded and the amounts actually received.
|
| F. Segregation Transactions — The Fund may
enter into certain derivative transactions to seek to increase total return. Forward foreign currency exchange contracts, futures contracts, written options, when-issued securities and forward commitments represent examples of such transactions. As a
result of entering into these transactions, the Fund is required to segregate liquid assets on the accounting records equal to or greater than the market value of the corresponding transactions.
|
| 3. AGREEMENTS
|
| Pursuant to the Investment Management Agreement (the “Agreement”), Goldman Sachs Asset Management International (“
GSAMI”), an affiliate of Goldman, Sachs & Co. (“Goldman Sachs”), serves as the investment adviser to the Fund. Under the Agreement, GSAMI, subject to the general supervision of the Trust’s Board of Trustees, manages the Fund’s
portfolio. As compensation for the services rendered under the Agreement, the assumption of the expenses related thereto and administering the Fund’s business affairs, including providing facilities, GSAMI is entitled to a fee, computed daily and
payable monthly, at an annual rate equal to 1.00% of the average daily net assets of the Fund.
|
| The investment adviser has voluntarily agreed to limit certain “Other
Expenses” (excluding Management fees, Distribution and Service fees, Transfer Agent fees, taxes, interest, brokerage, litigation, Service Share fees, indemnification costs and other extraordinary expenses) to the extent such expenses exceed, on an
annual basis, 0.10% of the average daily net assets of the Fund. Goldman Sachs reimbursed approximately $401,000 for the year ended August 31, 2000. In addition, the Fund has entered into certain offset arrangements with the custodian resulting in a
reduction in the Fund’s expenses. For the year ended August 31, 2000, custody fees were reduced by approximately $75,000.
|
| The Trust on behalf of the Fund, has adopted Distribution and Service Plans. Under
the Distribution and Service Plans, Goldman Sachs and/or authorized dealers are entitled to a monthly fee from the Fund for distribution and shareholder maintenance services equal, on an annual basis, to 0.50%, 1.00%, and 1.00% of the Fund’s average
daily net assets attributable to Class A, Class B and Class C Shares, respectively.
|
| Goldman Sachs serves as the distributor of shares of the Fund pursuant to a
Distribution Agreement. Goldman Sachs may receive a portion of the Class A sales load and Class B and Class C contingent deferred sales charges and has advised the Fund that it retained approximately $579,000 for the year ended August 31, 2000.
|
| Goldman Sachs also serves as the Transfer Agent of the Fund for a fee. The fees
charged for such transfer agency services are calculated daily and payable monthly at an annual rate as follows: 0.19% of average daily net assets for Class A, Class B and Class C Shares and 0.04% of average daily net assets for Institutional and Service
Shares.
|
| 3. AGREEMENTS (continued)
|
| The Trust, on behalf of the Fund, has adopted a Service Plan. This Plan allows for
Service Shares to compensate service organizations for providing varying levels of account administration and shareholder liaison services to their customers who are beneficial owners of such shares. The Service Plan provides for compensation to the
service organizations in an amount up to 0.50% (on an annualized basis), of the average daily net asset value of the Service Shares.
|
| As of August 31, 2000, the amounts owed to affiliates were approximately $134,000,
$64,000 and $24,000 for Management, Distribution and Service, and Transfer Agent fees, respectively.
|
| 4. PORTFOLIO SECURITIES TRANSACTIONS
|
| The cost of purchases and proceeds of sales and maturities of securities (excluding short-term investments and futures) for the
year ended August 31, 2000, were $164,598,174 and $114,086,346, respectively. For the year ended August 31, 2000, Goldman Sachs earned approximately $12,000 of brokerage commissions from futures transactions executed on behalf of the Fund.
|
| Forward Foreign Currency Exchange Contracts — The
Fund may enter into forward foreign currency exchange contracts for the purchase or sale of a specific foreign currency at a fixed price on a future date as a hedge or cross-hedge against either specific transactions or portfolio positions. The Fund may
also purchase and sell such contracts to seek to increase total return. All commitments are “marked-to-market” daily at the applicable translation rates and any resulting unrealized gains or losses are recorded in the Fund’s financial
statements. The Fund realizes gains or losses at the time a forward contract is offset by entry into a closing transaction or extinguished by the delivery of the currency. Risks may arise upon entering these contracts from the potential inability of
counterparties to meet the terms of their contracts and from unanticipated movements in the value of a foreign currency relative to the U.S. dollar.
|
| At August 31, 2000, forward foreign currency exchange contracts were as follows:
|
| Value on
Settlement Date |
Current Value | Unrealized |
|||||||
|---|---|---|---|---|---|---|---|---|---|
| Open Forward Foreign Currency
Purchase Contracts |
Gain | Loss | |||||||
| British Pounds | |||||||||
| expiring 9/14/2000 | $1,049,390 | $1,004,399 | $ — | $44,991 | |||||
| expiring 9/14/2000 | 1,042,004 | 997,142 | — | 44,862 | |||||
| TOTAL OPEN FORWARD FOREIGN CURRENCY
PURCHASE CONTRACTS |
$2,091,394 | $2,001,541 | $ — | $89,853 | |||||
| Value on
Settlement Date |
Current Value | Unrealized |
|||||||
| Open Forward Foreign Currency
Sale Contracts |
Gain | Loss | |||||||
| Euro | |||||||||
| expiring 10/31/2000 | $1,978,000 | $1,968,466 | $ 9,534 | $ — | |||||
| expiring 10/31/2000 | 1,978,000 | 1,939,022 | 38,978 | — | |||||
| British Pounds | |||||||||
| expiring 9/14/2000 | 2,056,413 | 1,981,220 | 75,193 | — | |||||
| TOTAL OPEN FORWARD FOREIGN CURRENCY
SALE CONTRACTS |
$6,012,413 | $5,888,708 | $123,705 | $ — | |||||
| 4. PORTFOLIO SECURITIES TRANSACTIONS (continued)
|
| Foreign Currency
Cross Contracts (Purchase/Sale) |
Purchase
Current Value |
Sale
Current Value |
Realized |
||||||
|---|---|---|---|---|---|---|---|---|---|
| Gain | Loss | ||||||||
| Euro/British Pounds | |||||||||
| expiring 9/14/2000 | $ 2,038,789 | $ 1,888,513 | $ — | $150,276 | |||||
| expiring 9/14/2000 | 964,292 | 1,035,284 | 70,992 | — | |||||
| expiring 9/14/2000 | 1,015,177 | 955,037 | — | 60,140 | |||||
| expiring 9/14/2000 | 955,037 | 1,024,223 | 69,186 | — | |||||
| expiring 9/14/2000 | 966,714 | 1,038,778 | 72,064 | — | |||||
| British Pounds/Euro | |||||||||
| expiring 9/14/2000 | 1,981,221 | 2,038,789 | 57,568 | — | |||||
| expiring 9/14/2000 | 1,035,285 | 990,610 | — | 44,675 | |||||
| expiring 9/14/2000 | 978,637 | 1,015,177 | 36,540 | — | |||||
| expiring 9/14/2000 | 1,024,222 | 982,163 | — | 42,059 | |||||
| expiring 9/14/2000 | 1,038,778 | 997,142 | — | 41,636 | |||||
| TOTAL FOREIGN CURRENCY CROSS CONTRACTS | $11,998,152 | $11,965,716 | $306,350 | $338,786 | |||||
| The contractual amounts of forward foreign currency exchange contracts do not
necessarily represent the amounts potentially subject to risk. The measurement of the risks associated with these instruments is meaningful only when all related and offsetting transactions are considered. At August 31, 2000, the Fund had sufficient cash
and securities to cover any commitments under these contracts.
|
| Futures Contracts — The Fund may enter into futures
transactions to hedge against changes in interest rates, securities prices, currency exchange rates or to seek to increase total return. Upon entering into a futures contract, the Fund is required to deposit with a broker or the Fund’s custodian
bank, an amount of cash or securities equal to the minimum “initial margin” requirement of the associated futures exchange. Subsequent payments for futures contracts (“variation margin”) are paid or received by the Fund, depending on
the fluctuations in the value of the contracts, and are recorded for financial reporting purposes as unrealized gains or losses. When contracts are closed, the Fund realizes a gain or loss which is reported in the Statement of Operations.
|
| The use of futures contracts involve, to varying degrees, elements of market risk
which may exceed the amounts recognized in the Statement of Assets and Liabilities. Changes in the value of the futures contracts may not directly correlate with changes in the value of the underlying securities. This risk may decrease the effectiveness
of the Fund’s hedging strategies and potentially result in a loss.
|
| At August 31, 2000, open futures contracts were as follows:
|
| Type | Number of
Contracts Long |
Settlement Month | Market Value | Unrealized loss | |||||
|---|---|---|---|---|---|---|---|---|---|
| Dow Jones Euro Stoxx 50 | 118 | September 2000 | $5,419,998 | $27,908 | |||||
| 5. LINE OF CREDIT FACILITY
|
| Effective May 31, 2000, the Fund participates in a $350,000,000 committed, unsecured revolving line of credit facility. Prior
thereto, the Fund participated in a $250,000,000 uncommitted and a $250,000,000 committed, unsecured revolving line of credit facility. Under the most restrictive arrangement, the Fund must own securities having a market value in excess of 400% of the
total bank borrowings. This facility is to be used solely for temporary or emergency purposes. The interest rate on borrowings is based on the Federal Funds rate. The committed facility also requires a fee to be paid by the Fund based on the amount of the
commitment which has not been utilized. During the year ended August 31, 2000, the Fund did not have any borrowings under any of these facilities.
|
| 6. CHANGE IN INDEPENDENT ACCOUNTANTS
|
| On October 26, 1999 the Board of Trustees of the Fund upon the recommendation of the Board’s audit committee, determined not
to retain Arthur Andersen LLP and approved a change of the Fund’s independent accountants to PricewaterhouseCoopers LLP. For the periods ended August 31, 1999 and January 31, 1999, Arthur Andersen LLP’s audit reports contained no adverse opinion
or disclaimer of opinion; nor were their reports qualified or modified as to uncertainty, audit scope, or accounting principles. Further, there were no disagreements between the Fund and Arthur Andersen LLP on accounting principles or practices, financial
statement disclosure or audit scope or procedure, which if not resolved to the satisfaction of Arthur Andersen LLP would have caused them to make reference to the disagreement in their reports.
|
| 7. CERTAIN RECLASSIFICATIONS
|
| In accordance with AICPA Statement of Position 93-2, the Fund reclassified $1,239,611 from accumulated undistributed net
investment income to accumulated net realized gain from investment and foreign currency related transactions and $375 from paid-in capital to accumulated net realized gain from investment, futures and foreign currency related transactions. These
reclassifications have no impact on the net asset value of the Fund and are designed to present the Fund’s capital accounts on a tax basis. Reclassifications result primarily from the difference in the tax treatment of foreign currency, net operating
losses and organization costs.
|
| 8. SUMMARY OF SHARE TRANSACTIONS
|
| Share activity is as follows:
|
| For the Year Ended
August 31, 2000 |
For the Seven Months Ended
August 31, 1999 |
For the Period Ended
January 31, 1999 (a) |
|||||||||||||||||
|---|---|---|---|---|---|---|---|---|---|---|---|---|---|---|---|---|---|---|---|
| Shares | Dollars | Shares | Dollars | Shares | Dollars | ||||||||||||||
| Class A Shares | |||||||||||||||||||
| Shares sold | 5,326,777 | $ 74,566,934 | 2,119,807 | $24,745,494 | 5,087,352 | $53,619,415 | |||||||||||||
| Reinvestment of dividends and distributions | 337,798 | 4,394,755 | — | — | — | — | |||||||||||||
| Shares repurchased | (1,904,482 | ) | (26,514,624 | ) | (759,657 | ) | (8,753,714 | ) | (76,377 | ) | (844,311 | ) | |||||||
| 3,760,093 | 52,447,065 | 1,360,150 | 15,991,780 | 5,010,975 | 52,775,104 | ||||||||||||||
| Class B Shares | |||||||||||||||||||
| Shares sold | 312,710 | 4,322,812 | 53,116 | 627,367 | 35,445 | 410,945 | |||||||||||||
| Reinvestment of dividends and distributions | 6,038 | 78,135 | — | — | — | — | |||||||||||||
| Shares repurchased | (62,406 | ) | (846,347 | ) | (13,524 | ) | (156,078 | ) | — | — | |||||||||
| 256,342 | 3,554,600 | 39,592 | 471,289 | 35,445 | 410,945 | ||||||||||||||
| Class C Shares | |||||||||||||||||||
| Shares sold | 96,303 | 1,362,429 | 148,372 | 1,718,395 | 48,110 | 570,630 | |||||||||||||
| Reinvestment of dividends and distributions | 924 | 11,976 | — | — | — | — | |||||||||||||
| Shares repurchased | (22,323 | ) | (291,955 | ) | (163,394 | ) | (1,909,241 | ) | — | — | |||||||||
| 74,904 | 1,082,450 | (15,022 | ) | (190,846 | ) | 48,110 | 570,630 | ||||||||||||
| Institutional Shares | |||||||||||||||||||
| Shares sold | 824,255 | 11,763,455 | 254,200 | 3,017,263 | 1,062,367 | 10,749,551 | |||||||||||||
| Reinvestment of dividends and distributions | 16,264 | 213,392 | — | — | — | — | |||||||||||||
| Shares repurchased | (299,728 | ) | (3,735,818 | ) | (791,417 | ) | (9,414,787 | ) | (20,593 | ) | (253,707 | ) | |||||||
| 540,791 | 8,241,029 | (537,217 | ) | (6,397,524 | ) | 1,041,774 | 10,495,844 | ||||||||||||
| Service Shares | |||||||||||||||||||
| Shares sold | 148 | 1,790 | — | — | 160 | 1,598 | |||||||||||||
| Reinvestment of dividends and distributions | 8 | 105 | — | — | — | — | |||||||||||||
| Shares repurchased | (160 | ) | (1,930 | ) | — | — | — | — | |||||||||||
| (4 | ) | (35 | ) | — | — | 160 | 1,598 | ||||||||||||
| NET INCREASE | 4,632,126 | $ 65,325,109 | 847,503 | $ 9,874,699 | 6,136,464 | $64,254,121 | |||||||||||||
(a)
|
Commencement date of operations was October 1, 1998 for all share classes.
|
| Income from
investment operations |
Distributions to
shareholders |
|||||||||||||||||
|---|---|---|---|---|---|---|---|---|---|---|---|---|---|---|---|---|---|---|
| Net asset
value, beginning of period |
Net
investment income (loss) |
Net realized
and unrealized gain (loss) |
Total from
investment operations |
From net
realized gains |
Total
distributions |
|||||||||||||
| FOR THE YEAR ENDED AUGUST 31, | ||||||||||||||||||
| 2000 - Class A Shares | $11.75 | $ — | (c) | $ 2.78 | $ 2.78 | $(0.71 | ) | $(0.71 | ) | |||||||||
| 2000 - Class B Shares | 11.71 | (0.04 | ) (c) | 2.73 | 2.69 | (0.71 | ) | (0.71 | ) | |||||||||
| 2000 - Class C Shares | 11.72 | (0.04 | ) (c) | 2.75 | 2.71 | (0.71 | ) | (0.71 | ) | |||||||||
| 2000 - Institutional Shares | 11.82 | 0.10 | (c) | 2.79 | 2.89 | (0.71 | ) | (0.71 | ) | |||||||||
| 2000 - Service Shares | 11.76 | 0.01 | (c) | 2.80 | 2.81 | (0.71 | ) | (0.71 | ) | |||||||||
| FOR THE SEVEN MONTHS ENDED AUGUST 31, | ||||||||||||||||||
| 1999 - Class A Shares | 12.20 | 0.05 | (0.50 | ) | (0.45 | ) | — | — | ||||||||||
| 1999 - Class B Shares | 12.19 | 0.03 | (0.51 | ) | (0.48 | ) | — | — | ||||||||||
| 1999 - Class C Shares | 12.20 | 0.04 | (0.52 | ) | (0.48 | ) | — | — | ||||||||||
| 1999 - Institutional Shares | 12.23 | 0.18 | (0.59 | ) | (0.41 | ) | — | — | ||||||||||
| 1999 - Service Shares | 12.20 | 0.08 | (0.52 | ) | (0.44 | ) | — | — | ||||||||||
| FOR THE PERIOD ENDED JANUARY 31, | ||||||||||||||||||
| 1999 - Class A Shares (commenced October 1, 1998) | 10.00 | (0.03 | ) | 2.23 | 2.20 | — | — | |||||||||||
| 1999 - Class B Shares (commenced October 1, 1998) | 10.00 | (0.02 | ) | 2.21 | 2.19 | — | — | |||||||||||
| 1999 - Class C Shares (commenced October 1, 1998) | 10.00 | (0.01 | ) | 2.21 | 2.20 | — | — | |||||||||||
| 1999 - Institutional Shares (commenced October 1, 1998) | 10.00 | (0.01 | ) | 2.24 | 2.23 | — | — | |||||||||||
| 1999 - Service Shares (commenced October 1, 1998) | 10.00 | (0.03 | ) | 2.23 | 2.20 | — | — | |||||||||||
(a)
|
Assumes investment at the net asset value at the beginning of the period, reinvestment of all dividends and distributions, a
complete redemption of the investment at the net asset value at the end of the period and no sales or redemption charges. Total return would be reduced if a sales or redemption charge were taken into account. Total returns for periods less than one full
year are not annualized.
|
(b)
|
Annualized.
|
(c)
|
Calculated based on the average shares outstanding methodology.
|
| Goldman Sachs European Equity Fund — Tax Information (unaudited)
|
| For the distribution paid during the year ended August 31, 2000, the total amount of
income received by the European Equity Fund from sources within foreign countries and possessions of the United States was $0.1615 per share all of which is attributable to qualified passive income. The total amount of taxes paid by the Fund to such
countries was $0.0203 per share. A separate notice containing the country by country components of these totals has been previously mailed to the shareholders.
|
| Pursuant to Section 852 of the Internal Revenue Code, the Fund designated $416,379 as
capital gains dividends paid during its year ended August 31, 2000.
|
|
Ratios assuming no expense reductions |
|||||||||||||||||||||
|---|---|---|---|---|---|---|---|---|---|---|---|---|---|---|---|---|---|---|---|---|---|
| Net asset
value, end of period |
Total
return (a) |
Net assets
at end of period (in 000s) |
Ratio of
net expenses to average net assets |
Ratio of
net investment income (loss) to average net assets |
Ratio of
expenses to average net assets |
Ratio of
net investment income (loss) to average net assets |
Portfolio
turnover rate |
||||||||||||||
| $13.82 | 24.04 | % | $139,966 | 1.79 | % | 0.02 | % | 2.17 | % | (0.36 | )% | 98.10 | % | ||||||||
| 13.69 | 23.32 | 4,538 | 2.29 | (0.27 | ) | 2.67 | (0.65 | ) | 98.10 | ||||||||||||
| 13.72 | 23.48 | 1,482 | 2.29 | (0.26 | ) | 2.67 | (0.64 | ) | 98.10 | ||||||||||||
| 14.00 | 24.85 | 14,630 | 1.14 | 0.70 | 1.52 | 0.32 | 98.10 | ||||||||||||||
| 13.86 | 24.28 | 2 | 1.64 | 0.09 | 2.02 | (0.29 | ) | 98.10 | |||||||||||||
| 11.75 | (3.69 | ) | 74,862 | 1.79 | (b) | 0.80 | (b) | 2.29 | (b) | 0.30 | (b) | 54.98 | |||||||||
| 11.71 | (3.94 | ) | 879 | 2.29 | (b) | 0.43 | (b) | 2.79 | (b) | (0.07 | ) (b) | 54.98 | |||||||||
| 11.72 | (3.93 | ) | 388 | 2.29 | (b) | 0.42 | (b) | 2.79 | (b) | (0.08 | ) (b) | 54.98 | |||||||||
| 11.82 | (3.35 | ) | 5,965 | 1.14 | (b) | 1.53 | (b) | 1.64 | (b) | 1.03 | (b) | 54.98 | |||||||||
| 11.76 | (3.61 | ) | 2 | 1.64 | (b) | 1.10 | (b) | 2.14 | (b) | 0.60 | (b) | 54.98 | |||||||||
| 12.20 | 22.00 | 61,151 | 1.79 | (b) | (1.19 | ) (b) | 2.80 | (b) | (2.20 | ) (b) | 70.77 | ||||||||||
| 12.19 | 21.90 | 432 | 2.29 | (b) | (1.78 | ) (b) | 3.30 | (b) | (2.79 | ) (b) | 70.77 | ||||||||||
| 12.20 | 22.00 | 587 | 2.29 | (b) | (1.83 | ) (b) | 3.30 | (b) | (2.84 | ) (b) | 70.77 | ||||||||||
| 12.23 | 22.30 | 12,740 | 1.14 | (b) | (0.33 | ) (b) | 2.15 | (b) | (1.34 | ) (b) | 70.77 | ||||||||||
| 12.20 | 22.00 | 2 | 1.64 | (b) | (0.69 | ) (b) | 2.65 | (b) | (1.70 | ) (b) | 70.77 | ||||||||||
| To the Shareholders and Board of Trustees of
|
| Goldman Sachs Trust — European Equity Fund:
|
| In our opinion, the accompanying statement of assets and liabilities, including the statement of investments, and the related
statements of operations and of changes in net assets and the financial highlights present fairly, in all material respects, the financial position of Goldman Sachs European Equity Fund (“the Fund”), one of the portfolios constituting Goldman
Sachs Trust, at August 31, 2000, the results of its operations, the changes in its net assets and the financial highlights for the year then ended, in conformity with accounting principles generally accepted in the United States of America. These
financial statements and financial highlights (hereafter referred to as “financial statements”) are the responsibility of the Fund’s management; our responsibility is to express an opinion on these financial statements based on our audit.
We conducted our audit of these financial statements in accordance with auditing standards generally accepted in the United States of America, which require that we plan and perform the audit to obtain reasonable assurance about whether the financial
statements are free of material misstatement. An audit includes examining, on a test basis, evidence supporting the amounts and disclosures in the financial statements, assessing the accounting principles used and significant estimates made by management,
and evaluating the overall financial statement presentation. We believe that our audit, which included confirmation of securities at August 31, 2000 by correspondence with the custodian and brokers, provides a reasonable basis for our opinion. The
statements of changes in net assets and the financial highlights of the Fund for the periods ended August 31, 1999 and January 31, 1999 were audited by other independent accountants whose report dated October 8, 1999 expressed an unqualified opinion thereon
.
|
| PricewaterhouseCoopers LLP
|
| Boston, Massachusetts
|
| October 23, 2000
|
G O L D M A N S A C H S F U N D P R O F I L E
Goldman Sachs European Equity Fund
An Investment Idea for the Long Term
History has shown that a long-term plan that includes international stocks can help provide greater protection against market volatility over time than a portfolio that invests only in U.S. stocks.
Goldman Sachs European Equity Fund offers investors access to the benefits associated with international market diversification. The Fund seeks long-term capital growth through investments in equity securities of European countries.
Target Your Needs
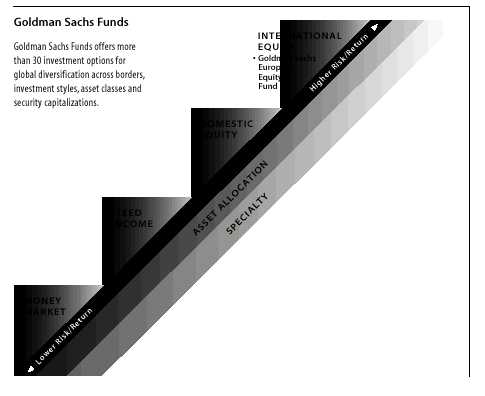
The Goldman Sachs European Equity Fund has a distinct investment objective and a defined place on the risk/return spectrum. As your investment objectives change, you can exchange shares within Goldman Sachs Funds without any additional charge.* (Please note: in general, greater returns are associated with greater risk.)
For More Information
To learn more about the Goldman Sachs European Equity Fund and other Goldman Sachs Funds, call your investment professional today.
*The exchange privilege is subject to termination and its terms are subject to change.
| GOLDMAN SACHS ASSET MANAGEMENT | 32 OLD SLIP, 17TH FLOOR, | NEW YORK, NEW YORK 10005 |
| TRUSTEES |
OFFICERS |
|
| Ashok N. Bakhru, Chairman | Douglas C. Grip, President | |
| David B. Ford | Jesse H. Cole, Vice President | |
| Douglas C. Grip | James A. Fitzpatrick, Vice President | |
| Patrick T. Harker | John M. Perlowski, Treasurer | |
| John P. McNulty | Peter W. Fortner, Assistant Treasurer | |
| Mary P. McPherson | Philip V. Giuca, Jr., Assistant Treasurer | |
| Alan A. Shuch | Howard B. Surloff, Secretary | |
| William H. Springer | Amy E. Belanger, Assistant Secretary | |
| Richard P. Strubel | Valerie A. Zondorak, Assistant Secretary |
GOLDMAN, SACHS & CO.
Distributor and Transfer Agent
GOLDMAN SACHS ASSET MANAGEMENT INTERNATIONAL
Investment Adviser
GOLDMAN SACHS INTERNATIONAL
Peterborough Court, 133 Fleet Street
London EC4A 2BB, England
Visit our internet address: www.gs.com/funds
| This material is not authorized for distribution to prospective investors unless preceded or accompanied by a current
Prospectus. Investors should read the Prospectus carefully before investing or sending money. |
| Emerging markets securities are volatile. They are subject to substantial currency fluctuations and sudden economic and political developments. At times, the Fund may be unable to sell certain of its portfolio securities without a substantial drop in price, if at all. |
| Concentration of the Fund’s assets in one or a few countries (or a particular geographic area) and currencies will subject a fund to greater risks than if a fund’s assets were not geographically concentrated. |
| The stocks of smaller companies are often more volatile and present greater risks than stocks of larger companies. |
| The Fund may participate in the Initial Public Offering (IPO) market, and a portion of the Fund’s returns consequently may be attributable to its investment in IPOs, which may have a magnified impact due to the Fund’s small asset base. As the Fund’s assets grow, it is probable that the effect of the Fund’s investment in IPOs on its total returns may not be as significant. |
| Goldman, Sachs & Co. is the distributor of the Fund. |
| Copyright 2000 Goldman, Sachs & Co. All rights reserved. Date of first use: October 30, 2000 / 00-1383 | EUROPEAR /9.5K / 10-00 |
|
|