
|
|
|
|
|
|
|
|
|
M A R K E T O V E R V I E W
Goldman Sachs CORE Equity Funds
Dear Shareholder:
During the period under review the financial markets experienced a dramatic increase in volatility. However, investors who stayed the course were generally rewarded for their disciplined approach, as many sectors of the market generated solid returns.
While a range of stocks were negatively impacted by the correction, technology issues experienced the brunt of the decline. At one point the technology-heavy Nasdaq composite was down 37% from its peak. While the Nasdaq posted a one-year return of 45.93% for the period ended August 31, 2000, this was largely due to the strong performance of technology stocks late in 1999 and in the summer of 2000. However, by the end of the reporting period the Nasdaq was still off 19% from its peak. In contrast, the S&P 500 Index, which also fell during the middle of the period, recovered to the point that it was again nearing its record high by the end of August.
As always, we appreciate your support and we look forward to serving your investment needs in the years to come.
| Sincerely, | |||
 |
 |
||
| David B. Ford
Co-Head, Goldman Sachs Asset Management |
David W. Blood
Co-Head, Goldman Sachs Asset Management |
||
| September 15, 2000 | |||
F U N D B A S I C S
CORESM
U.S. Equity Fund
as of August 31, 2000
| P E R F O R M A N C E R E V I E W | |||||
| August 31, 1999–August 31, 2000 | Fund Total Return (without sales charge)1 | S&P 500 Index2 | |||
| |
|||||
| Class A | 18.96% | 16.32% | |||
| Class B | 18.03 | 16.32 | |||
| Class C | 18.03 | 16.32 | |||
| Institutional | 19.41 | 16.32 | |||
| Service | 18.83 | 16.32 | |||
| |
|||||
| 1 | The net asset value represents the net assets of the Fund (ex-dividend) divided by the total number of shares. The Fund’s performance assumes the reinvestment of dividends and other distributions. | ||||||||
| 2 | The unmanaged S&P 500 Index (with dividends reinvested) figures do not reflect any fees or expenses. In addition, investors cannot invest directly in the Index. | ||||||||
| S T A N D A R D I Z E D T O T A L R E T U R N S 3 | ||||||||
| For the period ended 6/30/00 | Class A | Class B | Class C | Institutional | Service | |||
| |
||||||||
| One Year | 2.03% | 1.78% | 6.04% | 8.36% | 7.82% | |||
| Five Years | 20.22 | N/A | N/A | 22.34 | 21.624 | |||
| Since Inception | 15.76 | 19.60 | 15.63 | 22.68 | 16.504 | |||
| (5/24/91) | (5/1/96) | (8/15/97) | (6/15/95) | (5/24/91) | ||||
| |
||||||||
| 3 | The Standardized Total Returns are average annual total returns or cumulative total returns (only if the performance period is one year or less) as of the most recent calendar quarter-end. They assume reinvestment of all distributions at net asset value. These returns reflect a maximum initial sales charge of 5.5% for Class A shares, the assumed deferred sales charge for Class B shares (5% maximum declining to 0% after six years) and the assumed deferred sales charge for Class C shares (1% if redeemed within 12 months of purchase). Because Institutional and Service shares do not involve a sales charge, such a charge is not applied to their Standardized Total Returns. | |||
| 4 | Performance data for Service shares prior to 6/7/96 is that of Class A shares (excluding the impact of front-end sales charges applicable to Class A shares since Service shares are not subject to any sales charges). Performance of Class A shares of the CORE U.S. Equity Fund reflects the expenses applicable to the Fund’s Class A shares. The fees applicable to Services shares are different from those applicable to Class A shares which impact performance ratings and rankings for a class of shares. | |||
| Total return figures represent past performance and do not indicate future results, which will vary. The investment return and principal value of an investment will fluctuate and, therefore, an investor’s shares, when redeemed, may be worth more or less than their original cost. Performance reflects fee waivers and expense limitations in effect. In their absence, performance would be reduced. | ||||
| T O P 1 0 H O L D I N G S A S O F 8/ 3 1 / 0 0 | |||
| Holding | % of Total Net Assets | Line of Business | |
| |
|||
| General Electric Co. | 4.5 | % | Financial Services |
| Intel Corp. | 3.5 | Semiconductors | |
| Cisco Systems, Inc. | 3.3 | Computer Hardware | |
| Citigroup, Inc. | 2.7 | Banks | |
| Pfizer, Inc. | 2.5 | Drugs | |
| Nortel Networks Corp. | 2.3 | Electrical Equipment | |
| Exxon Mobil Corp. | 2.3 | Energy Resources | |
| Microsoft Corp. | 2.3 | Computer Software | |
| Oracle Corp. | 2.2 | Computer Software | |
| American International Group, Inc. | 1.6 | Property Insurance | |
| |
|||
| The top 10 holdings may not be representative of the Fund’s future investments. | |||
1
P E R F O R M A N C E O V E R V I E W
CORE U.S. Equity Fund
Dear Shareholder,
We are pleased to report on the performance of the Goldman Sachs CORE U.S. Equity Fund for the one year period that ended August 31, 2000.
Performance Review
Over the one-year period that ended August 31, 2000, the Fund’s Class A, B, C, Institutional and Service shares generated total cumulative returns, without sales charges, of 18.96%, 18.03%, 18.03%, 19.41%, and 18.83%, respectively. These figures compare favorably to the 16.32% total cumulative return of the Fund’s benchmark, the S&P 500 Index.
The CORE strategy is a well-defined investment process that has historically provided consistent, risk-managed performance. We seek to buy stocks that are attractively valued and favored by fundamental research analysts, have experienced good momentum and are more stable. The diversification of our models typically adds value, because when one theme doesn’t work, others usually do. For example, when momentum stocks underperform, value stocks typically advance more than average. Portfolios are constructed taking into account stocks’ risk characteristics as well as their expected returns.
Portfolio Positioning
The CORE investment process analyzes each stock based upon its Value and Momentum characteristics as well as a fundamental Research assessment. Over the 12-month period, on average Momentum contributed quite favorably to returns, whereas the return to Value was negative. The Research theme produced strong results during a few months, but overall, the return to Research was flat.
However, during much of the reporting period, our themes produced results that were contrary to what we would expect. This was typically the result of the dramatic shifts in investor preferences and the extreme volatility in the financial markets. For example, during the second quarter, the spread between the daily high and low prices for the S&P 500 index averaged 2.0%, versus the long-term average of 1.2%. In addition, the monthly return dispersion (the spread between the best- and worst-performing stocks) hit its highest level in over 20 years. However, in July and August market volatility decreased substantially and our themes produced results that were closer to our expectations, which enhanced our overall returns during the reporting period.
Portfolio Highlights
The Fund’s best relative performers were stocks in the technology and consumer non-cyclicals sectors. Some examples of particularly strong contributors to relative return include:
2
P E R F O R M A N C E O V E R V I E W

Portfolio Outlook
The market we’ve experienced during the last year has been highly unusual. While this year’s high level of volatility posed challenges, we believe it could positively impact the long-term health of the financial markets by creating a number of investment opportunities. To a great extent, the market’s speculative nature has diminished, and we’re beginning to see a return to more “normal” levels of volatility.
Looking ahead, we continue to believe that cheaper stocks should outpace more expensive ones, good momentum stocks should do better than poor momentum stocks, high-earnings-quality stocks should perform better than those with lower earnings quality as should those favored by research analysts. We anticipate remaining fully invested and expect that the value we add over time will be due to exposures to our investment themes coupled with careful management of portfolio risk.
We thank you for your investment and look forward to your continued confidence.
Goldman Sachs Quantitative Equity Investment Team
New York, September 15, 2000
3
F U N D B A S I C S
CORESM
Large Cap Growth Fund
as of August 31, 2000
| P E R F O R M A N C E R E V I E W | ||||
| August 31, 1999–August 31, 2000 | Fund Total Return (without sales charge)1 | Russell 1000 Growth Index2 | ||
| |
||||
| Class A | 33.73%
|
33.45%
|
||
| Class B | 32.78
|
33.45
|
||
| Class C | 32.84
|
33.45
|
||
| Institutional | 34.34
|
33.45
|
||
| Service | 33.64
|
33.45
|
||
| |
||||
| 1 |
The net asset value represents the net assets of the Fund (ex-dividend) divided by the total number of shares. The Fund’s performance assumes the reinvestment of dividends and other distributions. |
| 2 |
The unmanaged Russell 1000 Growth Index (with dividends reinvested) figures do not reflect any fees or expenses. In addition, investors cannot invest directly in the Index. |
| S TA N D A R D I Z E D T O T A L R E TU R N S 3 | |||||||||||
| For the period ended 6/30/00 | Class A | Class B | Class C | Institutional | Service | ||||||
| |
|||||||||||
| One Year | 18.69%
|
19.62%
|
23.63%
|
26.03 | % | 25.50 | % | ||||
| Five Years | 26.644
|
N/A
|
N/A
|
28.33 | 4 | 27.96 | 4 | ||||
| Since Inception | 21.834
|
26.99
|
23.45
|
22.80 | 4 | 27.59 | 4 | ||||
| (11/11/91)
|
(5/1/97)
|
(8/15/97)
|
(11/11/91) | (11/11/91) | |||||||
| |
|||||||||||
|
3 The Standardized Total Returns are average annual total returns or cumulative total returns (only if the performance period is one year or less) as of the most recent calendar quarter-end. They assume reinvestment of all distributions at net asset value. These returns reflect a maximum initial sales charge of 5.5% for Class A shares, the assumed deferred sales charge for Class B shares (5% maximum declining to 0% after six years) and the assumed deferred sales charge for Class C shares (1% if redeemed within 12 months of purchase). Because Institutional and Service shares do not involve a sales charge, such a charge is not applied to their Standardized Total Returns. |
||||
| 4 Performance data for Institutional and Service shares prior to May 1, 1997 (commencement of operations) is that of Class A shares. Class A share performance for such period is that of a predecessor separate account (which converted into Class A shares) adjusted to reflect the higher fees and expenses applicable to the Fund’s Class A shares. Although the predecessor separate account was managed by Goldman Sachs Asset Management in a manner and pursuant to investment objectives in all material respects equivalent to management and investment objectives of the CORE Large Cap Growth Fund, the separate account was not registered under the Investment Company Act of 1940 (the “Act”) and was not subject to certain investment restrictions imposed by the Act. If it had registered under the Act, performance might have been adversely affected. | ||||
|
Total return figures represent past performance and do not indicate future results, which will vary. The investment return and principal value of an investment will fluctuate and, therefore, an investor’s shares, when redeemed, may be worth more or less than their original cost. Performance reflects fee waivers and expense limitations in effect. In their absence, performance would be reduced. |
||||
|
|
||||
| T O P 1 0 H O L D I N G S A S O F 8 / 3 1 / 0 0 | ||||
| Holding | % of Total Net Assets | Line of Business | ||
| |
||||
| Intel Corp. | 6.8 | % | Semiconductors | |
| General Electric Co. | 6.1 | Financial Services | ||
| Cisco Systems, Inc. | 5.8 | Computer Hardware | ||
| Pfizer, Inc. | 3.5 | Drugs | ||
| Microsoft Corp. | 3.2 | Computer Software | ||
| Oracle Corp. | 3.0 | Computer Software | ||
| Sun Microsystems, Inc. | 2.8 | Computer Hardware | ||
| EMC Corp. | 2.8 | Computer Hardware | ||
| Corning, Inc. | 2.4 | Electrical Equipment | ||
| Merck & Co., Inc. | 1.9 | Drugs | ||
| |
||||
|
The top 10 holdings may not be representative of the Fund’s future investments. |
||||
4
P E R F O R M A N C E O V E R V I E W
CORE Large Cap Growth Fund
Dear Shareholder,
We are pleased to report on the performance of the Goldman Sachs CORE Large Cap Growth Fund for the one year period that ended August 31, 2000.
Performance Review
Over the one-year period that ended August 31, 2000, the Fund’s Class A, B, C, Institutional and Service shares generated total cumulative returns, without sales charges, of 33.73%, 32.78%, 32.84%, 34.34%, and 33.64%, respectively. These figures compare to the 33.45% total cumulative return of the Fund’s benchmark, the Russell 1000 Growth Index.
The CORE strategy is a well-defined investment process that has historically provided consistent, risk-managed performance. We seek to buy stocks that are attractively valued and favored by fundamental research analysts, have experienced good momentum and are more stable. The diversification of our models typically adds value, because when one theme doesn’t work, others usually do. For example, when momentum stocks underperform, value stocks typically advance more than average. Portfolios are constructed taking into account stocks’ risk characteristics as well as their expected returns.
Portfolio Positioning
The CORE investment process analyzes each stock based upon its Value and Momentum characteristics as well as a fundamental Research assessment. During much of the reporting period, our themes produced erratic results, experiencing some of the best and some of the worst months since inception. This was typically the result of the dramatic shifts in investor preferences and the extreme volatility in the financial markets. For example, during the second quarter, the spread between the daily high and low prices for the NASDAQ Composite index averaged 4.3%, versus the long-term average of 1.1%. In addition, the monthly return dispersion (the spread between the best- and worst-performing stocks) hit its highest level in over 20 years. However, in July and August market volatility decreased substantially and our themes produced results that were closer to our expectations.
Portfolio Highlights
The Fund’s best performers were stocks in technology and financial sectors. Some examples of particularly strong contributors to relative return include:
5
P E R F O R M A N C E O V E R V I E W
Portfolio Outlook
Using any number of measures, the market we’ve experienced during the last year has been highly unusual. And while this year’s high level of volatility was difficult for novice and experienced investors alike, we believe it could serve to be a positive for the long-term health of the financial markets, as it created a number of investment opportunities. To a great extent, the very speculative nature of the market that was driving returns has diminished. And we’re already beginning to see a return to more “normal” levels of volatility.
Looking ahead, we continue to believe that cheaper stocks should outpace more expensive ones, good momentum stocks should do better than poor momentum stocks, high-earnings-quality stocks should perform better than those with lower earnings quality as should those favored by research analysts. As such, we anticipate remaining fully invested and expect that the value we add over time will be due to exposures to our investment themes coupled with careful management of portfolio risk.
We thank you for your investment and look forward to your continued confidence.
Goldman Sachs Quantitative Equity Investment Team
New York
September 13, 2000
6
F U N D B A S I C S
CORESM
Small Cap Equity Fund
as of August 31, 2000
| P E R F O R M A N C E R E V I E W | ||||||
| August 31, 1999–August 31, 2000 | Fund Total Return (without sales charge)1 | Russell 2000 Index2 | ||||
| |
||||||
| Class A | 26.10 | % | 27.15 | % | ||
| Class B | 25.17 | 27.15 | ||||
| Class C | 25.35 | 27.15 | ||||
| Institutional | 26.60 | 27.15 | ||||
| Service | 25.93 | 27.15 | ||||
| |
||||||
1
The net asset value represents the net assets of the Fund (ex-dividend) divided by the total number of shares.
The Fund’s performance assumes the reinvestment of dividends and other distributions.
2
The unmanaged Russell 2000 Index (with dividends reinvested) figures do not reflect any fees or expenses.
In addition, investors cannot invest directly in the Index.
| S TA N D A R D I Z E D TO T A L R E T U R N S 3 | |||||||||||||||
| For the period ended 6/30/00 | Class A | Class B | Class C | Institutional | Service | ||||||||||
| |
|||||||||||||||
| One Year | 8.10 | % | 8.49 | % | 12.56 | % | 14.81 | % | 14.26 | % | |||||
| Since Inception | 5.42 | 5.80 | 6.79 | 7.92 | 7.44 | ||||||||||
| (8/15/97) | |||||||||||||||
| |
|||||||||||||||
| 3 | The Standardized Total Returns are average annual total returns or cumulative total returns (only if the performance period is one year or less) as of the most recent calendar quarter-end. They assume reinvestment of all distributions at net asset value. These returns reflect a maximum initial sales charge of 5.5% for Class A shares, the assumed deferred sales charge for Class B shares (5% maximum declining to 0% after six years) and the assumed deferred sales charge for Class C shares (1% if redeemed within 12 months of purchase). Because Institutional and Service shares do not involve a sales charge, such a charge is not applied to their Standardized Total Returns. |
| Total return figures represent past performance and do not indicate future results, which will vary. The investment return and principal value of an investment will fluctuate and, therefore, an investor’s shares, when redeemed, may be worth more or less than their original cost. Performance reflects expense limitations in effect. In their absence, performance would be reduced. |
| T O P 1 0 H O L D I N G S A S O F 8 / 3 1 / 0 0 | |||
| Holding | % of Total Net Assets | Line of Business | |
| |
|||
| Silicon Valley Bancshares | 0.9 | % | Banks |
| CMP Group, Inc. | 0.7 | Electrical Utilities | |
| Precision Castparts Corp. | 0.7 | Defense/Aerospace | |
| RGS Energy Group, Inc. | 0.7 | Electrical Utilities | |
| C&D Technologies, Inc. | 0.6 | Heavy Electrical | |
| Bindley Western Industries, Inc. | 0.6 | Drugs | |
| Pulitzer, Inc. | 0.6 | Publishing | |
| MRV Communications, Inc. | 0.6 | Electrical Equipment | |
| Exar Corp. | 0.6 | Semiconductors | |
| The Dexter Corp. | 0.6 | Chemicals | |
| |
|||
|
The top 10 holdings may not be representative of the Fund’s future investments. |
|||
|
7 |
|||
P E R F O R M A N C E O V E R V I E W
CORE Small Cap Equity Fund
Dear Shareholder,
We are pleased to report on the performance of the Goldman Sachs CORE Small Cap Equity Fund for the one year period that ended August 31, 2000.
Performance Review
Over the one-year period that ended August 31, 2000, the Fund’s Class A, B, C, Institutional and Service shares generated cumulative total returns, without sales charges, of 26.10%, 25.17%, 25.35%, 26.60%, and 25.93%, respectively. These figures compare to the 27.15% cumulative total return of the Fund’s benchmark, the Russell 2000 Index.
The CORE strategy is a well-defined investment process that has historically provided consistent, risk-managed performance. We seek to buy stocks that are attractively valued and favored by fundamental research analysts, have experienced good momentum and are more stable. These themes are considered relative to the Russell 2000 Index. The diversification of our models typically adds value, because when one theme doesn’t work, others usually do. For example, when momentum stocks underperform, value stocks typically advance more than average. Portfolios are constructed taking into account stocks’ risk characteristics as well as their expected returns.
Portfolio Positioning
The CORE investment process analyzes each stock based upon its Value and Momentum Risk characteristics as well as a fundamental Research assessment. During the first part of the reporting period, Momentum produced results that were highly contrary to what we would expect, whereas returns to Research were extremely positive. In very late 1999 and early 2000, Value experienced its biggest shortfall since the inception of our data. Late in the period, growth and value jockeyed back and forth, and overall value produced much better results than early on. This was typically the result of the dramatic shifts in investor preferences and the extreme volatility in the financial markets. For example, during the second quarter, the spread between the daily high and low prices for the S&P 500 index averaged 2.0%, versus the long-term average of 1.2%. In addition, the monthly return dispersion (the spread between the best- and worst-performing stocks) hit its highest level in over 20 years. However, in July and August market volatility decreased substantially and our themes produced results that were closer to our expectations.
8
P E R F O R M A N C E O V E R V I E W
Portfolio Highlights
The Fund’s holdings beat their sector peers by the widest margin in the consumer services, basic materials and utilities sectors. Some examples of the biggest contributors to active returns included:
| § | Health care companies Quest Diagnostics (up 183%), Millenium Pharmaceuticals (up 279%), and Alpharma Inc. (up 68%). |
| § | Technology stocks Peregrine Systems (up 110%) and Sawtek (up 74%) |
| § | Utility company Avista Corp. (up170%) |
Portfolio Outlook
Using any number of measures, the market we’ve experienced during the last year has been highly unusual. And while this year’s high level of volatility was difficult for novice and experienced investors alike, we believe it could serve to be a positive for the long-term health of the financial markets, as it created a number of investment opportunities. To a great extent, the very speculative nature of the market that was driving returns has diminished. And we’re already beginning to see a return to more “normal” levels of volatility.
| Looking ahead, we continue to believe that cheaper stocks should outpace more expensive ones, good momentum stocks should do better than poor momentum stocks, high-earnings-quality stocks should perform better than those with lower earnings quality as should those favored by research analysts. As such, we anticipate remaining fully invested and expect that the value we add over time will be due to exposures to our investment themes coupled with careful management of portfolio risk. | |
| We thank you for your investment and look forward to your continued confidence. | |
| Goldman Sachs Quantitative Equity Investment Team | |
| New York
September 13, 2000 |
9
F U N D B A S I C S
CORESM
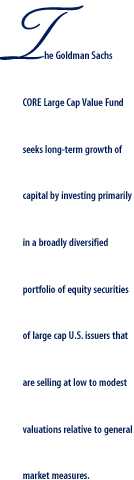
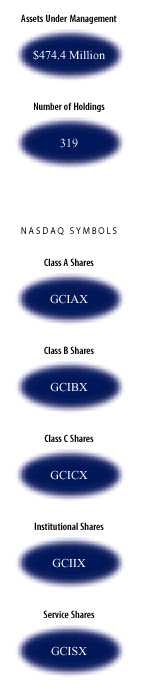
Large Cap Value Fund
as of August 31, 2000
| P E R F O R M A N C E R E V I E W | ||||
| August 31, 1999–August 31, 2000 | Fund Total Return (without sales charge)1 | Russell 1000 Value Index2 | ||
| |
||||
| Class A | 4.68% | 4.15% | ||
| Class B | 3.96 | 4.15 | ||
| Class C | 3.97 | 4.15 | ||
| Institutional | 5.20 | 4.15 | ||
| Service | 4.60 | 4.15 | ||
| |
||||
| 1 | The net asset value represents the net assets of the Fund (ex-dividend) divided by the total number of shares. The Fund’s performance assumes the reinvestment of dividends and other distributions. |
| 2 | The unmanaged Russell 1000 Value Index (with dividends reinvested) figures do not reflect any fees or expenses. In addition, investors cannot invest directly in the Index. |
| S TA N D A R D I Z E D T O T A L R ET U R N S 3 | ||||||||
| For the period ended 6/30/00 | Class A | Class B | Class C | Institutional | Service | |||
| |
||||||||
| One Year | –14.31% | –14.47% | –10.78% | –8.95% | –9.38% | |||
| Since Inception | –2.01 | –1.74 | 1.02 | 2.11 | 1.63 | |||
| (12/31/98) | ||||||||
| |
||||||||
| 3 | The Standardized Total Returns are average annual total returns or cumulative total returns (only if the performance period is one year or less) as of the most recent calendar quarter-end. They assume reinvestment of all distributions at net asset value. These returns reflect a maximum initial sales charge of 5.5% for Class A shares, the assumed deferred sales charge for Class B shares (5% maximum declining to 0% after six years) and the assumed deferred sales charge for Class C shares (1% if redeemed within 12 months of purchase). Because Institutional and Service shares do not involve a sales charge, such a charge is not applied to their Standardized Total Returns. |
| Total return figures represent past performance and do not indicate future results, which will vary. The investment return and principal value of an investment will fluctuate and, therefore, an investor’s shares, when redeemed, may be worth more or less than their original cost. Performance reflects expense limitations in effect. In their absence, performance would be reduced. |
| T O P 1 0 H O L D I N G S A S O F 8/ 3 1 / 0 0 | ||
| Holding | % of Total Net Assets | Line of Business |
| |
||
| Citigroup, Inc. | 4.8% | Banks |
| Exxon Mobil Corp. | 4.1 | Energy Resources |
| Johnson & Johnson | 2.5 | Medical Products |
| American International Group Inc. | 2.2 | Property Insurance |
| Verizon Communications | 2.2 | Telephone |
| AT&T Corp. | 2.1 | Telephone |
| Morgan Stanley Dean Witter & Co. | 1.9 | Security/Asset Managment |
| SBC Communications, Inc. | 1.9 | Telephone |
| Bank of America Corp. | 1.7 | Banks |
| The Walt Disney Co. | 1.7 | Entertainment |
| |
||
|
The top 10 holdings may not be representative of the Fund’s future investments. |
||
10
P E R F O R M A N C E O V E R V I E W
CORE Large Cap Value Fund
Dear Shareholder,
We are pleased to report on the performance of the Goldman Sachs CORE Large Cap Value Fund for the one year period that ended August 31, 2000.
Performance Review
Over the one-year period that ended August 31, 2000, the Fund’s Class A, B, C, Institutional and Service shares generated cumulative total returns, without sales charges, of 4.68%, 3.96%, 3.97%, 5.20%, and 4.60%, respectively. These figures compare to the 4.15% cumulative total return of the Fund’s benchmark, the Russell 1000 Value Index.
The CORE strategy is a well-defined investment process that has historically provided consistent, risk-managed performance. We seek to buy stocks that are attractively valued and favored by fundamental research analysts, have experienced good momentum and are more stable. These themes are considered relative to the Russell 1000 Value Index. The diversification of our models typically adds value, because when one theme doesn’t work, others usually do. For example, when momentum stocks underperform, value stocks typically advance more than average. Portfolios are constructed taking into account stocks’ risk characteristics as well as their expected returns.
As the Fund’s returns indicate, large-cap value stocks did not produce exceptionally strong results during the report period. In the first part of the period a small handful of growth stocks — mostly in the technology sector — led the market. As such, value stocks lagged their growth stock counterparts. However, the market correction that occurred this spring drew investors back to the compelling valuations offered by many value offerings. In fact, during five of the first eight months of 2000 value stocks outperformed growth stocks. Yet, growth stocks produced such strong results in the three months they led the market that they have outperformed value stocks by almost seven percentage points for the year-to-date period that ended August 31, 2000.
Portfolio Positioning
The CORE investment process analyzes each stock based upon its Value and Momentum characteristics as well as a fundamental Research assessment. During much of the reporting period our themes produced erratic results, experiencing some of the best and some of the worst months since inception. This was typically the result of the dramatic shifts in investor preferences and the extreme volatility in the financial markets. For example, during the second quarter, the spread between the daily high and low prices for the S&P 500 index averaged 2.0%, versus the long-term average of 1.2%. In addition, the monthly return dispersion (the spread between the best- and worst-performing stocks) hit its highest level in over 20 years. However, in July and August market volatility decreased substantially. Over the 12-month period, only the Research theme experienced negative returns within the Value universe. Returns to Value theme were flat during the period.
11
PERFORMANCE OVERVIEW
Portfolio Highlights
The Fund’s best performers were stocks in the financial, consumer cyclical, telecommunications and consumer non-cyclical sectors. Some examples of particularly strong contributors to relative return include:
| § | Telecommunications company BCE Inc. (up 116%). |
| § | Utility firm Calpine Corp. (up 337%) |
| § | Financial services holding Lehman Brothers (up 164%). |
Portfolio Outlook
Using any number of measures, the market we’ve experienced during the last year has been highly unusual. And while this year’s high level of volatility was difficult for novice and experienced investors alike, we believe it could serve to be a positive for the long-term health of the financial markets, as it created a number of investment opportunities. To a great extent, the very speculative nature of the market that was driving returns has diminished. And we’re already beginning to see a return to more “normal” levels of volatility.
Looking ahead, we continue to believe that cheaper stocks should outpace more expensive ones, good momentum stocks should do better than poor momentum stocks, high-earnings-quality stocks should perform better than those with lower earnings quality as should those favored by research analysts. As such, we anticipate remaining fully invested and expect that the value we add over time will be due to exposures to our investment themes coupled with careful management of portfolio risk.
| We thank you for your investment and look forward to your continued confidence. |
| Goldman Sachs Quantitative Equity Investment Team |
| New York
September 13, 2000 |
12
F U N D B A S I C S
CORESM
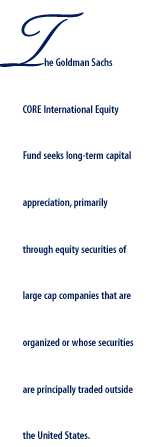
International Equity Fund
as of August 31, 2000
| P E R F O R M A N C E R E V I E W | ||||
| August 31, 1999–August 31, 2000 | Fund Total Return (without sales charge)1 | MSCI Gross EAFE Index2 | ||
| |
||||
| Class A | 6.92% | 9.81% | ||
| Class B | 6.36 | 9.81 | ||
| Class C | 6.34 | 9.81 | ||
| Institutional | 7.62 | 9.81 | ||
| Service | 7.05 | 9.81 | ||
| |
||||
1 The net asset value represents the net assets of the Fund (ex-dividend) divided by the total number of shares. The Fund’s performance assumes the reinvestment of dividends and other distributions.
2 The unmanaged Morgan Stanley Capital International (MSCI) Gross Europe, Australasia, Far East (EAFE) Index (with dividends reinvested) is a market capitalization weighted composite of securities in 21 developed markets, including Australia, Austria, Belgium, Denmark, Finland, Germany, Hong Kong, Ireland, Italy, Japan and the United Kingdom. Total returns are calculated without dividends reinvested. Investors cannot invest directly in the Index. The Index figures do not reflect any fees or expenses.
| S T A N D A R D I Z E D T O T A L R E T U R N S 3 | ||||||||||
| For the period ended 6/30/00 | Class A | Class B | Class C | Institutional | Service | |||||
| |
||||||||||
| One Year | 7.70% | 8.22% | 12.39% | 14.75% | 14.20% | |||||
| Since Inception | 4.76 | 5.39 | 6.37 | 7.54 | 7.04 | |||||
| (8/15/97) | ||||||||||
| |
||||||||||
|
3 The Standardized Total Returns are average annual total returns or cumulative total returns (only if the performance period is one year or less) as of the most recent calendar quarter-end. They assume reinvestment of all distributions at net asset value. These returns reflect a maximum initial sales charge of 5.5% for Class A shares, the assumed deferred sales charge for Class B shares (5% maximum declining to 0% after six years) and the assumed deferred sales charge for Class C shares (1% if redeemed within 12 months of purchase). Because Institutional and Service shares do not involve a sales charge, such a charge is not applied to their Standardized Total Returns. |
||||
| Total return figures represent past performance and do not indicate future results, which will vary. The investment return and principal value of an investment will fluctuate and, therefore, an investor’s shares, when redeemed, may be worth more or less than their original cost. Performance reflects expense limitations in effect. In their absence, performance would be reduced. | ||||
| T O P 1 0 H O L D I N G S A S O F 8 / 31 / 00 | ||||
| Holding | % of Total Net Assets | Line of Business | ||
| |
||||
| Royal Dutch Petroleum Co. | 3.2 | % | Energy Resources | |
| Telefonica de Espana SA | 2.9 | Telecommunications | ||
| Siemens AG | 2.4 | Electrical Equipment | ||
| Nokia Oyj | 2.2 | Telecommunications | ||
| ING Groep NV | 2.1 | Financial Services | ||
| Koninklijke Royal Phillips Electronics NV | 1.9 | Appliance | ||
| Toyota Motor Corp. | 1.8 | Auto | ||
| Nippon Telephone & Telegraphic Corp. | 1.7 | Telecommunications | ||
| Allianz AG | 1.7 | Insurance | ||
| Deutsche Telekom AG | 1.6 | Telecommunications | ||
The top 10 holdings may not be representative of the Fund’s future investments.
13
P E R F O R M A N C E O V E R V I E W
CORE International Equity Fund
Dear Shareholder,
We are pleased to report on the performance of the Goldman Sachs CORE International Equity Fund for the one year period that ended August 31, 2000.
Performance Review
During the one-year period that ended August 31, 2000, the Fund’s Class A, B, C, Institutional and Service shares generated cumulative total returns, without sales charges, of 6.92%, 6.36%, 6.34%, 7.62%, and 7.05%, respectively. These figures compare to the 9.81% cumulative total return of the Fund’s benchmark, the Morgan Stanley Capital International (MSCI) Europe, Australia, Far East (EAFE) Index.
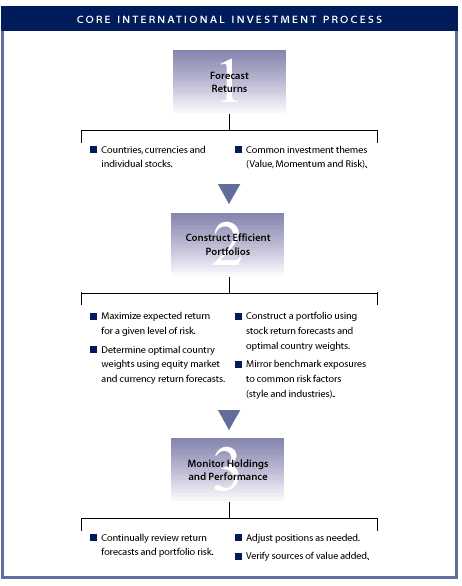
The CORE strategy is designed to add value at both the country and security level by focusing on three categories of investment themes — Relative Value, Momentum and Low Risk. Each strategy is based on sound economic reasoning and then validated through rigorous empirical research. These strategies are combined to form views on the countries and stocks in our investment universe. Our approach seeks to identify attractive equity markets, and attractive stocks within those markets, while managing the amount of risk relative to a specified benchmark. The goal of our portfolio construction process is to maximize exposure to our model’s return forecasts while mitigating unintended active risks.
Regional Allocations
In general, the Fund benefited from our strategy’s country tilts, especially an underweight position in the UK, which lagged most of the other countries in the index. In addition, a tilt towards Germany helped the Fund, although a small underexposure in Finland detracted from performance over the period.
Sector Allocations
Our strategy remains sector neutral within countries, so that sector tilts within the portfolio are residual to country allocation decisions. Among the strongest performing sectors were the Telecommunications and Consumer Discretionary sectors, while the Utilities sector generated the weakest results. During the reporting period stock selection was generally weakest within the Information Technology sector, and strongest within the Health Care sector.
Stock Selection
The portfolio lagged the benchmark primarily due to stock selection within countries, particularly within France and the UK. Despite good stock selection within the Netherlands, Italy and Switzerland, the overall portfolio was hampered by a difficult environment for our investment themes during this period. Over the long-term, we expect our focus on stocks with good momentum and value characteristics, as well as favorable risk profiles, should identify stocks that will outperform the index.
14
P E R F O R M A N C E O V E R V I E W
Portfolio Outlook
As always, the Fund remains substantially invested in stocks, and our general portfolio characteristics are targeted to stay relatively close to that of the MSCI EAFE index. Based on our investment strategy, we will continue to emphasize a diversified portfolio of stocks with strong value and momentum characteristics while managing the overall risk profile.
We thank you for your investment and look forward to your continued confidence.
Goldman Sachs Quantitative Equity Investment Team
New York
September 15, 2000
15
G O L D M A N S A C H S C O R E E Q U I T Y F U N D S
The Goldman Sachs Advantage
Founded in 1869, Goldman, Sachs & Co. is a premier financial services firm traditionally known on Wall Street and around the world for its institutional expertise.
Today, the firm’s Investment Management Division provides individual investors the opportunity to tap the resources of a global institutional powerhouse — and put this expertise to work in their individual portfolios .
What Sets Goldman Sachs Funds Apart?
To learn more about the Goldman Sachs Funds, call your investment professional today.
16
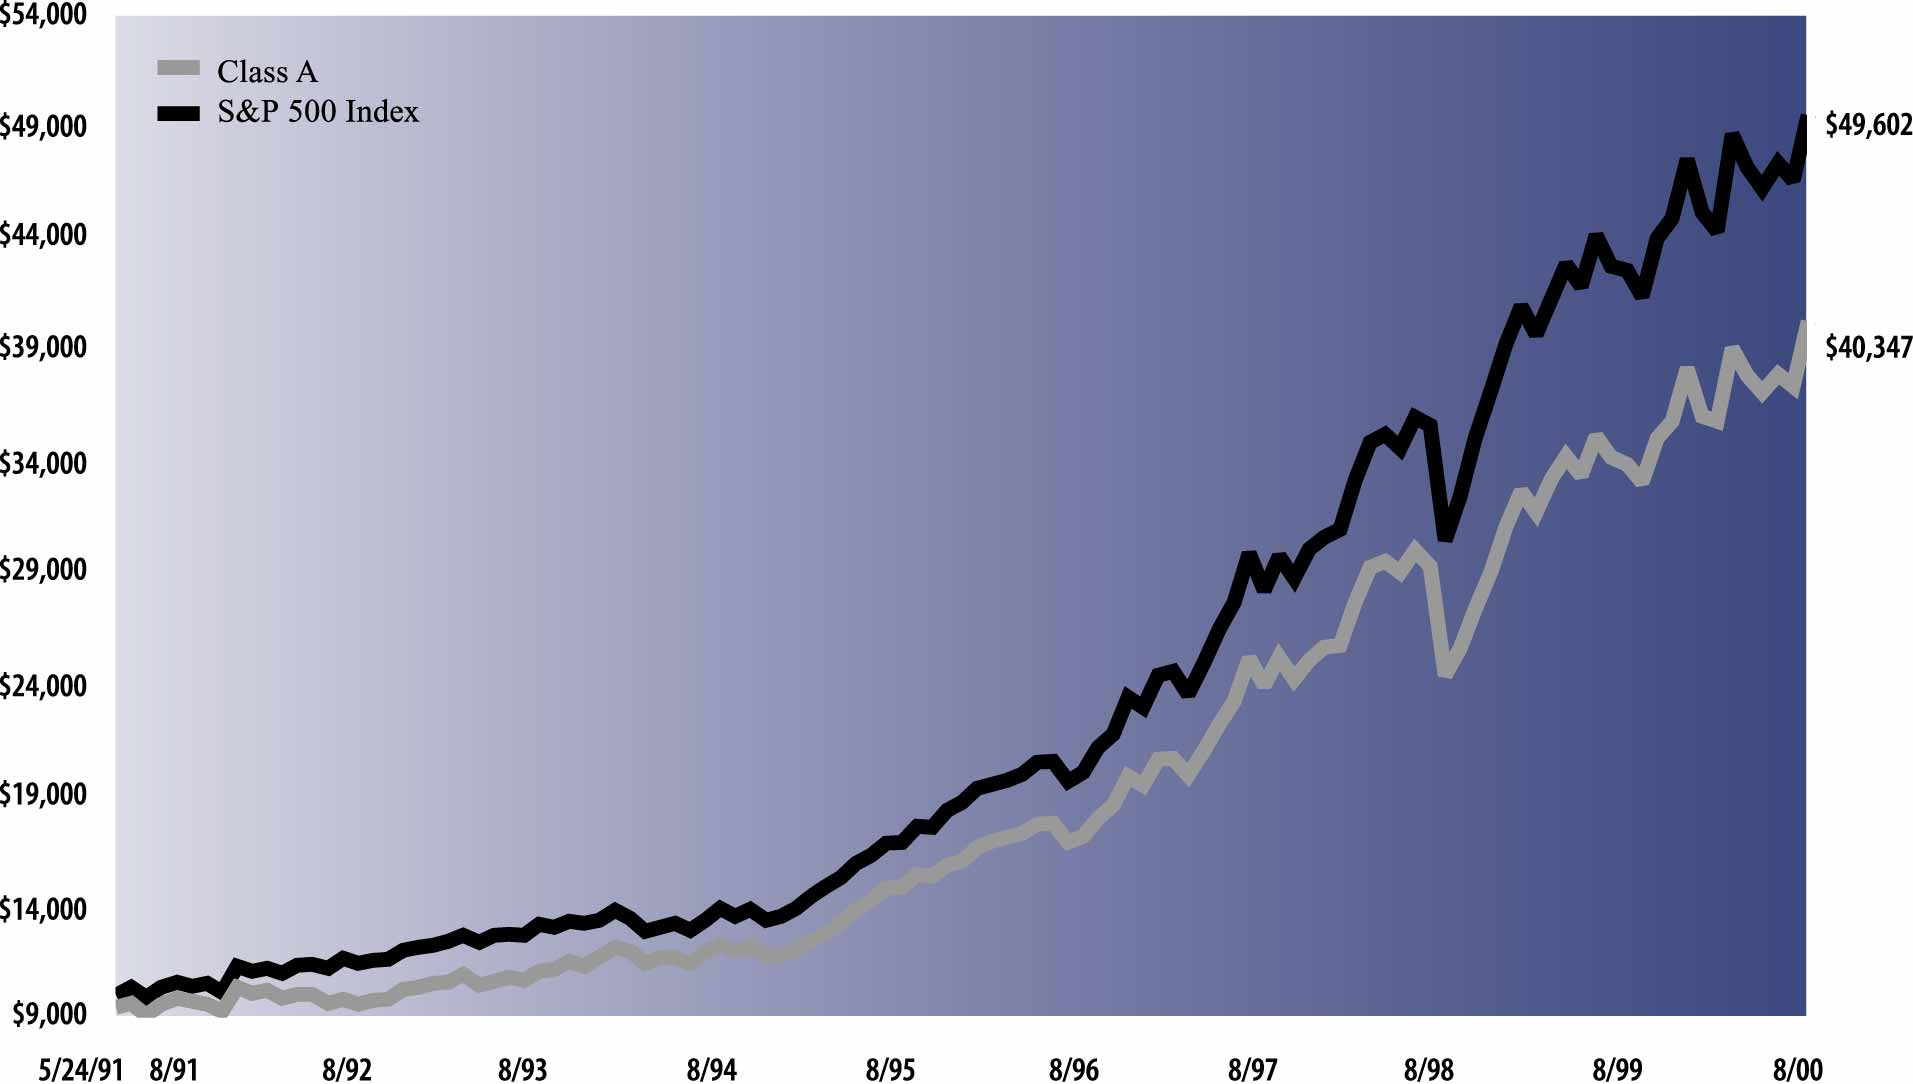
| The following graph shows the value, as of August 31, 2000, of a $10,000 investment made on May 24, 1991 (commencement of
operations) in Class A shares (maximum sales charge of 5.5%) of the Goldman Sachs CORE U.S. Equity Fund. For comparative purposes, the performance of the Fund’s benchmark (the Standard and Poor’s 500 Index with dividends reinvested (“S&
P 500 Index”)) is shown. This performance data represents past performance and should not be considered indicative of future performance which will fluctuate with changes in market conditions. These performance fluctuations will cause an
investor’s shares, when redeemed, to be worth more or less than their original cost. Performance of Class B, Class C, Institutional and Service shares will vary from Class A due to differences in fees and loads.
|
| CORE U.S. Equity Fund’s Lifetime Performance
|
| Growth of a $10,000 Investment, Distributions Reinvested May 24, 1991 to August 31, 2000.
|
 |
| Average Annual Total Return through August 31, 2000 | Since Inception | Five Years | One Year | ||||
|---|---|---|---|---|---|---|---|
| Class A (commenced May 24, 1991) | |||||||
| Excluding sales charges | 16.92% | 22.05% | 18.96% | ||||
| Including sales charges | 16.22% | 20.68% | 12.42% | ||||
| |
|||||||
| Class B (commenced May 1, 1996) | |||||||
| Excluding contingent deferred sales charges | 20.75% | n/a | 18.03% | ||||
| Including contingent deferred sales charges | 20.43% | n/a | 12.49% | ||||
| |
|||||||
| Class C (commenced August 15, 1997) | |||||||
| Excluding contingent deferred sales charges | 16.97% | n/a | 18.03% | ||||
| Including contingent deferred sales charges | 16.97% | n/a | 16.92% | ||||
| |
|||||||
| Institutional Class (commenced June 15, 1995) | 23.32% | 22.71% | 19.41% | ||||
| |
|||||||
| Service Class (commenced June 7, 1996) | 21.32% | n/a | 18.83% | ||||
| |
|||||||
|
Shares |
Description | Value | ||||
|---|---|---|---|---|---|---|
| Common Stocks – 99.7% | ||||||
| Airlines – 0.4% | ||||||
| 70,800 | Delta Air Lines, Inc. | $ 3,504,600 | ||||
| 51,000 | UAL Corp. | 2,435,250 | ||||
| 5,939,850 | ||||||
| Banks – 6.5% | ||||||
| 189,562 | Bank of America Corp. | 10,153,415 | ||||
| 669,000 | Citigroup, Inc. | 39,052,875 | ||||
| 29,250 | Fifth Third Bancorp | 1,350,984 | ||||
| 106,900 | Firstar Corp. | 2,552,237 | ||||
| 244,500 | FleetBoston Financial Corp. | 10,437,094 | ||||
| 119,100 | Mellon Financial Corp. | 5,389,275 | ||||
| 90,100 | PNC Financial Services Group | 5,310,269 | ||||
| 72,500 | SunTrust Banks, Inc. | 3,579,687 | ||||
| 200,150 | The Chase Manhattan Corp. | 11,183,381 | ||||
| 124,500 | Wells Fargo & Co. | 5,376,844 | ||||
| 94,386,061 | ||||||
| Chemicals – 1.5% | ||||||
| 43,000 | Aptargroup, Inc. | 1,002,438 | ||||
| 25,400 | Avery Dennison Corp. | 1,373,187 | ||||
| 73,400 | Minnesota Mining & Manufacturing
Co. |
6,826,200 | ||||
| 22,200 | PPG Industries, Inc. | 899,100 | ||||
| 26,400 | Praxair, Inc. | 1,168,200 | ||||
| 391,700 | The Dow Chemicals Co. | 10,257,644 | ||||
| 21,526,769 | ||||||
| Clothing – 0.3% | ||||||
| 231,800 | The Limited, Inc. | 4,636,000 | ||||
| Computer Hardware – 9.6% | ||||||
| 176,900 | Apple Computer, Inc.* | 10,779,844 | ||||
| 42,200 | Cabletron Systems, Inc.* | 1,579,863 | ||||
| 690,800 | Cisco Systems, Inc.* | 47,406,150 | ||||
| 69,500 | Dell Computer Corp.* | 3,031,937 | ||||
| 196,000 | EMC Corp.* | 19,208,000 | ||||
| 150,100 | Hewlett-Packard Co. | 18,124,575 | ||||
| 79,300 | Network Appliance, Inc.* | 9,278,100 | ||||
| 56,943 | Palm, Inc.* | 2,505,492 | ||||
| 22,500 | SanDisk Corp.* | 1,878,750 | ||||
| 80,800 | Seagate Technology, Inc.* | 4,797,500 | ||||
| 157,900 | Sun Microsystems, Inc.* | 20,043,431 | ||||
| 138,633,642 | ||||||
| Computer Software – 7.0% | ||||||
| 14,500 | Adobe Systems, Inc. | 1,885,000 | ||||
| 129,200 | International Business Machines,
Inc. |
17,054,400 | ||||
| 470,500 | Microsoft Corp.* | 32,846,781 | ||||
| 346,100 | Oracle Corp.* | 31,473,469 | ||||
| 9,100 | Sabre Holdings Corp. | 253,662 | ||||
| 14,800 | Sapient Corp.* | 777,000 | ||||
| 22,400 | Siebel Systems, Inc.* | 4,431,000 | ||||
| 101,900 | VERITAS Software Corp.* | 12,285,319 | ||||
| 101,006,631 | ||||||
| Construction – 0.1% | ||||||
| 43,700 | Fluor Corp. | 1,308,269 | ||||
|
Shares |
Description | Value | ||||
|---|---|---|---|---|---|---|
| Common Stocks – (continued) | ||||||
| Consumer Durables – 0.5% | ||||||
| 68,100 | Sherwin-Williams Co. | $ 1,566,300 | ||||
| 132,800 | Whirlpool Corp. | 5,046,400 | ||||
| 6,612,700 | ||||||
| Defense/Aerospace – 0.7% | ||||||
| 22,400 | Northrop Grumman Corp. | 1,743,000 | ||||
| 153,200 | The Boeing Co. | 8,215,350 | ||||
| 9,958,350 | ||||||
| Department Store – 2.2% | ||||||
| 234,600 | Federated Department Stores, Inc.* | 6,480,825 | ||||
| 61,700 | Sears, Roebuck & Co. | 1,924,269 | ||||
| 217,400 | Target Corp. | 5,054,550 | ||||
| 373,800 | Wal-Mart Stores, Inc. | 17,732,137 | ||||
| 31,191,781 | ||||||
| Drugs – 7.6% | ||||||
| 156,300 | Allergan, Inc. | 11,429,437 | ||||
| 141,700 | Amgen, Inc.* | 10,742,631 | ||||
| 25,100 | Bristol-Myers Squibb Co. | 1,330,300 | ||||
| 44,200 | Cardinal Health, Inc. | 3,616,113 | ||||
| 14,500 | Celera Genomics* | 1,572,344 | ||||
| 31,200 | Chiron Corp.* | 1,686,750 | ||||
| 58,600 | Eli Lilly & Co. | 4,277,800 | ||||
| 18,200 | Genentech, Inc.* | 3,467,100 | ||||
| 57,600 | MedImmune, Inc.* | 4,845,600 | ||||
| 284,100 | Merck & Co., Inc. | 19,851,487 | ||||
| 23,200 | Millennium Pharmaceuticals* | 3,320,500 | ||||
| 22,500 | PE Corp-PE Biosystems Group | 2,213,438 | ||||
| 848,750 | Pfizer, Inc. | 36,708,437 | ||||
| 87,873 | Pharmacia Corp. | 5,146,063 | ||||
| 110,208,000 | ||||||
| Electrical Equipment – 6.5% | ||||||
| 117,000 | ADC Telecommunications, Inc.* | 4,789,687 | ||||
| 17,200 | Advanced Fibre Communications, Inc.* | 909,181 | ||||
| 8,600 | CIENA Corp.* | 1,906,512 | ||||
| 67,700 | Corning, Inc. | 22,201,369 | ||||
| 188,900 | General Dynamics Corp. | 11,888,894 | ||||
| 105,600 | Lucent Technologies, Inc. | 4,415,400 | ||||
| 44,300 | Motorola, Inc. | 1,597,569 | ||||
| 413,081 | Nortel Networks Corp. | 33,691,919 | ||||
| 31,800 | QUALCOMM, Inc.* | 1,904,025 | ||||
| 50,000 | Scientific-Atlanta, Inc. | 3,896,875 | ||||
| 19,400 | Teradyne, Inc. | 1,257,363 | ||||
| 26,500 | Terayon Communication Systems, Inc. | 1,470,750 | ||||
| 91,500 | Vishay Intertechnology, Inc.* | 3,688,594 | ||||
| 93,618,138 | ||||||
| Electrical Utilities – 2.2% | ||||||
| 117,800 | Calpine Corp.* | 11,662,200 | ||||
| 42,200 | Constellation Energy Group | 1,614,150 | ||||
| 67,400 | Duke Energy Corp. | 5,042,362 | ||||
| 48,400 | Dynegy, Inc. | 2,178,000 | ||||
| 50,000 | FPL Group, Inc. | 2,668,750 | ||||
| 122,700 | Public Service Enterprise | 4,447,875 | ||||
| 78,200 | Unicom Corp. | 3,572,763 | ||||
| 31,186,100 | ||||||
|
Shares |
Description | Value | ||||
|---|---|---|---|---|---|---|
| Common Stocks – (continued) | ||||||
| Energy Resources – 5.3% | ||||||
| 39,900 | Apache Corp. | $ 2,513,700 | ||||
| 122,300 | Chevron Corp. | 10,334,350 | ||||
| 72,300 | Enron Corp. | 6,136,462 | ||||
| 408,358 | Exxon Mobil Corp. | 33,332,222 | ||||
| 39,100 | Kerr-McGee Corp. | 2,470,631 | ||||
| 24,500 | Phillips Petroleum Co. | 1,515,938 | ||||
| 339,700 | Royal Dutch Petroleum Co. ADR | 20,785,394 | ||||
| 77,088,697 | ||||||
| Entertainment – 1.2% | ||||||
| 271,600 | The Walt Disney Co. | 10,575,425 | ||||
| 93,200 | Viacom, Inc. Class B* | 6,273,525 | ||||
| 16,848,950 | ||||||
| Financial Services – 5.8% | ||||||
| 43,500 | American Express Co. | 2,571,937 | ||||
| 99,200 | Comdisco, Inc. | 2,380,800 | ||||
| 68,900 | Federal National Mortgage Assn. | 3,703,375 | ||||
| 1,120,500 | General Electric Co. | 65,759,344 | ||||
| 60,900 | Marsh & McLennan Cos., Inc. | 7,231,875 | ||||
| 18,500 | Providian Financial Corp. | 2,126,344 | ||||
| 83,773,675 | ||||||
| Food & Beverage – 3.9% | ||||||
| 243,416 | Archer-Daniels-Midland Co. | 2,145,106 | ||||
| 168,800 | ConAgra, Inc. | 3,091,150 | ||||
| 41,300 | General Mills, Inc. | 1,326,762 | ||||
| 50,800 | H.J. Heinz Co. | 1,936,750 | ||||
| 88,500 | IBP, Inc. | 1,421,531 | ||||
| 346,000 | Nabisco Group Holdings Corp. | 9,709,625 | ||||
| 192,400 | Nabisco Holdings Corp. | 10,281,375 | ||||
| 385,400 | PepsiCo., Inc. | 16,427,675 | ||||
| 58,000 | Supervalu, Inc. | 866,375 | ||||
| 94,800 | The Coca-Cola Co. | 4,988,850 | ||||
| 73,900 | The Pepsi Bottling Group, Inc. | 2,346,325 | ||||
| 22,000 | The Quaker Oats Co. | 1,494,625 | ||||
| 56,036,149 | ||||||
| Forest – 0.4% | ||||||
| 153,100 | Georgia-Pacific Group | 4,095,425 | ||||
| 28,300 | Kimberly-Clark Corp. | 1,655,550 | ||||
| 5,750,975 | ||||||
| Gold – 0.1% | ||||||
| 115,500 | Barrick Gold Corp. | 1,840,781 | ||||
| Grocery – 0.4% | ||||||
| 63,034 | Safeway, Inc.* | 3,108,364 | ||||
| 101,400 | The Kroger Co.* | 2,300,513 | ||||
| 5,408,877 | ||||||
| Heavy Electrical – 0.3% | ||||||
| 63,100 | Emerson Electric Co. | 4,176,431 | ||||
| Home Products – 0.5% | ||||||
| 70,300 | Colgate-Palmolive Co. | 3,580,906 | ||||
| 1 | Energizer Holdings, Inc.* | 20 | ||||
| 95,600 | Fortune Brands, Inc. | 2,437,800 | ||||
|
Shares |
Description | Value | ||||
|---|---|---|---|---|---|---|
| Common Stocks – (continued) | ||||||
| Home Products – (continued) | ||||||
| 46,800 | Ralston Purina Group | $ 1,058,850 | ||||
| 7,077,576 | ||||||
| Hotels – 0.2% | ||||||
| 152,000 | Park Place Entertainment Corp.* | 2,232,500 | ||||
| Industrial Parts – 1.6% | ||||||
| 72,100 | Ingersoll-Rand Co. | 3,285,056 | ||||
| 54,600 | Parker-Hannifin Corp. | 1,900,762 | ||||
| 227,186 | Tyco International Ltd. | 12,949,602 | ||||
| 89,300 | United Technologies Corp. | 5,575,669 | ||||
| 23,711,089 | ||||||
| Industrial Services – 0.4% | ||||||
| 126,400 | Hertz Corp. | 3,871,000 | ||||
| 69,600 | Robert Half International, Inc.* | 2,214,150 | ||||
| 6,085,150 | ||||||
| Information Services – 0.8% | ||||||
| 73,500 | Automatic Data Processing, Inc. | 4,382,437 | ||||
| 19,400 | Computer Sciences Corp.* | 1,533,813 | ||||
| 36,600 | Electronic Data Systems Corp. | 1,823,138 | ||||
| 83,500 | First Data Corp. | 3,981,906 | ||||
| 11,721,294 | ||||||
| Internet – 1.5% | ||||||
| 245,900 | America Online, Inc.* | 14,415,888 | ||||
| 57,700 | Yahoo!, Inc.* | 7,010,550 | ||||
| 21,426,438 | ||||||
| Leisure – 0.8% | ||||||
| 181,800 | Eastman Kodak Co. | 11,317,050 | ||||
| Life Insurance – 1.6% | ||||||
| 34,400 | AFLAC, Inc. | 1,857,600 | ||||
| 25,800 | American General Corp. | 1,878,563 | ||||
| 84,000 | Cigna Corp. | 8,169,000 | ||||
| 112,300 | UnitedHealth Group, Inc. | 10,612,350 | ||||
| 22,517,513 | ||||||
| Media – 2.1% | ||||||
| 116,800 | Fox Entertainment Group, Inc.* | 3,379,900 | ||||
| 325,200 | General Motors Corp. Class H* | 10,772,250 | ||||
| 116,500 | Infinity Broadcasting Corp.* | 4,412,437 | ||||
| 140,500 | Time Warner, Inc. | 12,012,750 | ||||
| 30,577,337 | ||||||
| Medical Products – 2.3% | ||||||
| 75,700 | Abbott Laboratories | 3,311,875 | ||||
| 18,900 | Bausch & Lomb, Inc. | 675,675 | ||||
| 63,400 | Baxter International, Inc. | 5,278,050 | ||||
| 240,400 | Johnson & Johnson | 22,101,775 | ||||
| 25,600 | Medtronic, Inc. | 1,312,000 | ||||
| 32,679,375 | ||||||
| Medical Providers – 0.2% | ||||||
| 197,300 | Beverly Enterprises, Inc.* | 1,023,494 | ||||
| 67,400 | HCA-The Healthcare Corp. | 2,325,300 | ||||
|
Shares |
Description |
Value |
||||
|---|---|---|---|---|---|---|
| Common Stocks – (continued) | ||||||
| Medical Providers – (continued) | ||||||
| 1 | Lifepoint Hospitals, Inc.* | $ 30 | ||||
| 1 | Triad Hospitals, Inc.* | 29 | ||||
| 3,348,853 | ||||||
| Mining – 0.4% | ||||||
| 160,000 | Alcan Aluminium Ltd. | 5,250,000 | ||||
| 26,300 | Nucor Corp. | 966,525 | ||||
| 6,216,525 | ||||||
| Motor Vehicle – 1.9% | ||||||
| 399,283 | Ford Motor Co. | 9,657,657 | ||||
| 220,000 | General Motors Corp. | 15,881,250 | ||||
| 45,300 | Johnson Controls, Inc. | 2,420,719 | ||||
| 27,959,626 | ||||||
| Oil Refining – 0.1% | ||||||
| 70,600 | Tosco Corp. | 2,153,300 | ||||
| Oil Services – 0.4% | ||||||
| 59,600 | BJ Services Co.* | 3,993,200 | ||||
| 36,700 | Noble Drilling Corp.* | 1,779,950 | ||||
| 5,773,150 | ||||||
| Property Insurance – 3.0% | ||||||
| 209,112 | Allstate Corp. | 6,077,317 | ||||
| 259,789 | American International Group, Inc. | 23,153,695 | ||||
| 18,500 | Jefferson-Pilot Corp. | 1,224,469 | ||||
| 26,400 | Loews Corp. | 2,136,750 | ||||
| 85,500 | MGIC Investment Corp. | 5,028,469 | ||||
| 58,100 | The Hartford Financial Services
Group, Inc. |
3,870,912 | ||||
| 33,000 | The PMI Group, Inc. | 2,046,000 | ||||
| 43,537,612 | ||||||
| Publishing – 0.2% | ||||||
| 28,300 | Dow Jones & Co., Inc. | 1,770,519 | ||||
| 25,400 | Knight-Ridder, Inc. | 1,387,475 | ||||
| 3,157,994 | ||||||
| Railroads – 0.1% | ||||||
| 91,800 | Burlington Northern Santa Fe Corp. | 2,054,025 | ||||
| Restaurants – 0.2% | ||||||
| 43,800 | Brinker International, Inc.* | 1,390,650 | ||||
| 47,000 | Tricon Global Restaurants, Inc.* | 1,368,875 | ||||
| 2,759,525 | ||||||
| Security/Asset Management – 2.1% | ||||||
| 208,300 | AXA Financial, Inc. | 10,779,525 | ||||
| 21,900 | Lehman Brothers Holdings, Inc. | 3,175,500 | ||||
| 10,300 | Merrill Lynch & Co., Inc. | 1,493,500 | ||||
| 92,500 | Morgan Stanley Dean Witter & Co. | 9,949,531 | ||||
| 143,450 | The Charles Schwab Corp. | 5,477,997 | ||||
| 30,876,053 | ||||||
| Semiconductors – 8.7% | ||||||
| 141,400 | Advanced Micro Devices, Inc.* | 5,320,175 | ||||
| 58,500 | Analog Devices, Inc.* | 5,879,250 | ||||
| 70,100 | Applied Materials, Inc.* | 6,050,506 | ||||
| 23,300 | Applied Micro Circuits Corp.* | 4,728,444 | ||||
| 22,900 | Broadcom Corp.* | 5,725,000 | ||||
| 674,400 | Intel Corp. | 50,495,700 | ||||
| 148,700 | JDS Uniphase Corp.* | 18,510,827 | ||||
|
Shares |
Description |
Value |
||||
|---|---|---|---|---|---|---|
| Common Stocks – (continued) | ||||||
| Semiconductors – (continued) | ||||||
| 18,600 | KLA-Tencor Corp.* | $ 1,220,625 | ||||
| 92,500 | Micron Technology, Inc.* | 7,561,875 | ||||
| 7,400 | PMC-Sierra, Inc.* | 1,746,400 | ||||
| 14,200 | SDL, Inc.* | 5,641,837 | ||||
| 140,100 | Texas Instruments, Inc. | 9,377,944 | ||||
| 38,400 | Xilinx, Inc.* | 3,412,800 | ||||
| 125,671,383 | ||||||
| Specialty Retail – 1.5% | ||||||
| 24,500 | Avnet, Inc. | 1,466,938 | ||||
| 93,300 | Lowes Co., Inc. | 4,181,006 | ||||
| 256,900 | The Home Depot, Inc. | 12,347,256 | ||||
| 90,400 | Tiffany & Co. | 3,762,900 | ||||
| 21,758,100 | ||||||
| Telephone – 5.1% | ||||||
| 463,475 | AT&T Corp. | 14,599,462 | ||||
| 45,200 | BCE, Inc. | 1,017,000 | ||||
| 399,500 | BellSouth Corp. | 14,906,344 | ||||
| 74,800 | Citizens Communications Co.* | 1,220,175 | ||||
| 294,222 | SBC Communications, Inc. | 12,283,768 | ||||
| 218,100 | Sprint Corp. | 7,306,350 | ||||
| 260,118 | Verizon Communications | 11,347,648 | ||||
| 304,000 | WorldCom, Inc.* | 11,096,000 | ||||
| 73,776,747 | ||||||
| Thrifts – 0.2% | ||||||
| 46,700 | Golden West Financial Corp. | 2,224,088 | ||||
| Tobacco – 0.6% | ||||||
| 247,300 | Philip Morris Cos., Inc. | 7,326,263 | ||||
| 48,800 | R.J. Reynolds Tobacco Holdings, Inc. | 1,750,700 | ||||
| 9,076,963 | ||||||
| Wireless – 0.7% | ||||||
| 53,900 | AT&T Wireless Group* | 1,411,506 | ||||
| 50,600 | Telephone & Data Systems, Inc. | 5,869,600 | ||||
| 33,900 | United States Cellular Corp.* | 2,493,769 | ||||
| 9,774,875 | ||||||
| TOTAL COMMON STOCKS | ||||||
| (Cost $1,098,258,504) | $1,440,600,967 | |||||
| Principal
Amount |
Interest
Rate |
Maturity
Date |
Value | |||||
|---|---|---|---|---|---|---|---|---|
| Repurchase Agreement – 0.2% | ||||||||
| Joint Repurchase Agreement Account IIˆ | ||||||||
| $2,500,000 | 6.66 | % | 09/01/2000 | $ 2,500,000 | ||||
| TOTAL REPURCHASE AGREEMENT | ||||||||
| (Cost $2,500,000) | $ 2,500,000 | |||||||
| TOTAL INVESTMENTS | ||||||||
| (Cost $1,100,758,504) | $ 1,443,100,967 | |||||||
*
|
Non-income producing security.
|
|
ˆ
|
Joint repurchase agreement was entered into on August 31, 2000.
|
| The percentage shown for each investment category reflects the value of investments in that category as a percentage of total net
assets.
|
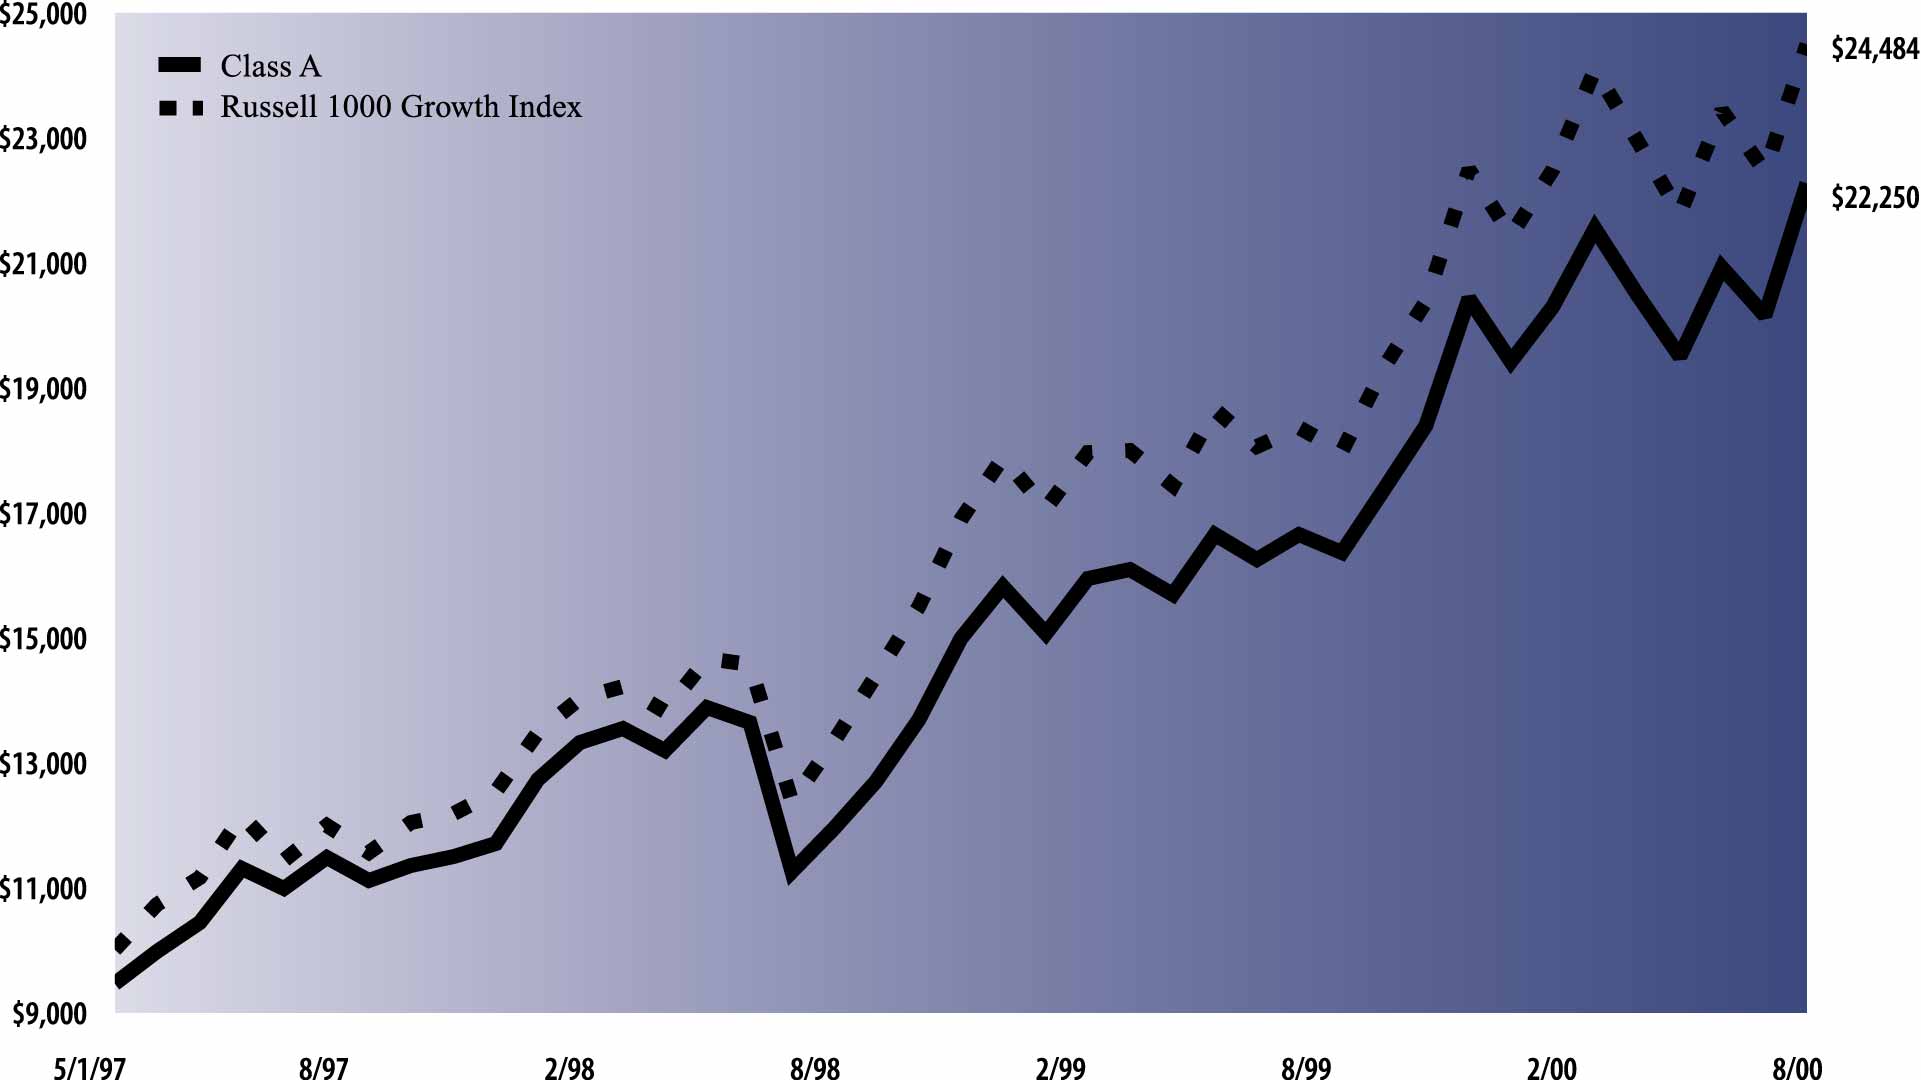
| The following graph shows the value, as of August 31, 2000, of a $10,000 investment made on May 1, 1997 (commencement of
operations) in Class A shares (maximum sales charge of 5.5%) of the Goldman Sachs CORE Large Cap Growth Fund. For comparative purposes, the performance of the Fund’s benchmark (Russell 1000 Growth Index with dividends reinvested) is shown. This
performance data represents past performance and should not be considered indicative of future performance which will fluctuate with changes in market conditions. These performance fluctuations will cause an investor’s shares, when redeemed, to be
worth more or less than their original cost. Performance of Class A shares will vary from Class B, Class C, Institutional and Service shares due to differences in fees and loads.
|
| CORE Large Cap Growth Fund’s Lifetime Performance
|
| Growth of a $10,000 Investment, Distributions Reinvested May 1, 1997 to August 31, 2000.
|
 |
| Average Annual Total Return through August 31, 2000 | Since Inception | One Year | |||
|---|---|---|---|---|---|
| Class A (commenced May 1, 1997) | |||||
| Excluding sales charges | 29.22% | 33.73% | |||
| Including sales charges | 27.06% | 26.38% | |||
| |
|||||
| Class B (commenced May 1, 1997) | |||||
| Excluding contingent deferred sales charges | 28.32% | 32.78% | |||
| Including contingent deferred sales charges | 27.80% | 27.76% | |||
| |
|||||
| Class C (commenced August 15, 1997) | |||||
| Excluding contingent deferred sales charges | 24.49% | 32.84% | |||
| Including contingent deferred sales charges | 24.49% | 31.84% | |||
| |
|||||
| Institutional Class (commenced May 1, 1997) | 29.64% | 34.34% | |||
| |
|||||
| Service Class (commenced May 1, 1997) | 29.03% | 33.64% | |||
| |
|||||
| Shares | Description | Value | |||
|---|---|---|---|---|---|
| Common Stocks – 98.5% | |||||
| Apparel – 0.2% | |||||
| 55,900 | Nike, Inc. Class B | $ 2,211,544 | |||
| Chemicals – 0.6% | |||||
| 34,400 | Praxair, Inc. | 1,522,200 | |||
| 249,700 | The Dow Chemicals Co. | 6,539,019 | |||
| 8,061,219 | |||||
| Clothing – 0.8% | |||||
| 252,100 | Intimate Brands, Inc. | 4,065,112 | |||
| 243,300 | The Limited, Inc. | 4,866,000 | |||
| 25,000 | The Talbots, Inc. | 1,673,438 | |||
| 10,604,550 | |||||
| Computer Hardware – 16.6% | |||||
| 48,100 | 3Com Corp. | 799,663 | |||
| 4,500 | Alteon Websystems, Inc.* | 666,000 | |||
| 171,100 | Apple Computer, Inc.* | 10,426,406 | |||
| 20,400 | Brocade Communications Systems,
Inc.* |
4,606,575 | |||
| 1,154,900 | Cisco Systems, Inc.* | 79,255,012 | |||
| 98,400 | Dell Computer Corp.* | 4,292,700 | |||
| 13,100 | Digital Lightwave, Inc.* | 1,149,525 | |||
| 6,700 | Echelon Corp.* | 315,319 | |||
| 388,600 | EMC Corp.* | 38,082,800 | |||
| 10,200 | Extreme Networks, Inc.* | 949,237 | |||
| 161,100 | Hewlett-Packard Co. | 19,452,825 | |||
| 140,500 | Network Appliance, Inc.* | 16,438,500 | |||
| 98,909 | Palm, Inc.* | 4,351,996 | |||
| 19,300 | Redback Networks, Inc.* | 2,882,937 | |||
| 6,300 | RSA Security, Inc.* | 372,094 | |||
| 20,500 | SanDisk Corp.* | 1,711,750 | |||
| 50,000 | Seagate Technology, Inc.* | 2,968,750 | |||
| 300,100 | Sun Microsystems, Inc.* | 38,093,944 | |||
| 226,816,033 | |||||
| Computer Software – 10.9% | |||||
| 44,400 | Adobe Systems, Inc. | 5,772,000 | |||
| 2,400 | Agile Software Corp.* | 166,650 | |||
| 70,100 | BEA Systems, Inc.* | 4,771,181 | |||
| 6,100 | CheckFree Corp.* | 316,056 | |||
| 1,900 | Entrust Technologies, Inc.* | 56,525 | |||
| 18,100 | i2 Technologies, Inc.* | 3,062,294 | |||
| 132,800 | International Business Machines, Inc. | 17,529,600 | |||
| 6,600 | Internet Security Systems, Inc.* | 534,600 | |||
| 24,100 | Intuit, Inc.* | 1,442,988 | |||
| 12,100 | Mercury Interactive Corp.* | 1,478,469 | |||
| 617,600 | Microsoft Corp.* | 43,116,200 | |||
| 13,000 | Networks Associates, Inc.* | 336,375 | |||
| 443,600 | Oracle Corp.* | 40,339,875 | |||
| 12,600 | Rational Software Corp.* | 1,621,462 | |||
| 7,400 | Red Hat, Inc.* | 185,925 | |||
| 15,200 | Sapient Corp.* | 798,000 | |||
| 29,700 | Siebel Systems, Inc.* | 5,875,031 | |||
| 23,700 | TIBCO Software, Inc.* | 2,415,919 | |||
| 147,425 | VERITAS Software Corp.* | 17,773,927 | |||
| 39,300 | Vignette Corp.* | 1,498,312 | |||
| 149,091,389 | |||||
| Shares | Description | Value | |||
|---|---|---|---|---|---|
| Common Stocks – (continued) | |||||
| Defense/Aerospace – 0.8% | |||||
| 198,200 | The Boeing Co. | $ 10,628,475 | |||
| Department Store – 2.1% | |||||
| 190,100 | Federated Department Stores, Inc.* | 5,251,512 | |||
| 41,000 | Sears, Roebuck & Co. | 1,278,688 | |||
| 183,700 | Target Corp. | 4,271,025 | |||
| 368,000 | Wal-Mart Stores, Inc. | 17,457,000 | |||
| 28,258,225 | |||||
| Drugs – 11.4% | |||||
| 144,400 | Allergan, Inc. | 10,559,250 | |||
| 27,300 | Alpharma, Inc. | 1,545,863 | |||
| 245,400 | Amgen, Inc.* | 18,604,387 | |||
| 99,000 | Cardinal Health, Inc. | 8,099,437 | |||
| 33,800 | Celera Genomics* | 3,665,188 | |||
| 18,700 | Chiron Corp.* | 1,010,969 | |||
| 73,100 | Eli Lilly & Co. | 5,336,300 | |||
| 38,600 | Forest Laboratories, Inc.* | 3,777,975 | |||
| 46,200 | Genentech, Inc.* | 8,801,100 | |||
| 42,200 | IVAX Corp.* | 1,461,175 | |||
| 14,300 | Medarex, Inc.* | 1,580,150 | |||
| 61,400 | MedImmune, Inc.* | 5,165,275 | |||
| 380,300 | Merck & Co., Inc. | 26,573,462 | |||
| 39,700 | Millennium Pharmaceuticals* | 5,682,062 | |||
| 34,500 | PE Corp-PE Biosystems Group | 3,393,938 | |||
| 1,114,475 | Pfizer, Inc. | 48,201,044 | |||
| 43,700 | Schering-Plough Corp. | 1,753,463 | |||
| 155,211,038 | |||||
| Electrical Equipment – 9.4% | |||||
| 158,400 | ADC Telecommunications, Inc.* | 6,484,500 | |||
| 33,000 | Advanced Fibre Communications,
Inc.* |
1,744,359 | |||
| 22,500 | Amphenol Corp.* | 1,440,000 | |||
| 56,200 | AVX Corp. | 1,682,487 | |||
| 35,300 | CIENA Corp.* | 7,825,569 | |||
| 20,600 | Comverse Technology, Inc.* | 1,893,912 | |||
| 9,300 | Copper Mountain Networks, Inc.* | 557,419 | |||
| 99,000 | Corning, Inc. | 32,465,812 | |||
| 21,800 | Credence Systems Corp.* | 1,276,663 | |||
| 14,100 | Ditech Communications Corp.* | 831,900 | |||
| 7,000 | GlobeSpan, Inc.* | 843,063 | |||
| 4,000 | Harmonic, Inc.* | 134,000 | |||
| 194,400 | KEMET Corp.* | 5,832,000 | |||
| 36,400 | Level 3 Communications, Inc.* | 3,175,331 | |||
| 285,900 | Lucent Technologies, Inc. | 11,954,194 | |||
| 35,100 | Motorola, Inc. | 1,265,794 | |||
| 15,500 | Newport Corp. | 2,464,500 | |||
| 159,148 | Nortel Networks Corp. | 12,980,509 | |||
| 10,700 | Power-One, Inc.* | 1,695,281 | |||
| 27,300 | Powerwave Technologies, Inc.* | 1,313,812 | |||
| 91,800 | QUALCOMM, Inc.* | 5,496,525 | |||
| 114,300 | Scientific-Atlanta, Inc. | 8,908,256 | |||
| 15,000 | Sycamore Networks, Inc.* | 2,062,500 | |||
| 64,100 | Tektronix, Inc. | 4,883,619 | |||
| 37,900 | Teradyne, Inc. | 2,456,394 | |||
| Shares | Description | Value | ||||
|---|---|---|---|---|---|---|
| Common Stocks – (continued) | ||||||
| Electrical Equipment – (continued) | ||||||
| 21,800 | Terayon Communication Systems,
Inc.* |
$ 1,209,900 | ||||
| 140,550 | Vishay Intertechnology, Inc.* | 5,665,922 | ||||
| 128,544,221 | ||||||
| Electrical Utilities – 0.5% | ||||||
| 59,200 | Calpine Corp.* | 5,860,800 | ||||
| 23,964 | Dynegy, Inc. | 1,078,380 | ||||
| 6,939,180 | ||||||
| Energy Resources – 1.0% | ||||||
| 73,100 | Apache Corp. | 4,605,300 | ||||
| 54,700 | Devon Energy Corp. | 3,203,369 | ||||
| 61,300 | Kerr-McGee Corp. | 3,873,394 | ||||
| 32,500 | Murphy Oil Corp. | 2,169,375 | ||||
| 13,851,438 | ||||||
| Entertainment – 0.8% | ||||||
| 247,900 | The Walt Disney Co. | 9,652,606 | ||||
| 21,900 | Viacom, Inc. Class B* | 1,474,144 | ||||
| 11,126,750 | ||||||
| Environmental Services – 0.2% | ||||||
| 163,400 | Republic Services, Inc.* | 2,389,725 | ||||
| Financial Services – 6.1% | ||||||
| 1,429,900 | General Electric Co. | 83,917,256 | ||||
| Food & Beverage – 2.5% | ||||||
| 224,200 | ConAgra, Inc. | 4,105,662 | ||||
| 50,100 | Hormel Foods Corp. | 773,419 | ||||
| 285,100 | IBP, Inc. | 4,579,419 | ||||
| 50,800 | Keebler Foods Co. | 2,327,275 | ||||
| 289,200 | Nabisco Group Holdings Corp. | 8,115,675 | ||||
| 105,000 | PepsiCo., Inc. | 4,475,625 | ||||
| 54,900 | Supervalu, Inc. | 820,069 | ||||
| 31,300 | SYSCO Corp. | 1,324,381 | ||||
| 50,400 | The Coca-Cola Co. | 2,652,300 | ||||
| 144,000 | The Pepsi Bottling Group, Inc. | 4,572,000 | ||||
| 33,745,825 | ||||||
| Heavy Electrical – 0.1% | ||||||
| 21,700 | Molex, Inc. | 1,146,031 | ||||
| Hotels – 0.1% | ||||||
| 30,800 | Marriott International, Inc. | 1,216,600 | ||||
| Industrial Services – 0.5% | ||||||
| 169,200 | Hertz Corp. | 5,181,750 | ||||
| 58,500 | Robert Half International, Inc.* | 1,861,031 | ||||
| 7,042,781 | ||||||
| Information Services – 1.5% | ||||||
| 41,900 | Automatic Data Processing, Inc. | 2,498,287 | ||||
| 72,600 | Computer Sciences Corp.* | 5,739,937 | ||||
| 27,100 | Convergys Corp.* | 1,060,288 | ||||
| 15,900 | DST Systems, Inc.* | 1,494,600 | ||||
| 96,800 | Electronic Data Systems Corp. | 4,821,850 | ||||
| 500 | Healtheon/WebMD Corp.* | 8,813 | ||||
| Shares | Description | Value | ||||
|---|---|---|---|---|---|---|
| Common Stocks – (continued) | ||||||
| Information Services – (continued) | ||||||
| 8,000 | HomeStore.com, Inc.* | $ 433,500 | ||||
| 9,500 | Internap Network Services Corp.* | 342,000 | ||||
| 8,969 | MarchFirst, Inc.* | 173,774 | ||||
| 25,300 | Omnicom Group, Inc. | 2,110,969 | ||||
| 25,800 | The Interpublic Group of Cos., Inc. | 986,850 | ||||
| 12,800 | TMP Worldwide, Inc.* | 885,600 | ||||
| 20,556,468 | ||||||
| Internet – 5.6% | ||||||
| 6,000 | Akamai Technologies, Inc.* | 453,375 | ||||
| 29,700 | Amazon.com, Inc.* | 1,232,550 | ||||
| 415,500 | America Online, Inc.* | 24,358,687 | ||||
| 3,100 | Ameritrade Holding Corp.* | 58,319 | ||||
| 29,400 | Ariba, Inc.* | 4,626,825 | ||||
| 11,000 | Art Technology Group, Inc.* | 1,121,313 | ||||
| 9,800 | At Home Corp. Series A* | 142,713 | ||||
| 36,000 | BroadVision, Inc.* | 1,242,000 | ||||
| 600 | CacheFlow, Inc.* | 65,625 | ||||
| 34,600 | CMGI, Inc.* | 1,548,350 | ||||
| 3,100 | CNET Networks, Inc.* | 103,850 | ||||
| 31,700 | Commerce One, Inc.* | 1,982,241 | ||||
| 1,400 | Critical Path, Inc.* | 108,150 | ||||
| 5,900 | Digex, Inc.* | 499,656 | ||||
| 16,100 | DoubleClick, Inc.* | 655,069 | ||||
| 19,200 | E*TRADE Group, Inc.* | 340,800 | ||||
| 4,000 | E.piphany, Inc.* | 416,000 | ||||
| 19,400 | eBay, Inc.* | 1,202,800 | ||||
| 2,600 | Efficient Networks, Inc.* | 139,709 | ||||
| 72,300 | Exodus Communications, Inc.* | 4,948,031 | ||||
| 28,300 | InfoSpace.com, Inc.* | 1,103,700 | ||||
| 14,900 | Inktomi Corp.* | 1,942,587 | ||||
| 37,700 | Juniper Networks, Inc.* | 8,058,375 | ||||
| 11,000 | Kana Communications, Inc.* | 441,375 | ||||
| 12,200 | Liberate Technologies, Inc.* | 375,150 | ||||
| 13,400 | Lycos, Inc.* | 951,400 | ||||
| 7,900 | Macromedia, Inc.* | 545,964 | ||||
| 4,600 | Phone.com, Inc.* | 425,213 | ||||
| 14,500 | Portal Software, Inc.* | 801,125 | ||||
| 6,800 | Priceline.com, Inc.* | 184,875 | ||||
| 8,000 | Proxicom, Inc.* | 193,500 | ||||
| 18,700 | PSINet, Inc.* | 328,419 | ||||
| 14,700 | RealNetworks, Inc.* | 715,706 | ||||
| 5,600 | Scient Corp.* | 151,550 | ||||
| 6,800 | Software.com, Inc.* | 989,825 | ||||
| 35,812 | VeriSign, Inc.* | 7,122,111 | ||||
| 17,500 | VerticalNet, Inc.* | 931,875 | ||||
| 9,000 | Vitria Technology, Inc. | 423,000 | ||||
| 46,200 | Yahoo!, Inc.* | 5,613,300 | ||||
| 76,545,113 | ||||||
| Media – 1.8% | ||||||
| 31,000 | Fox Entertainment Group, Inc.* | 897,063 | ||||
| 207,700 | General Motors Corp. Class H* | 6,880,062 | ||||
| 102,500 | Infinity Broadcasting Corp.* | 3,882,188 | ||||
| 157,900 | Time Warner, Inc. | 13,500,450 | ||||
| 25,159,763 | ||||||
| Shares | Description | Value | ||||
|---|---|---|---|---|---|---|
| Common Stocks – (continued) | ||||||
| Medical Products – 2.4% | ||||||
| 142,700 | Abbott Laboratories | $ 6,243,125 | ||||
| 33,500 | Baxter International, Inc. | 2,788,875 | ||||
| 144,000 | Johnson & Johnson | 13,239,000 | ||||
| 102,800 | Medtronic, Inc. | 5,268,500 | ||||
| 19,000 | MiniMed, Inc.* | 1,364,140 | ||||
| 63,100 | Stryker Corp. | 2,827,669 | ||||
| 11,500 | Techne Corp.* | 1,098,250 | ||||
| 32,829,559 | ||||||
| Medical Providers – 0.1% | ||||||
| 17,500 | Quest Diagnostics, Inc.* | 2,165,625 | ||||
| Oil Services – 0.1% | ||||||
| 28,100 | BJ Services Co.* | 1,882,700 | ||||
| Publishing – 0.3% | ||||||
| 38,200 | Dow Jones & Co., Inc. | 2,389,887 | ||||
| 25,700 | Knight-Ridder, Inc. | 1,403,863 | ||||
| 3,793,750 | ||||||
| Security/Asset Management – 2.3% | ||||||
| 29,800 | A.G. Edwards, Inc. | 1,549,600 | ||||
| 84,300 | Lehman Brothers Holdings, Inc. | 12,223,500 | ||||
| 64,900 | Merrill Lynch & Co., Inc. | 9,410,500 | ||||
| 14,500 | Morgan Stanley Dean Witter & Co. | 1,559,656 | ||||
| 188,500 | The Charles Schwab Corp. | 7,198,344 | ||||
| 31,941,600 | ||||||
| Semiconductors – 15.1% | ||||||
| 149,000 | Advanced Micro Devices, Inc.* | 5,606,125 | ||||
| 68,800 | Analog Devices, Inc.* | 6,914,400 | ||||
| 39,700 | Applied Materials, Inc.* | 3,426,606 | ||||
| 73,700 | Applied Micro Circuits Corp.* | 14,956,494 | ||||
| 25,800 | Broadcom Corp.* | 6,450,000 | ||||
| 35,000 | Integrated Device Technology, Inc.* | 3,071,250 | ||||
| 1,233,000 | Intel Corp. | 92,320,875 | ||||
| 197,740 | JDS Uniphase Corp.* | 24,615,540 | ||||
| 113,700 | Micron Technology, Inc.* | 9,294,975 | ||||
| 23,100 | PMC-Sierra, Inc.* | 5,451,600 | ||||
| 12,000 | QLogic Corp.* | 1,362,000 | ||||
| 24,400 | RF Micro Devices, Inc.* | 1,088,850 | ||||
| 30,600 | SDL, Inc.* | 12,157,763 | ||||
| 242,600 | Texas Instruments, Inc. | 16,239,037 | ||||
| 26,700 | TriQuint Semiconductor, Inc.* | 1,476,844 | ||||
| 16,300 | Xilinx, Inc.* | 1,448,663 | ||||
| 205,881,022 | ||||||
| Shares | Description | Value | ||||
|---|---|---|---|---|---|---|
| Common Stocks – (continued) | ||||||
| Specialty Retail – 2.0% | ||||||
| 73,700 | CVS Corp. | $ 2,736,113 | ||||
| 24,000 | Lowes Co., Inc. | 1,075,500 | ||||
| 327,550 | The Home Depot, Inc. | 15,742,872 | ||||
| 154,100 | Tiffany & Co. | 6,414,412 | ||||
| 35,100 | Zale Corp.* | 1,296,506 | ||||
| 27,265,403 | ||||||
| Telephone – 1.7% | ||||||
| 108,080 | AT&T Corp. | 3,404,520 | ||||
| 344,700 | BCE, Inc. | 7,755,750 | ||||
| 27,200 | BellSouth Corp. | 1,014,900 | ||||
| 39,000 | NEXTLINK Communications, Inc.* | 1,367,437 | ||||
| 64,833 | SBC Communications, Inc. | 2,706,778 | ||||
| 200,850 | WorldCom, Inc.* | 7,331,025 | ||||
| 23,580,410 | ||||||
| Wireless – 1.0% | ||||||
| 299,100 | AT&T Wireless Group* | 7,832,682 | ||||
| 20,300 | Sprint Corp. (PCS Group)* | 1,018,806 | ||||
| 36,900 | Telephone & Data Systems, Inc. | 4,280,400 | ||||
| 13,131,888 | ||||||
| TOTAL COMMON STOCKS | ||||||
| (Cost $955,579,423) | $1,345,535,581 | |||||
| Principal
Amount |
Interest
Rate |
Maturity
Date |
Value | ||||
|---|---|---|---|---|---|---|---|
| Repurchase Agreement – 1.2% | |||||||
| Joint Repurchase Agreement Account IIˆ | |||||||
| $16,300,000 | 6.66% | 09/01/2000 | $ 16,300,000 | ||||
| TOTAL REPURCHASE AGREEMENT | |||||||
| (Cost $16,300,000) | $ 16,300,000 | ||||||
| TOTAL INVESTMENTS | |||||||
| (Cost $971,879,423) | $1,361,835,581 | ||||||
*
|
Non-income producing security.
|
|
ˆ
|
Joint repurchase agreement was entered into on August 31, 2000.
|
| The percentage shown for each investment category reflects the value of investments in that category as a percentage of total net
assets.
|
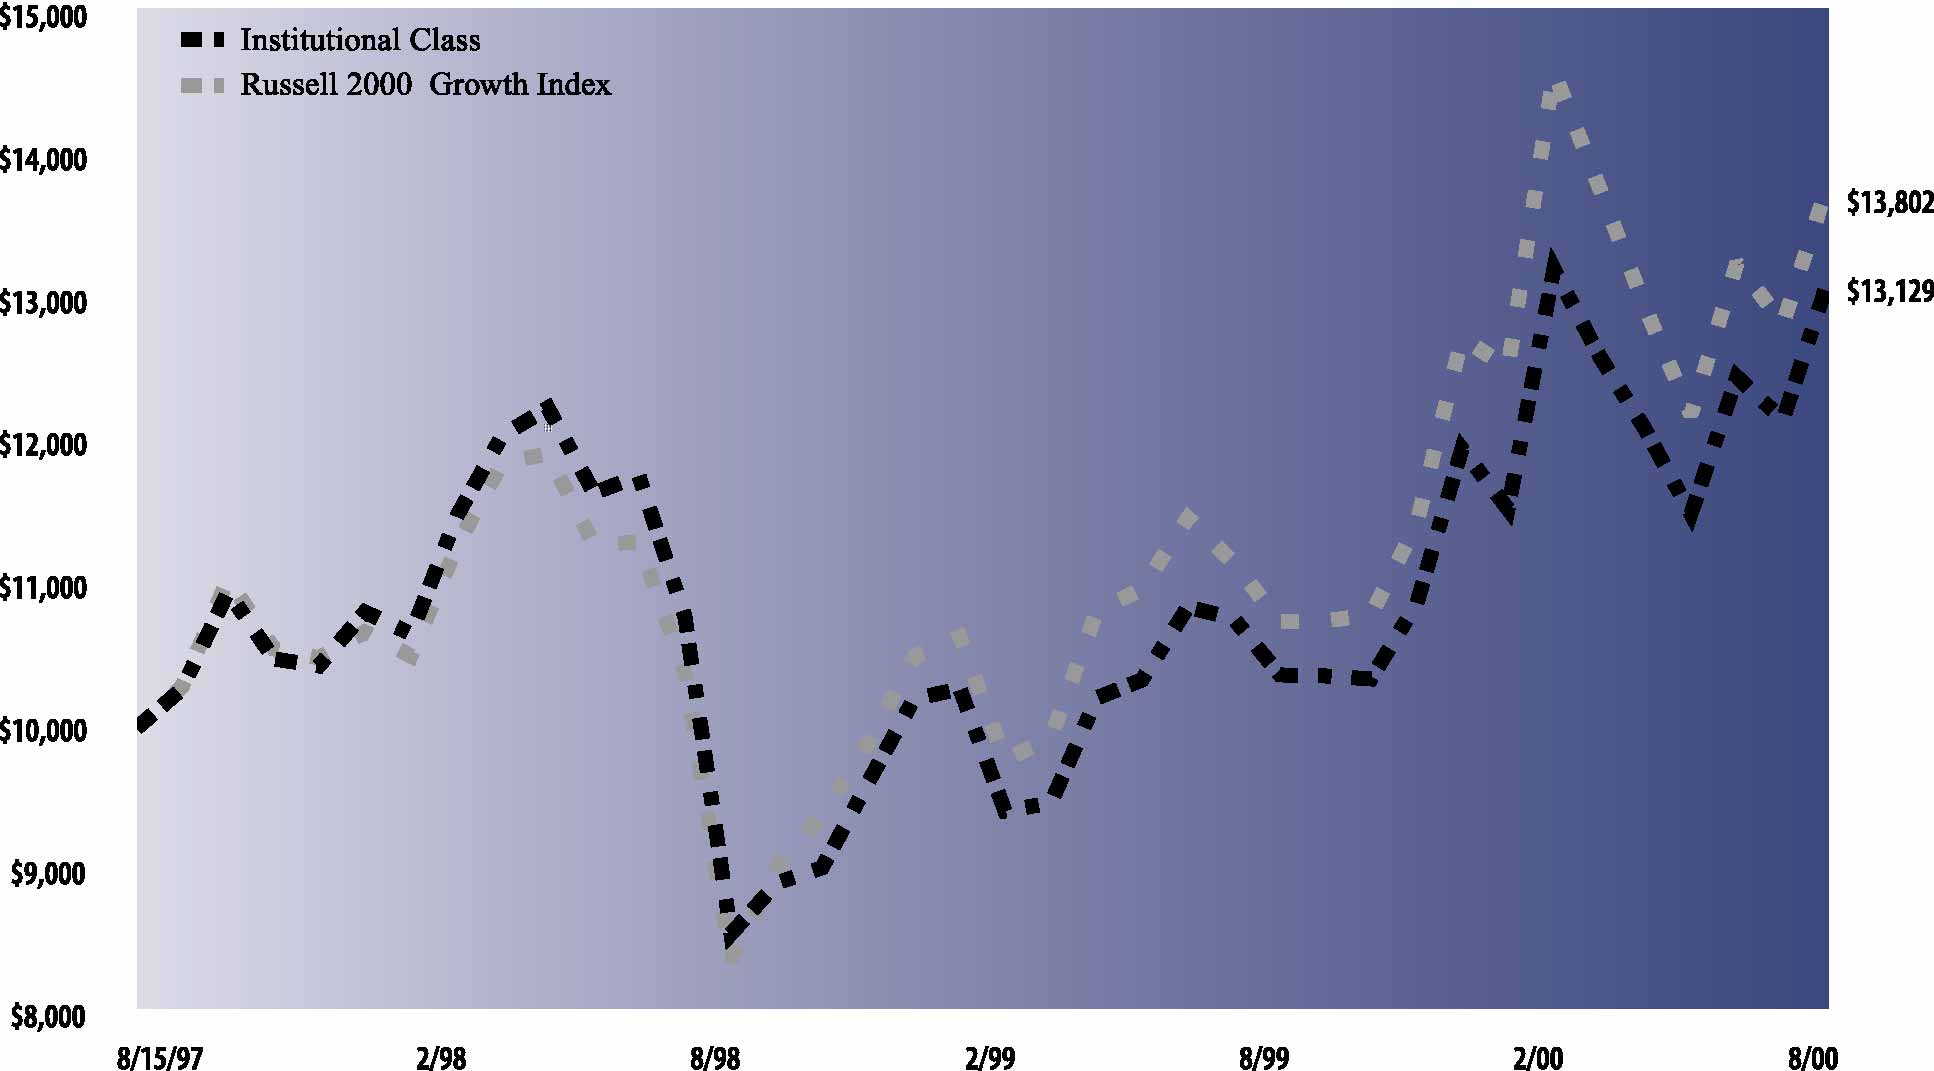
| The following graph shows the value, as of August 31, 2000, of a $10,000 investment made on August 15, 1997 (commencement of
operations) in Institutional shares at (NAV) of the Goldman Sachs CORE Small Cap Equity Fund. For comparative purposes, the performance of the Fund’s benchmark (Russell 2000 Growth Index with dividends reinvested) is shown. This performance data
represents past performance and should not be considered indicative of future performance which will fluctuate with changes in market conditions. These performance fluctuations will cause an investor’s shares, when redeemed, to be worth more or less
than their original cost. Performance of Class A, Class B, Class C and Service shares will vary from Institutional shares due to differences in fees and loads.
|
| CORE Small Cap Equity Fund’s Lifetime Performance
|
| Growth of a $10,000 Investment, Distributions Reinvested August 15, 1997 to August 31, 2000.
|
 |
| Average Annual Total Return through August 31, 2000 | Since Inception | One Year | ||
|---|---|---|---|---|
| Class A (commenced August 15, 1997) | ||||
| Excluding sales charges | 8.90% | 26.10% | ||
| Including sales charges | 6.90% | 19.11% | ||
| |
||||
| Class B (commenced August 15, 1997) | ||||
| Excluding contingent deferred sales charges | 8.11% | 25.17% | ||
| Including contingent deferred sales charges | 7.27% | 20.17% | ||
| |
||||
| Class C (commenced August 15, 1997) | ||||
| Excluding contingent deferred sales charges | 8.20% | 25.35% | ||
| Including contingent deferred sales charges | 8.20% | 24.35% | ||
| |
||||
| Institutional Class (commenced August 15, 1997) | 9.34% | 26.60% | ||
| |
||||
| Service Class (commenced August 15, 1997) | 8.81% | 25.93% | ||
| |
||||
|
Shares |
Description | Value | ||||
|---|---|---|---|---|---|---|
| Common Stocks – 99.6% | ||||||
| Airlines – 0.5% | ||||||
| 17,700 | America West Holdings Corp. Class B* | $ 258,863 | ||||
| 30,200 | Frontier Airlines, Inc.* | 517,175 | ||||
| 776,038 | ||||||
| Alcohol – 0.2% | ||||||
| 9,900 | The Robert Mondavi Corp.* | 405,900 | ||||
| Apparel – 0.5% | ||||||
| 23,600 | Phillips-Van Heusen Corp. | 215,350 | ||||
| 9,500 | Skechers U.S.A., Inc.* | 169,219 | ||||
| 12,300 | Springs Industries, Inc. | 367,462 | ||||
| 13,200 | Steven Madden Ltd.* | 162,525 | ||||
| 914,556 | ||||||
| Banks – 4.0% | ||||||
| 30,300 | Brookline Bancorp, Inc. | 357,919 | ||||
| 27,100 | Cullen/Frost Bankers, Inc. | 840,100 | ||||
| 9,900 | First Charter Corp. | 159,019 | ||||
| 9,900 | GBC Bancorp | 374,962 | ||||
| 8,500 | Greater Bay Bancorp | 527,000 | ||||
| 44,491 | Imperial Bancorp | 967,679 | ||||
| 30,600 | Independence Community Bank Corp. | 415,012 | ||||
| 2,600 | Net.B@nk, Inc.* | 29,575 | ||||
| 27,300 | Silicon Valley Bancshares* | 1,573,162 | ||||
| 13,300 | Southwest Bancorp of Texas, Inc.* | 386,531 | ||||
| 12,700 | The South Financial Group, Inc. | 165,100 | ||||
| 25,300 | Trustco Bank Corp. | 325,738 | ||||
| 18,500 | United Bankshares, Inc. | 367,688 | ||||
| 25,100 | United Community Financial Corp. | 158,444 | ||||
| 6,647,929 | ||||||
| Chemicals – 3.0% | ||||||
| 30,600 | Albemarle Corp. | 759,262 | ||||
| 23,800 | Arch Chemicals, Inc. | 432,862 | ||||
| 10,200 | Brady Corp. | 295,163 | ||||
| 19,300 | Cambrex Corp. | 905,894 | ||||
| 14,500 | Cytec Industries, Inc.* | 483,937 | ||||
| 28,100 | Millennium Chemicals, Inc. | 463,650 | ||||
| 19,100 | Spartech Corp. | 472,725 | ||||
| 16,600 | The Dexter Corp. | 981,475 | ||||
| 36,200 | W.R. Grace & Co.* | 287,338 | ||||
| 5,082,306 | ||||||
| Clothing – 1.3% | ||||||
| 11,600 | AnnTaylor Stores Corp.* | 417,600 | ||||
| 6,100 | Hot Topic, Inc.* | 172,706 | ||||
| 21,900 | The Cato Corp. | 271,013 | ||||
| 22,000 | The Neiman Marcus Group, Inc.* | 738,375 | ||||
| 42,200 | Venator Group, Inc.* | 590,800 | ||||
| 2,190,494 | ||||||
| Computer Hardware – 3.3% | ||||||
| 23,200 | Advanced Digital Information Corp.* | 394,400 | ||||
| 10,250 | Avocent Corp.* | 498,406 | ||||
| 4,800 | Cylink Corp.* | 68,400 | ||||
|
Shares |
Description | Value | ||||
|---|---|---|---|---|---|---|
| Common Stocks – (continued) | ||||||
| Computer Hardware – (continued) | ||||||
| 1,100 | Globix Corp.* | $ 29,494 | ||||
| 5,700 | Identix, Inc.* | 82,650 | ||||
| 17,900 | Imation Corp.* | 398,275 | ||||
| 16,700 | InFocus Corp.* | 807,862 | ||||
| 5,700 | Interlink Electronics, Inc.* | 147,488 | ||||
| 52,500 | Iomega Corp.* | 216,562 | ||||
| 6,900 | Mercury Computer Systems, Inc.* | 195,572 | ||||
| 9,100 | MIPS Technologies, Inc.* | 520,975 | ||||
| 4,100 | MMC Networks, Inc.* | 499,431 | ||||
| 2,700 | Osicom Technologies, Inc.* | 159,300 | ||||
| 6,900 | RadiSys Corp.* | 385,969 | ||||
| 2,500 | SCM Microsystems, Inc.* | 136,094 | ||||
| 4,900 | Secure Computing Corp.* | 122,194 | ||||
| 12,000 | Take-Two Interactive Software, Inc.* | 166,312 | ||||
| 12,000 | Zebra Technologies Corp.* | 648,000 | ||||
| 5,477,384 | ||||||
| Computer Software – 5.9% | ||||||
| 18,200 | Actuate Corp.* | 472,062 | ||||
| 3,800 | Adept Technology, Inc.* | 189,762 | ||||
| 11,000 | Advent Software, Inc.* | 677,875 | ||||
| 4,200 | Allaire Corp.* | 142,538 | ||||
| 4,700 | Aspen Technology, Inc.* | 215,906 | ||||
| 24,300 | Avant! Corp.* | 353,869 | ||||
| 3,100 | Bluestone Software, Inc.* | 72,463 | ||||
| 16,200 | CACI International, Inc.* | 364,500 | ||||
| 4,900 | Cerner Corp.* | 186,506 | ||||
| 8,700 | Clarus Corp.* | 526,350 | ||||
| 2,400 | Click2learn.com, Inc.* | 36,450 | ||||
| 2,700 | Documentum, Inc.* | 193,219 | ||||
| 2,200 | Excalibur Technologies Corp.* | 104,500 | ||||
| 23,400 | eXcelon Corp.* | 188,663 | ||||
| 14,700 | FileNET Corp.* | 282,975 | ||||
| 7,300 | HNC Software, Inc.* | 397,166 | ||||
| 10,600 | Hyperion Solutions Corp.* | 335,225 | ||||
| 18,500 | IMR Global Corp.* | 219,687 | ||||
| 5,400 | Informatica Corp.* | 540,000 | ||||
| 5,900 | Information Architects Corp.* | 37,613 | ||||
| 9,800 | Intergraph Corp.* | 58,800 | ||||
| 1,100 | Manhattan Associates, Inc.* | 51,013 | ||||
| 7,600 | Manugistics Group, Inc.* | 666,900 | ||||
| 33,800 | Mentor Graphics Corp.* | 637,975 | ||||
| 7,500 | National Computer Systems, Inc. | 544,687 | ||||
| 5,600 | NetIQ Corp.* | 316,400 | ||||
| 8,500 | New Era of Networks, Inc.* | 298,031 | ||||
| 15,800 | Progress Software Corp.* | 216,262 | ||||
| 10,900 | Puma Technology, Inc.* | 265,006 | ||||
| 9,950 | Radiant Systems, Inc.* | 170,394 | ||||
| 12,900 | Remedy Corp.* | 301,537 | ||||
| 1,600 | Retek, Inc.* | 55,100 | ||||
| 5,100 | Verity, Inc.* | 233,325 | ||||
| 2,300 | WatchGuard Technologies, Inc.* | 112,988 | ||||
| 8,000 | WebTrends Corp.* | 301,375 | ||||
| 3,100 | ZixIt Corp.* | 151,125 | ||||
| 9,918,247 | ||||||
|
Shares |
Description | Value | |||
|---|---|---|---|---|---|
| Common Stocks – (continued) | |||||
| Construction – 3.4% | |||||
| 31,300 | Centex Corp. | $ 903,787 | |||
| 20,500 | D.R. Horton, Inc. | 402,312 | |||
| 14,100 | Granite Construction, Inc. | 320,775 | |||
| 12,400 | Insituform Technologies, Inc.* | 380,525 | |||
| 19,200 | M.D.C. Holdings, Inc. | 481,200 | |||
| 27,800 | Morrison Knudsen Corp.* | 333,600 | |||
| 18,900 | NCI Building Systems, Inc.* | 333,113 | |||
| 11,900 | NVR, Inc.* | 874,650 | |||
| 16,100 | Pulte Corp. | 530,294 | |||
| 28,800 | Standard Pacific Corp. | 473,400 | |||
| 19,100 | The Ryland Group, Inc. | 469,144 | |||
| 19,500 | URS Corp.* | 257,156 | |||
| 5,759,956 | |||||
| Consumer Durables – 0.7% | |||||
| 5,800 | Harman International Industries, Inc. | 445,150 | |||
| 27,800 | Pier 1 Imports, Inc. | 326,650 | |||
| 14,900 | The Toro Co. | 450,725 | |||
| 1,222,525 | |||||
| Defense/Aerospace – 0.9% | |||||
| 26,100 | Kaman Corp. | 342,563 | |||
| 16,400 | Precision Castparts Corp. | 1,246,400 | |||
| 1,588,963 | |||||
| Department Store – 0.1% | |||||
| 18,900 | Value City Department Stores, Inc.* | 170,100 | |||
| Drugs – 7.6% | |||||
| 5,900 | Allscripts, Inc.* | 172,206 | |||
| 17,100 | Alpharma, Inc. | 968,287 | |||
| 23,400 | AmeriSource Health Corp.* | 813,150 | |||
| 3,700 | Aurora Biosciences Corp.* | 252,988 | |||
| 12,250 | Barr Laboratories, Inc.* | 869,750 | |||
| 17,000 | Bergen Brunswig Corp. | 159,375 | |||
| 35,010 | Bindley Western Industries, Inc. | 1,008,726 | |||
| 8,400 | Biosite Diagnostics, Inc.* | 584,325 | |||
| 14,500 | Cell Genesys, Inc.* | 446,781 | |||
| 5,500 | Cubist Pharmaceuticals, Inc.* | 336,188 | |||
| 28,700 | Dura Pharmaceuticals, Inc.* | 791,044 | |||
| 6,400 | Emisphere Technologies, Inc.* | 211,200 | |||
| 6,700 | Enzon, Inc.* | 407,862 | |||
| 5,600 | GelTex Pharmaceuticals, Inc.* | 226,888 | |||
| 7,200 | Genome Therapeutics Corp.* | 180,900 | |||
| 25,500 | Herbalife International, Inc. | 247,031 | |||
| 10,800 | ILEX Oncology, Inc.* | 356,400 | |||
| 11,700 | Immunomedics, Inc.* | 292,500 | |||
| 1,200 | Luminex Corp.* | 48,000 | |||
| 4,900 | Maxim Pharmaceuticals, Inc.* | 299,819 | |||
| 13,300 | Medicis Pharmaceutical Corp.* | 857,019 | |||
| 2,700 | Myriad Genetics, Inc.* | 377,662 | |||
| 6,800 | Neose Technologies, Inc.* | 278,800 | |||
| 13,700 | Noven Pharmaceuticals, Inc.* | 575,400 | |||
| 8,700 | Pharmacopeia, Inc.* | 364,856 | |||
| 9,884 | Priority Healthcare Corp. Class B* | 570,801 | |||
| 13,900 | SciClone Pharmaceuticals, Inc.* | 164,194 | |||
|
Shares |
Description | Value | |||
|---|---|---|---|---|---|
| Common Stocks – (continued) | |||||
| Drugs – (continued) | |||||
| 7,200 | SuperGen, Inc.* | $ 141,750 | |||
| 16,800 | Syncor International Corp.* | 672,000 | |||
| 12,675,902 | |||||
| Electrical Equipment – 7.0% | |||||
| 6,600 | Advanced Energy Industries, Inc.* | 377,025 | |||
| 8,250 | Aeroflex, Inc.* | 303,187 | |||
| 1,700 | Anaren Microwave, Inc.* | 200,706 | |||
| 19,400 | Anixter International, Inc.* | 679,000 | |||
| 5,200 | Celeritek, Inc.* | 233,350 | |||
| 6,600 | Checkpoint Systems, Inc.* | 52,800 | |||
| 5,300 | Cobalt Networks, Inc.* | 263,013 | |||
| 7,100 | Coherent, Inc.* | 571,550 | |||
| 8,500 | DSP Group, Inc.* | 393,125 | |||
| 9,700 | FEI Co. | 292,213 | |||
| 18,300 | Glenayre Technologies, Inc.* | 199,013 | |||
| 2,300 | Keithley Instruments, Inc. | 174,656 | |||
| 13,600 | Kent Electronics Corp.* | 397,800 | |||
| 21,600 | Kimball International, Inc. Class B | 367,200 | |||
| 10,500 | Littelfuse, Inc.* | 381,281 | |||
| 10,900 | LTX Corp.* | 278,631 | |||
| 8,400 | Methode Electronics, Inc. | 505,050 | |||
| 12,900 | MRV Communications, Inc.* | 994,106 | |||
| 8,900 | Nanometrics, Inc.* | 442,775 | |||
| 10,800 | Natural MicroSystems Corp.* | 805,275 | |||
| 6,000 | Netro Corp.* | 495,750 | |||
| 5,000 | Network Equipment
Technologies, Inc.* |
60,313 | |||
| 8,200 | Park Electrochemical Corp. | 329,537 | |||
| 2,700 | PC-Tel, Inc.* | 75,600 | |||
| 5,500 | Photon Dynamics, Inc.* | 258,156 | |||
| 5,100 | Plexus Corp.* | 789,225 | |||
| 12,500 | Robotic Vision Systems, Inc.* | 158,594 | |||
| 25,700 | Sensormatic Electronics Corp.* | 427,262 | |||
| 2,500 | Tollgrade Communications, Inc.* | 277,969 | |||
| 4,200 | Trimble Navigation Ltd.* | 174,563 | |||
| 9,000 | Vicor Corp.* | 392,625 | |||
| 13,100 | Westell Technologies, Inc.* | 209,600 | |||
| 2,200 | Zygo Corp.* | 174,625 | |||
| 11,735,575 | |||||
| Electrical Utilities – 2.4% | |||||
| 42,700 | CMP Group, Inc. | 1,254,312 | |||
| 14,700 | Empire District Electric Co. | 381,281 | |||
| 35,600 | Public Service Co. of New Mexico | 760,950 | |||
| 44,900 | RGS Energy Group, Inc. | 1,116,888 | |||
| 10,500 | UIL Holdings Corp. | 528,281 | |||
| 4,041,712 | |||||
| Energy Resources – 1.6% | |||||
| 25,900 | Cross Timbers Oil Co. | 684,731 | |||
| 7,900 | Patina Oil & Gas Corp. | 167,875 | |||
| 25,200 | Southwestern Energy Co. | 195,300 | |||
| 9,500 | St. Mary Land & Exploration Co. | 393,062 | |||
| 19,100 | Tom Brown, Inc.* | 415,425 | |||
|
Shares |
Description | Value | |||
|---|---|---|---|---|---|
| Common Stocks – (continued) | |||||
| Energy Resources – (continued) | |||||
| 9,300 | Veritas DGC, Inc.* | $ 248,194 | |||
| 26,700 | Vintage Petroleum, Inc. | 560,700 | |||
| 2,665,287 | |||||
| Entertainment – 0.3% | |||||
| 34,000 | Handleman Co.* | 420,750 | |||
| Equity REIT – 5.4% | |||||
| 11,100 | Alexandria Real Estate Equities, Inc. | 388,500 | |||
| 28,500 | Bedford Property Investors, Inc. | 553,969 | |||
| 35,500 | Brandywine Realty Trust | 727,750 | |||
| 18,000 | EastGroup Properties, Inc. | 393,750 | |||
| 30,100 | Glenborough Reality Trust, Inc. | 560,612 | |||
| 36,400 | Health Care Property Investors, Inc. | 957,775 | |||
| 17,600 | LNR Property Corp. | 374,000 | |||
| 12,000 | Mid-America Apartment
Communities, Inc. |
290,250 | |||
| 17,600 | Pacific Gulf Properties, Inc. | 491,700 | |||
| 7,000 | Parkway Properties, Inc. | 222,250 | |||
| 20,600 | Prentiss Properties Trust | 500,837 | |||
| 20,700 | Realty Income Corp. | 470,925 | |||
| 13,900 | Shurgard Storage Centers, Inc. | 330,994 | |||
| 20,900 | SL Green Reality Corp. | 560,381 | |||
| 17,400 | Storage USA, Inc. | 524,175 | |||
| 27,500 | Summit Properties, Inc. | 639,375 | |||
| 15,000 | Sun Communities, Inc. | 464,063 | |||
| 13,000 | Weingarten Reality Investors | 526,500 | |||
| 8,977,806 | |||||
| Financial Services – 2.1% | |||||
| 31,500 | Advanta Corp. | 409,500 | |||
| 33,100 | AmeriCredit Corp.* | 914,387 | |||
| 10,200 | Arthur J. Gallagher & Co. | 499,800 | |||
| 26,800 | Credit Acceptance Corp.* | 160,800 | |||
| 1,500 | ePlus, Inc.* | 29,344 | |||
| 8,000 | Financial Federal Corp.* | 170,000 | |||
| 20,350 | Metris Cos., Inc. | 731,328 | |||
| 3,400 | NextCard, Inc.* | 27,944 | |||
| 34,700 | Security Capital Group, Inc. Class B* | 589,900 | |||
| 3,533,003 | |||||
| Food & Beverage – 1.8% | |||||
| 19,600 | Agribrands International, Inc.* | 779,100 | |||
| 24,600 | Corn Products International, Inc. | 618,075 | |||
| 33,200 | Fleming Cos., Inc. | 512,525 | |||
| 26,900 | Pilgrim’s Pride Corp. | 183,256 | |||
| 6,200 | Smithfield Foods, Inc.* | 164,688 | |||
| 13,700 | Suiza Foods Corp.* | 685,000 | |||
| 2,942,644 | |||||
| Forest – 0.7% | |||||
| 47,800 | Louisiana-Pacific Corp. | 504,888 | |||
| 22,300 | United Stationers, Inc.* | 723,356 | |||
| 1,228,244 | |||||
|
Shares |
Description | Value | ||||
|---|---|---|---|---|---|---|
| Common Stocks – (continued) | ||||||
| Gas Utilities – 1.1% | ||||||
| 18,900 | California Water Services Group | $ 496,125 | ||||
| 22,000 | Oneok, Inc. | 702,625 | ||||
| 11,600 | SEMCO Energy, Inc. | 174,000 | ||||
| 23,700 | UGI Corp. | 540,656 | ||||
| 1,913,406 | ||||||
| Gold – 0.2% | ||||||
| 32,800 | Freeport-McMoRan Copper & Gold,
Inc. Class B* |
321,850 | ||||
| Grocery – 0.3% | ||||||
| 8,300 | Whole Foods Market, Inc.* | 419,150 | ||||
| Heavy Electrical – 2.1% | ||||||
| 14,350 | A.O. Smith Corp. | 226,013 | ||||
| 24,500 | Belden, Inc. | 640,062 | ||||
| 19,000 | C&D Technologies, Inc. | 1,049,750 | ||||
| 21,150 | Cable Design Technologies Corp.* | 571,050 | ||||
| 17,300 | Cummins Engine Co., Inc. | 614,150 | ||||
| 14,600 | International FiberCom, Inc.* | 344,925 | ||||
| 3,445,950 | ||||||
| Heavy Machinery – 0.6% | ||||||
| 7,200 | NACCO Industries, Inc. | 337,500 | ||||
| 34,200 | Trinity Industries, Inc. | 662,625 | ||||
| 1,000,125 | ||||||
| Home Products – 0.3% | ||||||
| 20,800 | Playtex Products, Inc.* | 247,000 | ||||
| 9,700 | Zomax, Inc.* | 188,544 | ||||
| 435,544 | ||||||
| Hotels – 0.8% | ||||||
| 29,000 | Argosy Gaming Co.* | 464,000 | ||||
| 49,400 | Aztar Corp.* | 719,387 | ||||
| 33,900 | Boyd Gaming Corp.* | 156,788 | ||||
| 1,340,175 | ||||||
| Industrial Parts – 2.5% | ||||||
| 9,800 | Brooks Automation, Inc.* | 542,062 | ||||
| 25,900 | Clarcor, Inc. | 534,188 | ||||
| 3,500 | Cymer, Inc.* | 160,781 | ||||
| 18,500 | Flowserve Corp. | 342,250 | ||||
| 12,100 | Hughes Supply, Inc. | 257,730 | ||||
| 18,000 | Kennametal, Inc. | 461,250 | ||||
| 9,000 | Mattson Technology, Inc.* | 196,875 | ||||
| 46,800 | The Timken Co. | 763,425 | ||||
| 8,100 | Thomas Industries, Inc. | 163,519 | ||||
| 27,500 | Watts Industries, Inc. | 309,375 | ||||
| 20,800 | York International Corp. | 517,400 | ||||
| 4,248,855 | ||||||
| Industrial Services – 3.0% | ||||||
| 19,900 | Aaron Rents, Inc. Class B | 273,625 | ||||
| 18,000 | Avis Rent A Car, Inc.* | 553,500 | ||||
| 10,300 | Chemed Corp. | 315,437 | ||||
| 38,000 | Dollar Thrifty Automotive Group, Inc.* | 859,750 | ||||
|
Shares |
Description | Value | |||
|---|---|---|---|---|---|
| Common Stocks – (continued) | |||||
| Industrial Services – (continued) | |||||
| 4,300 | Frontline Capital Group* | $ 75,519 | |||
| 5,200 | Hall, Kinion & Associates, Inc.* | 171,600 | |||
| 4,800 | Heidrick & Struggles International,
Inc.* |
279,000 | |||
| 6,700 | Learning Tree International, Inc.* | 458,531 | |||
| 13,600 | Rent-A-Center, Inc.* | 447,950 | |||
| 10,100 | Rent-Way, Inc.* | 247,450 | |||
| 24,350 | Rollins Truck Leasing Corp. | 164,363 | |||
| 9,400 | Rollins, Inc. | 141,000 | |||
| 20,200 | The Wackenhut Corp. | 286,587 | |||
| 18,800 | United Rentals, Inc.* | 390,100 | |||
| 7,200 | XTRA Corp.* | 319,500 | |||
| 4,983,912 | |||||
| Information Services – 2.7% | |||||
| 1,700 | AGENCY.COM, Inc.* | 40,694 | |||
| 3,400 | Analysts International Corp. | 28,263 | |||
| 4,400 | BARRA, Inc.* | 253,550 | |||
| 10,200 | Braun Consulting, Inc.* | 165,750 | |||
| 4,600 | Calico Commerce, Inc.* | 46,431 | |||
| 2,700 | Cheap Tickets, Inc.* | 28,688 | |||
| 6,400 | Cognizant Technology Solutions Corp.* | 273,600 | |||
| 11,600 | Cyber-Care, Inc.* | 68,875 | |||
| 2,900 | Data Return Corp.* | 57,773 | |||
| 9,400 | Diamond Technology Partners, Inc.* | 599,837 | |||
| 3,800 | Digital Insight Corp.* | 100,700 | |||
| 13,400 | F.Y.I., Inc.* | 522,600 | |||
| 7,900 | Fair Isaac & Co., Inc. | 362,906 | |||
| 5,500 | Forrester Research, Inc.* | 336,187 | |||
| 3,700 | HotJobs.com, Ltd.* | 70,531 | |||
| 17,000 | infoUSA, Inc. | 105,188 | |||
| 9,300 | Interliant, Inc.* | 123,225 | |||
| 800 | Keynote Systems, Inc.* | 24,200 | |||
| 1,700 | McAfee.com Corp.* | 44,731 | |||
| 2,400 | Metricom, Inc.* | 97,650 | |||
| 3,200 | Modem Media, Inc.* | 33,800 | |||
| 5,400 | MP3.com, Inc.* | 44,550 | |||
| 3,400 | Multex.com, Inc.* | 73,950 | |||
| 6,000 | Nanogen, Inc.* | 144,750 | |||
| 5,500 | Netcentives, Inc.* | 52,938 | |||
| 8,000 | Network Commerce, Inc.* | 44,000 | |||
| 11,600 | Pegasus Systems, Inc.* | 230,550 | |||
| 2,200 | PurchasePro.com, Inc.* | 127,119 | |||
| 13,300 | Sylvan Learning Systems, Inc.* | 192,019 | |||
| 30,400 | Technology Solutions Co. | 94,050 | |||
| 3,800 | The TriZetto Group, Inc.* | 38,950 | |||
| 3,400 | Travelocity.com, Inc.* | 46,750 | |||
| 4,900 | U.S. Interactive, Inc.* | 38,281 | |||
| 4,513,086 | |||||
| Internet – 4.0% | |||||
| 2,000 | 24/7 Media, Inc.* | 28,875 | |||
| 2,800 | About.com, Inc.* | 122,150 | |||
| 6,100 | AppNet, Inc.* | 301,569 | |||
| 4,100 | Ask Jeeves, Inc.* | 125,050 | |||
| 5,400 | Axent Technologies, Inc.* | 128,250 | |||
|
Shares |
Description | Value | |||
|---|---|---|---|---|---|
| Common Stocks – (continued) | |||||
| Internet – (continued) | |||||
| 6,700 | Be Free, Inc.* | $ 40,619 | |||
| 5,900 | Broadbase Software, Inc.* | 123,531 | |||
| 2,400 | CareInsite, Inc.* | 53,700 | |||
| 9,700 | Digital Island* | 287,969 | |||
| 1,200 | DigitalThink, Inc.* | 40,875 | |||
| 2,600 | Digitas, Inc.* | 35,750 | |||
| 5,800 | eGain Communications Corp.* | 75,762 | |||
| 1,900 | eMerge Interactive, Inc.* | 41,919 | |||
| 3,100 | F5 Networks, Inc.* | 179,800 | |||
| 1,800 | FirePond, Inc.* | 37,575 | |||
| 2,000 | GetThere.com, Inc.* | 34,750 | |||
| 5,400 | GlobalNet Financial.com, Inc.* | 53,325 | |||
| 4,800 | Go2Net, Inc.* | 331,200 | |||
| 3,200 | GoAmerica, Inc.* | 35,000 | |||
| 5,100 | GoTo.com, Inc.* | 94,987 | |||
| 8,300 | High Speed Access Corp.* | 47,725 | |||
| 1,400 | Hotel Reservations Network, Inc.* | 49,263 | |||
| 4,400 | IDT Corp.* | 174,900 | |||
| 3,000 | IMPSAT Fiber Networks, Inc.* | 46,500 | |||
| 1,100 | Interactive Intelligence, Inc.* | 48,744 | |||
| 10,000 | Internet Pictures Corp.* | 78,125 | |||
| 2,500 | internet.com Corp.* | 78,750 | |||
| 11,100 | Intertrust Technologies Corp.* | 178,294 | |||
| 4,100 | InterWorld Corp.* | 82,512 | |||
| 6,000 | Interwoven, Inc.* | 576,000 | |||
| 3,100 | IntraNet Solutions, Inc.* | 140,469 | |||
| 8,300 | iXl Enterprises, Inc.* | 79,369 | |||
| 2,600 | LifeMinders, Inc.* | 78,000 | |||
| 7,700 | LookSmart, Ltd.* | 128,975 | |||
| 9,300 | Mail.com, Inc.* | 58,706 | |||
| 3,400 | Marimba, Inc.* | 57,375 | |||
| 1,500 | MatrixOne, Inc.* | 51,750 | |||
| 2,000 | Media Metrix, Inc.* | 49,500 | |||
| 4,200 | MyPoints.com, Inc.* | 57,225 | |||
| 1,600 | NBC Internet, Inc.* | 16,800 | |||
| 3,500 | Net Perceptions, Inc.* | 49,656 | |||
| 3,100 | Netegrity, Inc.* | 272,800 | |||
| 2,800 | Netopia, Inc.* | 102,550 | |||
| 4,400 | Network Access Solutions Corp.* | 34,925 | |||
| 900 | Nuance Communications, Inc.* | 118,462 | |||
| 1,900 | OneMain.com, Inc.* | 18,733 | |||
| 1,300 | ORATEC Interventions, Inc.* | 46,231 | |||
| 1,500 | OTG Software, Inc.* | 33,563 | |||
| 3,100 | Packeteer, Inc.* | 149,187 | |||
| 2,900 | Persistence Software, Inc.* | 49,300 | |||
| 2,600 | Primus Knowledge Solutions, Inc.* | 61,263 | |||
| 5,700 | Prodigy Communications Corp.* | 42,928 | |||
| 4,200 | Quintus Corp.* | 54,863 | |||
| 6,100 | Rare Medium Group, Inc.* | 61,000 | |||
| 9,100 | Rhythms NetConnections, Inc.* | 81,900 | |||
| 1,300 | Saba Software, Inc.* | 37,213 | |||
| 5,100 | SciQuest.com, Inc.* | 49,088 | |||
| 1,100 | Selectica, Inc.* | 52,456 | |||
| 1,200 | SmartServ Online, Inc.* | 44,175 | |||
| 2,200 | SonicWall, Inc.* | 167,475 | |||
| 1,900 | SportsLine.com, Inc.* | 33,606 | |||
|
Shares |
Description | Value | ||||
|---|---|---|---|---|---|---|
| Common Stocks – (continued) | ||||||
| Internet – (continued) | ||||||
| 300 | StarMedia, Network, Inc.* | $ 2,550 | ||||
| 4,400 | Ticketmaster Online-CitySearch, Inc.
Class B* |
105,875 | ||||
| 1,900 | Tumbleweed Communications Corp.* | 118,987 | ||||
| 2,800 | Tut Systems, Inc.* | 281,750 | ||||
| 5,000 | Ventro Corp.* | 71,250 | ||||
| 3,600 | VIA NET.WORKS, Inc.* | 46,575 | ||||
| 3,700 | Viador, Inc.* | 34,225 | ||||
| 7,300 | Viant Corp.* | 101,287 | ||||
| 3,000 | WorldGate Communications, Inc.* | 59,250 | ||||
| 6,634,761 | ||||||
| Leisure – 1.2% | ||||||
| 21,000 | Fairfield Communities, Inc.* | 168,000 | ||||
| 17,300 | Pinnacle Entertainment, Inc.* | 356,812 | ||||
| 3,700 | Quokka Sports, Inc.* | 25,438 | ||||
| 8,500 | Russ Berrie & Company, Inc. | 174,250 | ||||
| 15,750 | SCP Pool Corp.* | 461,672 | ||||
| 37,350 | Station Casinos, Inc.* | 536,906 | ||||
| 18,200 | WMS Industries, Inc.* | 291,200 | ||||
| 2,014,278 | ||||||
| Life Insurance – 0.5% | ||||||
| 14,578 | Delphi Financial Group, Inc. | 603,165 | ||||
| 12,500 | FBL Financial Group, Inc. | 184,375 | ||||
| 787,540 | ||||||
| Media – 0.7% | ||||||
| 8,200 | Gaylord Entertainment Co. | 214,225 | ||||
| 13,500 | Insight Communications, Inc.* | 240,469 | ||||
| 11,600 | Media General, Inc. | 597,400 | ||||
| 11,700 | Playboy Enterprises, Inc. Class B* | 171,844 | ||||
| 1,223,938 | ||||||
| Medical Products – 2.4% | ||||||
| 11,100 | ADAC Laboratories* | 248,362 | ||||
| 11,400 | ArthroCare Corp.* | 507,300 | ||||
| 17,600 | Henry Schein, Inc.* | 323,400 | ||||
| 6,400 | Invacare Corp. | 172,400 | ||||
| 45,500 | Owens & Minor, Inc. | 696,719 | ||||
| 7,300 | PolyMedica Corp.* | 259,150 | ||||
| 9,900 | Respironics, Inc.* | 187,481 | ||||
| 16,700 | Scott Technologies, Inc.* | 316,256 | ||||
| 21,200 | The Cooper Cos., Inc. | 696,950 | ||||
| 14,500 | Varian Medical Systems, Inc. | 666,094 | ||||
| 4,074,112 | ||||||
| Medical Providers – 2.1% | ||||||
| 37,100 | AmeriPath, Inc.* | 505,488 | ||||
| 21,200 | Apria Healthcare Group, Inc.* | 315,350 | ||||
| 24,000 | Foundation Health Systems, Inc.* | 421,500 | ||||
| 7,800 | Laboratory Corp. of America Holdings | 922,837 | ||||
| 48,700 | Omnicare, Inc. | 666,581 | ||||
| 21,600 | Triad Hospitals, Inc.* | 623,700 | ||||
| 3,455,456 | ||||||
|
Shares |
Description | Value | |||
|---|---|---|---|---|---|
| Common Stocks – (continued) | |||||
| Mining – 1.9% | |||||
| 15,500 | AK Steel Holding Corp. | $ 168,563 | |||
| 29,900 | Commercial Metals Co. | 835,331 | |||
| 24,400 | CONSOL Energy, Inc. | 507,825 | |||
| 17,000 | Mueller Industries, Inc.* | 536,562 | |||
| 37,000 | National Steel Corp. Class B | 150,313 | |||
| 23,200 | Quanex Corp. | 433,550 | |||
| 18,400 | Reliance Steel & Aluminum Corp. | 379,500 | |||
| 8,400 | U.S. Can Corp.* | 160,650 | |||
| 3,172,294 | |||||
| Motor Vehicle – 0.6% | |||||
| 33,000 | Lear Corp.* | 711,562 | |||
| 5,600 | Oshkosh Truck Corp. | 198,800 | |||
| 13,000 | Winnebago Industries, Inc. | 166,563 | |||
| 1,076,925 | |||||
| Oil Refining – 0.5% | |||||
| 10,900 | Northwestern Corp. | 237,075 | |||
| 24,000 | Western Gas Resources, Inc. | 526,500 | |||
| 763,575 | |||||
| Oil Services – 1.2% | |||||
| 8,600 | Atwood Oceanics, Inc.* | 390,225 | |||
| 85,500 | Parker Drilling Co.* | 614,531 | |||
| 15,000 | Patterson Energy, Inc.* | 470,625 | |||
| 11,000 | Seitel, Inc. | 172,563 | |||
| 8,900 | UTI Energy Corp.* | 331,525 | |||
| 1,979,469 | |||||
| Property Insurance – 1.2% | |||||
| 7,800 | Argonaut Group, Inc. | 128,700 | |||
| 21,800 | Fidelity National Financial, Inc. | 434,637 | |||
| 15,200 | First American Financial Corp. | 250,800 | |||
| 7,800 | HCC Insurance Holdings, Inc. | 164,775 | |||
| 6,900 | PMA Capital Corp. | 116,438 | |||
| 7,700 | SCPIE Holdings, Inc. | 167,475 | |||
| 11,800 | Stewart Information Services Corp. | 158,562 | |||
| 19,800 | The Commerce Group, Inc. | 514,800 | |||
| 1,936,187 | |||||
| Publishing – 1.6% | |||||
| 19,100 | ADVO, Inc.* | 781,906 | |||
| 8,300 | Penton Media, Inc. | 259,894 | |||
| 23,400 | Pulitzer, Inc. | 1,007,662 | |||
| 16,800 | The Standard Register Co. | 215,250 | |||
| 42,500 | The Topps Co., Inc.* | 334,688 | |||
| 2,599,400 | |||||
| Restaurants – 1.1% | |||||
| 26,100 | Buffets, Inc.* | 345,825 | |||
| 10,600 | CEC Entertainment, Inc.* | 306,075 | |||
| 22,200 | RARE Hospitality International, Inc.* | 624,375 | |||
| 21,400 | Ruby Tuesday, Inc. | 267,500 | |||
| 10,000 | Sonic Corp.* | 326,250 | |||
| 1,870,025 | |||||
|
Shares |
Description | Value | |||
|---|---|---|---|---|---|
| Common Stocks – (continued) | |||||
| Security/Asset Management – 2.1% | |||||
| 17,500 | Affiliated Managers Group, Inc.* | $ 975,625 | |||
| 15,300 | BlackRock, Inc.* | 627,300 | |||
| 4,800 | Donaldson, Lufkin & Jenrette, Inc-
DLJdirect* |
39,000 | |||
| 2,200 | eSPEED, Inc.* | 67,650 | |||
| 21,800 | Jefferies Group, Inc. | 663,537 | |||
| 12,200 | National Discount Brokers Group, Inc.* | 441,488 | |||
| 15,200 | The John Nuveen Co. | 689,700 | |||
| 3,504,300 | |||||
| Semiconductors – 4.1% | |||||
| 10,600 | Actel Corp.* | 466,400 | |||
| 17,700 | Alliance Semiconductor Corp.* | 465,731 | |||
| 12,150 | ANADIGICS, Inc.* | 437,400 | |||
| 6,200 | Asyst Technologies, Inc.* | 162,363 | |||
| 21,200 | Cirrus Logic, Inc.* | 641,300 | |||
| 9,200 | Cohu, Inc. | 188,600 | |||
| 2,100 | Elantec Semiconductor, Inc.* | 185,850 | |||
| 4,500 | Electro Scientific Industries, Inc.* | 185,344 | |||
| 8,150 | Exar Corp.* | 983,094 | |||
| 7,000 | General Semiconductor, Inc.* | 101,938 | |||
| 4,000 | Microsemi Corp.* | 169,000 | |||
| 7,100 | Oak Technology, Inc.* | 206,787 | |||
| 24,800 | Pioneer-Standard Electronics, Inc. | 339,450 | |||
| 5,200 | PRI Automation, Inc.* | 268,450 | |||
| 6,000 | Rainbow Technologies, Inc.* | 237,750 | |||
| 15,750 | Remec, Inc.* | 448,875 | |||
| 22,700 | Silicon Valley Group, Inc.* | 632,762 | |||
| 4,100 | SIPEX Corp.* | 176,556 | |||
| 8,300 | Varian Semiconductor Equipment
Associates, Inc.* |
474,137 | |||
| 10,300 | White Electronic Designs Corp. | 164,800 | |||
| 6,936,587 | |||||
| Specialty Retail – 2.7% | |||||
| 22,400 | Bandag, Inc. | 729,400 | |||
| 18,700 | Borders Group, Inc.* | 248,944 | |||
| 17,000 | Brown Shoe Co. | 182,750 | |||
| 5,600 | Drugstore.com, Inc.* | 34,300 | |||
| 21,900 | Genesco, Inc.* | 354,506 | |||
| 21,500 | Haverty Furniture Cos., Inc. | 248,594 | |||
| 3,200 | Hollywood Entertainment Corp.* | 22,400 | |||
| 4,100 | Hollywood.com, Inc.* | 34,338 | |||
| 4,200 | Insight Enterprises, Inc.* | 211,050 | |||
| 19,850 | InterTAN, Inc.* | 275,419 | |||
| 13,400 | Michaels Stores, Inc.* | 469,000 | |||
| 24,000 | PETCO Animal Supplies, Inc.* | 504,000 | |||
| 18,400 | School Specialty, Inc.* | 332,350 | |||
| 37,400 | Spiegel, Inc. | 254,787 | |||
| 7,300 | ValueVision International, Inc.* | 213,981 | |||
| 13,000 | Zale Corp.* | 480,187 | |||
| 4,596,006 | |||||
| Telephone – 1.0% | |||||
| 13,100 | CFW Communications Co. | 445,400 | |||
| 4,600 | Commonwealth Telephone
Enterprises, Inc.* |
$ 177,675 | |||
| 10,200 | CTC Communications Group, Inc.* | 251,175 | |||
|
Shares |
Description | Value | |||
|---|---|---|---|---|---|
| Common Stocks – (continued) | |||||
| Telephone – (continued) | |||||
| 6,900 | DSL.net, Inc.* | 42,263 | |||
| 15,900 | Electric Lightwave, Inc.* | 206,700 | |||
| 5,900 | Illuminet Holdings, Inc.* | 234,525 | |||
| 1,700 | ITXC Corp.* | 34,000 | |||
| 2,400 | Net2Phone, Inc.* | 70,950 | |||
| 3,300 | Network Plus Corp.* | 37,744 | |||
| 14,300 | Pac-West Telecomm, Inc.* | 201,987 | |||
| 6,500 | TALK.com, Inc.* | 46,719 | |||
| 1,749,138 | |||||
| Thrifts – 2.0% | |||||
| 14,200 | Bank United Corp. | 639,000 | |||
| 18,400 | Bay View Capital Corp. | 179,400 | |||
| 12,700 | Downey Financial Corp. | 425,450 | |||
| 41,200 | FirstFed Financial Corp.* | 741,600 | |||
| 40,889 | Republic Security Financial Corp. | 176,334 | |||
| 37,300 | Richmond County Financial Corp. | 750,662 | |||
| 26,600 | Staten Island Bancorp, Inc. | 490,438 | |||
| 3,402,884 | |||||
| Tobacco – 0.3% | |||||
| 20,900 | Universal Corp. | 540,788 | |||
| Truck Freight – 1.2% | |||||
| 30,800 | American Freightways Corp.* | 506,275 | |||
| 13,900 | Arkansas Best Corp. | 209,369 | |||
| 20,600 | Arnold Industries, Inc. | 320,587 | |||
| 22,000 | Overseas Shipholding Group | 647,625 | |||
| 21,700 | Yellow Corp.* | 330,925 | |||
| 2,014,781 | |||||
| Wireless – 0.9% | |||||
| 25,300 | Audiovox Corp.* | 458,563 | |||
| 10,800 | Leap Wireless International, Inc.* | 857,250 | |||
| 2,300 | Rural Celluar Corp.* | 174,800 | |||
| 1,490,613 | |||||
| TOTAL COMMON STOCKS
(Cost $145,967,007) |
$ 166,820,431 | ||||
| Principal
Amount |
Interest
Rate |
Maturity
Date |
Value | |||||
|---|---|---|---|---|---|---|---|---|
| Repurchase Agreement – 1.3% | ||||||||
| Joint Repurchase Agreement Account IIˆ | ||||||||
| $2,200,000
|
6.66 | % | 09/01/2000 | $ 2,200,000 | ||||
| |
||||||||
| TOTAL REPURCHASE AGREEMENT
(Cost $2,200,000) |
$ 2,200,000 | |||||||
| |
||||||||
| TOTAL INVESTMENTS
(Cost $148,167,007) |
$169,020,431 | |||||||
| |
||||||||
*
|
Non-income producing security.
|
|
ˆ
|
Joint repurchase agreement was entered into on August 31, 2000.
|
| The percentage shown for each investment category reflects the value of investments in that category as a percentage of total net
assets.
|
| The following graph shows the value, as of August 31, 2000, of a $10,000 investment made on December 31, 1998 (commencement of
operations) in Institutional shares at (NAV) of the Goldman Sachs CORE Large Cap Value Fund. For comparative purposes, the performance of the Fund’s benchmark (Russell 1000 Value Index with dividends reinvested) is shown. This performance data
represents past performance and should not be considered indicative of future performance which will fluctuate with changes in market conditions. These performance fluctuations will cause an investor’s shares, when redeemed, to be worth more or less
than their original cost. Performance of Class A, Class B, Class C and Service shares will vary from Institutional shares due to differences in fees and loads.
|
| CORE Large Cap Value Fund’s Lifetime Performance
|
| Growth of a $10,000 Investment, Distributions Reinvested January 1, 1999 to August 31, 2000
(a)
.
|
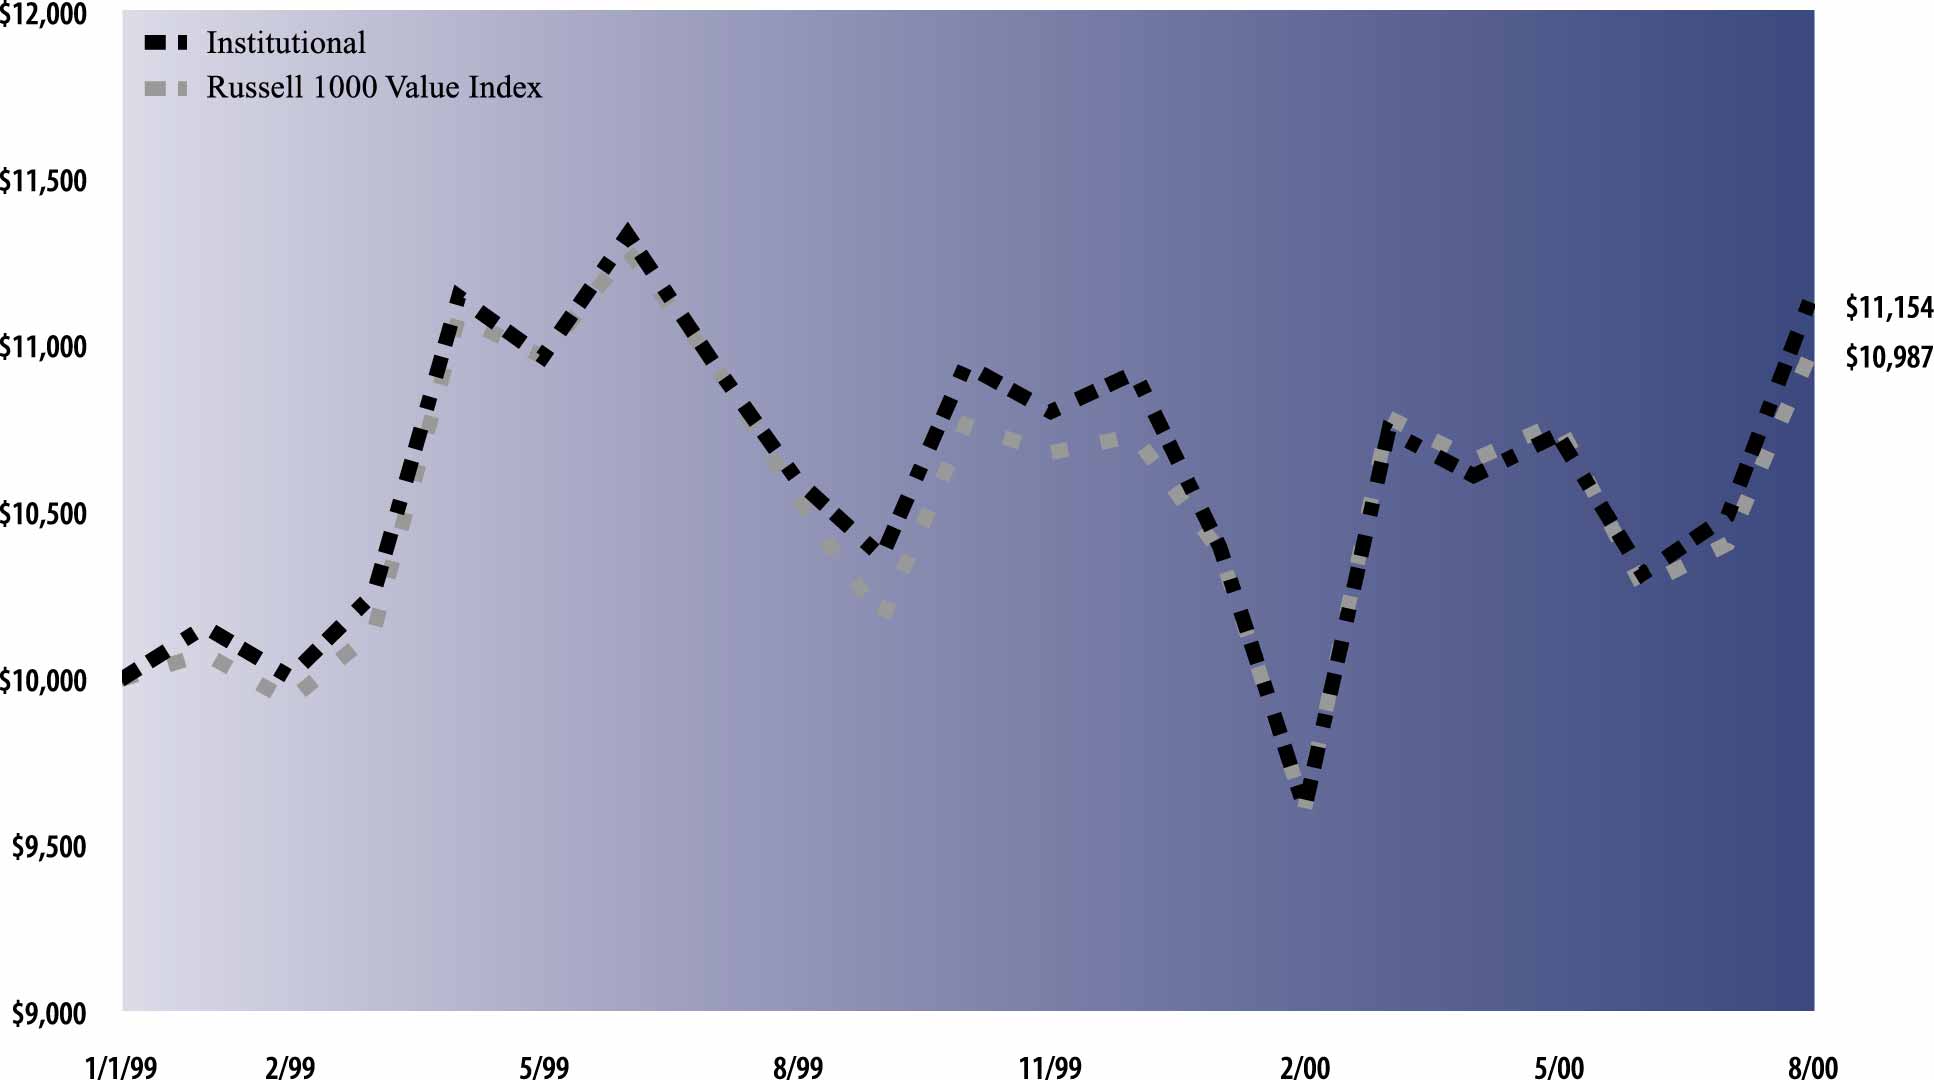 |
| Average Annual Total Return through August 31, 2000 | Since Inception | One Year | ||
|---|---|---|---|---|
| Class A (commenced December 31, 1998) | ||||
| Excluding sales charges | 6.35% | 4.68% | ||
| Including sales charges | 2.82% | -1.04% | ||
| |
||||
| Class B (commenced December 31, 1998) | ||||
| Excluding contingent deferred sales charges | 5.52% | 3.96% | ||
| Including contingent deferred sales charges | 3.16% | -1.12% | ||
| |
||||
| Class C (commenced December 31, 1998) | ||||
| Excluding contingent deferred sales charges | 5.56% | 3.97% | ||
| Including contingent deferred sales charges | 5.56% | 2.96% | ||
| |
||||
| Institutional Class (commenced December 31, 1998) | 6.95% | 5.20% | ||
| |
||||
| Service Class (commenced December 31, 1998) | 6.24% | 4.60% | ||
| |
||||
(a)
|
For comparative purposes, initial investments are assumed to be made on the first day of the month following commencement of
operations.
|
|
Shares |
Description | Value | |||
|---|---|---|---|---|---|
| Common Stocks – 99.3% | |||||
| Airlines – 0.4% | |||||
| 13,600 | AMR Corp. | $ 446,250 | |||
| 7,500 | Delta Air Lines, Inc. | 371,250 | |||
| 8,100 | UAL Corp. | 386,775 | |||
| 1,204,275 | |||||
| Alcohol – 0.4% | |||||
| 4,500 | Adolph Coors Co. Class B | 268,031 | |||
| 5,700 | Anheuser-Busch Cos., Inc. | 449,232 | |||
| 7,800 | Brown-Forman Corp. Class B | 413,400 | |||
| 1,130,663 | |||||
| Banks – 15.2% | |||||
| 97,300 | Bank of America Corp. | 5,211,631 | |||
| 26,200 | Bank One Corp. | 923,550 | |||
| 15,100 | BB&T Corp. | 408,644 | |||
| 252,200 | Citigroup, Inc. | 14,722,175 | |||
| 29,600 | Comerica, Inc. | 1,666,850 | |||
| 11,300 | Cullen/Frost Bankers, Inc. | 350,300 | |||
| 8,550 | Fifth Third Bancorp | 394,903 | |||
| 24,237 | Firstar Corp. | 578,658 | |||
| 98,200 | FleetBoston Financial Corp. | 4,191,912 | |||
| 23,400 | J.P. Morgan & Co., Inc. | 3,912,187 | |||
| 19,900 | Mellon Financial Corp. | 900,475 | |||
| 20,200 | PNC Financial Services Group | 1,190,538 | |||
| 16,600 | SouthTrust Corp. | 467,913 | |||
| 38,100 | SunTrust Banks, Inc. | 1,881,187 | |||
| 23,000 | The Bank of New York Co., Inc. | 1,206,063 | |||
| 72,000 | The Chase Manhattan Corp. | 4,023,000 | |||
| 20,600 | UnionBanCal Corp. | 511,138 | |||
| 94,800 | Wells Fargo & Co. | 4,094,175 | |||
| 46,635,299 | |||||
| Chemicals – 2.8% | |||||
| 21,600 | Air Products & Chemicals, Inc. | 784,350 | |||
| 10,000 | Cabot Corp. | 370,000 | |||
| 22,465 | E.I. du Pont de Nemours & Co. | 1,008,117 | |||
| 18,700 | Minnesota Mining &
Manufacturing Co. |
1,739,100 | |||
| 24,100 | PPG Industries, Inc. | 976,050 | |||
| 32,100 | Praxair, Inc. | 1,420,425 | |||
| 83,400 | The Dow Chemicals Co. | 2,184,037 | |||
| 8,482,079 | |||||
| Clothing – 0.2% | |||||
| 14,400 | Intimate Brands, Inc. | 232,200 | |||
| 14,400 | The Limited, Inc. | 288,000 | |||
| 520,200 | |||||
| Computer Hardware – 2.0% | |||||
| 7,000 | 3Com Corp. | 116,375 | |||
| 28,800 | Apple Computer, Inc.* | 1,755,000 | |||
| 27,500 | Hewlett-Packard Co. | 3,320,625 | |||
| 5,500 | Network Appliance, Inc.* | 643,500 | |||
| 1,100 | RSA Security, Inc.* | 64,969 | |||
| 3,100 | SanDisk Corp.* | 258,850 | |||
| 6,159,319 | |||||
|
Shares |
Description |
Value |
|||
|---|---|---|---|---|---|
| Common Stocks – (continued) | |||||
| Computer Software – 0.9% | |||||
| 3,000 | International Business Machines, Inc. | $ 396,000 | |||
| 3,200 | Intuit, Inc.* | 191,600 | |||
| 2,800 | Mercury Interactive Corp.* | 342,125 | |||
| 4,000 | Oracle Corp.* | 363,750 | |||
| 4,600 | Sabre Holdings Corp. | 128,225 | |||
| 11,500 | VERITAS Software Corp.* | 1,386,469 | |||
| 2,808,169 | |||||
| Construction – 0.6% | |||||
| 22,300 | Fluor Corp. | 667,607 | |||
| 8,100 | Quanta Services, Inc.* | 378,675 | |||
| 4,800 | Southdown, Inc. | 301,200 | |||
| 18,300 | USG Corp. | 589,031 | |||
| 1,936,513 | |||||
| Consumer Durables – 0.3% | |||||
| 14,900 | Sherwin-Williams Co. | 342,700 | |||
| 15,600 | Whirlpool Corp. | 592,800 | |||
| 935,500 | |||||
| Defense/Aerospace – 1.6% | |||||
| 31,700 | Northrop Grumman Corp. | 2,466,656 | |||
| 47,900 | The Boeing Co. | 2,568,638 | |||
| 5,035,294 | |||||
| Department Store – 1.2% | |||||
| 26,100 | Federated Department Stores, Inc.* | 721,013 | |||
| 13,400 | Kohl’s Corp.* | 750,400 | |||
| 57,500 | Sears, Roebuck & Co. | 1,793,281 | |||
| 11,400 | Target Corp. | 265,050 | |||
| 3,529,744 | |||||
| Drugs – 3.8% | |||||
| 18,800 | Allergan, Inc. | 1,374,750 | |||
| 18,900 | Alpharma, Inc. | 1,070,213 | |||
| 4,800 | American Home Products Corp. | 260,100 | |||
| 5,700 | Bristol-Myers Squibb Co. | 302,100 | |||
| 15,600 | Cardinal Health, Inc. | 1,276,275 | |||
| 8,700 | Forest Laboratories, Inc.* | 851,513 | |||
| 3,100 | Genentech, Inc.* | 590,550 | |||
| 35,100 | IVAX Corp.* | 1,215,337 | |||
| 7,500 | Jones Pharma, Inc. | 268,125 | |||
| 55,900 | Merck & Co., Inc. | 3,906,012 | |||
| 4,600 | Millennium Pharmaceuticals* | 658,375 | |||
| 11,773,350 | |||||
| Electrical Equipment – 1.4% | |||||
| 6,600 | ADC Telecommunications, Inc.* | 270,188 | |||
| 20,800 | AVX Corp. | 622,700 | |||
| 2,500 | Corning, Inc. | 819,844 | |||
| 11,600 | KEMET Corp.* | 348,000 | |||
| 5,100 | Level 3 Communications, Inc.* | 444,895 | |||
| 8,600 | Motorola, Inc. | 310,137 | |||
| 3,718 | Nortel Networks Corp. | 303,249 | |||
| 3,500 | Scientific-Atlanta, Inc. | 272,781 | |||
|
Shares |
Description | Value | ||||
|---|---|---|---|---|---|---|
| Common Stocks – (continued) | ||||||
| Electrical Equipment – (continued) | ||||||
| 5,600 | Tektronix, Inc. | $ 426,650 | ||||
| 13,650 | Vishay Intertechnology, Inc.* | 550,266 | ||||
| 4,368,710 | ||||||
| Electrical Utilities – 4.6% | ||||||
| 14,500 | Calpine Corp.* | 1,435,500 | ||||
| 28,400 | Constellation Energy Group | 1,086,300 | ||||
| 6,722 | Dominion Resources, Inc. | 356,266 | ||||
| 24,700 | DTE Energy Co. | 858,325 | ||||
| 28,000 | Dynegy, Inc. | 1,260,000 | ||||
| 26,800 | Energy East Corp. | 608,025 | ||||
| 75,300 | Entergy Corp. | 2,291,944 | ||||
| 9,100 | FPL Group, Inc. | 485,712 | ||||
| 13,500 | PG&E Corp. | 390,656 | ||||
| 45,100 | Public Service Enterprise | 1,634,875 | ||||
| 1,729 | Sempra Energy | 33,716 | ||||
| 2,200 | The Southern Co. | 65,863 | ||||
| 22,700 | TXU Corp. | 793,081 | ||||
| 59,200 | Unicom Corp. | 2,704,700 | ||||
| 14,004,963 | ||||||
| Energy Resources – 9.1% | ||||||
| 34,200 | Amerada Hess Corp. | 2,340,562 | ||||
| 23,100 | Apache Corp. | 1,455,300 | ||||
| 53,500 | Chevron Corp. | 4,520,750 | ||||
| 5,600 | Devon Energy Corp. | 327,950 | ||||
| 154,630 | Exxon Mobil Corp. | 12,621,674 | ||||
| 40,900 | Kerr-McGee Corp. | 2,584,369 | ||||
| 18,900 | Murphy Oil Corp. | 1,261,575 | ||||
| 15,700 | Noble Affiliates, Inc. | 608,375 | ||||
| 48,100 | Occidental Petroleum Corp. | 1,040,162 | ||||
| 6,300 | Phillips Petroleum Co. | 389,813 | ||||
| 29,500 | USX-Marathon Group | 809,406 | ||||
| 27,959,936 | ||||||
| Entertainment – 1.7% | ||||||
| 130,000 | The Walt Disney Co. | 5,061,875 | ||||
| Equity REIT – 0.8% | ||||||
| 52,700 | Equity Office Properties Trust | 1,521,712 | ||||
| 21,000 | Equity Residential Properties Trust | 1,008,000 | ||||
| 2,529,712 | ||||||
| Financial Services – 2.4% | ||||||
| 18,600 | American Express Co. | 1,099,725 | ||||
| 4,700 | C.I.T. Group, Inc. | 82,250 | ||||
| 27,600 | Comdisco, Inc. | 662,400 | ||||
| 37,700 | Federal National Mortgage Assn. | 2,026,375 | ||||
| 20,900 | General Electric Co. | 1,226,569 | ||||
| 7,100 | Household International, Inc. | 340,800 | ||||
| 14,700 | Marsh & McLennan Cos., Inc. | 1,745,625 | ||||
| 2,600 | Providian Financial Corp. | 298,837 | ||||
| 7,482,581 | ||||||
|
Shares |
Description | Value | |||
|---|---|---|---|---|---|
| Common Stocks – (continued) | |||||
| Food & Beverage – 4.0% | |||||
| 56,200 | ConAgra, Inc. | $ 1,029,163 | |||
| 28,000 | Hormel Foods Corp. | 432,250 | |||
| 90,700 | IBP, Inc. | 1,456,869 | |||
| 12,700 | McCormick & Co., Inc. | 370,681 | |||
| 58,800 | Nabisco Group Holdings Corp. | 1,650,075 | |||
| 26,700 | Nabisco Holdings Corp. | 1,426,781 | |||
| 78,200 | PepsiCo., Inc. | 3,333,275 | |||
| 6,900 | Suiza Foods Corp.* | 345,000 | |||
| 6,500 | Supervalu, Inc. | 97,094 | |||
| 25,000 | SYSCO Corp. | 1,057,812 | |||
| 5,000 | The Coca-Cola Co. | 263,125 | |||
| 28,600 | The Pepsi Bottling Group, Inc. | 908,050 | |||
| 12,370,175 | |||||
| Forest – 1.0% | |||||
| 33,200 | Georgia-Pacific Group | 888,100 | |||
| 8,100 | International Paper Co. | 258,187 | |||
| 31,400 | Kimberly-Clark Corp. | 1,836,900 | |||
| 2,983,187 | |||||
| Grocery – 0.2% | |||||
| 9,900 | Safeway, Inc.* | 488,194 | |||
| Heavy Electrical – 0.8% | |||||
| 8,200 | American Power Conversion Corp.* | 195,262 | |||
| 28,800 | Emerson Electric Co. | 1,906,200 | |||
| 7,300 | Rockwell International Corp. | 295,194 | |||
| 2,396,656 | |||||
| Home Products – 1.6% | |||||
| 12,300 | Alberto-Culver Co. Class B | 348,244 | |||
| 14,300 | Avon Products, Inc. | 560,381 | |||
| 12,300 | Colgate-Palmolive Co. | 626,531 | |||
| 66,500 | Ralston Purina Group | 1,504,563 | |||
| 6,700 | The Estee Lauder Cos., Inc. | 274,281 | |||
| 24,000 | The Procter & Gamble Co. | 1,483,500 | |||
| 4,797,500 | |||||
| Hotels – 0.2% | |||||
| 12,500 | Marriott International, Inc. | 493,750 | |||
| Industrial Parts – 1.9% | |||||
| 10,100 | American Standard Cos., Inc.* | 467,756 | |||
| 10,800 | Caterpillar, Inc. | 396,900 | |||
| 29,300 | Ingersoll-Rand Co. | 1,334,981 | |||
| 17,200 | Parker-Hannifin Corp. | 598,775 | |||
| 8,300 | Tecumseh Products Co. | 329,925 | |||
| 2,200 | Textron, Inc. | 123,338 | |||
| 40,200 | United Technologies Corp. | 2,509,987 | |||
| 5,761,662 | |||||
| Industrial Services – 0.6% | |||||
| 31,900 | Hertz Corp. | 976,937 | |||
| 19,200 | Robert Half International, Inc.* | 610,800 | |||
| 15,100 | Spherion Corp.* | 185,919 | |||
| 1,773,656 | |||||
|
Shares |
Description | Value | |||
|---|---|---|---|---|---|
| Common Stocks – (continued) | |||||
| Information Services – 1.2% | |||||
| 6,600 | Computer Sciences Corp.* | $ 521,812 | |||
| 10,400 | Electronic Data Systems Corp. | 518,050 | |||
| 47,400 | First Data Corp. | 2,260,387 | |||
| 900 | Healtheon/WebMD Corp.* | 15,863 | |||
| 11,200 | TeleTech Holdings, Inc.* | 365,400 | |||
| 3,681,512 | |||||
| Internet – 0.1% | |||||
| 3,900 | At Home Corp. Series A* | 56,794 | |||
| 1,600 | Critical Path, Inc.* | 123,600 | |||
| 600 | E*TRADE Group, Inc.* | 10,650 | |||
| 7,400 | Internet Capital Group, Inc.* | 258,075 | |||
| 449,119 | |||||
| Leisure – 1.2% | |||||
| 35,000 | Brunswick Corp. | 656,250 | |||
| 46,900 | Eastman Kodak Co. | 2,919,525 | |||
| 3,575,775 | |||||
| Life Insurance – 2.4% | |||||
| 7,900 | AFLAC, Inc. | 426,600 | |||
| 31,100 | American General Corp. | 2,264,469 | |||
| 29,600 | Cigna Corp. | 2,878,600 | |||
| 6,500 | Lincoln National Corp. | 351,000 | |||
| 15,400 | UnitedHealth Group, Inc. | 1,455,300 | |||
| 7,375,969 | |||||
| Media – 2.6% | |||||
| 83,200 | AT&T Corp.-Liberty Media Corp.* | 1,778,400 | |||
| 14,200 | Cox Communications, Inc.* | 504,988 | |||
| 70,700 | Fox Entertainment Group, Inc.* | 2,045,881 | |||
| 26,900 | General Motors Corp. Class H* | 891,063 | |||
| 54,900 | Infinity Broadcasting Corp.* | 2,079,337 | |||
| 1,000 | RCN Corp.* | 24,250 | |||
| 9,400 | Time Warner, Inc. | 803,700 | |||
| 8,127,619 | |||||
| Medical Products – 3.1% | |||||
| 17,800 | Abbott Laboratories | 778,750 | |||
| 7,800 | Bausch & Lomb, Inc. | 278,850 | |||
| 84,900 | Johnson & Johnson | 7,805,494 | |||
| 5,600 | Techne Corp.* | 534,800 | |||
| 9,397,894 | |||||
| Medical Providers – 0.3% | |||||
| 16,100 | HCA-The Healthcare Corp. | 555,450 | |||
| 3,200 | Quest Diagnostics, Inc.* | 396,000 | |||
| 951,450 | |||||
| Mining – 0.8% | |||||
| 23,300 | Alcan Aluminium Ltd. | 764,531 | |||
| 24,504 | Alcoa, Inc. | 814,758 | |||
| 21,300 | Nucor Corp. | 782,775 | |||
| 2,362,064 | |||||
|
Shares |
Description | Value | |||
|---|---|---|---|---|---|
| Common Stocks – (continued) | |||||
| Motor Vehicle – 2.7% | |||||
| 30,523 | Delphi Automotive Systems Corp. | $ 501,722 | |||
| 99,296 | Ford Motor Co. | 2,401,722 | |||
| 62,200 | General Motors Corp. | 4,490,062 | |||
| 12,900 | Johnson Controls, Inc. | 689,344 | |||
| 7,500 | Navistar International Corp.* | 281,250 | |||
| 8,364,100 | |||||
| Oil Refining – 0.7% | |||||
| 73,628 | Conoco, Inc. Class B | 1,923,531 | |||
| 12,100 | Ultramar Diamond Shamrock Corp. | 283,594 | |||
| 2,207,125 | |||||
| Oil Services – 0.1% | |||||
| 4,400 | BJ Services Co.* | 294,800 | |||
| Property Insurance – 5.7% | |||||
| 44,200 | Allstate Corp. | 1,284,562 | |||
| 5,500 | Ambac Financial Group, Inc. | 355,438 | |||
| 76,237 | American International Group, Inc. | 6,794,623 | |||
| 5,800 | Jefferson-Pilot Corp. | 383,888 | |||
| 32,900 | Loews Corp. | 2,662,844 | |||
| 4,600 | MBIA, Inc. | 302,450 | |||
| 34,900 | MGIC Investment Corp. | 2,052,556 | |||
| 20,300 | The Hartford Financial Services
Group, Inc. |
1,352,487 | |||
| 37,800 | The PMI Group, Inc. | 2,343,600 | |||
| 17,532,448 | |||||
| Publishing – 0.6% | |||||
| 7,700 | Dow Jones & Co., Inc. | 481,731 | |||
| 10,500 | Knight-Ridder, Inc. | 573,563 | |||
| 23,400 | The New York Times Co. | 916,987 | |||
| 1,972,281 | |||||
| Railroads – 0.9% | |||||
| 66,400 | Burlington Northern Santa Fe Corp. | 1,485,700 | |||
| 42,100 | Canadian National Railway Co. | 1,239,319 | |||
| 2,725,019 | |||||
| Restaurants – 0.8% | |||||
| 37,200 | Brinker International, Inc.* | 1,181,100 | |||
| 17,100 | Darden Restaurants, Inc. | 302,456 | |||
| 6,900 | Starbucks Corp.* | 252,713 | |||
| 24,000 | Tricon Global Restaurants, Inc.* | 699,000 | |||
| 2,435,269 | |||||
| Security/Asset Management – 3.5% | |||||
| 15,900 | A.G. Edwards, Inc. | 826,800 | |||
| 7,500 | AXA Financial, Inc. | 388,125 | |||
| 9,800 | Lehman Brothers Holdings, Inc. | 1,421,000 | |||
| 16,100 | Merrill Lynch & Co., Inc. | 2,334,500 | |||
| 54,700 | Morgan Stanley Dean Witter & Co. | 5,883,669 | |||
| 10,854,094 | |||||
|
Shares |
Description | Value | |||
|---|---|---|---|---|---|
| Common Stocks – (continued) | |||||
| Semiconductors – 0.9% | |||||
| 12,800 | Advanced Micro Devices, Inc.* | $ 481,600 | |||
| 3,100 | Applied Micro Circuits Corp.* | 629,106 | |||
| 7,100 | JDS Uniphase Corp.* | 883,839 | |||
| 3,700 | Micron Technology, Inc.* | 302,475 | |||
| 1,400 | SDL, Inc.* | 556,238 | |||
| 2,853,258 | |||||
| Specialty Retail – 0.7% | |||||
| 5,300 | Avnet, Inc. | 317,337 | |||
| 17,900 | Barnes & Noble, Inc.* | 309,894 | |||
| 6,700 | Lowes Co., Inc. | 300,244 | |||
| 14,000 | Tiffany & Co. | 582,750 | |||
| 300 | Webvan Group, Inc.* | 1,200 | |||
| 19,900 | Zale Corp.* | 735,056 | |||
| 2,246,481 | |||||
| Telephone – 9.3% | |||||
| 4,100 | Allegiance Telecom, Inc.* | 204,231 | |||
| 208,911 | AT&T Corp. | 6,580,696 | |||
| 87,900 | BCE, Inc. | 1,977,750 | |||
| 115,400 | BellSouth Corp. | 4,305,863 | |||
| 5,100 | Covad Communications Group, Inc.* | 83,194 | |||
| 7,600 | NEXTLINK Communications, Inc.* | 266,475 | |||
| 1,300 | NorthPoint Communications
Group, Inc.* |
14,869 | |||
| 139,064 | SBC Communications, Inc. | 5,805,922 | |||
| 35,400 | Sprint Corp. | 1,185,900 | |||
| 153,778 | Verizon Communications | 6,708,565 | |||
| 34,850 | WorldCom, Inc.* | 1,272,025 | |||
| 28,405,490 | |||||
|
Shares |
Description | Value | |||
|---|---|---|---|---|---|
| Common Stocks – (continued) | |||||
| Thrifts – 0.8% | |||||
| 51,800 | Golden West Financial Corp. | $ 2,466,975 | |||
| Tobacco – 1.0% | |||||
| 61,400 | Philip Morris Cos., Inc. | 1,818,975 | |||
| 23,400 | R.J. Reynolds Tobacco Holdings, Inc. | 839,475 | |||
| 17,300 | UST, Inc. | 374,112 | |||
| 3,032,562 | |||||
| Wireless – 0.2% | |||||
| 11,500 | AT&T Wireless Group* | 301,156 | |||
| 4,200 | United States Cellular Corp.* | 308,963 | |||
| 610,119 | |||||
| TOTAL COMMON STOCKS | |||||
| (Cost $294,923,304) | $ 304,544,385 | ||||
| Principal
Amount |
Interest
Rate |
Maturity
Date |
Value | |||||
|---|---|---|---|---|---|---|---|---|
| Repurchase Agreement – 0.5% | ||||||||
| Joint Repurchase Agreement Account IIˆ | ||||||||
| $1,400,000 | 6.66 | % | 09/01/2000 | $ 1,400,000 | ||||
| TOTAL REPURCHASE AGREEMENT | ||||||||
| (Cost $1,400,000) | $ 1,400,000 | |||||||
| TOTAL INVESTMENTS | ||||||||
| (Cost $296,323,304) | $ 305,944,385 | |||||||
*
|
Non-income producing security.
|
|
ˆ
|
Joint repurchase agreement was entered into on August 31, 2000.
|
| The percentage shown for each investment category reflects the value of investments in that category as a percentage of total net
assets.
|
| The following graph shows the value, as of August 31, 2000, of a $10,000 investment made on August 15, 1997 (commencement of
operations) in Institutional shares at (NAV) of the Goldman Sachs CORE International Equity Fund. For comparative purposes, the performance of the Fund’s benchmark (Morgan Stanley Capital International Gross Europe, Australia, Far East Index with
dividends reinvested (“MSCI Gross EAFE Index”)) is shown. This performance data represents past performance and should not be considered indicative of future performance which will fluctuate with changes in market conditions. These performance
fluctuations will cause an investor’s shares, when redeemed, to be worth more or less than their original cost. Performance of Class A, Class B, Class C and Service shares will vary from Institutional shares due to differences in fees and loads.
|
| CORE International Equity Fund’s Lifetime Performance
|
| Performance of a $10,000 Investment, Distributions Reinvested August 15, 1997 to August 31, 2000.
|
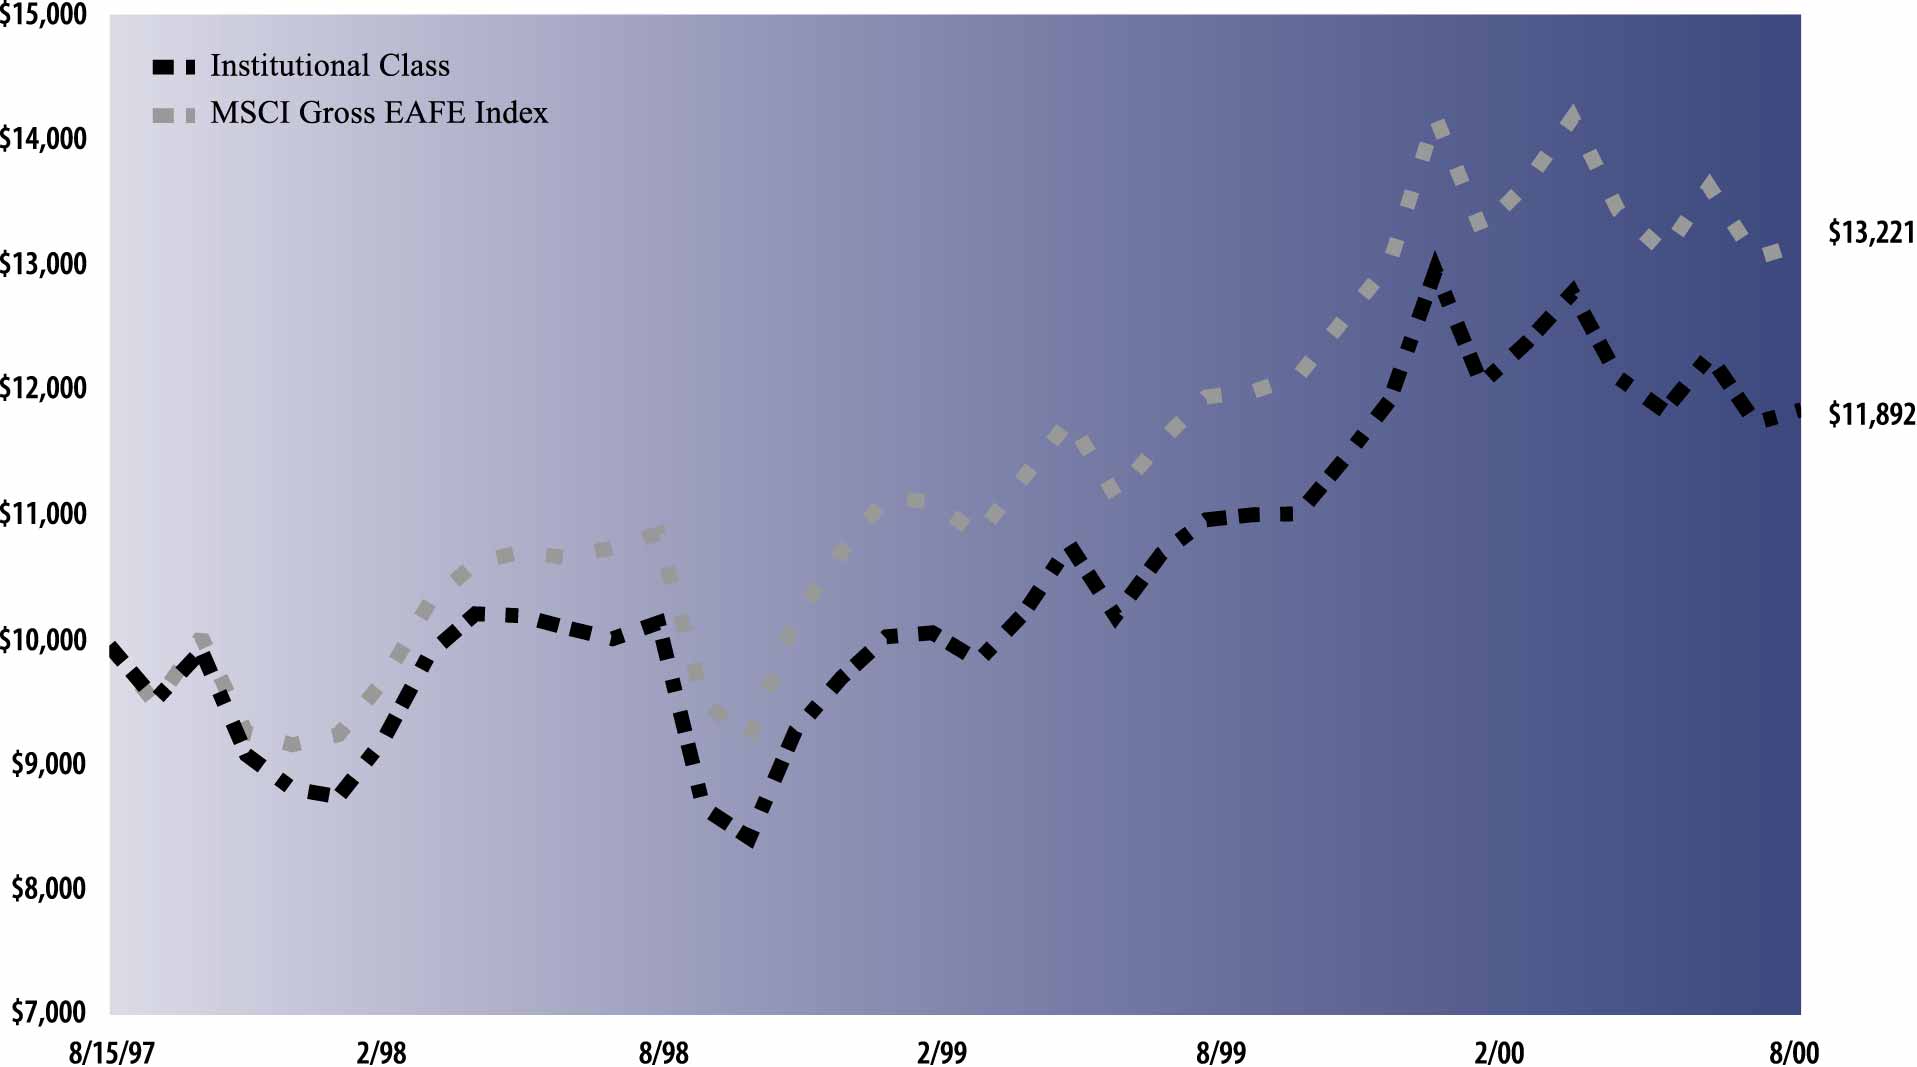 |
| Average Annual Total Return through August 31, 2000 | Since Inception | One Year | |||
|---|---|---|---|---|---|
| Class A (commenced August 15, 1997) | |||||
| Excluding sales charges | 5.15% | 6.92% | |||
| Including sales charges | 3.22% | 1.07% | |||
| |
|||||
| Class B (commenced August 15, 1997) | |||||
| Excluding contingent deferred sales charges | 4.68% | 6.36% | |||
| Including contingent deferred sales charges | 3.76% | 1.23% | |||
| |
|||||
| Class C (commenced August 15, 1997) | |||||
| Excluding contingent deferred sales charges | 4.71% | 6.34% | |||
| Including contingent deferred sales charges | 4.71% | 5.32% | |||
| |
|||||
| Institutional Class (commenced August 15, 1997) | 5.85% | 7.62% | |||
| |
|||||
| Service Class (commenced August 15, 1997) | 5.34% | 7.05% | |||
| |
|||||
|
Shares |
Description | Value | |||
|---|---|---|---|---|---|
| Common Stocks – 99.0% | |||||
| Belgium – 0.3% | |||||
| 5,900 | Groupe Bruxelles Lambert SA
(Conglomerates) |
$ 1,532,035 | |||
| Finland – 2.7% | |||||
| 61,050 | Finnair Oyj Series 1 (Airlines) | 233,048 | |||
| 235,900 | Nokia Oyj (Telecommunications) | 10,339,079 | |||
| 30,000 | Pohjola Group Insurance Corp.
Series B (Insurance) |
1,133,213 | |||
| 36,890 | Sonera Oyj (Telecommunications) | 1,231,366 | |||
| 12,936,706 | |||||
| France – 7.8% | |||||
| 39,050 | Alcatel (Telecommunications) | 3,191,065 | |||
| 27,100 | Aventis SA (Chemicals) | 2,032,904 | |||
| 28,750 | Axa (Insurance) | 4,091,308 | |||
| 39,480 | Banque Nationale de Paris (Banks) | 3,627,507 | |||
| 11,000 | Bouygues SA* (Construction) | 690,892 | |||
| 37,600 | Christian Dior SA* (Consumer
Products) |
2,062,847 | |||
| 31,800 | France Telecom SA
(Telecommunications) |
3,627,614 | |||
| 23,500 | L’Oreal SA* (Consumer Products) | 1,698,177 | |||
| 17,000 | LVMH (Louis Vuitton Moet
Hennessy)* (Conglomerates) |
1,319,019 | |||
| 5,400 | Pinault-Printemps-Redoute SA
(Merchandising) |
1,020,611 | |||
| 13,200 | PSA Peugeot Citroen (Auto) | 2,436,235 | |||
| 1,260 | Sagem SA (Electrical Equipment) | 346,867 | |||
| 33,350 | Schneider Electric SA (Electrical
Equipment) |
2,457,337 | |||
| 52,100 | Societe Generale Series A* (Banks) | 3,084,994 | |||
| 29,900 | STMicroelectronics NV
(Semiconductors) |
1,831,517 | |||
| 11,559 | Total Fina SA Class B (Energy
Resources) |
1,714,697 | |||
| 20,950 | Vivendi (Business Services) | 1,711,050 | |||
| 36,944,641 | |||||
| Germany – 11.1% | |||||
| 23,400 | Allianz AG (Insurance) | 7,883,488 | |||
| 69,900 | BASF AG (Chemicals) | 2,591,985 | |||
| 23,450 | Bayer AG (Chemicals) | 988,843 | |||
| 3,250 | Beiersdorf AG (Health) | 291,404 | |||
| 16,550 | Buderus AG (Diversified Industrial
Manufacturing) |
271,072 | |||
| 63,950 | Commerzbank AG (Banks) | 2,064,784 | |||
| 84,500 | Deutsche Bank AG (Banks) | 7,351,459 | |||
| 55,450 | Deutsche Lufthansa AG (Airlines) | 1,226,706 | |||
| 196,700 | Deutsche Telekom AG
(Telecommunications) |
7,552,335 | |||
| 31,350 | E.On AG (Energy Resources) | 1,501,759 | |||
| 20,600 | FAG Kugelfischer Georg Schaefer AG
(Industrial Services) |
138,072 | |||
| 13,950 | IWKA AG (Machinery) | 169,662 | |||
| 5,650 | Kamps AG (Food & Beverage) | 121,934 | |||
| 83,450 | MAN AG (Machinery) | 2,324,717 | |||
|
Shares |
Description | Value | |||
|---|---|---|---|---|---|
| Common Stocks – (continued) | |||||
| Germany – (continued) | |||||
| 53,400 | Merck KGAA (Health) | $ 1,716,566 | |||
| 7,400 | Muenchener Rueckversicherungs-
Gesellschaft AG (Property Insurance) |
2,029,207 | |||
| 7,950 | SAP AG (Computer Software) | 1,552,675 | |||
| 14,000 | Schering AG (Health) | 745,213 | |||
| 71,025 | Siemens AG (Electrical Equipment) | 11,380,969 | |||
| 43,700 | Thyssen AG (Steel) | 663,389 | |||
| 52,566,239 | |||||
| Hong Kong – 1.0% | |||||
| 94,900 | Cathay Pacific Airways (Airlines) | 184,349 | |||
| 56,900 | CLP Holdings Ltd. (Utilities) | 255,353 | |||
| 2,000 | Elec & Eltek International Holdings
Ltd. (Electronic Components) |
277 | |||
| 33,000 | Guoco Group Ltd. (Banks) | 84,626 | |||
| 22,500 | Hang Seng Bank Ltd. (Banks) | 241,617 | |||
| 38,000 | Henderson Land Development Co.
Ltd. (Real Estate) |
210,976 | |||
| 41,500 | Hongkong Electric Holdings Ltd.
(Electrical Utilities) |
131,434 | |||
| 91,080 | Hutchison Whampoa Ltd. (Multi-
Industrial) |
1,284,626 | |||
| 68,000 | Johnson Electric Holdings Ltd.*
(Electrical Equipment) |
141,249 | |||
| 17,000 | Li & Fung Ltd. (Wholesale) | 74,112 | |||
| 156,000 | Oriental Press Group Ltd.
(Publishing) |
21,203 | |||
| 282,203 | Pacific Century CyberWorks Ltd.*
(Computer Software) |
524,676 | |||
| 76,000 | QPL International Holdings Ltd.*
(Electronic Components) |
70,650 | |||
| 124,000 | South China Morning Post Holdings
Ltd. (Publishing) |
93,012 | |||
| 50,200 | Sun Hung Kai Properties Ltd. (Real
Estate) |
473,099 | |||
| 52,600 | Swire Pacific Ltd. (Multi-Industrial) | 360,828 | |||
| 52,000 | Wharf Holdings Co. Ltd. (Real
Estate) |
123,683 | |||
| 47,000 | Wing Lung Bank (Financial Services) | 180,491 | |||
| 53,000 | Yue Yuen Industrial Holdings
(Apparel) |
122,663 | |||
| 4,578,924 | |||||
| Italy – 6.1% | |||||
| 16,500 | Assicurazioni Generali (Insurance) | 507,549 | |||
| 431,600 | Benetton Group SpA (Apparel) | 796,958 | |||
| 457,300 | Enel SpA (Utilities) | 1,818,737 | |||
| 873,400 | ENI SpA (Energy Resources) | 5,094,122 | |||
| 53,800 | Fiat SpA (Auto) | 1,331,576 | |||
| 292,100 | Ifil (Finanziara di Partecipazioni)
SpA (Multi-Industrial) |
2,390,855 | |||
| 74,100 | Mediaset SpA (Broadcasting) | 1,324,855 | |||
| 139,000 | Milano Assicurazioni (Insurance) | 428,189 | |||
| 988,000 | Olivetti SpA (Telecommunications) | 3,096,153 | |||
| 1,391,264 | Parmalat Finanziara SpA (Food &
Beverage) |
1,895,871 | |||
|
Shares |
Description | Value | |||
|---|---|---|---|---|---|
| Common Stocks – (continued) | |||||
| Italy – (continued) | |||||
| 191,980 | Riunione Adriatica di Sicurta SpA
(Insurance) |
$ 2,244,567 | |||
| 98,700 | Telecom Italia Mobile SpA
(Telecommunications) |
490,677 | |||
| 472,300 | Telecom Italia Mobile SpA (T.I.M.)
(Telecommunications) |
4,092,216 | |||
| 287,625 | Telecom Italia SpA
(Telecommunications) |
3,177,804 | |||
| 28,690,129 | |||||
| Japan – 27.9% | |||||
| 41,000 | 77 Bank Ltd. (Banks) | 319,081 | |||
| 17,600 | Acom Co. (Financial Services) | 1,500,084 | |||
| 1,600 | Advantest Corp. (Electronics
Equipment) |
326,301 | |||
| 19,000 | Alps Electric Co. (Electrical Utilities) | 400,844 | |||
| 113,000 | Asahi Glass Co. Ltd. (Home Products) | 1,056,362 | |||
| 22,000 | Canon Sales Co., Inc. (Business
Services) |
374,402 | |||
| 72,000 | Canon, Inc. (Computer Hardware) | 3,220,253 | |||
| 289 | Central Japan Railway Co. (Railroads) | 1,674,656 | |||
| 123,000 | Cosmo Oil Co. Ltd. (Energy
Resources) |
247,961 | |||
| 136,000 | Dai Nippon Printing Co. Ltd.
(Business Services) |
2,141,060 | |||
| 372,000 | Daicel Chemical Industries
(Chemicals) |
1,049,902 | |||
| 83,000 | Daido Steel Co. Ltd. (Steel) | 218,687 | |||
| 80,000 | Daiichi Pharmaceutical Co. (Health) | 1,890,295 | |||
| 39,000 | Dainippon Ink & Chemicals, Inc.
(Chemicals) |
137,131 | |||
| 117,000 | Dainippon Pharmaceutical Co. Ltd.
(Health) |
1,535,865 | |||
| 243,000 | Daiwa Securities Group, Inc.
(Financial Services) |
3,030,380 | |||
| 201,000 | Denki Kagaku Kogyo Kabushiki
Kaisha (Chemicals) |
810,408 | |||
| 12,500 | FANUC Ltd. (Electronics Equipment) | 1,359,588 | |||
| 166,000 | Fuji Heavy Industries Ltd. (Auto) | 1,098,884 | |||
| 51 | Fuji Television Network, Inc.
(Broadcasting) |
712,731 | |||
| 46,000 | Fujitsu Ltd. (Computer Hardware) | 1,332,771 | |||
| 338,000 | Hitachi Ltd. (Electrical Equipment) | 4,002,757 | |||
| 51,000 | Honda Motor Co. Ltd. (Auto) | 1,864,979 | |||
| 157,000 | Izumiya Co. Ltd. (Merchandising) | 1,252,761 | |||
| 22,000 | Japan Radio Co. Ltd. (Electrical
Equipment) |
212,264 | |||
| 140 | Japan Tobacco, Inc. (Tobacco) | 1,073,793 | |||
| 94,000 | Kaken Pharmaceutical Co. Ltd.
(Health) |
594,937 | |||
| 148,000 | Kamigumi Co. Ltd. (Business
Services) |
700,797 | |||
| 91,000 | Kanebo Ltd.* (Consumer Products) | 267,923 | |||
| 2,300 | KDD Corp. (Telecommunications) | 195,818 | |||
| 41,000 | Koito Manufacturing Co. Ltd.
(Automotive Parts) |
199,522 | |||
|
Shares |
Description | Value | |||
|---|---|---|---|---|---|
| Common Stocks – (continued) | |||||
| Japan – (continued) | |||||
| 39,000 | Kokuyo Co. Ltd. (Specialty Retail) | $ 673,221 | |||
| 142,000 | Komatsu Ltd. (Machinery) | 917,375 | |||
| 6,000 | Konami Co. Ltd. (Computer Software) | 496,203 | |||
| 158,000 | Konica Corp. (Multi-Industrial) | 1,259,259 | |||
| 421,000 | KUBOTA Corp. (Machinery) | 1,357,937 | |||
| 21,100 | Kyocera Corp. (Electrical Utilities) | 3,766,939 | |||
| 15,000 | Makita Corp. (Electrical Equipment) | 120,956 | |||
| 17,000 | Maruichi Steel Tube Ltd. (Steel) | 244,201 | |||
| 109,000 | Matsushita Electric Industrial Co. Ltd.
(Appliance) |
2,984,341 | |||
| 212,000 | Mitsubishi Corp. (Wholesale) | 1,550,492 | |||
| 401,000 | Mitsubishi Electric (Electrical
Equipment) |
3,741,163 | |||
| 198,000 | Mitsui Co. (Wholesale) | 1,331,139 | |||
| 20,000 | Mitsumi Electric Co. Ltd.
(Electrical Equipment) |
751,993 | |||
| 16,000 | Murata Manufacturing Co. Ltd.
(Electronics Equipment) |
2,449,883 | |||
| 24,000 | NEC Corp. (Computer Hardware) | 686,357 | |||
| 250,000 | Nichirei Corp. (Food & Beverage) | 937,647 | |||
| 1,500 | Nintendo Co. Ltd. (Entertainment) | 259,353 | |||
| 336,000 | Nippon Express Co. Ltd. (Railroads) | 1,887,145 | |||
| 70,000 | Nippon Sanso Corp. (Chemicals) | 264,510 | |||
| 146,000 | Nippon Steel Corp. (Steel) | 273,793 | |||
| 321,000 | Nippon Suisan Kaisha Ltd.
(Food & Beverage) |
568,861 | |||
| 663 | Nippon Telephone & Telegraph Corp.
(Telecommunications) |
7,895,078 | |||
| 69,000 | Nippon Yusen Kabushiki Kaisha
(Transportation) |
305,373 | |||
| 169,000 | Nisshinbo Industries Inc. (Textiles) | 785,973 | |||
| 242,000 | NOF Corp. (Chemicals) | 535,509 | |||
| 45,000 | NTN Corp. (Machinery) | 189,873 | |||
| 52,000 | Oji Paper Co. Ltd. (Paper) | 345,692 | |||
| 37,000 | Olympus Optical Co. Ltd. (Specialty
Retail) |
648,758 | |||
| 3,000 | Oriental Land Co. Ltd. (Leisure) | 276,231 | |||
| 13,500 | ORIX Corp. (Financial Services) | 1,797,468 | |||
| 17,200 | Promise Co. Ltd. (Financial Services) | 1,198,275 | |||
| 117,000 | Ricoh Co. Ltd. (Computer Hardware) | 2,045,992 | |||
| 6,000 | Rohm Co. (Electronics Equipment) | 1,707,454 | |||
| 35,000 | Sankyo Co. Ltd. (Health) | 810,595 | |||
| 61,000 | Sanyo Electric Co. Ltd.
(Electrical Equipment) |
517,628 | |||
| 142,000 | Sapporo Breweries Ltd. (Food &
Beverage) |
477,993 | |||
| 12,000 | Secom Co. Ltd. (Business Services) | 874,262 | |||
| 24,900 | Shikoku Electric Power Co., Inc.
(Electrical Utilities) |
363,052 | |||
| 3,000 | Shin-Etsu Chemical Co. Ltd.
(Chemicals) |
147,398 | |||
| 9,000 | Shionogi & Co. Ltd. (Health) | 158,650 | |||
| 23,000 | Shiseido Co. Ltd. (Consumer
Products) |
271,730 | |||
| 77,000 | Showa Shell Sekiyu K.K. (Oil and
Gas) |
379,766 | |||
|
Shares |
Description | Value | |||
|---|---|---|---|---|---|
| Common Stocks – (continued) | |||||
| Japan – (continued) | |||||
| 6,000 | Skylark Co. Ltd. (Restaurants) | $ 219,409 | |||
| 234,000 | Snow Brand Milk Products Co. Ltd.
(Food & Beverage) |
886,414 | |||
| 17,300 | Softbank Corp. (Business Services) | 2,285,579 | |||
| 39,000 | Sony Corp. (Electrical Equipment) | 4,351,618 | |||
| 8,000 | Sumitomo Electric Industries Ltd.
(Electrical Equipment) |
147,773 | |||
| 62,000 | Sumitomo Metal Mining Co. Ltd.
(Metals) |
340,084 | |||
| 328,000 | Sumitomo Realty & Development Co.
Ltd. (Real Estate) |
1,423,948 | |||
| 75,000 | Suzuki Motor Corp. (Auto) | 795,359 | |||
| 15,000 | Taiyo Yuden Co. Ltd.
(Electronic Components) |
864,979 | |||
| 47,000 | Takeda Chemical Industries Ltd.
(Drugs) |
2,780,778 | |||
| 15,100 | Takefuji Corp. (Financial Services) | 1,485,223 | |||
| 20,000 | Takuma Co. Ltd. (Multi-Industrial) | 144,773 | |||
| 3,000 | TDK Corp. (Computer Hardware) | 443,319 | |||
| 140,000 | The Asahi Bank Ltd. (Banks) | 551,336 | |||
| 33,000 | The Bank of Fukuoka Ltd. (Banks) | 210,098 | |||
| 160,000 | The Bank of Tokyo-Mitsubishi Ltd.
(Banks) |
1,959,306 | |||
| 60,000 | The Bank of Yokohama Ltd.
(Commercial Banks) |
263,854 | |||
| 380,000 | The Daiwa Bank Ltd. (Banks) | 954,899 | |||
| 180,000 | The Fuji Bank Ltd. (Banks) | 1,368,776 | |||
| 20,000 | The Furukawa Electric Co. Ltd.
(Electrical Equipment) |
643,226 | |||
| 288,000 | The Industrial Bank of Japan Ltd.
(Banks) |
2,184,641 | |||
| 51,300 | The Kansai Electric Power Co., Inc.
(Electrical Utilities) |
841,772 | |||
| 39,000 | The Nomura Securities Co. Ltd.
(Financial Services) |
912,377 | |||
| 216,000 | The Sakura Bank Ltd. (Banks) | 1,608,101 | |||
| 130,000 | The Sumitomo Bank Ltd. (Banks) | 1,609,002 | |||
| 23,000 | The Sumitomo Marine & Fire
Insurance Co. Ltd. (Insurance) |
138,237 | |||
| 21,200 | Tohoku Electric Power Co., Inc.
(Electrical Utilities) |
303,141 | |||
| 86,000 | Tokai Carbon Co. Ltd. (Chemicals) | 224,979 | |||
| 9,000 | Tokyo Broadcasting System, Inc.
(Media) |
322,363 | |||
| 70,800 | Tokyo Electric Power (Electrical
Utilities) |
1,583,291 | |||
| 8,000 | Tokyo Electron Ltd. (Electrical
Equipment) |
1,123,676 | |||
| 166,000 | Toppan Printing Co. Ltd. (Business
Services) |
1,621,866 | |||
| 228,000 | Toshiba Corp. (Electrical Equipment) | 2,242,588 | |||
| 53,000 | Toyo Seikan Kaisha (Multi-Industrial) | 909,423 | |||
| 196,000 | Toyota Motor Corp. (Auto) | 8,527,333 | |||
| 75,000 | Ube Industries Ltd. (Chemicals) | 180,731 | |||
|
Shares |
Description | Value | |||
|---|---|---|---|---|---|
| Common Stocks – (continued) | |||||
| Japan – (continued) | |||||
| 328 | West Japan Railway (Railroads) | $ 1,316,306 | |||
| 149,000 | Yokogawa Electric Corp.
(Electronics Equipment) |
1,538,200 | |||
| 132,367,493 | |||||
| Netherlands – 9.1% | |||||
| 236,917 | ABN AMRO Holding NV (Banks) | 5,889,047 | |||
| 18,600 | ASM Lithography Holding NV
(Semiconductors) |
702,262 | |||
| 20,158 | Buhrmann NV (Business Services) | 571,754 | |||
| 19,771 | DSM NV (Chemicals) | 603,779 | |||
| 20,700 | Heineken NV (Food & Beverage) | 1,051,132 | |||
| 150,635 | ING Groep NV (Financial Services) | 10,082,959 | |||
| 182,260 | Koninklijke Royal Philips
Electronics NV (Appliance) |
8,866,714 | |||
| 17,726 | KPN NV (Telecommunications) | 472,245 | |||
| 248,900 | Royal Dutch Petroleum Co. (Energy
Resources) |
15,135,830 | |||
| 43,375,722 | |||||
| Norway – 0.2% | |||||
| 19,100 | Norsk Hydro ASA (Diversified
Industrial Manufacturing) |
819,959 | |||
| 6,200 | Orkla ASA (Consumer Products) | 110,219 | |||
| 7,800 | Smedvig ASA Series A (Oil and Gas) | 157,123 | |||
| 1,087,301 | |||||
| Portugal – 0.2% | |||||
| 53,790 | Banco Espirito Santo SA (Banks) | 873,386 | |||
| 23,600 | Portugal Telecom SA
(Telecommunications) |
245,544 | |||
| 1,118,930 | |||||
| Singapore – 6.7% | |||||
| 526,000 | ACMA Ltd. (Telecommunications) | 339,237 | |||
| 353,000 | Chartered Semiconductor
Manufacturing Ltd.* (Semiconductors) |
2,953,460 | |||
| 79,000 | City Developments (Real Estate) | 392,452 | |||
| 1,099,000 | Comfort Group Ltd. (Railroads) | 584,269 | |||
| 43,000 | Creative Technology Ltd. (Electrical
Equipment) |
934,402 | |||
| 91,000 | Cycle & Carriage Ltd. (Auto) | 200,918 | |||
| 391,970 | DBS Group Holdings Ltd. (Banks) | 4,737,073 | |||
| 423,000 | DBS Land Ltd. (Real Estate) | 683,249 | |||
| 275,000 | Fraser & Neave Ltd. (Tobacco) | 1,022,602 | |||
| 457,000 | Keppel Corp. Ltd. (Multi-Industrial) | 1,035,559 | |||
| 160,000 | Keppel TatLee Bank Ltd. (Financial
Services) |
293,766 | |||
| 477,000 | Marco Polo Development Ltd. (Real
Estate) |
507,181 | |||
| 51,000 | NatSteel Electronics Ltd. (Electronic
Components) |
170,385 | |||
| 45,000 | NatSteel Ltd. (Steel) | 61,705 | |||
|
Shares |
Description | Value | |||
|---|---|---|---|---|---|
| Common Stocks – (continued) | |||||
| Singapore – (continued) | |||||
| 253,250 | Oversea-Chinese Banking Corp. Ltd.
(Banks) |
$ 1,751,017 | |||
| 200,000 | Sembcorp Marine Ltd.
(Manufacturing) |
78,438 | |||
| 433,400 | Singapore Airlines Ltd. (Airlines) | 4,180,141 | |||
| 118,000 | Singapore Press Holdings Ltd.
(Publishing) |
1,899,134 | |||
| 875,000 | Singapore Technologies Engineering
Ltd. (Machinery) |
1,179,478 | |||
| 1,648,700 | Singapore Telecommunications Ltd.
(Telecommunications) |
2,720,532 | |||
| 372,400 | United Engineers (Construction) | 270,467 | |||
| 293,000 | United Industrial Corp. Ltd. (Real
Estate) |
139,597 | |||
| 588,115 | United Overseas Bank Ltd. (Banks) | 4,613,069 | |||
| 60,000 | Venture Manufacturing Ltd.
(Electrical Equipment) |
766,951 | |||
| 94,000 | WBL Corp. Ltd. (Electronics
Equipment) |
125,617 | |||
| 31,640,699 | |||||
| Spain – 7.1% | |||||
| 83,100 | Banco Bilbao Vizcaya SA (Banks) | 1,232,731 | |||
| 410,800 | Banco Santander Central Hispano
SA (Banks) |
4,412,722 | |||
| 261,600 | Endesa SA (Electrical Utilities) | 5,097,568 | |||
| 293,650 | Repsol SA (Energy Resources) | 5,813,339 | |||
| 720,513 | Telefonica de Espana SA*
(Telecommunications) |
13,816,128 | |||
| 168,600 | Union Electric Fenosa (Utilities) | 3,129,698 | |||
| 33,502,186 | |||||
| Sweden – 3.8% | |||||
| 61,000 | AstraZeneca Group PLC (Health) | 2,779,438 | |||
| 14,000 | AstraZeneca Group PLC (Health) | 628,827 | |||
| 20,000 | Granges AB (Metals) | 291,320 | |||
| 21,600 | Mo och Domsjoe AB Series B
(Paper) |
497,680 | |||
| 4,100 | OM Gruppen AB (Financial
Services) |
205,438 | |||
| 21,600 | Skandia Forsakring (Insurance) | 437,043 | |||
| 53,600 | Skanska AB Series B (Construction) | 1,834,022 | |||
| 45,800 | SKF AB Series B (Metals) | 664,696 | |||
| 187,000 | Svenska Handelsbanken AB
Series A (Banks) |
3,090,320 | |||
| 366,129 | Telefonaktiebolaget LM Ericsson
AB Series B (Telecommunications) |
7,388,671 | |||
| 17,817,455 | |||||
| Switzerland – 4.8% | |||||
| 735 | Adecco SA (Business Services) | 563,275 | |||
| 559 | Baloise Holdings Ltd. (Insurance) | 567,343 | |||
| 22,923 | Credit Suisse Group (Banks) | 4,789,881 | |||
| 2,929 | Forbo Holding AG (Building
Materials) |
1,281,227 | |||
|
Shares |
Description | Value | |||
|---|---|---|---|---|---|
| Common Stocks – (continued) | |||||
| Switzerland – (continued) | |||||
| 727 | Jelmoli Holding AG (Merchandising) | $ 917,305 | |||
| 1,637 | Nestle SA (Food & Beverage) | 3,527,726 | |||
| 2,995 | Novartis AG (Health) | 4,528,605 | |||
| 420 | Pargesa Holding AG (Financial
Services) |
1,007,807 | |||
| 129 | Roche Holding AG (Health) | 1,155,224 | |||
| 112 | Schindler Holding AG-PTG
Certificates (Machinery) |
192,110 | |||
| 2,387 | Sika Finanz AG (Chemicals) | 707,056 | |||
| 5,504 | Swisscom AG (Telecommunications) | 1,560,836 | |||
| 152 | The Swatch Group AG Series B
(Specialty Retail) |
215,959 | |||
| 7,587 | Valora Holding AG (Merchandising) | 1,885,862 | |||
| 22,900,216 | |||||
| United Kingdom – 10.2% | |||||
| 9,300 | Abbey National PLC (Financial
Services) |
112,550 | |||
| 84,200 | Allied Zurich PLC (Insurance) | 1,030,611 | |||
| 85,400 | Amvescap PLC (Financial Services) | 1,821,683 | |||
| 23,000 | ARM Holdings PLC* (Electronic
Components) |
307,053 | |||
| 22,300 | BAA PLC (Airlines) | 177,978 | |||
| 37,800 | Barclays PLC (Banks) | 943,448 | |||
| 21,700 | Bass PLC (Food & Beverage) | 211,605 | |||
| 91,600 | BG Group PLC (Utilities) | 570,230 | |||
| 568,200 | BP Amoco PLC (Energy Resources) | 5,198,570 | |||
| 64,800 | British Aerospace PLC
(Defense/Aerospace) |
403,394 | |||
| 57,800 | British Airways PLC (Airlines) | 272,799 | |||
| 56,500 | British American Tobacco PLC
(Tobacco) |
363,203 | |||
| 38,600 | British Sky Broadcasting Group PLC*
(Broadcasting) |
627,900 | |||
| 168,800 | British Telecom PLC
(Telecommunications) |
2,143,276 | |||
| 50,500 | Brixton Estate PLC (Real Estate) | 193,461 | |||
| 212,300 | Centrica PLC (Utilities) | 693,155 | |||
| 58,028 | CGNU PLC (Insurance) | 892,567 | |||
| 199,700 | Coats Viyella PLC (Textiles) | 145,530 | |||
| 31,800 | Diageo PLC (Tobacco) | 271,333 | |||
| 279,885 | FKI PLC (Electrical Equipment) | 934,125 | |||
| 96,180 | Glaxo Wellcome PLC (Health) | 2,764,820 | |||
| 54,912 | Granada Compass PLC* (Business
Services) |
676,109 | |||
| 35,300 | Great Portland Estates PLC (Real
Estate) |
115,059 | |||
| 56,800 | Halifax Group PLC (Financial
Services) |
443,433 | |||
| 43,600 | Hays PLC (Business Services) | 254,970 | |||
| 237,577 | HSBC Holdings PLC (Banks) | 3,416,454 | |||
| 128,000 | IMI PLC (Diversified Industrial
Manufacturing) |
427,204 | |||
| 211,100 | Invensys PLC (Electrical Utilities) | 824,021 | |||
|
Shares |
Description | Value | |||
|---|---|---|---|---|---|
| Common Stocks – (continued) | |||||
| United Kingdom – (continued) | |||||
| 25,200 | Johnson Matthey PLC (Diversified
Industrial Manufacturing) |
$ 376,648 | |||
| 8,600 | Land Securities PLC (Real Estate) | 102,768 | |||
| 127,300 | Lloyds TSB Group PLC (Banks) | 1,197,019 | |||
| 10,300 | Logica PLC (Business Services) | 322,094 | |||
| 16,500 | National Grid Group PLC (Utilities) | 135,039 | |||
| 31,100 | Nycomed Amersham PLC (Medical
Products) |
278,222 | |||
| 28,900 | Pearson PLC (Broadcasting) | 834,543 | |||
| 413,600 | Pilkington PLC (Multi-Industrial) | 549,160 | |||
| 116,182 | Premier Farnell PLC (Electrical
Utilities) |
893,537 | |||
| 49,300 | Prudential PLC (Financial Services) | 645,284 | |||
| 45,600 | Reed International PLC (Publishing) | 390,404 | |||
| 25,500 | Reuters Group PLC (Business
Services) |
510,642 | |||
| 39,600 | Rexam PLC (Manufacturing) | 160,898 | |||
| 54,400 | Rio Tinto PLC (Mining) | 867,549 | |||
| 88,225 | Royal Bank of Scotland Group PLC
(Banks) |
1,287,150 | |||
| 17,400 | ScottishPower PLC (Energy
Resources) |
132,558 | |||
| 42,900 | Shell Transport & Trading Co. (Oil
and Gas) |
366,043 | |||
| 199,755 | Smith & Nephew PLC (Health) | 818,868 | |||
| 141,500 | SmithKline Beecham PLC (Health) | 1,842,844 | |||
| 415,700 | Tesco PLC (Specialty Retail) | 1,307,485 | |||
| 10,308 | Thames Water (Business Services) | 124,899 | |||
| 28,458 | The Peninsular & Oriental Steam
Navigation Co. (Ship Transportation) |
254,793 | |||
| 32,600 | The Sage Group PLC (Business
Services) |
300,629 | |||
| 67,800 | United News & Media PLC
(Publishing) |
855,946 | |||
| 73,100 | United Utilities PLC (Business
Services) |
678,883 | |||
| 1,617,892 | Vodafone AirTouch PLC
(Telecommunications) |
6,532,543 | |||
| 22,700 | Williams PLC (Electrical Utilities) | 126,819 | |||
| 24,900 | WPP Group PLC (Business
Services) |
353,375 | |||
| 48,483,183 | |||||
| TOTAL COMMON STOCKS | |||||
| (Cost $431,148,325) | $469,541,859 | ||||
|
Shares |
Description | Value | |||
|---|---|---|---|---|---|
| Preferred Stocks – 0.4% | |||||
| Germany – 0.4% | |||||
| 8,250 | Dyckerhoff AG (Construction) | $ 163,324 | |||
| 23,000 | MAN AG (Machinery) | 461,453 | |||
| 5,100 | SAP AG (Computer Software) | 1,285,817 | |||
| 1,910,594 | |||||
| TOTAL PREFERRED STOCKS | |||||
| (Cost $2,024,549) | $ 1,910,594 | ||||
|
Rights |
Description | Value | |||
| Rights – 0.0% | |||||
| Singapore – 0.0% | |||||
| 18,800 | WBL Corp. Ltd. Rights exp.
09/14/2000* (Electronics Equipment) |
$ 20,536 | |||
| TOTAL RIGHTS | |||||
| (Cost $0) | $ 20,536 | ||||
| Principal
Amount |
Interest
Rate |
Maturity
Date |
Value | ||||
|---|---|---|---|---|---|---|---|
| Short-Term Obligation – 0.8% | |||||||
| State Street Bank & Trust Euro—Time Deposit | |||||||
| $3,929,000 | 6.56% | 09/01/2000 | $ 3,929,000 | ||||
| TOTAL SHORT-TERM OBLIGATION | |||||||
| (Cost $3,929,000) | $ 3,929,000 | ||||||
| U.S. Government Agency Obligation – 0.2% | ||||||
| Federal Home Loan Mortgage Corp.# | ||||||
| $1,000,000 | 6.56% | 09/14/2000 | $ 997,667 | |||
| TOTAL U.S. GOVERNMENT AGENCY OBLIGATION | ||||||
| (Cost $997,667) | $ 997,667 | |||||
| TOTAL INVESTMENTS | ||||||
| (Cost $438,099,541) | $476,399,656 | |||||
*
|
Non-income producing security.
|
#
|
A portion of this security is segregated as collateral for initial margin requirement on Futures transactions.
|
| The percentage shown for each investment category reflects the value of investments in that category as a percentage of total net
assets.
|
| As a %
of Total Net Assets |
|||||
|---|---|---|---|---|---|
| Common and Preferred Stock Industry Classifications† | |||||
| Airlines | 1.3 | % | |||
| Apparel | 0.2 | ||||
| Appliance | 2.5 | ||||
| Auto | 3.4 | ||||
| Automotive Parts | 0.0 | ||||
| Banks | 13.8 | ||||
| Broadcasting | 0.7 | ||||
| Building Materials | 0.3 | ||||
| Business Services | 3.0 | ||||
| Chemicals | 2.2 | ||||
| Commercial Banks | 0.1 | ||||
| Computer Hardware | 1.6 | ||||
| Computer Software | 0.8 | ||||
| Conglomerates | 0.6 | ||||
| Construction | 0.6 | ||||
| Consumer Products | 0.9 | ||||
| Defense/Aerospace | 0.1 | ||||
| Diversified Industrial Manufacturing | 0.4 | ||||
| Drugs | 0.6 | ||||
| Electrical Equipment | 7.3 | ||||
| Electrical Utilities | 3.0 | ||||
| Electronic Components | 0.3 | ||||
| Electronics Equipment | 1.6 | ||||
| Energy Resources | 7.3 | ||||
| Entertainment | 0.1 | ||||
| Financial Services | 5.2 | ||||
| Food & Beverage | 2.0 | ||||
| Health | 4.7 | ||||
| Home Products | 0.2 | ||||
| Industrial Services | 0.0 | ||||
| Insurance | 4.1 | ||||
| Leisure | 0.1 | ||||
| Machinery | 1.4 | ||||
| Manufacturing | 0.0 | ||||
| Media | 0.1 | ||||
| Medical Products | 0.1 | ||||
| Merchandising | 1.1 | ||||
| Metals | 0.3 | ||||
| Mining | 0.2 | ||||
| Multi-Industrial | 1.7 | ||||
| Oil and Gas | 0.2 | ||||
| Paper | 0.2 | ||||
| Property Insurance | 0.4 | ||||
| Publishing | 0.7 | ||||
| Railroads | 1.1 | ||||
| Real Estate | 0.9 | ||||
| Restaurants | 0.0 | ||||
| Semiconductors | 1.2 | ||||
| Ship Transportation | 0.1 | ||||
| Specialty Retail | 0.6 | ||||
| Steel | 0.3 | ||||
| Telecommunications | 16.9 | ||||
| Textiles | 0.2 | ||||
| Tobacco | 0.6 | ||||
| Transportation | 0.1 | ||||
| Utilities | 1.4 | ||||
| Wholesale | 0.6 | ||||
| TOTAL COMMON AND PREFERRED STOCK | 99.4 | % | |||
†
|
Industry concentrations greater than one tenth of one percent are disclosed.
|
| CORE U.S.
Equity Fund |
||
|---|---|---|
| Assets: | ||
| Investment in securities, at value (identified cost $1,100,758,504, $971,879,423, $148,167,007, $296,323,304, and
$438,099,541, respectively) |
$1,443,100,967 | |
| Cash, at value (a) | 1,762,656 | |
| Receivables: | ||
| Investment securities sold | — | |
| Dividends and interest, at value | 1,900,278 | |
| Fund shares sold | 1,611,314 | |
| Variation margin | 89,090 | |
| Reimbursement from adviser | 53,092 | |
| Other assets | 24,876 | |
| |
||
| Total assets | 1,448,542,273 | |
| |
||
| Liabilities: | ||
| Due to Bank | — | |
| Payables: | ||
| Investment securities purchased | — | |
| Fund shares repurchased | 1,672,063 | |
| Amounts owed to affiliates | 1,431,089 | |
| Accrued expenses and other liabilities, at value | 120,544 | |
| |
||
| Total liabilities | 3,223,696 | |
| |
||
| Net Assets: | ||
| Paid-in capital | 964,623,070 | |
| Accumulated undistributed net investment income (loss) | 3,253,727 | |
| Accumulated net realized gain from investment, futures and foreign currency related transactions | 135,024,537 | |
| Net unrealized gain on investments, futures and translation of assets and liabilities denominated in foreign currencies | 342,417,243 | |
| |
||
| NET ASSETS | $1,445,318,577 | |
| |
||
| Net asset value, offering and redemption price per share: (b) | ||
| Class A | $36.77 | |
| Class B | $35.71 | |
| Class C | $35.59 | |
| Institutional | $37.30 | |
| Service | $36.54 | |
| |
||
| Shares outstanding: | ||
| Class A | 19,467,362 | |
| Class B | 7,718,709 | |
| Class C | 1,765,062 | |
| Institutional | 10,166,280 | |
| Service | 325,049 | |
| |
||
| Total shares outstanding, $.001 par value (unlimited number of shares authorized) | 39,442,462 | |
| |
||
(a)
|
Includes restricted cash of $675,000, $890,000, $250,000 and $550,000, respectively for CORE U. S. Equity, CORE Large Cap Growth,
CORE Small Cap Equity and CORE Large Cap Value relating to initial margin requirements on futures transaction.
|
(b)
|
Maximum public offering price per share (NAV per share multiplied by 1.0582) for Class A shares CORE U. S. Equity, CORE Large Cap
Growth, CORE Small Cap Equity, CORE Large Cap Value and CORE International Equity Fund is $38.91, $23.98, $13.65, $11.44 and $11.98, respectively. At redemption, Class B and Class C shares may be subject to a contingent deferred sales charge, assessed on
the amount equal to the lesser of the current net asset value or the original purchase price of the shares.
|
| CORE Large Cap
Growth Fund |
CORE Small Cap
Equity Fund |
CORE Large Cap
Value Fund |
CORE International
Equity Fund |
|||||
|---|---|---|---|---|---|---|---|---|
| $1,361,835,581 | $169,020,431 | $305,944,385 | $476,399,656 | |||||
| 970,820 | 266,692 | 601,254 | — | |||||
| — | 14,666,524 | — | — | |||||
| 621,576 | 124,617 | 624,335 | 1,159,484 | |||||
| 5,236,396 | 278,804 | 373,031 | 514,030 | |||||
| 198,000 | 1,170 | 22,000 | 4,701 | |||||
| 25,199 | 106,171 | 31,272 | 200,267 | |||||
| 2,671 | 412 | 835 | 1,151 | |||||
| |
||||||||
| 1,368,890,243 | 184,464,821 | 307,597,112 | 478,279,289 | |||||
| |
||||||||
| — | — | — | 2,173,090 | |||||
| — | 16,291,082 | — | 712,731 | |||||
| 1,739,258 | 538,830 | 605,148 | 296,152 | |||||
| 1,424,163 | 162,287 | 225,535 | 458,008 | |||||
| 90,588 | 47,705 | 42,650 | 210,211 | |||||
| |
||||||||
| 3,254,009 | 17,039,904 | 873,333 | 3,850,192 | |||||
| |
||||||||
| 917,658,528 | 132,546,531 | 294,474,508 | 412,265,491 | |||||
| 1,843,333 | — | 994,281 | 1,860,540 | |||||
| 55,954,231 | 14,015,352 | 1,615,759 | 22,044,710 | |||||
| 390,180,142 | 20,863,034 | 9,639,231 | 38,258,356 | |||||
| |
||||||||
| $1,365,636,234 | $167,424,917 | $306,723,779 | $474,429,097 | |||||
| |
||||||||
| $22.66 | $12.90 | $10.81 | $11.32 | |||||
| $22.14 | $12.63 | $10.75 | $11.22 | |||||
| $22.15 | $12.66 | $10.76 | $11.23 | |||||
| $22.87 | $13.03 | $10.82 | $11.48 | |||||
| $22.55 | $12.87 | $10.81 | $11.36 | |||||
| |
||||||||
| 24,082,166 | 4,258,568 | 9,337,825 | 13,021,877 | |||||
| 15,271,402 | 1,419,190 | 1,773,980 | 1,072,221 | |||||
| 6,995,769 | 654,995 | 1,038,478 | 613,417 | |||||
| 14,117,308 | 6,612,704 | 16,225,610 | 26,839,987 | |||||
| 172,000 | 4,882 | 1,116 | 2,348 | |||||
| |
||||||||
| 60,638,645 | 12,950,339 | 28,377,009 | 41,549,850 | |||||
| |
||||||||
| CORE U.S.
Equity Fund |
|||
|---|---|---|---|
| Investment income: | |||
| Dividends (a) | $ 18,998,231 | ||
| Interest | 257,074 | ||
| |
|||
| Total income | 19,255,305 | ||
| |
|||
| Expenses: | |||
| Management fees | 9,921,575 | ||
| Distribution and service fees (b) | 4,658,239 | ||
| Transfer agent fees (b) | 1,968,001 | ||
| Custodian fees | 223,705 | ||
| Registration fees | 172,738 | ||
| Professional fees | 61,744 | ||
| Trustee fees | 8,729 | ||
| Service share fees | 60,276 | ||
| Other | 96,528 | ||
| |
|||
| Total expenses | 17,171,535 | ||
| |
|||
| Less-expense reductions | (1,171,966 | ) | |
| |
|||
| Net Expenses | 15,999,569 | ||
| |
|||
| NET INVESTMENT INCOME (LOSS) | 3,255,736 | ||
| |
|||
| Realized and unrealized gain (loss) on investment, futures and foreign currency related transactions: | |||
| Net realized gain (loss) from: | |||
| Investment transactions | 143,703,343 | ||
| Futures transactions | (1,555,326 | ) | |
| Foreign currency related transactions | — | ||
| Net change in unrealized gain (loss) on: | |||
| Investments | 83,150,865 | ||
| Futures | 101,113 | ||
| Translation of assets and liabilities denominated in foreign currencies | — | ||
| |
|||
| Net realized and unrealized gain on investment, futures and foreign currency transactions: | 225,399,995 | ||
| |
|||
| NET INCREASE IN NET ASSETS RESULTING FROM OPERATIONS | $228,655,731 | ||
| |
|||
(a)
|
For the CORE U.S. Equity, CORE Large Cap Growth, CORE Large Cap Value and CORE International Equity Funds, foreign taxes withheld
on dividends were $126,815, $40,528, $11,794 and $1,350,779, respectively.
|
(b)
|
Class specific Distribution, Service and Transfer Agent fees were as follows:
|
| Distribution and Service Fees |
Transfer Agent Fees |
|||||||||||||||
|---|---|---|---|---|---|---|---|---|---|---|---|---|---|---|---|---|
| Class A |
Class B |
Class C |
Class A |
Class B |
Class C |
Institutional |
Service |
|||||||||
| CORE U.S. Equity Fund | 1,644,698 | 2,484,645 | 528,896 | 1,249,971 | 472,083 | 100,490 | 140,635 | 4,822 | ||||||||
| CORE Large Cap Growth Fund | 1,073,849 | 2,642,305 | 1,154,416 | 816,125 | 502,038 | 219,339 | 131,854 | 1,224 | ||||||||
| CORE Small Cap Equity Fund | 134,001 | 158,867 | 69,635 | 101,837 | 30,185 | 13,231 | 31,648 | 28 | ||||||||
| CORE Large Cap Value Fund | 222,782 | 177,310 | 90,527 | 169,314 | 33,689 | 17,200 | 69,901 | 5 | ||||||||
| CORE International Equity Fund | 687,424 | 113,403 | 62,639 | 261,221 | 21,547 | 11,902 | 123,484 | 9 | ||||||||
| CORE Large Cap
Growth Fund |
CORE Small Cap
Equity Fund |
CORE Large Cap
Value Fund |
CORE International
Equity Fund |
|||||||
|---|---|---|---|---|---|---|---|---|---|---|
| $ 14,788,642 | $ 1,601,157 | $ 6,301,317 | $ 7,984,396 | |||||||
| 1,019,670 | 149,670 | 120,367 | 337,415 | |||||||
| 15,808,312 | 1,750,827 | 6,421,684 | 8,321,811 | |||||||
| 8,564,308 | 1,322,879 | 1,743,960 | 3,942,495 | |||||||
| 4,870,570 | 362,503 | 490,619 | 863,466 | |||||||
| 1,670,580 | 176,929 | 290,109 | 418,163 | |||||||
| 209,008 | 159,571 | 95,520 | 702,008 | |||||||
| 169,870 | 89,759 | 64,476 | 85,402 | |||||||
| 58,632 | 59,880 | 80,825 | 46,247 | |||||||
| 8,729 | 8,729 | 8,309 | 8,990 | |||||||
| 15,306 | — | — | — | |||||||
| 119,374 | 92,817 | 134,436 | 163,971 | |||||||
| 15,686,377 | 2,273,067 | 2,908,254 | 6,230,742 | |||||||
| (1,721,672) | (341,963 | ) | (313,827 | ) | (431,358 | ) | ||||
| 13,964,705 | 1,931,104 | 2,594,427 | 5,799,384 | |||||||
| 1,843,607 | (180,277 | ) | 3,827,257 | 2,522,427 | ||||||
| 56,604,844 | 24,138,466 | 2,034,292 | 27,776,854 | |||||||
| (772,351) | (2,740,853 | ) | (316,083 | ) | 841,952 | |||||
| 126 | — | — | (296,713 | ) | ||||||
| 261,199,851 | 13,444,703 | 8,208,812 | (3,178,332 | ) | ||||||
| 392,404 | 4,266 | 36,688 | (23,759 | ) | ||||||
| — | — | — | (53,728 | ) | ||||||
| 317,424,874 | 34,846,582 | 9,963,709 | 25,066,274 | |||||||
| $319,268,481 | $34,666,305 | $13,790,966 | $27,588,701 | |||||||
| CORE U.S.
Equity Fund |
|||
|---|---|---|---|
| From operations: | |||
| Net investment income (loss) | $ 3,255,736 | ||
| Net realized gain on investment, futures and foreign currency related transactions | 142,148,017 | ||
| Net change in unrealized gain (loss) on investments, futures and translation of assets and liabilities
denominated in foreign currencies |
83,251,978 | ||
| |
|||
| Net increase in net assets resulting from operations | 228,655,731 | ||
| |
|||
| Distributions to shareholders: | |||
| From net investment income | |||
| Class A shares | (25,013 | ) | |
| Class B shares | (1,197 | ) | |
| Class C shares | — | ||
| Institutional shares | (780,127 | ) | |
| Service shares | — | ||
| From net realized gain | |||
| Class A shares | (62,600,563 | ) | |
| Class B shares | (24,209,721 | ) | |
| Class C shares | (4,880,735 | ) | |
| Institutional shares | (33,286,059 | ) | |
| Service shares | (1,192,519 | ) | |
| |
|||
| Total distributions to shareholders | (126,975,934 | ) | |
| |
|||
| From share transactions: | |||
| Proceeds from sales of shares | 316,072,192 | ||
| Reinvestment of dividends and distributions | 119,188,185 | ||
| Cost of shares repurchased | (310,048,888 | ) | |
| |
|||
| Net increase (decrease) in net assets resulting from share transactions | 125,211,489 | ||
| |
|||
| TOTAL INCREASE | 226,891,286 | ||
| |
|||
| Net assets: | |||
| Beginning of year | 1,218,427,291 | ||
| |
|||
| End of year | $1,445,318,577 | ||
| |
|||
| Accumulated undistributed net investment income (loss) | $ 3,253,727 | ||
| |
|||
| CORE Large Cap
Growth Fund |
CORE Small Cap
Equity Fund |
CORE Large Cap
Value Fund |
CORE International
Equity Fund |
|||||||
|---|---|---|---|---|---|---|---|---|---|---|
| $ 1,843,607 | $ (180,277 | ) | $ 3,827,257 | $ 2,522,427 | ||||||
| 55,832,619 | 21,397,613 | 1,718,209 | 28,322,093 | |||||||
| 261,592,255 | 13,448,969 | 8,245,500 | (3,255,819 | ) | ||||||
| |
||||||||||
| 319,268,481 | 34,666,305 | 13,790,966 | 27,588,701 | |||||||
| |
||||||||||
| — | — | (846,877 | ) | (486,145 | ) | |||||
| — | — | (66,845 | ) | (20,223 | ) | |||||
| — | — | (37,149 | ) | (9,872 | ) | |||||
| — | — | (2,359,400 | ) | (2,508,945 | ) | |||||
| — | — | (103 | ) | (182 | ) | |||||
| (1,696,633) | — | (1,086,282 | ) | (2,715,591 | ) | |||||
| (1,073,168) | — | (203,809 | ) | (240,852 | ) | |||||
| (451,184) | — | (103,226 | ) | (124,888 | ) | |||||
| (1,514,956) | — | (2,175,304 | ) | (6,459,250 | ) | |||||
| (13,169) | — | (136 | ) | (559 | ) | |||||
| |
||||||||||
| (4,749,110) | — | (6,879,131 | ) | (12,566,507 | ) | |||||
| |
||||||||||
| 498,678,850 | 66,906,806 | 106,881,945 | 215,168,577 | |||||||
| 3,616,384 | — | 2,716,441 | 4,464,163 | |||||||
| (322,204,172) | (69,490,670 | ) | (112,907,365 | ) | (160,031,898 | ) | ||||
| |
||||||||||
| 180,091,062 | (2,583,864 | ) | (3,308,979 | ) | 59,600,842 | |||||
| |
||||||||||
| 494,610,433 | 32,082,441 | 3,602,856 | 74,623,036 | |||||||
| |
||||||||||
| 871,025,801 | 135,342,476 | 303,120,923 | 399,806,061 | |||||||
| |
||||||||||
| $1,365,636,234 | $167,424,917 | $306,723,779 | $474,429,097 | |||||||
| |
||||||||||
| $ 1,843,333 | $ — | $ 994,281 | $ 1,860,540 | |||||||
| |
||||||||||
| CORE U.S.
Equity Fund |
|||
|---|---|---|---|
| From operations: | |||
| Net investment income (loss) | $ 804,328 | ||
| Net realized gain from investment, futures and foreign currency related transactions | 107,937,721 | ||
| Net change in unrealized gain (loss) on investments, futures and translation of assets and liabilities denominated in foreign
currencies |
(67,177,513 | ) | |
| |
|||
| Net increase in net assets resulting from operations | 41,564,536 | ||
| |
|||
| Distributions to shareholders: | |||
| From net investment income | |||
| Class A shares | — | ||
| Class B shares | — | ||
| Class C shares | — | ||
| Institutional shares | — | ||
| Service shares | — | ||
| |
|||
| Total distributions to shareholders | — | ||
| |
|||
| From share transactions: | |||
| Proceeds from sales of shares | 319,448,902 | ||
| Reinvestment of dividends and distributions | — | ||
| Cost of shares repurchased | (246,210,936 | ) | |
| |
|||
| Net increase (decrease) in net assets resulting from share transactions | 73,237,966 | ||
| |
|||
| TOTAL INCREASE (DECREASE) | 114,802,502 | ||
| |
|||
| Net assets: | |||
| Beginning of period | 1,103,624,789 | ||
| |
|||
| End of period | $1,218,427,291 | ||
| |
|||
| Accumulated undistributed net investment income | $ 804,328 | ||
| |
|||
| CORE Large Cap
Growth Fund |
CORE Small Cap
Equity Fund |
CORE Large Cap
Value Fund |
CORE International
Equity Fund |
|||||||
|---|---|---|---|---|---|---|---|---|---|---|
| $ (680,556) | $ (36,586 | ) | $ 1,640,665 | $ 2,765,109 | ||||||
| 22,317,402 | 12,113,209 | 3,498,419 | 11,791,065 | |||||||
| 20,792,182 | (11,401,516 | ) | 1,503,309 | 19,565,769 | ||||||
| |
||||||||||
| 42,429,028 | 675,107 | 6,642,393 | 34,121,943 | |||||||
| |
||||||||||
| — | — | (229,621 | ) | (2,101 | ) | |||||
| — | — | (19,258 | ) | — | ||||||
| — | — | (7,228 | ) | — | ||||||
| — | — | (950,208 | ) | — | ||||||
| — | — | (5 | ) | — | ||||||
| |
||||||||||
| — | — | (1,206,320 | ) | (2,101 | ) | |||||
| |
||||||||||
| 351,963,413 | 32,163,634 | 299,579,334 | 76,300,041 | |||||||
| — | — | 301,711 | 2,066 | |||||||
| (127,065,442) | (46,364,918 | ) | (62,866,712 | ) | (112,849,452 | ) | ||||
| |
||||||||||
| 224,897,971 | (14,201,284 | ) | 237,014,333 | (36,547,345 | ) | |||||
| |
||||||||||
| 267,326,999 | (13,526,177 | ) | 242,450,406 | (2,427,503 | ) | |||||
| |
||||||||||
| 603,698,802 | 148,868,653 | 60,670,517 | 402,233,564 | |||||||
| |
||||||||||
| $871,025,801 | $135,342,476 | $303,120,923 | $399,806,061 | |||||||
| |
||||||||||
| $ — | $ — | $ 478,248 | $ 2,637,600 | |||||||
| |
||||||||||
| CORE U.S.
Equity Fund |
|||
|---|---|---|---|
| From operations: | |||
| Net investment income (loss) | $ 2,036,756 | ||
| Net realized gain (loss) from investment, futures and foreign currency related transactions | 27,478,562 | ||
| Net change in unrealized gain (loss) on investments, futures and foreign currency related transactions | 176,422,425 | ||
| |
|||
| Net increase (decrease) in net assets resulting from operations | 205,937,743 | ||
| |
|||
| Distributions to shareholders: | |||
| From net investment income | |||
| Class A shares | (627,909 | ) | |
| Institutional shares | (1,448,951 | ) | |
| Service shares | (34,929 | ) | |
| In excess of net investment income | |||
| Class A shares | (111,425 | ) | |
| Institutional shares | (257,121 | ) | |
| Service shares | (6,198 | ) | |
| From net realized gain | |||
| Class A shares | (10,973,418 | ) | |
| Class B shares | (2,631,225 | ) | |
| Class C shares | (453,366 | ) | |
| Institutional shares | (6,196,732 | ) | |
| Service shares | (222,218 | ) | |
| |
|||
| Total distributions to shareholders | (22,963,492 | ) | |
| |
|||
| From share transactions: | |||
| Proceeds from sales of shares | 472,932,540 | ||
| Reinvestment of dividends and distributions | 21,759,127 | ||
| Cost of shares repurchased | (248,643,259 | ) | |
| |
|||
| Net increase in net assets resulting from share transactions | 246,048,408 | ||
| |
|||
| TOTAL INCREASE | 429,022,659 | ||
| |
|||
| Net assets: | |||
| Beginning of year | 674,602,130 | ||
| |
|||
| End of year | $1,103,624,789 | ||
| |
|||
| Accumulated undistributed (distributions in excess of) net investment income | $ — | ||
| |
|||
(a)
|
Commencement date of operations was December 31, 1998 for all share classes.
|
| CORE Large Cap
Growth Fund |
CORE Small Cap
Equity Fund |
CORE Large Cap
Value Fund (a) |
CORE International
Equity Fund |
||||||||
|---|---|---|---|---|---|---|---|---|---|---|---|
| $ (15,644 | ) | $ 173,270 | $ 37,422 | $ 1,407,352 | |||||||
| (16,923,839 | ) | (18,927,424 | ) | (32,964 | ) | (8,586,417) | |||||
| 102,776,431 | 18,052,638 | (109,578 | ) | 21,848,298 | |||||||
| |
|||||||||||
| 85,836,948 | (701,516 | ) | (105,120 | ) | 14,669,233 | ||||||
| |
|||||||||||
| — | (47,356 | ) | — | (250,453) | |||||||
| — | (125,897 | ) | — | (808,555) | |||||||
| — | (17 | ) | — | (35) | |||||||
| — | (6,981 | ) | — | — | |||||||
| (125,793 | ) | (18,557 | ) | — | — | ||||||
| (218 | ) | (3 | ) | — | — | ||||||
| (10,120 | ) | — | — | — | |||||||
| (4,694 | ) | — | — | — | |||||||
| (1,573 | ) | — | — | — | |||||||
| (12,174 | ) | — | — | — | |||||||
| (85 | ) | — | — | — | |||||||
| |
|||||||||||
| (154,657 | ) | (198,811 | ) | — | (1,059,043) | ||||||
| |
|||||||||||
| 502,793,514 | 153,543,862 | 62,186,814 | 470,437,011 | ||||||||
| 57,232 | 80,120 | — | 288,383 | ||||||||
| (61,380,388 | ) | (36,515,377 | ) | (1,411,177 | ) | (111,237,527) | |||||
| |
|||||||||||
| 441,470,358 | 117,108,605 | 60,775,637 | 359,487,867 | ||||||||
| |
|||||||||||
| 527,152,649 | 116,208,278 | 60,670,517 | 373,098,057 | ||||||||
| |
|||||||||||
| 76,546,153 | 32,660,375 | — | 29,135,507 | ||||||||
| |
|||||||||||
| $603,698,802 | $148,868,653 | $60,670,517 | $402,233,564 | ||||||||
| |
|||||||||||
| $ (158,558 | ) | $ (61,646 | ) | $ 37,422 | $ (153,510) | ||||||
| |
|||||||||||
| 1. ORGANIZATION
|
| Goldman Sachs Trust (the “Trust”) is a Delaware business trust registered under the Investment Company Act of 1940 (as
amended) as an open-end management investment company. The Trust includes the CORE U.S. Equity Fund, CORE Large Cap Growth Fund, CORE Small Cap Equity Fund, CORE Large Cap Value Fund and the CORE International Equity Fund, collectively the “
Funds” or individually a “Fund”. Each Fund is a diversified portfolio offering five classes of shares —Class A, Class B, Class C, Institutional and Service.
|
| 2. SIGNIFICANT ACCOUNTING POLICIES
|
| The following is a summary of the significant accounting policies consistently followed by the Funds. The preparation of financial
statements in conformity with generally accepted accounting principles requires management to make estimates and assumptions that may affect the reported amounts. Actual results could differ from those estimates. Effective for fiscal year 1999, the Board
of Trustees approved a change in the fiscal year-end of the Funds from January 31 to August 31. Accordingly, the Statement of Changes in Net Assets, Summary of Share Transactions and Financial Highlights of the Funds are included for the seven-month
period ended August 31, 1999 and the year ended January 31, 1999.
|
| A. Investment Valuation — Investments in
securities traded on a U.S. or foreign securities exchange or the NASDAQ system are valued daily at their last sale price on the principal exchange on which they are traded. If no sale occurs, securities are valued at the last bid price. Debt securities
are valued at prices supplied by independent pricing services, broker / dealer-supplied valuations or matrix pricing systems. Unlisted equity and debt securities for which market quotations are available are valued at the last sale price on valuation
date, or if no sale occurs, at the last bid price. Short-term debt obligations maturing in sixty days or less are valued at amortized cost, which approximates market value. Securities for which quotations are not readily available are valued at fair value
using methods approved by the Trust’s Board of Trustees.
|
| B. Security Transactions and Investment Income — Security transactions are recorded as of the trade date. Realized gains and losses on sales of portfolio securities are calculated using the identified-cost basis. Dividend income is recorded on the ex-dividend date, net of foreign taxes where
applicable. Dividends for which the Fund has the choice to receive either cash or stock are recognized as investment income in an amount equal to the cash dividend. Interest income is recorded on the basis of interest accrued, premium amortized and
discount earned.
|
| Net investment income (other than class-specific expenses) and unrealized and realized gains or losses are allocated daily to each
class of shares of the Funds based upon the relative proportion of net assets of each class.
|
| C. Federal Taxes — It is each Fund’s
policy to comply with the requirements of the Internal Revenue Code applicable to regulated investment companies and to distribute each year substantially all of its investment company taxable income and capital gains to its shareholders. Accordingly, no
federal tax provisions are required. Income distributions, if any, are declared and paid quarterly for CORE Large Cap Value Fund and annually for all other Funds. Capital gains distributions, if any, are declared and paid annually.
|
| The characterization of distributions to shareholders for financial reporting
purposes is determined in accordance with income tax rules. Therefore, the source of each Fund’s distributions may be shown in the accompanying financial statements as either from or in excess of net investment income or net realized gain on
investment transactions, or from paid-in capital, depending on the type of book/tax differences that may exist.
|
| 2. SIGNIFICANT ACCOUNTING POLICIES (continued)
|
| At August 31, 2000, the Funds’ aggregate unrealized gains and losses based on
cost for federal income tax purposes were as follows:
|
| Fund | Tax Cost
|
|
Gross
Unrealized Gain |
Gross
Unrealized Loss |
Net Unrealized
Gain |
|||
|---|---|---|---|---|---|---|---|---|
| |
||||||||
| CORE U.S. Equity | $1,101,907,127 | $406,511,884 | $65,318,044 | $341,193,840 | ||||
| |
||||||||
| CORE Large Cap Growth | 972,847,948 | 438,202,387 | 49,214,754 | 388,987,633 | ||||
| |
||||||||
| CORE Small Cap Equity | 148,518,847 | 27,585,688 | 7,084,104 | 20,501,584 | ||||
| |
||||||||
| CORE Large Cap Value | 296,390,567 | 36,130,901 | 26,577,083 | 9,553,818 | ||||
| |
||||||||
| CORE International Equity | 438,580,837 | 62,225,912 | 24,407,093 | 37,818,819 | ||||
| |
||||||||
| D. Expenses — Expenses incurred by the
Trust that do not specifically relate to an individual fund of the Trust are allocated to the Funds on a straight-line or pro rata basis depending upon the nature of the expense.
|
| Class A, Class B and Class C shareholders of the Funds bear all expenses and fees
relating to their respective Distribution and Service plans. Shareholders of Service shares bear all expenses and fees paid to service organizations. Each class of shares of the Funds separately bears its respective class-specific transfer agency fees.
|
| E. Foreign Currency Translations — The
books and records of the Funds are maintained in U.S. dollars. Amounts denominated in foreign currencies are translated into U.S. dollars on the following basis: (i) investment valuations, foreign currency and other assets and liabilities initially
expressed in foreign currencies are converted each business day into U.S. dollars based upon current exchange rates; and (ii) purchases and sales of foreign investments, income and expenses are converted into U.S. dollars based upon currency exchange
rates prevailing on the respective dates of such transactions.
|
| Net realized and unrealized gain (loss) on foreign currency transactions will
represent: (i) foreign exchange gains and losses from the sale and holdings of foreign currencies; (ii) currency gains and losses between trade date and settlement date on investment securities transactions and forward exchange contracts; and (iii) gains
and losses from the difference between amounts of dividends, interest and foreign withholding taxes recorded and the amounts actually received.
|
| F. Segregation Transactions — The Funds
may enter into certain derivative transactions. Forward foreign currency exchange contracts, futures contracts, written options, when-issued securities and forward commitments represent examples of such transactions. As a result of entering into these
transactions, the Funds are required to segregate liquid assets on the accounting records equal to or greater than the market value of the corresponding transactions.
|
| G. Repurchase Agreements — Repurchase
agreements involve the purchase of securities subject to the seller’s agreement to repurchase them at a mutually agreed upon date and price. During the term of a repurchase agreement, the value of the underlying securities, including accrued
interest, is required to equal or exceed the value of the repurchase agreement. The underlying securities for all repurchase agreements are held in safekeeping at each Fund’s custodian.
|
| 3. AGREEMENTS
|
| Pursuant to Investment Management Agreements (the “Agreements”), Goldman Sachs Asset Management (“GSAM”), a
unit of the Investment Management Division of Goldman Sachs & Co. (“Goldman Sachs”), serves as the investment adviser to CORE Large Cap Growth, CORE Small Cap Equity, CORE Large Cap Value and CORE International Equity Funds. Goldman Sachs
Funds Management, L.P. (“GSFM”), an affiliate of Goldman, Sachs & Co., serves as the investment adviser to CORE U.S. Equity Fund. Under the Agreements, the respective adviser, subject to the general supervision of the Trust’s Board of
Trustees, manages the Funds’ portfolios. As compensation for the services rendered pursuant to the Agreements, the assumption of the expenses related thereto and administering the Funds’ business affairs, including providing facilities, the
respective adviser is entitled to a management fee, computed daily and payable monthly, at an annual rate equal to .75%, .75%, .85%, .60% and .85% of the average daily net assets of CORE U.S. Equity, CORE Large Cap Growth, CORE Small Cap Equity, CORE
Large Cap Value and CORE International Equity Funds, respectively. For the year ended August 31, 2000, the advisers for CORE U.S. Equity and CORE Large Cap Growth have voluntarily agreed to waive a portion of their management fee equal annually to .05%
and .05% (.15% prior to May 1, 2000), respectively, of each Fund’s average daily net assets. The advisers may discontinue or modify these waivers in the future at their discretion.
|
| Each adviser has voluntarily agreed to limit certain “Other Expenses”
for the CORE U.S. Equity, CORE Large Cap Growth, CORE Small Cap Equity, CORE Large Cap Value and CORE International Equity Funds (excluding management fees, distribution and service fees, transfer agent fees, taxes, interest, brokerage, litigation,
Service Share fees, indemnification costs and extraordinary expenses), to the extent such expenses exceed, on an annual basis, .00%, .02% (.00% prior to May 1, 2000), .04%, .06% (.00% prior to May 1, 2000), and .12% of the average daily net assets of the
Funds, respectively.
|
| The Trust, on behalf of each Fund, has adopted Distribution and Service Plans.
Under the Distribution and Service Plans, Goldman Sachs and/or authorized dealers are entitled to a monthly fee from each Fund for distribution and shareholder maintenance services equal, on an annual basis, to .25% (.50% for CORE International Equity
Fund), 1.00% and 1.00% of the Funds’ average daily net assets attributable to Class A, Class B and Class C Shares, respectively.
|
| Goldman Sachs serves as the distributor of shares of the Funds pursuant to
Distribution Agreements. Goldman Sachs may receive a portion of the Class A sales load and Class B and Class C contingent deferred sales charge and has advised the Funds that it retained approximately $258,000, $334,000, $59,000, $81,000 and $54,000
during the year ended August 31, 2000 for the CORE U.S. Equity, CORE Large Cap Growth, CORE Small Cap Equity, CORE Large Cap Value and CORE International Equity Funds, respectively.
|
| Goldman Sachs also serves as the transfer agent of the Funds for a fee. Fees
charged for such transfer agency services are calculated daily and payable monthly at an annual rate as follows: .19% of the average daily net assets for Class A, Class B and Class C Shares and .04% of the average daily net assets for Institutional and
Service Shares.
|
| The Trust, on behalf of each Fund, has adopted a Service Plan. This plan allows
for Service shares to compensate service organizations for providing varying levels of account administration and shareholder liaison services to their customers who are beneficial owners of such shares. The Service Plan provides for compensation to the
service organizations in an amount up to .50% (on a annualized basis) of the average daily net asset value of the Service Shares.
|
| 3. AGREEMENTS (continued)
|
| For the year ended August 31, 2000, the Funds’ advisers have voluntarily
agreed to waive certain fees and reimburse other expenses. In addition, the Funds have entered into certain offset arrangements with the custodian resulting in a reduction in the Funds’ expenses. These expense reductions were as follows (in thousands):
|
| Fund | Management Fee Waiver | Reimbursement | Custody Credit | Total Expense
Reductions |
||||
|---|---|---|---|---|---|---|---|---|
| |
||||||||
| CORE U.S. Equity | $ 661 | $501 | $10 | $1,172 | ||||
| |
||||||||
| CORE Large Cap Growth | 1,287 | 430 | 5 | 1,722 | ||||
| |
||||||||
| CORE Small Cap Equity | — | 336 | 6 | 342 | ||||
| |
||||||||
| CORE Large Cap Value | — | 308 | 6 | 314 | ||||
| |
||||||||
| CORE International Equity | — | 431 | — | 431 | ||||
| |
||||||||
| At August 31, 2000, the amounts owed to affiliates were as follows (in thousands):
|
| Fund | Management
Fees |
Distribution
and Service Fees |
Transfer
Agent Fees |
Total | ||||
|---|---|---|---|---|---|---|---|---|
| |
||||||||
| CORE U.S. Equity | $830 | $424 | $177 | $1,431 | ||||
| |
||||||||
| CORE Large Cap Growth | 758 | 499 | 167 | 1,424 | ||||
| |
||||||||
| CORE Small Cap Equity | 115 | 32 | 15 | 162 | ||||
| |
||||||||
| CORE Large Cap Value | 153 | 46 | 27 | 226 | ||||
| |
||||||||
| CORE International Equity | 342 | 79 | 37 | 458 | ||||
| |
||||||||
| 4. PORTFOLIO SECURITIES TRANSACTIONS
|
| The cost of purchases and proceeds of sales and maturities of securities (excluding short-term investments, futures
and options) for the year ended August 31, 2000, were as follows:
|
| Fund | Purchases | Sales and Maturities | |||
|---|---|---|---|---|---|
| |
|||||
| CORE U.S. Equity | $780,125,255 | $780,031,727 | |||
| |
|||||
| CORE Large Cap Growth | 984,468,553 | 811,219,403 | |||
| |
|||||
| CORE Small Cap Equity | 207,379,757 | 212,624,028 | |||
| |
|||||
| CORE Large Cap Value | 239,331,776 | 245,137,546 | |||
| |
|||||
| CORE International Equity | 467,277,939 | 417,112,631 | |||
| |
|||||
| For the year ended August 31, 2000, Goldman Sachs earned
approximately $9,100, $10,000, $4,500, $5,400 and $401,000 of brokerage commissions from portfolio transactions, including futures transactions executed on behalf of the CORE U.S. Equity, CORE Large Cap Growth, CORE Small Cap Equity, CORE Large Cap Value
and CORE International Equity Funds, respectively.
|
| Forward Foreign Currency Exchange Contracts — The CORE International Fund may enter into forward foreign currency exchange contracts for the purchase or sale of a specific foreign currency at a fixed price on a future date as a hedge or cross-hedge against either specific transactions or portfolio
positions. The CORE International Equity Fund may also purchase and sell forward contracts to seek to increase total return. All commitments are “marked-to-market” daily at the applicable translation rates and any resulting unrealized gains or
losses are recorded in the Fund’s financial statements. The Fund realizes gains or losses at the time a forward contract is offset by entry into a closing transaction or extinguished by delivery of the currency. Risks may arise upon entering into
these contracts from the potential inability of counterparties to meet the terms of their contracts and from unanticipated movements in the value of a foreign currency relative to the U.S. dollar. As of August 31, 2000, there were no open forward currency
contracts outstanding.
|
| Option Accounting Principles — When the
Funds write call or put options, an amount equal to the premium received is recorded as an asset and as an equivalent liability. The amount of the liability is subsequently marked-to-market to reflect the current market value of the option written. When a
written option expires on its stipulated expiration date or the Funds enter into a closing purchase transaction, the Funds realize a gain or loss without regard to any unrealized gain or loss on the underlying security, and the liability related to such
option is extinguished. When a written call option is exercised, the Funds realize a gain or loss from the sale of the underlying security, and the proceeds of the sale are increased by the premium originally received. When a written put option is
exercised, the amount of the premium originally received will reduce the cost of the security which the Funds purchase upon exercise. There is a risk of loss from a change in value of such options which may exceed the related premiums received.
|
| 4. PORTFOLIO SECURITIES TRANSACTIONS (continued)
|
| Upon the purchase of a call option or a protective put option by the Funds, the
premium paid is recorded as an investment and subsequently marked-to-market to reflect the current market value of the option. If an option which the Funds have purchased expires on the stipulated expiration date, the Funds will realize a loss in the
amount of the cost of the option. If the Funds enter into a closing sale transaction, the Funds will realize a gain or loss, depending on whether the sale proceeds for the closing sale transaction are greater or less than the cost of the option. If the
Funds exercise a purchased put option, the Funds will realize a gain or loss from the sale of the underlying security, and the proceeds from such sale will be decreased by the premium originally paid. If the Funds exercise a purchased call option, the
cost of the security which the Funds purchase upon exercise will be increased by the premium originally paid. As of August 31, 2000, there were no options outstanding.
|
| Futures Contracts — The Funds may enter into futures
transactions to hedge against changes in interest rates, securities prices, currency exchange rates or (for CORE International Equity Fund only) to seek to increase total return. Upon entering into a futures contract, the Funds are required to deposit
with a broker or the Fund’s custodian bank an amount of cash or securities equal to the minimum “initial margin” requirement of the associated futures exchange. Subsequent payments for futures contracts (“variation margin”) are
paid or received by the Funds, depending on the fluctuations in the value of the contracts, and are recorded for financial reporting purposes as unrealized gains or losses. When contracts are closed, the Funds realize a gain or loss which is reported in
the Statement of Operations.
|
| The use of futures contracts involve, to varying degrees, elements of market risk
which may exceed the amounts recognized in the Statements of Assets and Liabilities. Changes in the value of the futures contract may not directly correlate with changes in the value of the underlying securities. This risk may decrease the effectiveness
of the Funds’ strategies and potentially result in a loss. At August 31, 2000, open futures contracts were as follows:
|
| Fund | Type | Number of
Contracts Long |
Settlement
Month |
Market Value | Unrealized
Gain (Loss) |
||||
|---|---|---|---|---|---|---|---|---|---|
| |
|||||||||
| CORE U.S. Equity | S&P 500 Index | 11 | September 2000 | $ 4,183,300 | $ 74,780 | ||||
| |
|||||||||
| CORE Large Cap Growth | S&P 500 Index | 45 | September 2000 | $17,113,500 | $223,984 | ||||
| |
|||||||||
| CORE Small Cap Equity | Russell 2000 Index | 3 | September 2000 | $ 805,575 | $ 9,610 | ||||
| |
|||||||||
| CORE Large Cap Value | S&P 500 Index | 5 | September 2000 | $ 1,901,500 | $ 18,150 | ||||
| |
|||||||||
| CORE International Equity | FTSE 100 Index | 7 | September 2000 | $ 679,347 | $ 22,300 | ||||
| All Ordinaries Index | 3 | September 2000 | 142,418 | (2,537 | ) | ||||
| CAC-40-10EU Index | 2 | September 2000 | 117,769 | 1,110 | |||||
| IBEX 35 Index | 1 | September 2000 | 96,627 | (3,076 | ) | ||||
| Hang Seng Index | 1 | September 2000 | 110,014 | (4,244 | ) | ||||
| TOPIX Index | 6 | September 2000 | 848,383 | (1,219 | ) | ||||
| EURX EX STX Index | 19 | September 2000 | 872,712 | (2,601 | ) | ||||
| |
|||||||||
| $ 2,867,270 | $ 9,733 | ||||||||
| |
|||||||||
| 5. LINE OF CREDIT FACILITY
|
| Effective May 31, 2000, the Funds participate in a $350,000,000 committed, unsecured revolving line of credit facility. Prior
thereto, the Funds participated in a $250,000,000 uncommitted and a $250,000,000 committed, unsecured revolving line of credit facility. Under the most restrictive arrangement, each Fund must own securities having a market value in excess of 400% of the
total bank borrowings. This facility is to be used solely for temporary or emergency purposes. The interest rate on borrowings is based on the Federal Funds rate. The committed facility also requires a fee to be paid by the Funds based on the amount of
the commitment. During the year ended August 31, 2000, the Funds did not have any borrowings under any of these facilities.
|
| 6. JOINT REPURCHASE AGREEMENT ACCOUNT
|
| The Funds, together with other registered investment companies having management agreements with GSAM and GSFM or their
affiliates, transfer uninvested cash into joint accounts, the daily aggregate balance of which is invested in one or more repurchase agreements.
|
| At August 31, 2000, the CORE U.S. Equity, CORE Large Cap Growth, CORE Small Cap
Equity and CORE Large Cap Value Funds had undivided interests in the repurchase agreements in the joint account which equaled $2,500,000, $16,300,000, $2,200,000 and $1,400,000, respectively, in principal amount. At August 31, 2000, the following
repurchase agreements held in this joint account were fully collateralized by Federal Agency obligations:
|
| Repurchase Agreements | Principal
Amount |
Interest
Rate |
Maturity
Date |
Amortized
Cost |
Maturity
Value |
|||||||
|---|---|---|---|---|---|---|---|---|---|---|---|---|
| ABN/AMRO, Inc. | $814,100,000 | 6.66 | % | 09/01/2000 | $ 814,100,000 | $ 814,250,608 | ||||||
| Banc of America Securities LLC | 900,000,000 | 6.67 | 09/01/2000 | 900,000,000 | 900,166,750 | |||||||
| Barclays Capital, Inc. | 500,000,000 | 6.67 | 09/01/2000 | 500,000,000 | 500,092,639 | |||||||
| Bear Stearns Companies, Inc. | 300,000,000 | 6.67 | 09/01/2000 | 300,000,000 | 300,055,583 | |||||||
| Chase Securities, Inc. | 450,000,000 | 6.67 | 09/01/2000 | 450,000,000 | 450,083,375 | |||||||
| Donaldson, Lufkin & Jenrette, Inc. | 1,000,000,000 | 6.67 | 09/01/2000 | 1,000,000,000 | 1,000,185,278 | |||||||
| J.P. Morgan & Co., Inc. | 800,000,000 | 6.65 | 09/01/2000 | 800,000,000 | 800,147,778 | |||||||
| Morgan Stanley Dean Witter & Co. | 750,000,000 | 6.65 | 09/01/2000 | 750,000,000 | 750,138,542 | |||||||
| Morgan Stanley Dean Witter & Co. | 300,000,000 | 6.60 | 09/01/2000 | 300,000,000 | 300,055,000 | |||||||
| UBS Warburg LLC | 800,000,000 | 6.65 | 09/01/2000 | 800,000,000 | 800,147,778 | |||||||
| TOTAL JOINT REPURCHASE AGREEMENT ACCOUNT II | $6,614,100,000 | $6,615,323,331 | ||||||||||
| 7. OTHER MATTERS
|
| As of August 31, 2000, Goldman, Sachs & Co. Profit Sharing Master Trust was the beneficial owner of approximately 11% of the
outstanding shares of the CORE U.S. Equity Fund. In addition, the following Goldman Sachs Asset Allocation Portfolios were beneficial owners of the Funds (as a percentage of outstanding shares):
|
| Fund | Goldman Sachs
Growth and Income Strategy Portfolio |
Goldman Sachs
Growth Strategy Portfolio |
Goldman Sachs
Aggressive Growth Strategy Portfolio |
|||||||
|---|---|---|---|---|---|---|---|---|---|---|
| CORE Large Cap Growth | — | % | 5 | % | — | % | ||||
| CORE Small Cap Equity | 7 | 8 | 7 | |||||||
| CORE Large Cap Value | 18 | 20 | 11 | |||||||
| CORE International Equity | 22 | 21 | 11 | |||||||
| 8. CERTAIN RECLASSIFICATIONS
|
| In accordance with AICPA Statement of Position 93-2, the CORE U.S. Equity Fund reclassified $2 from paid-in capital to accumulated
net realized gain from investment, futures and foreign currency related transactions. CORE Large Cap Growth reclassified $164 from accumulated net realized gain from investment, futures and foreign currency related transactions, and $274 from accumulated
undistributed net investment income to paid-in capital. CORE Small Cap Equity reclassified $399 and $180,277 from accumulated net realized gain from investment, futures and foreign currency related transactions to paid-in capital and accumulated
undistributed net investment income, respectively. CORE Large Cap Value reclassified $850 from accumulated undistributed net investment income to accumulated net realized gain from investment, futures and foreign currency related transactions. CORE
International Equity reclassified $273,720 and $400 from accumulated undistributed net investment income to accumulated net realized gain from investment, futures and foreign currency transactions and paid-in capital, respectively. Reclassifications
result primarily from the difference in the tax treatment of foreign currency, net operating losses and organization costs.
|
| 9. CHANGE IN INDEPENDENT ACCOUNTANTS
|
| On October 26, 1999, the Board of Trustees of the Funds, upon the recommendation of the Board’s audit committee, determined
not to retain Arthur Andersen LLP and approved a change of the Funds’ independent accountants to PricewaterhouseCoopers LLP. For the period ended August 31, 1999 and year ended January 31, 1999, Arthur Andersen LLP’s audit reports contained no
adverse opinion or disclaimer of opinion; nor were their reports qualified or modified as to uncertainty, audit scope, or accounting principles. Further, there were no disagreements between the Funds and Arthur Andersen LLP on accounting principles or
practices, financial statement disclosure or audit scope or procedure, which if not resolved to the satisfaction of Arthur Andersen LLP would have caused them to make reference to the disagreement in their report.
|
| Goldman Sachs Trust — CORE Funds — Tax Information (Unaudited)
|
| For the year ended August 31, 2000, 30.74% and 73.86% of the dividends paid from net
investment company taxable income by the CORE U.S. Equity and CORE Large Cap Value Funds, respectively, qualify for the dividends received deduction available to corporations.
|
| Pursuant to Section 852 of the Internal Revenue Code, CORE U.S. Equity, CORE Large Cap
Growth and CORE Large Cap Value Funds designate $99,883,968, $4,749,110 and $354,283, respectively, as capital gains dividends for the year ended August 31, 2000.
|
| From distributions paid during the year ended August 31, 2000, the total amount of income
received by the CORE International Equity Fund from sources with foreign countries and possessions of the United States was $0.1321 per share of all of which is attributable to qualified passive income. The total amount of taxes paid by the Fund to such
countries was $0.0230 per share. A separate notice containing the country by country components of these totals has been previously mailed to the shareholders.
|
| 10. SUMMARY OF SHARE TRANSACTIONS
|
| Share activity for the year ended August 31, 2000, is as follows:
|
| CORE U.S. Equity Fund |
||||||
|---|---|---|---|---|---|---|
| Shares | Dollars | |||||
| |
||||||
| Class A Shares | ||||||
| Shares sold | 4,299,636 | $147,748,472 | ||||
| Reinvestment of dividends and distributions | 1,814,645 | 60,210,166 | ||||
| Shares repurchased | (4,601,391 | ) | (158,796,518 | ) | ||
| |
||||||
| 1,512,890 | 49,162,120 | |||||
| |
||||||
| Class B Shares | ||||||
| Shares sold | 2,022,727 | 67,970,799 | ||||
| Reinvestment of dividends and distributions | 679,601 | 22,025,886 | ||||
| Shares repurchased | (1,361,908 | ) | (45,688,038 | ) | ||
| |
||||||
| 1,340,420 | 44,308,647 | |||||
| |
||||||
| Class C Shares | ||||||
| Shares sold | 761,123 | 25,417,131 | ||||
| Reinvestment of dividends and distributions | 129,351 | 4,176,748 | ||||
| Shares repurchased | (421,409 | ) | (14,196,500 | ) | ||
| |
||||||
| 469,065 | 15,397,379 | |||||
| |
||||||
| Institutional Shares | ||||||
| Shares sold | 2,043,937 | 71,350,795 | ||||
| Reinvestment of dividends and distributions | 941,797 | 31,616,126 | ||||
| Shares repurchased | (2,511,099 | ) | (86,461,857 | ) | ||
| |
||||||
| 474,635 | 16,505,064 | |||||
| |
||||||
| Service Shares | ||||||
| Shares sold | 104,405 | 3,584,995 | ||||
| Reinvestment of dividends and distributions | 35,129 | 1,159,259 | ||||
| Shares repurchased | (143,474 | ) | (4,905,975 | ) | ||
| |
||||||
| (3,940 | ) | (161,721 | ) | |||
| |
||||||
| NET INCREASE (DECREASE) | 3,793,070 | $125,211,489 | ||||
| |
||||||
| CORE Large Cap Growth Fund | CORE Small Cap Equity Fund | CORE Large Cap Value Fund | CORE International Equity Fund | |||||||||||||||||||
|---|---|---|---|---|---|---|---|---|---|---|---|---|---|---|---|---|---|---|---|---|---|---|
| Shares | Dollars | Shares | Dollars | Shares | Dollars | Shares | Dollars | |||||||||||||||
| 13,185,194 | $264,595,168 | 2,396,202 | $28,017,254 | 5,748,276 | $59,575,667 | 10,563,804 | $122,888,676 | |||||||||||||||
| 82,214 | 1,599,043 | — | — | 181,124 | 1,877,202 | 264,086 | 3,079,248 | |||||||||||||||
| (6,856,684 | ) | (139,418,654) | (3,283,915 | ) | (38,105,187 | ) | (5,225,016 | ) | (53,546,888 | ) | (8,336,349 | ) | (97,065,965 | ) | ||||||||
| 6,410,724 | 126,775,557 | (887,713 | ) | (10,087,933 | ) | 704,384 | 7,905,981 | 2,491,541 | 28,901,959 | |||||||||||||
| 6,245,212 | 121,555,868 | 467,046 | 5,394,626 | 1,137,293 | 11,705,218 | 368,199 | 4,263,313 | |||||||||||||||
| 48,352 | 924,021 | — | — | 20,707 | 214,186 | 20,441 | 237,117 | |||||||||||||||
| (1,864,186 | ) | (36,911,091) | (406,335 | ) | (4,598,965 | ) | (761,301 | ) | (7,827,473 | ) | (164,712 | ) | (1,911,815 | ) | ||||||||
| 4,429,378 | 85,568,798 | 60,711 | 795,661 | 396,699 | 4,091,931 | 223,928 | 2,588,615 | |||||||||||||||
| 3,571,933 | 70,145,056 | 283,210 | 3,295,043 | 756,650 | 7,858,271 | 997,152 | 11,442,000 | |||||||||||||||
| 17,989 | 343,770 | — | — | 11,936 | 123,567 | 9,233 | 107,195 | |||||||||||||||
| (1,101,162 | ) | (21,663,375) | (249,135 | ) | (2,821,220 | ) | (494,316 | ) | (5,120,910 | ) | (847,176 | ) | (9,754,850 | ) | ||||||||
| 2,488,760 | 48,855,451 | 34,075 | 473,823 | 274,270 | 2,860,928 | 159,209 | 1,794,345 | |||||||||||||||
| 2,019,488 | 41,436,896 | 2,529,882 | 30,183,742 | 2,688,867 | 27,742,789 | 6,441,624 | 76,556,582 | |||||||||||||||
| 37,627 | 736,381 | — | — | 48,421 | 501,247 | 88,349 | 1,039,862 | |||||||||||||||
| (6,106,529 | ) | (123,783,480) | (1,999,404 | ) | (23,933,329 | ) | (4,477,133 | ) | (46,410,458 | ) | (4,341,229 | ) | (51,299,130 | ) | ||||||||
| (4,049,414 | ) | (81,610,203) | 530,478 | 6,250,413 | (1,739,845 | ) | (18,166,422 | ) | 2,188,744 | 26,297,314 | ||||||||||||
| 45,373 | 945,862 | 1,408 | 16,141 | — | — | 1,581 | 18,006 | |||||||||||||||
| 680 | 13,169 | — | — | 23 | 239 | 63 | 741 | |||||||||||||||
| (22,151 | ) | (457,572) | (2,769 | ) | (31,969 | ) | (160 | ) | (1,636 | ) | (11 | ) | (138 | ) | ||||||||
| 23,902 | 501,459 | (1,361 | ) | (15,828 | ) | (137 | ) | (1,397 | ) | 1,633 | 18,609 | |||||||||||
| 9,303,350 | $180,091,062 | (263,810 | ) | $ (2,583,864 | ) | (364,629 | ) | $ (3,308,979 | ) | 5,065,055 | $ 59,600,842 | |||||||||||
| 10. SUMMARY OF SHARE TRANSACTIONS (continued)
|
| Share activity for the seven-month period ended August 31, 1999, is as follows:
|
| CORE U.S. Equity Fund |
||||||
|---|---|---|---|---|---|---|
| Shares | Dollars | |||||
| |
||||||
| Class A Shares | ||||||
| Shares sold | 4,480,478 | $152,209,945 | ||||
| Reinvestment of dividends and distributions | — | — | ||||
| Shares repurchased | (4,885,988 | ) | (165,197,641 | ) | ||
| |
||||||
| (405,510 | ) | (12,987,696 | ) | |||
| |
||||||
| Class B Shares | ||||||
| Shares sold | 2,114,834 | 70,617,885 | ||||
| Reinvestment of dividends and distributions | — | — | ||||
| Shares repurchased | (424,409 | ) | (14,199,866 | ) | ||
| |
||||||
| 1,690,425 | 56,418,019 | |||||
| |
||||||
| Class C Shares | ||||||
| Shares sold | 622,703 | 20,790,097 | ||||
| Reinvestment of dividends and distributions | — | — | ||||
| Shares repurchased | (157,393 | ) | (5,321,657 | ) | ||
| |
||||||
| 465,310 | 15,468,440 | |||||
| |
||||||
| Institutional Shares | ||||||
| Shares sold | 2,156,813 | 74,023,816 | ||||
| Reinvestment of dividends and distributions | — | — | ||||
| Shares repurchased | (1,693,849 | ) | (58,817,319 | ) | ||
| |
||||||
| 462,964 | 15,206,497 | |||||
| |
||||||
| Service Shares | ||||||
| Shares sold | 53,313 | 1,807,159 | ||||
| Reinvestment of dividends and distributions | — | — | ||||
| Shares repurchased | (77,444 | ) | (2,674,453 | ) | ||
| |
||||||
| (24,131 | ) | (867,294 | ) | |||
| |
||||||
| NET INCREASE (DECREASE) | 2,189,058 | $ 73,237,966 | ||||
| |
||||||
| CORE Large Cap Growth Fund | CORE Small Cap Equity Fund | CORE Large Cap Value Fund | CORE International Equity Fund | |||||||||||||||||||
|---|---|---|---|---|---|---|---|---|---|---|---|---|---|---|---|---|---|---|---|---|---|---|
| Shares | Dollars | Shares | Dollars | Shares | Dollars | Shares | Dollars | |||||||||||||||
| 10,470,228 | $170,184,476 | 1,258,148 | $13,030,383 | 9,581,268 | $104,106,541 | 4,236,762 | $43,587,990 | |||||||||||||||
| — | — | — | — | 20,832 | 227,047 | 193 | 2,066 | |||||||||||||||
| (3,654,092 | ) | (60,336,764) | (2,417,812 | ) | (24,600,070 | ) | (1,624,984 | ) | (18,072,273 | ) | (4,760,025 | ) | (49,081,701 | ) | ||||||||
| 6,816,136 | 109,847,712 | (1,159,664 | ) | (11,569,687 | ) | 7,977,116 | 86,261,315 | (523,070 | ) | (5,491,645 | ) | |||||||||||
| 5,780,900 | 93,035,450 | 301,937 | 3,002,544 | 1,385,917 | 15,120,099 | 209,022 | 2,180,794 | |||||||||||||||
| — | — | — | — | 1,345 | 14,579 | — | — | |||||||||||||||
| (801,603 | ) | (12,987,080) | (473,346 | ) | (4,654,066 | ) | (43,481 | ) | (468,504 | ) | (104,302 | ) | (1,068,660 | ) | ||||||||
| 4,979,297 | 80,048,370 | (171,409 | ) | (1,651,522 | ) | 1,343,781 | 14,666,174 | 104,720 | 1,112,134 | |||||||||||||
| 2,791,478 | 45,140,043 | 159,684 | 1,608,796 | 751,112 | 8,221,628 | 495,659 | 5,019,291 | |||||||||||||||
| — | — | — | — | 610 | 6,613 | — | — | |||||||||||||||
| (604,096 | ) | (9,757,233) | (189,207 | ) | (1,825,005 | ) | (13,955 | ) | (152,653 | ) | (417,071 | ) | (4,248,461 | ) | ||||||||
| 2,187,382 | 35,382,810 | (29,523 | ) | (216,209 | ) | 737,767 | 8,075,588 | 78,588 | 770,830 | |||||||||||||
| 2,587,072 | 42,841,502 | 1,430,824 | 14,494,462 | 16,847,196 | 172,118,566 | 2,418,684 | 25,505,971 | |||||||||||||||
| — | — | — | — | 4,958 | 53,468 | — | — | |||||||||||||||
| (2,662,983 | ) | (43,943,062) | (1,498,950 | ) | (15,266,801 | ) | (4,143,528 | ) | (44,173,282 | ) | (5,665,112 | ) | (58,430,254 | ) | ||||||||
| (75,911 | ) | (1,101,560) | (68,126 | ) | (772,339 | ) | 12,708,626 | 127,998,752 | (3,246,428 | ) | (32,924,283 | ) | ||||||||||
| 47,403 | 761,942 | 2,880 | 27,449 | 1,092 | 12,500 | 553 | 5,995 | |||||||||||||||
| — | — | — | — | 1 | 4 | — | — | |||||||||||||||
| (2,545 | ) | (41,303) | (1,987 | ) | (18,976 | ) | — | — | (2,003 | ) | (20,376 | ) | ||||||||||
| 44,858 | 720,639 | 893 | 8,473 | 1,093 | 12,504 | (1,450 | ) | (14,381 | ) | |||||||||||||
| 13,951,762 | $224,897,971 | (1,427,829 | ) | $(14,201,284 | ) | 22,768,383 | $237,014,333 | (3,587,640 | ) | $(36,547,345 | ) | |||||||||||
| 10. SUMMARY OF SHARE TRANSACTIONS (continued)
|
| Share activity for the year ended January 31, 1999, is as follows:
|
| CORE U.S. Equity Fund |
||||||
|---|---|---|---|---|---|---|
| Shares | Dollars | |||||
| |
||||||
| Class A Shares | ||||||
| Shares sold | 8,753,952 | $ 259,032,390 | ||||
| Reinvestment of dividends and distributions | 381,760 | 11,200,848 | ||||
| Shares repurchased | (5,761,134 | ) | (166,304,148 | ) | ||
| |
||||||
| 3,374,578 | 103,929,090 | |||||
| |
||||||
| Class B Shares | ||||||
| Shares sold | 2,857,310 | 83,492,448 | ||||
| Reinvestment of dividends and distributions | 83,374 | 2,414,741 | ||||
| Shares repurchased | (501,968 | ) | (14,454,259 | ) | ||
| |
||||||
| 2,438,716 | 71,452,930 | |||||
| |
||||||
| Class C Shares | ||||||
| Shares sold | 670,600 | 19,394,950 | ||||
| Reinvestment of dividends and distributions | 13,055 | 377,761 | ||||
| Shares repurchased | (91,806 | ) | (2,614,971 | ) | ||
| |
||||||
| 591,849 | 17,157,740 | |||||
| |
||||||
| Institutional Shares | ||||||
| Shares sold | 3,495,701 | 106,922,172 | ||||
| Reinvestment of dividends and distributions | 252,278 | 7,502,432 | ||||
| Shares repurchased | (2,092,487 | ) | (62,588,379 | ) | ||
| |
||||||
| 1,655,492 | 51,836,225 | |||||
| |
||||||
| Service Shares | ||||||
| Shares sold | 138,492 | 4,090,580 | ||||
| Reinvestment of dividends and distributions | 8,981 | 263,345 | ||||
| Shares repurchased | (89,923 | ) | (2,681,502 | ) | ||
| |
||||||
| 57,550 | 1,672,423 | |||||
| |
||||||
| NET INCREASE | 8,118,185 | $ 246,048,408 | ||||
| |
||||||
(a)
|
Commencement date of operations was December 31, 1998 for all share classes.
|
| CORE Large Cap Growth Fund | CORE Small Cap Equity Fund | CORE Large Cap Value Fund (a) | CORE International Equity Fund | |||||||||||||||||||
|---|---|---|---|---|---|---|---|---|---|---|---|---|---|---|---|---|---|---|---|---|---|---|
| Shares | Dollars | Shares | Dollars | Shares | Dollars | Shares | Dollars | |||||||||||||||
| 8,392,008 | $114,907,937 | 6,683,657 | $ 62,993,476 | 659,370 | $ 6,646,109 | 16,982,750 | $159,894,304 | |||||||||||||||
| 775 | 9,734 | 5,387 | 51,508 | — | — | 25,532 | 247,660 | |||||||||||||||
| (2,029,343 | ) | (26,663,301) | (1,432,586 | ) | (14,382,982 | ) | (3,045 | ) | (30,471 | ) | (6,723,268 | ) | (65,336,060 | ) | ||||||||
| 6,363,440 | 88,254,370 | 5,256,458 | 48,662,002 | 656,325 | 6,615,638 | 10,285,014 | 94,805,904 | |||||||||||||||
| 5,276,877 | 72,837,485 | 828,354 | 8,824,797 | 33,500 | 341,048 | 515,393 | 5,051,846 | |||||||||||||||
| 1,075 | 13,374 | — | — | — | — | — | — | |||||||||||||||
| (577,338 | ) | (7,608,153) | (241,316 | ) | (2,380,103 | ) | — | — | (67,362 | ) | (640,971 | ) | ||||||||||
| 4,700,614 | 65,242,706 | 587,038 | 6,444,694 | 33,500 | 341,048 | 448,031 | 4,410,875 | |||||||||||||||
| 2,156,694 | 29,856,923 | 565,318 | 5,743,510 | 26,441 | 266,200 | 308,917 | 2,996,602 | |||||||||||||||
| 93 | 1,154 | — | — | — | — | — | — | |||||||||||||||
| (183,652 | ) | (2,472,936) | (156,900 | ) | (1,557,935 | ) | — | — | (107,735 | ) | (1,051,525 | ) | ||||||||||
| 1,973,135 | 27,385,141 | 408,418 | 4,185,575 | 26,441 | 266,200 | 201,182 | 1,945,077 | |||||||||||||||
| 19,639,867 | 283,752,115 | 7,133,876 | 75,923,060 | 5,393,552 | 54,931,857 | 30,484,309 | 302,474,224 | |||||||||||||||
| 2,288 | 32,678 | 2,982 | 28,592 | — | — | 4,168 | 40,723 | |||||||||||||||
| (1,788,450 | ) | (24,482,623) | (1,837,364 | ) | (18,190,952 | ) | (136,723 | ) | (1,380,706 | ) | (4,511,270 | ) | (44,208,971 | ) | ||||||||
| 17,853,705 | 259,302,170 | 5,299,494 | 57,760,700 | 5,256,829 | 53,551,151 | 25,977,207 | 258,305,976 | |||||||||||||||
| 105,509 | 1,439,054 | 5,527 | 59,019 | 160 | 1,600 | 2,004 | 20,035 | |||||||||||||||
| 21 | 292 | 2 | 20 | — | — | — | — | |||||||||||||||
| (11,909 | ) | (153,375) | (339 | ) | (3,405 | ) | — | — | — | — | ||||||||||||
| 93,621 | 1,285,971 | 5,190 | 55,634 | 160 | 1,600 | 2,004 | 20,035 | |||||||||||||||
| 30,984,515 | $441,470,358 | 11,556,598 | $117,108,605 | 5,973,255 | $60,775,637 | 36,913,438 | $359,487,867 | |||||||||||||||
| Income from
investment |
Distributions to shareholders |
|||||||||||||||||||||
|---|---|---|---|---|---|---|---|---|---|---|---|---|---|---|---|---|---|---|---|---|---|---|
| Net asset
value, beginning of period |
Net
investment income (loss) |
Net realized
and unrealized gain |
Total from
investment operations |
From net
investment income |
In excess
of net investment income |
From net
realized gains |
Total
distributions |
|||||||||||||||
| FOR THE YEAR ENDED AUGUST 31, | ||||||||||||||||||||||
| 2000 – Class A Shares | $34.21 | $ 0.10 | (c) | $6.00 | $6.10 | $ — | $ — | $(3.54 | ) | $(3.54 | ) | |||||||||||
| 2000 – Class B Shares | 33.56 | (0.14) | (c) | 5.83 | 5.69 | — | — | (3.54 | ) | (3.54 | ) | |||||||||||
| 2000 – Class C Shares | 33.46 | (0.13) | (c) | 5.80 | 5.67 | — | — | (3.54 | ) | (3.54 | ) | |||||||||||
| 2000 – Institutional Shares | 34.61 | 0.24 | (c) | 6.07 | 6.31 | (0.08 | ) | — | (3.54 | ) | (3.62 | ) | ||||||||||
| 2000 – Service Shares | 34.05 | 0.07 | (c) | 5.96 | 6.03 | — | — | (3.54 | ) | (3.54 | ) | |||||||||||
| FOR THE SEVEN-MONTH PERIOD ENDED AUGUST 31, | ||||||||||||||||||||||
| 1999 – Class A Shares | 32.98 | 0.03 | 1.20 | 1.23 | — | — | — | — | ||||||||||||||
| 1999 – Class B Shares | 32.50 | (0.11 | ) | 1.17 | 1.06 | — | — | — | — | |||||||||||||
| 1999 – Class C Shares | 32.40 | (0.10 | ) | 1.16 | 1.06 | — | — | — | — | |||||||||||||
| 1999 – Institutional Shares | 33.29 | 0.11 | 1.21 | 1.32 | — | — | — | — | ||||||||||||||
| 1999 – Service Shares | 32.85 | 0.01 | 1.19 | 1.20 | — | — | — | — | ||||||||||||||
| FOR THE YEARS ENDED JANUARY 31, | ||||||||||||||||||||||
| 1999 – Class A Shares | 26.59 | 0.04 | 7.02 | 7.06 | (0.03 | ) | (0.01 | ) | (0.63 | ) | (0.67 | ) | ||||||||||
| 1999 – Class B Shares | 26.32 | (0.10 | ) | 6.91 | 6.81 | — | — | (0.63 | ) | (0.63 | ) | |||||||||||
| 1999 – Class C Shares | 26.24 | (0.10 | ) | 6.89 | 6.79 | — | — | (0.63 | ) | (0.63 | ) | |||||||||||
| 1999 – Institutional Shares | 26.79 | 0.20 | 7.11 | 7.31 | (0.15 | ) | (0.03 | ) | (0.63 | ) | (0.81 | ) | ||||||||||
| 1999 – Service Shares | 26.53 | 0.06 | 7.01 | 7.07 | (0.10 | ) | (0.02 | ) | (0.63 | ) | (0.75 | ) | ||||||||||
| 1998 – Class A Shares | 23.32 | 0.11 | 5.63 | 5.74 | (0.12 | ) | — | (2.35 | ) | (2.47 | ) | |||||||||||
| 1998 – Class B Shares | 23.18 | 0.11 | 5.44 | 5.55 | — | (0.06 | ) | (2.35 | ) | (2.41 | ) | |||||||||||
| 1998 – Class C Shares (commenced August 15, 1997) | 27.48 | 0.03 | 1.22 | 1.25 | — | (0.14 | ) | (2.35 | ) | (2.49 | ) | |||||||||||
| 1998 – Institutional Shares | 23.44 | 0.30 | 5.65 | 5.95 | (0.24 | ) | (0.01 | ) | (2.35 | ) | (2.60 | ) | ||||||||||
| 1998 – Service Shares | 23.27 | 0.19 | 5.57 | 5.76 | (0.07 | ) | (0.08 | ) | (2.35 | ) | (2.50 | ) | ||||||||||
| 1997 – Class A Shares | 19.66 | 0.16 | 4.46 | 4.62 | (0.16 | ) | — | (0.80 | ) | (0.96 | ) | |||||||||||
| 1997 – Class B Shares (commenced May 1, 1996) | 20.44 | 0.04 | 3.70 | 3.74 | (0.04 | ) | (0.16 | ) | (0.80 | ) | (1.00 | ) | ||||||||||
| 1997 – Institutional Shares | 19.71 | 0.30 | 4.51 | 4.81 | (0.28 | ) | — | (0.80 | ) | (1.08 | ) | |||||||||||
| 1997 – Service Shares (commenced June 7, 1996) | 21.02 | 0.13 | 3.15 | 3.28 | (0.13 | ) | (0.10 | ) | (0.80 | ) | (1.03 | ) | ||||||||||
| 1996 – Class A Shares | 14.61 | 0.19 | 5.43 | 5.62 | (0.16 | ) | — | (0.41 | ) | (0.57 | ) | |||||||||||
| 1996 – Institutional Shares (commenced June 15, 1995) | 16.97 | 0.16 | 3.23 | 3.39 | (0.24 | ) | — | (0.41 | ) | (0.65 | ) | |||||||||||
(a)
|
Assumes investment at the net asset value at the beginning of the period, reinvestment of all dividends and distributions, a
complete redemption of the investment at the net asset value at the end of the period and no sales or redemption charges. Total return would be reduced if a sales or redemption charge were taken into account. Total returns for periods less than one full
year are not annualized.
|
(b)
|
Annualized.
|
(c)
|
Calculated based on the average shares outstanding methodology.
|
|
Ratios assuming no expense reductions |
|||||||||||||||||||||
|---|---|---|---|---|---|---|---|---|---|---|---|---|---|---|---|---|---|---|---|---|---|
| Net asset
value, end of period |
Total
return (a) |
Net assets
at end of period (in 000s) |
Ratio of
net expenses to average net assets |
Ratio of
net investment income (loss) to average net assets |
Ratio of
expenses to average net assets |
Ratio of
net investment income (loss) to average net assets |
Portfolio
turnover rate |
||||||||||||||
| $36.77 | 18.96 | % | $715,775 | 1.14 | % | 0.31 | % | 1.23 | % | 0.22 | % | 59.27 | % | ||||||||
| 35.71 | 18.03 | 275,673 | 1.89 | (0.44 | ) | 1.98 | (0.53 | ) | 59.27 | ||||||||||||
| 35.59 | 18.03 | 62,820 | 1.89 | (0.43 | ) | 1.98 | (0.52 | ) | 59.27 | ||||||||||||
| 37.30 | 19.41 | 379,172 | 0.74 | 0.71 | 0.83 | 0.62 | 59.27 | ||||||||||||||
| 36.54 | 18.83 | 11,879 | 1.24 | 0.19 | 1.33 | 0.10 | 59.27 | ||||||||||||||
| 34.21 | 3.73 | 614,310 | 1.14 | (b) | 0.15 | (b) | 1.24 | (b) | 0.05 | (b) | 41.84 | ||||||||||
| 33.56 | 3.26 | 214,087 | 1.89 | (b) | (0.60 | ) (b) | 1.99 | (b) | (0.70 | ) (b) | 41.84 | ||||||||||
| 33.46 | 3.27 | 43,361 | 1.89 | (b) | (0.61 | ) (b) | 1.99 | (b) | (0.71 | ) (b) | 41.84 | ||||||||||
| 34.61 | 3.97 | 335,465 | 0.74 | (b) | 0.54 | (b) | 0.84 | (b) | 0.44 | (b) | 41.84 | ||||||||||
| 34.05 | 3.65 | 11,204 | 1.24 | (b) | 0.06 | (b) | 1.34 | (b) | (0.04 | ) (b) | 41.84 | ||||||||||
| 32.98 | 26.89 | 605,566 | 1.23 | 0.15 | 1.36 | 0.02 | 63.79 | ||||||||||||||
| 32.50 | 26.19 | 152,347 | 1.85 | (0.50 | ) | 1.98 | (0.63 | ) | 63.79 | ||||||||||||
| 32.40 | 26.19 | 26,912 | 1.87 | (0.53 | ) | 2.00 | (0.66 | ) | 63.79 | ||||||||||||
| 33.29 | 27.65 | 307,200 | 0.69 | 0.69 | 0.82 | 0.56 | 63.79 | ||||||||||||||
| 32.85 | 27.00 | 11,600 | 1.19 | 0.19 | 1.32 | 0.06 | 63.79 | ||||||||||||||
| 26.59 | 24.96 | 398,393 | 1.28 | 0.51 | 1.47 | 0.32 | 65.89 | ||||||||||||||
| 26.32 | 24.28 | 59,208 | 1.79 | (0.05 | ) | 1.96 | (0.22 | ) | 65.89 | ||||||||||||
| 26.24 | 4.85 | 6,267 | 1.78 | (b) | (0.21 | ) (b) | 1.95 | (b) | (0.38 | ) (b) | 65.89 | ||||||||||
| 26.79 | 25.76 | 202,893 | 0.65 | 1.16 | 0.82 | 0.99 | 65.89 | ||||||||||||||
| 26.53 | 25.11 | 7,841 | 1.15 | 0.62 | 1.32 | 0.45 | 65.89 | ||||||||||||||
| 23.32 | 23.75 | 225,968 | 1.29 | 0.91 | 1.53 | 0.67 | 37.28 | ||||||||||||||
| 23.18 | 18.59 | 17,258 | 1.83 | (b) | 0.06 | (b) | 2.00 | (b) | (0.11 | ) (b) | 37.28 | ||||||||||
| 23.44 | 24.63 | 148,942 | 0.65 | 1.52 | 0.85 | 1.32 | 37.28 | ||||||||||||||
| 23.27 | 15.92 | 3,666 | 1.15 | (b) | 0.69 | (b) | 1.35 | (b) | 0.49 | (b) | 37.28 | ||||||||||
| 19.66 | 38.63 | 129,045 | 1.25 | 1.01 | 1.55 | 0.71 | 39.35 | ||||||||||||||
| 19.71 | 20.14 | 64,829 | 0.65 | (b) | 1.49 | (b) | 0.96 | (b) | 1.18 | (b) | 39.35 | ||||||||||
| Income from
investment |
Distributions to shareholders |
||||||||||||||||||||||||
|---|---|---|---|---|---|---|---|---|---|---|---|---|---|---|---|---|---|---|---|---|---|---|---|---|---|
| Net asset
value, beginning of period |
Net
investment income (loss) |
Net realized
and unrealized gain |
Total from
investment operations |
From net
investment income |
In excess
of net investment income |
From
net realized gains |
Total
distributions |
||||||||||||||||||
| FOR THE YEAR ENDED AUGUST 31, | |||||||||||||||||||||||||
| 2000 – Class A Shares | $17.02 | $ 0.06 | (c) | $5.67 | $5.73 | $ — | $ — | $(0.09 | ) | $(0.09 | ) | ||||||||||||||
| 2000 – Class B Shares | 16.75 | (0.09 | ) (c) | 5.57 | 5.48 | — | — | (0.09 | ) | (0.09 | ) | ||||||||||||||
| 2000 – Class C Shares | 16.75 | (0.08 | ) (c) | 5.57 | 5.49 | — | — | (0.09 | ) | (0.09 | ) | ||||||||||||||
| 2000 – Institutional Shares | 17.10 | 0.13 | (c) | 5.73 | 5.86 | — | — | (0.09 | ) | (0.09 | ) | ||||||||||||||
| 2000 – Service Shares | 16.95 | 0.03 | (c) | 5.66 | 5.69 | — | — | (0.09 | ) | (0.09 | ) | ||||||||||||||
| FOR THE SEVEN-MONTH PERIOD ENDED AUGUST 31, | |||||||||||||||||||||||||
| 1999 – Class A Shares | 16.17 | (0.01 | ) | 0.86 | 0.85 | — | — | — | — | ||||||||||||||||
| 1999 – Class B Shares | 15.98 | (0.07 | ) | 0.84 | 0.77 | — | — | — | — | ||||||||||||||||
| 1999 – Class C Shares | 15.99 | (0.07 | ) | 0.83 | 0.76 | — | — | — | — | ||||||||||||||||
| 1999 – Institutional Shares | 16.21 | 0.03 | 0.86 | 0.89 | — | — | — | — | |||||||||||||||||
| 1999 – Service Shares | 16.11 | (0.02 | ) | 0.86 | 0.84 | — | — | — | — | ||||||||||||||||
| FOR THE YEAR ENDED JANUARY 31, | |||||||||||||||||||||||||
| 1999 – Class A Shares | 11.97 | 0.01 | 4.19 | 4.20 | — | — | — | — | |||||||||||||||||
| 1999 – Class B Shares | 11.92 | (0.06 | ) | 4.12 | 4.06 | — | — | — | — | ||||||||||||||||
| 1999 – Class C Shares | 11.93 | (0.05 | ) | 4.11 | 4.06 | — | — | — | — | ||||||||||||||||
| 1999 – Institutional Shares | 11.97 | 0.02 | 4.23 | 4.25 | — | (0.01 | ) | — | (0.01 | ) | |||||||||||||||
| 1999 – Service Shares | 11.95 | (0.01 | ) | 4.17 | 4.16 | — | — | — | — | ||||||||||||||||
| FOR THE PERIOD ENDED JANUARY 31, | |||||||||||||||||||||||||
| 1998 – Class A Shares (commenced May 1, 1997) | 10.00 | 0.01 | 2.35 | 2.36 | (0.01 | ) | — | (0.38 | ) | (0.39 | ) | ||||||||||||||
| 1998 – Class B Shares (commenced May 1, 1997) | 10.00 | (0.03 | ) | 2.33 | 2.30 | — | — | (0.38 | ) | (0.38 | ) | ||||||||||||||
| 1998 – Class C Shares (commenced August 15, 1997) | 11.80 | (0.02 | ) | 0.54 | 0.52 | — | (0.01 | ) | (0.38 | ) | (0.39 | ) | |||||||||||||
| 1998 – Institutional Shares (commenced May 1, 1997) | 10.00 | 0.01 | 2.35 | 2.36 | (0.01 | ) | — | (0.38 | ) | (0.39 | ) | ||||||||||||||
| 1998 – Service Shares (commenced May 1, 1997) | 10.00 | (0.02 | ) | 2.35 | 2.33 | — | — | (0.38 | ) | (0.38 | ) | ||||||||||||||
(a)
|
Assumes investment at the net asset value at the beginning of the period, reinvestment of all dividends and distributions, a
complete redemption of the investment at the net asset value at the end of the period and no sales or redemption charges. Total return would be reduced if a sales or redemption charge were taken into account. Total returns for periods less than one full
year are not annualized.
|
(b)
|
Annualized.
|
(c)
|
Calculated based on the average shares outstanding methodology.
|
|
Ratios assuming no expense reductions |
|||||||||||||||||||||
|---|---|---|---|---|---|---|---|---|---|---|---|---|---|---|---|---|---|---|---|---|---|
| Net asset
value, end of period |
Total
return (a) |
Net assets
at end of period (in 000s) |
Ratio of
net expenses to average net assets |
Ratio of
net investment income (loss) to average net assets |
Ratio of
expenses to average net assets |
Ratio of
net investment income (loss) to average net assets |
Portfolio
turnover rate |
||||||||||||||
| $22.66 | 33.73 | % | $545,763 | 1.09 | % | 0.31 | % | 1.24 | % | 0.16 | % | 72.59 | % | ||||||||
| 22.14 | 32.78 | 338,128 | 1.84 | (0.44 | ) | 1.99 | (0.59 | ) | 72.59 | ||||||||||||
| 22.15 | 32.84 | 154,966 | 1.84 | (0.43 | ) | 1.99 | (0.58 | ) | 72.59 | ||||||||||||
| 22.87 | 34.34 | 322,900 | 0.69 | 0.65 | 0.84 | 0.50 | 72.59 | ||||||||||||||
| 22.55 | 33.64 | 3,879 | 1.19 | 0.15 | 1.34 | — | 72.59 | ||||||||||||||
| 17.02 | 5.26 | 300,684 | 1.04 | (b) | (0.11 | ) (b) | 1.26 | (b) | (0.33 | ) (b) | 32.74 | ||||||||||
| 16.75 | 4.82 | 181,626 | 1.79 | (b) | (0.87 | ) (b) | 2.01 | (b) | (1.09 | ) (b) | 32.74 | ||||||||||
| 16.75 | 4.75 | 75,502 | 1.79 | (b) | (0.87 | ) (b) | 2.01 | (b) | (1.09 | ) (b) | 32.74 | ||||||||||
| 17.10 | 5.49 | 310,704 | 0.64 | (b) | 0.31 | (b) | 0.86 | (b) | 0.09 | (b) | 32.74 | ||||||||||
| 16.95 | 5.21 | 2,510 | 1.14 | (b) | (0.21 | ) (b) | 1.36 | (b) | (0.43 | ) (b) | 32.74 | ||||||||||
| 16.17 | 35.10 | 175,510 | 0.97 | 0.05 | 1.46 | (0.44 | ) | 63.15 | |||||||||||||
| 15.98 | 34.07 | 93,711 | 1.74 | (0.73 | ) | 2.11 | (1.10 | ) | 63.15 | ||||||||||||
| 15.99 | 34.04 | 37,081 | 1.74 | (0.74 | ) | 2.11 | (1.11 | ) | 63.15 | ||||||||||||
| 16.21 | 35.54 | 295,734 | 0.65 | 0.35 | 1.02 | (0.02 | ) | 63.15 | |||||||||||||
| 16.11 | 34.85 | 1,663 | 1.15 | (0.16 | ) | 1.52 | (0.53 | ) | 63.15 | ||||||||||||
| 11.97 | 23.79 | 53,786 | 0.91 | (b) | 0.12 | (b) | 2.40 | (b) | (1.37 | ) (b) | 74.97 | ||||||||||
| 11.92 | 23.26 | 13,857 | 1.67 | (b) | (0.72 | ) (b) | 2.91 | (b) | (1.96 | ) (b) | 74.97 | ||||||||||
| 11.93 | 4.56 | 4,132 | 1.68 | (b) | (0.76 | ) (b) | 2.92 | (b) | (2.00 | ) (b) | 74.97 | ||||||||||
| 11.97 | 23.89 | 4,656 | 0.72 | (b) | 0.42 | (b) | 1.96 | (b) | (0.82 | ) (b) | 74.97 | ||||||||||
| 11.95 | 23.56 | 115 | 1.17 | (b) | (0.21 | ) (b) | 2.41 | (b) | (1.45 | ) (b) | 74.97 | ||||||||||
| Income from investment |
Distributions to shareholders |
|||||||||||||||||||
|---|---|---|---|---|---|---|---|---|---|---|---|---|---|---|---|---|---|---|---|---|
| Net asset
value, beginning of period |
Net
investment income (loss) |
Net realized
and unrealized gain (loss) |
Total from
investment operations |
From net
investment income |
From net
realized gains |
Total
distributions |
||||||||||||||
| FOR THE YEAR ENDED AUGUST 31, | ||||||||||||||||||||
| 2000 – Class A Shares | $10.23 | $(0.03 | ) (c) | $2.70 | $2.67 | $ — | $ — | $ — | ||||||||||||
| 2000 – Class B Shares | 10.09 | (0.11 | ) (c) | 2.65 | 2.54 | — | — | — | ||||||||||||
| 2000 – Class C Shares | 10.10 | (0.10 | ) (c) | 2.66 | 2.56 | — | — | — | ||||||||||||
| 2000 – Institutional Shares | 10.30 | 0.02 | (c) | 2.71 | 2.73 | — | — | — | ||||||||||||
| 2000 – Service Shares | 10.22 | (0.04 | ) (c) | 2.69 | 2.65 | — | — | — | ||||||||||||
| FOR THE SEVEN-MONTH PERIOD ENDED AUGUST 31, | ||||||||||||||||||||
| 1999 – Class A Shares | 10.16 | (0.01 | ) | 0.08 | 0.07 | — | — | — | ||||||||||||
| 1999 – Class B Shares | 10.07 | (0.05 | ) | 0.07 | 0.02 | — | — | — | ||||||||||||
| 1999 – Class C Shares | 10.08 | (0.05 | ) | 0.07 | 0.02 | — | — | — | ||||||||||||
| 1999 – Institutional Shares | 10.20 | 0.02 | 0.08 | 0.10 | — | — | — | |||||||||||||
| 1999 – Service Shares | 10.16 | (0.01 | ) | 0.07 | 0.06 | — | — | — | ||||||||||||
| FOR THE YEAR ENDED JANUARY 31, | ||||||||||||||||||||
| 1999 – Class A Shares | 10.59 | 0.01 | (0.43 | ) | (0.42 | ) | (0.01) | — | (0.01 | ) | ||||||||||
| 1999 – Class B Shares | 10.56 | (0.05 | ) | (0.44 | ) | (0.49 | ) | — | — | — | ||||||||||
| 1999 – Class C Shares | 10.57 | (0.04 | ) | (0.45 | ) | (0.49 | ) | — | — | — | ||||||||||
| 1999 – Institutional Shares | 10.61 | 0.04 | (0.43 | ) | (0.39 | ) | (0.02) | — | (0.02 | ) | ||||||||||
| 1999 – Service Shares | 10.60 | 0.01 | (0.44 | ) | (0.43 | ) | (0.01) | — | (0.01 | ) | ||||||||||
| FOR THE PERIOD ENDED JANUARY 31, | ||||||||||||||||||||
| 1998 – Class A Shares (commenced August 15, 1997) | 10.00 | (0.01 | ) | 0.65 | 0.64 | — | (0.05 | ) | (0.05 | ) | ||||||||||
| 1998 – Class B Shares (commenced August 15, 1997) | 10.00 | (0.03 | ) | 0.64 | 0.61 | — | (0.05 | ) | (0.05 | ) | ||||||||||
| 1998 – Class C Shares (commenced August 15, 1997) | 10.00 | (0.02 | ) | 0.64 | 0.62 | — | (0.05 | ) | (0.05 | ) | ||||||||||
| 1998 – Institutional Shares (commenced August 15, 1997) | 10.00 | 0.01 | 0.65 | 0.66 | — | (0.05 | ) | (0.05 | ) | |||||||||||
| 1998 – Service Shares (commenced August 15, 1997) | 10.00 | 0.01 | 0.64 | 0.65 | — | (0.05 | ) | (0.05 | ) | |||||||||||
| |
||||||||||||||||||||
(a)
|
Assumes investment at the net asset value at the beginning of the period, reinvestment of all dividends and distributions, a
complete redemption of the investment at the net asset value at the end of the period and no sales or redemption charges. Total return would be reduced if a sales or redemption charge were taken into account. Total returns for periods less than one full
year are not annualized.
|
(b)
|
Annualized.
|
(c)
|
Calculated based on the average shares outstanding methodology.
|
| Ratios assuming no expense reductions |
|||||||||||||||||||||
|---|---|---|---|---|---|---|---|---|---|---|---|---|---|---|---|---|---|---|---|---|---|
| Net asset
value, end of period |
Total
return (a) |
Net assets
at end of period (in 000s) |
Ratio of
net expenses to average net assets |
Ratio of
net investment income (loss) to average net assets |
Ratio of
expenses to average net assets |
Ratio of
net investment loss to average net assets |
Portfolio
turnover rate |
||||||||||||||
| $12.90 | 26.10 | % | $54,954 | 1.33 | % | (0.21 | )% | 1.55 | % | (0.43 | ) | 135.36 | % | ||||||||
| 12.63 | 25.17 | 17,923 | 2.08 | (0.96 | ) | 2.30 | (1.18 | ) | 135.36 | ||||||||||||
| 12.66 | 25.35 | 8,289 | 2.08 | (0.96 | ) | 2.30 | (1.18 | ) | 135.36 | ||||||||||||
| 13.03 | 26.60 | 86,196 | 0.93 | 0.19 | 1.15 | (0.03 | ) | 135.36 | |||||||||||||
| 12.87 | 25.93 | 63 | 1.43 | (0.30 | ) | 1.65 | (0.52 | ) | 135.36 | ||||||||||||
| 10.23 | 0.69 | 52,660 | 1.33 | (b) | (0.12 | ) (b) | 1.67 | (b) | (0.46 | ) (b) | 52.03 | ||||||||||
| 10.09 | 0.20 | 13,711 | 2.08 | (b) | (0.86 | ) (b) | 2.42 | (b) | (1.20 | ) (b) | 52.03 | ||||||||||
| 10.10 | 0.20 | 6,274 | 2.08 | (b) | (0.86 | ) (b) | 2.42 | (b) | (1.20 | ) (b) | 52.03 | ||||||||||
| 10.30 | 0.98 | 62,633 | 0.93 | (b) | 0.28 | (b) | 1.27 | (b) | (0.06 | ) (b) | 52.03 | ||||||||||
| 10.22 | 0.59 | 64 | 1.43 | (b) | (0.22 | ) (b) | 1.77 | (b) | (0.56 | ) (b) | 52.03 | ||||||||||
| 10.16 | (3.97 | ) | 64,087 | 1.31 | 0.08 | 2.00 | (0.61 | ) | 75.38 | ||||||||||||
| 10.07 | (4.64 | ) | 15,406 | 2.00 | (0.55 | ) | 2.62 | (1.17 | ) | 75.38 | |||||||||||
| 10.08 | (4.64 | ) | 6,559 | 2.01 | (0.56 | ) | 2.63 | (1.18 | ) | 75.38 | |||||||||||
| 10.20 | (3.64 | ) | 62,763 | 0.94 | 0.60 | 1.56 | (0.02 | ) | 75.38 | ||||||||||||
| 10.16 | (4.07 | ) | 54 | 1.44 | 0.01 | 2.06 | (0.61 | ) | 75.38 | ||||||||||||
| 10.59 | 6.37 | 11,118 | 1.25 | (b) | (0.36 | ) (b) | 3.92 | (b) | (3.03 | ) (b) | 37.65 | ||||||||||
| 10.56 | 6.07 | 9,957 | 1.95 | (b) | (1.04 | ) (b) | 4.37 | (b) | (3.46 | ) (b) | 37.65 | ||||||||||
| 10.57 | 6.17 | 2,557 | 1.95 | (b) | (1.07 | ) (b) | 4.37 | (b) | (3.49 | ) (b) | 37.65 | ||||||||||
| 10.61 | 6.57 | 9,026 | 0.95 | (b) | 0.15 | (b) | 3.37 | (b) | (2.27 | ) (b) | 37.65 | ||||||||||
| 10.60 | 6.47 | 2 | 1.45 | (b) | 0.40 | (b) | 3.87 | (b) | (2.02 | ) (b) | 37.65 | ||||||||||
| Income from
investment |
Distributions to
shareholders |
||||||||||||||||||
|---|---|---|---|---|---|---|---|---|---|---|---|---|---|---|---|---|---|---|---|
| Net asset
value, beginning of period |
Net
investment income |
Net realized
and unrealized gain |
Total from
investment operations |
From net
investment income |
From net
realized gains |
Total
distributions |
|||||||||||||
| FOR THE YEAR ENDED AUGUST 31, | |||||||||||||||||||
| 2000 – Class A Shares | $10.55 | $0.12 | (c) | $0.36 | $0.48 | $(0.10 | ) | $(0.12 | ) | $(0.22 | ) | ||||||||
| 2000 – Class B Shares | 10.50 | 0.05 | (c) | 0.36 | 0.41 | (0.04 | ) | (0.12 | ) | (0.16 | ) | ||||||||
| 2000 – Class C Shares | 10.51 | 0.04 | (c) | 0.37 | 0.41 | (0.04 | ) | (0.12 | ) | (0.16 | ) | ||||||||
| 2000 – Institutional Shares | 10.55 | 0.16 | (c) | 0.37 | 0.53 | (0.14 | ) | (0.12 | ) | (0.26 | ) | ||||||||
| 2000 – Service Shares | 10.55 | 0.11 | (c) | 0.36 | 0.47 | (0.09 | ) | (0.12 | ) | (0.21 | ) | ||||||||
| FOR THE SEVEN-MONTH PERIOD ENDED AUGUST 31, | |||||||||||||||||||
| 1999 – Class A Shares | 10.15 | 0.04 | 0.40 | 0.44 | (0.04 | ) | — | (0.04 | ) | ||||||||||
| 1999 – Class B Shares | 10.15 | 0.01 | 0.36 | 0.37 | (0.02 | ) | — | (0.02 | ) | ||||||||||
| 1999 – Class C Shares | 10.15 | 0.01 | 0.37 | 0.38 | (0.02 | ) | — | (0.02 | ) | ||||||||||
| 1999 – Institutional Shares | 10.16 | 0.06 | 0.38 | 0.44 | (0.05 | ) | — | (0.05 | ) | ||||||||||
| 1999 – Service Shares | 10.16 | 0.02 | 0.40 | 0.42 | (0.03 | ) | — | (0.03 | ) | ||||||||||
| FOR THE PERIOD ENDED JANUARY 31, | |||||||||||||||||||
| 1999 – Class A Shares (commenced December 31, 1998) | 10.00 | 0.01 | 0.14 | 0.15 | — | — | — | ||||||||||||
| 1999 – Class B Shares (commenced December 31, 1998) | 10.00 | — | 0.15 | 0.15 | — | — | — | ||||||||||||
| 1999 – Class C Shares (commenced December 31, 1998) | 10.00 | — | 0.15 | 0.15 | — | — | — | ||||||||||||
| 1999 – Institutional Shares (commenced December 31, 1998) | 10.00 | 0.01 | 0.15 | 0.16 | — | — | — | ||||||||||||
| 1999 – Service Shares (commenced December 31, 1998) | 10.00 | 0.02 | 0.14 | 0.16 | — | — | — | ||||||||||||
(a)
|
Assumes investment at the net asset value at the beginning of the period, reinvestment of all dividends and distributions, a
complete redemption of the investment at the net asset value at the end of the period and no sales or redemption charges. Total return would be reduced if a sales or redemption charge were taken into account. Total returns for periods less than one full
year are not annualized.
|
(b)
|
Annualized.
|
(c)
|
Calculated based on the average shares outstanding methodology.
|
|
Ratios assuming no expense reductions |
||||||||||||||||||||
|---|---|---|---|---|---|---|---|---|---|---|---|---|---|---|---|---|---|---|---|---|
| Net asset
value, end of period |
Total
return (a) |
Net assets
at end of period (in 000s) |
Ratio of
net expenses to average net assets |
Ratio of
net investment income to average net assets |
Ratio of
expenses to average net assets |
Ratio of
net investment income (loss) to average net assets |
Portfolio
turnover rate |
|||||||||||||
| $10.81 | 4.68 | % | $100,972 | 1.06% | 1.14 | % | 1.17 | % | 1.03 | % | 83.30 | % | ||||||||
| 10.75 | 3.96 | 19,069 | 1.81 | 0.44 | 1.92 | 0.33 | 83.30 | |||||||||||||
| 10.76 | 3.97 | 11,178 | 1.81 | 0.45 | 1.92 | 0.34 | 83.30 | |||||||||||||
| 10.82 | 5.20 | 175,493 | 0.66 | 1.54 | 0.77 | 1.43 | 83.30 | |||||||||||||
| 10.81 | 4.60 | 12 | 1.16 | 1.07 | 1.27 | 0.96 | 83.30 | |||||||||||||
| 10.55 | 4.31 | 91,072 | 1.04 (b) | 0.87 | (b) | 1.21 | (b) | 0.70 | (b) | 36.10 | ||||||||||
| 10.50 | 3.68 | 14,464 | 1.79 (b) | 0.05 | (b) | 1.96 | (b) | (0.12 | ) (b) | 36.10 | ||||||||||
| 10.51 | 3.73 | 8,032 | 1.79 (b) | 0.09 | (b) | 1.96 | (b) | (0.08 | ) (b) | 36.10 | ||||||||||
| 10.55 | 4.35 | 189,540 | 0.64 (b) | 1.29 | (b) | 0.81 | (b) | 1.12 | (b) | 36.10 | ||||||||||
| 10.55 | 4.11 | 13 | 1.14 (b) | 0.72 | (b) | 1.31 | (b) | 0.55 | (b) | 36.10 | ||||||||||
| 10.15 | 1.50 | 6,665 | 1.08 (b) | 1.45 | (b) | 8.03 | (b) | (5.50 | ) (b) | 0.00 | ||||||||||
| 10.15 | 1.50 | 340 | 1.82 (b) | 0.84 | (b) | 8.77 | (b) | (6.11 | ) (b) | 0.00 | ||||||||||
| 10.15 | 1.50 | 268 | 1.83 (b) | 0.70 | (b) | 8.78 | (b) | (6.25 | ) (b) | 0.00 | ||||||||||
| 10.16 | 1.60 | 53,396 | 0.66 (b) | 1.97 | (b) | 7.61 | (b) | (4.98 | ) (b) | 0.00 | ||||||||||
| 10.16 | 1.60 | 2 | 1.16 (b) | 2.17 | (b) | 8.11 | (b) | (4.78 | ) (b) | 0.00 | ||||||||||
| Income from
investment |
Distributions to
shareholders |
||||||||||||||||||||
|---|---|---|---|---|---|---|---|---|---|---|---|---|---|---|---|---|---|---|---|---|---|
| Net asset
value, beginning of period |
Net
investment income (loss) |
Net realized
and unrealized gain (loss) |
Total from
investment operations |
From net
investment income |
From net
realized gains |
Total
distributions |
|||||||||||||||
| FOR THE YEAR ENDED AUGUST 31, | |||||||||||||||||||||
| 2000 – Class A Shares | $10.87 | $ 0.02 | (c) | $ 0.74 | $ 0.76 | $(0.05 | ) | $(0.26 | ) | $(0.31 | ) | ||||||||||
| 2000 – Class B Shares | 10.81 | (0.04) | (c) | 0.73 | 0.69 | (0.02 | ) | (0.26 | ) | (0.28 | ) | ||||||||||
| 2000 – Class C Shares | 10.82 | (0.03) | (c) | 0.72 | 0.69 | (0.02 | ) | (0.26 | ) | (0.28 | ) | ||||||||||
| 2000 – Institutional Shares | 11.00 | 0.09 | (c) | 0.75 | 0.84 | (0.10 | ) | (0.26 | ) | (0.36 | ) | ||||||||||
| 2000 – Service Shares | 10.93 | 0.05 | (c) | 0.73 | 0.78 | (0.09 | ) | (0.26 | ) | (0.35 | ) | ||||||||||
| FOR THE SEVEN-MONTH PERIOD ENDED AUGUST 31, | |||||||||||||||||||||
| 1999 – Class A Shares | 9.98 | 0.05 | 0.84 | 0.89 | — | — | — | ||||||||||||||
| 1999 – Class B Shares | 9.95 | 0.01 | 0.85 | 0.86 | — | — | — | ||||||||||||||
| 1999 – Class C Shares | 9.96 | 0.01 | 0.85 | 0.86 | — | — | — | ||||||||||||||
| 1999 – Institutional Shares | 10.06 | 0.09 | 0.85 | 0.94 | — | — | — | ||||||||||||||
| 1999 – Service Shares | 10.02 | 0.01 | 0.90 | 0.91 | — | — | — | ||||||||||||||
| FOR THE YEAR ENDED JANUARY 31, | |||||||||||||||||||||
| 1999 – Class A Shares | 9.22 | (0.01 | ) | 0.79 | 0.78 | (0.02 | ) | — | ( 0.02 | ) | |||||||||||
| 1999 – Class B Shares | 9.21 | — | 0.74 | 0.74 | — | — | — | ||||||||||||||
| 1999 – Class C Shares | 9.22 | — | 0.74 | 0.74 | — | — | — | ||||||||||||||
| 1999 – Institutional Shares | 9.24 | 0.05 | 0.80 | 0.85 | (0.03 | ) | — | (0.03 | ) | ||||||||||||
| 1999 – Service Shares | 9.23 | — | 0.81 | 0.81 | (0.02 | ) | — | (0.02 | ) | ||||||||||||
| FOR THE PERIOD ENDED JANUARY 31, | |||||||||||||||||||||
| 1998 – Class A Shares (commenced August 15, 1997) | 10.00 | — | (0.78 | ) | (0.78 | ) | — | — | — | ||||||||||||
| 1998 – Class B Shares (commenced August 15, 1997) | 10.00 | (0.02 | ) | (0.77 | ) | (0.79 | ) | — | — | — | |||||||||||
| 1998 – Class C Shares (commenced August 15, 1997) | 10.00 | (0.02 | ) | (0.76 | ) | (0.78 | ) | — | — | — | |||||||||||
| 1998 – Institutional Shares (commenced August 15, 1997) | 10.00 | 0.02 | (0.76 | ) | (0.74 | ) | (0.02 | ) | — | (0.02 | ) | ||||||||||
| 1998 – Service Shares (commenced August 15, 1997) | 10.00 | 0.01 | (0.78 | ) | (0.77 | ) | — | — | — | ||||||||||||
| |
|||||||||||||||||||||
(a)
|
Assumes investment at the net asset value at the beginning of the period, reinvestment of all dividends and distributions, a
complete redemption of the investment at the net asset value at the end of the period and no sales or redemption charges. Total return would be reduced if a sales or redemption charge were taken into account. Total returns for periods less than one full
year are not annualized.
|
(b)
|
Annualized.
|
(c)
|
Calculated based on the average shares outstanding methodology.
|
|
Ratios assuming no expense redemptions |
|||||||||||||||||||||
|---|---|---|---|---|---|---|---|---|---|---|---|---|---|---|---|---|---|---|---|---|---|
| Net asset
value, end of period |
Total
return (a) |
Net assets
at end of period (in 000s) |
Ratio of
net expenses to average net assets |
Ratio of
net investment income (loss) to average net assets |
Ratio of
expenses to average net assets |
Ratio of
net investment income (loss) to average net assets |
Portfolio
turnover rate |
||||||||||||||
| $11.32 | 6.92 | % | $147,409 | 1.66 | % | 0.14 | % | 1.75 | % | 0.05 | % | 92.10 | % | ||||||||
| 11.22 | 6.36 | 12,032 | 2.16 | (0.36 | ) | 2.25 | (0.45 | ) | 92.10 | ||||||||||||
| 11.23 | 6.34 | 6,887 | 2.16 | (0.34 | ) | 2.25 | (0.43 | ) | 92.10 | ||||||||||||
| 11.48 | 7.62 | 308,074 | 1.01 | 0.78 | 1.10 | 0.69 | 92.10 | ||||||||||||||
| 11.36 | 7.05 | 27 | 1.51 | 0.33 | 1.60 | 0.24 | 92.10 | ||||||||||||||
| 10.87 | 8.92 | 114,502 | 1.66 | (b) | 0.78 | (b) | 1.76 | (b) | 0.68 | (b) | 64.97 | ||||||||||
| 10.81 | 8.64 | 9,171 | 2.16 | (b) | 0.26 | (b) | 2.26 | (b) | 0.16 | (b) | 64.97 | ||||||||||
| 10.82 | 8.63 | 4,913 | 2.16 | (b) | 0.23 | (b) | 2.26 | (b) | 0.13 | (b) | 64.97 | ||||||||||
| 11.00 | 9.34 | 271,212 | 1.01 | (b) | 1.43 | (b) | 1.11 | (b) | 1.33 | (b) | 64.97 | ||||||||||
| 10.93 | 9.08 | 8 | 1.51 | (b) | 0.07 | (b) | 1.61 | (b) | (0.03 | ) (b) | 64.97 | ||||||||||
| 9.98 | 8.37 | 110,338 | 1.63 | (0.11 | ) | 1.94 | (0.42 | ) | 194.61 | ||||||||||||
| 9.95 | 8.03 | 7,401 | 2.08 | (0.03 | ) | 2.39 | (0.34 | ) | 194.61 | ||||||||||||
| 9.96 | 8.03 | 3,742 | 2.08 | (0.04 | ) | 2.39 | (0.35 | ) | 194.61 | ||||||||||||
| 10.06 | 9.20 | 280,731 | 1.01 | 0.84 | 1.32 | 0.53 | 194.61 | ||||||||||||||
| 10.02 | 8.74 | 22 | 1.50 | 0.02 | 1.81 | (0.29 | ) | 194.61 | |||||||||||||
| 9.22 | (7.66 | ) | 7,087 | 1.50 | (b) | (0.27 | ) (b) | 4.87 | (b) | (3.90 | ) (b) | 25.16 | |||||||||
| 9.21 | (7.90 | ) | 2,721 | 2.00 | (b) | (0.72 | ) (b) | 5.12 | (b) | (3.84 | ) (b) | 25.16 | |||||||||
| 9.22 | (7.80 | ) | 1,608 | 2.00 | (b) | (0.73 | ) (b) | 5.12 | (b) | (3.85 | ) (b) | 25.16 | |||||||||
| 9.24 | (7.45 | ) | 17,719 | 1.00 | (b) | 0.59 | (b) | 4.12 | (b) | (2.53 | ) (b) | 25.16 | |||||||||
| 9.23 | (7.70 | ) | 1 | 1.50 | (b) | 0.26 | (b) | 4.62 | (b) | (2.86 | ) (b) | 25.16 | |||||||||
| To the Shareholders and Board of Trustees of
|
| Goldman Sachs Trust — CORE Equity Funds:
|
| In our opinion, the accompanying statements of assets and liabilities, including the statements of investments, and the related
statements of operations and of changes in net assets and the financial highlights present fairly, in all material respects, the financial position of Goldman Sachs CORE U.S. Equity Fund, CORE Large Cap Growth Fund, CORE Small Cap Equity Fund, CORE Large
Cap Value Fund and Core International Equity Fund (collectively, “the CORE Equity Funds”), portfolios of Goldman Sachs Trust at August 31, 2000, the results of each of their operations, the changes in each of their net assets and the financial
highlights for the year then ended, in conformity with accounting principles generally accepted in the United States of America. These financial statements and financial highlights (hereafter referred to as “financial statements”) are the
responsibility of the Core Equity Funds’ management; our responsibility is to express an opinion on these financial statements based on our audits. We conducted our audits of these financial statements in accordance with auditing standards generally
accepted in the United States of America, which require that we plan and perform the audits to obtain reasonable assurance about whether the financial statements are free of material misstatement. An audit includes examining, on a test basis, evidence
supporting the amounts and disclosures in the financial statements, assessing the accounting principles used and significant estimates made by management, and evaluating the overall financial statement presentation. We believe that our audits, which
included confirmation of securities at August 31, 2000 by correspondence with the custodian and brokers, provide a reasonable basis for our opinion. The statements of changes in net assets of the CORE Equity Funds for the periods ended August 31, 1999 and
January 31, 1999 and the financial highlights for each of the periods ended on or before August 31, 1999 were audited by other independent accountants whose report dated October 8, 1999 expressed an unqualified opinion thereon.
|
| PricewaterhouseCoopers LLP
|
| Boston, Massachusetts
|
| October 23, 2000
|
| GOLDMAN SACHS ASSET MANAGEMENT 32 OLD SLIP, 17TH FLOOR NEW YORK , NEW YORK 10005 |
| TRUSTEES | O F F I C E R S | |
| Ashok N. Bakhru, Chairman | Douglas C. Grip, President | |
| David B. Ford | Jesse H. Cole, Vice President | |
| Douglas C. Grip | James A. Fitzpatrick, Vice President | |
| Patrick T. Harker | John M. Perlowski, Treasurer | |
| John P. McNulty | Peter W. Fortner, Assistant Treasurer | |
| Mary P. McPherson | Philip V. Giuca, Jr., Assistant Treasurer | |
| Alan A. Shuch | Howard B. Surloff, Secretary | |
| William H. Springer | Amy E. Belanger, Assistant Secretary | |
| Richard P. Strubel | Valerie A. Zondorak, Assistant Secretary | |
| GOLDMAN, SACHS & CO. | GOLDMAN SACHS ASSET MANAGEMENT | |
| Distributor and Transfer Agent | Investment Adviser | |
Visit our internet address: www.gs.com/funds
This material is not authorized for distribution to prospective investors unless preceded or accompanied by a current Prospectus. Investors should read the Prospectus carefully before investing or sending money.
Emerging markets securities are volatile. They are subject to substantial currency fluctuations and sudden economic and political developments. At times the fund may be unable to sell certain of its portfolio securities without a substantial drop in price, if at all.
The stocks of smaller companies are often more volatile and present greater risks than stocks of larger companies.
CORESM is a service mark of Goldman, Sachs & Co.
Goldman, Sachs & Co. is the distributor of the Fund.
| Copyright 2000 Goldman, Sachs & Co. All rights reserved. Date of first use: October 30, 2000 / 00-1383 | COREAR / 112K / 10-00 |
|
|