
|
|
|
|
|
|
|
|
|
GOLDMAN SACHS SMALL CAP VALUE FUND
Market Overview
Dear Shareholder:
During the period under review the financial markets experienced a dramatic increase in volatility. However, investors who stayed the course were generally rewarded for their disciplined approach, as many sectors of the market generated solid returns.
While a range of stocks were negatively impacted by the correction, technology issues experienced the brunt of the decline. At one point the technology-heavy Nasdaq composite was down 37% from its peak. While the NASDAQ posted a one-year return of 53.55% for the period ended August 31, 2000, this was largely due to the strong performance of technology stocks late in 1999 and in the summer of 2000. However, by the end of the reporting period the NASDAQ was still off 19% from its peak. In contrast, the S&P 500 Index, which also fell during the middle of the period, recovered to the point that it was again nearing its record high by the end of August.
As always, we appreciate your support and we look forward to serving your investment needs in the years to come.
| Sincerely, | ||
 |
||
| David B. Ford
Co-Head, Goldman Sachs Asset Management |
David W. Blood
CO-Head, Goldman Sachs Asset Management |
|
| September 15, 2000 | ||
GOLDMAN SACHS SMALL CAP VALUE FUND
Fund Basics
as of August 31, 2000
| PERFORMANCE REVIEW | |||||
| August 31, 1999– | Fund Total Return
|
Russell 2000 | Russell 2000
|
||
| August 31, 2000 | (without sales charge)1
|
Value Index2 | Index2
|
||
| |
|||||
| Class A | 17.22%
|
13.69%
|
27.15%
|
||
| Class B | 16.24
|
13.69
|
27.15
|
||
| Class C | 16.34
|
13.69
|
27.15
|
||
| Institutional | 17.64
|
13.69
|
27.15
|
||
| Service | 17.05
|
13.69
|
27.15
|
||
| |
|||||
| 1 The net asset value represents the net assets of the Fund (ex-dividend) divided by the total number of shares. The Fund’s performance assumes the reinvestment of dividends and other distributions. | ||||||||||
| 2 The Russell 2000 Value Index (with dividends reinvested), an unmanaged index of common stock prices, replaced the unmanaged Russell 2000 Index as of 11/30/99 as the Small Cap Value Fund’s performance benchmark. The Russell 2000 Value Index includes more value-oriented stocks and, therefore, is expected to be a better benchmark comparison for the Fund’s performance. The Russell 2000 Index is an unmanaged index of common stock prices. Index figures do not reflect any fees or expenses. In addition investors cannot invest directly in the Index. | ||||||||||
| STANDARDIZED TOTAL RETURNS 3 | ||||||||||
| For the period ended 6/30/00 | Class A
|
Class B
|
Class C
|
Institutional
|
Service
|
|||||
| |
||||||||||
| One Year | –7.85%
|
–8.17%
|
–4.26%
|
–2.22%
|
–2.71%
|
|||||
| Five Years | 7.68
|
N/A
|
N/A
|
N/A
|
8.834
|
|||||
| Since Inception | 8.81
|
4.06
|
–1.25
|
–0.16
|
9.574
|
|||||
| (10/22/92)
|
(5/1/96)
|
(8/15/97)
|
(8/15/97)
|
(10/22/92)
|
||||||
| |
||||||||||
| 3 The Standardized Total Returns are average annual total returns or cumulative total returns (only if the performance period is one year or less) as of the most recent calendar quarter-end. They assume reinvestment of all distributions at net asset value. These returns reflect a maximum initial sales charge of 5.5% for Class A shares, the assumed deferred sales charge for Class B shares (5% maximum declining to 0% after six years) and the assumed deferred sales charge for Class C shares (1% if redeemed within 12 months of purchase). Because Institutional and Service shares do not involve a sales charge, such a charge is not applied to their Standardized Total Returns. | ||||
| 4 Performance data for Service shares prior to 8/15/97 is that of the Class A shares (excluding the impact of the front-end sales charge applicable to Class A shares since Service shares are not subject to any sales charges). Performance of Class A shares of the Small Cap Value Fund reflects the expenses applicable to the Fund's Class A shares. The fees applicable to Service shares are different from those applicable to Class A shares which impact performance ratings and rankings for a class of shares. | ||||
| Total return figures represent past performance and do not indicate future results, which will vary. The investment return and principal value of an investment will fluctuate and, therefore, an investor’s shares, when redeemed, may be worth more or less than their original cost. Performance reflects expense limitations in effect. In their absence, performance would be reduced. | ||||
| TOP 10 HOLDINGS AS OF 8/ 31/ 00 | ||||
| Holding | % of Total Net Assets | Line of Business | ||
| |
||||
| Public Service Co. of New Mexico | 2.7%
|
Electrical Utilities | ||
| Methanex Corp. | 2.7
|
Chemicals | ||
| Beverly Enterprises, Inc. | 2.5
|
Medical Providers | ||
| Denison International PLC ADR | 2.1
|
Industrials Parts | ||
| Zenith National Insurance Corp. | 2.1
|
Property Insurance | ||
| Movado Group, Inc. | 2.0
|
Consumer Durables | ||
| General Semiconductor, Inc. | 1.9
|
Semiconductors | ||
| Pacific Century Financial Corp. | 1.6
|
Banks | ||
| Lee Enterprises, Inc. | 1.6
|
Publishing | ||
| ITT Educational Services, Inc. | 1.6
|
Industrial Services | ||
| |
||||
| The top 10 holdings may not be representative of the Fund’s future investments. | ||||
1
GOLDMAN SACHS SMALL CAP VALUE FUND
Performance Overview
Dear Shareholder,
We are pleased to report on the performance of the Goldman Sachs Small Cap Value Fund for the one year period that ended August 31, 2000.
Performance Review
Over the one-year period that ended August 31, 2000, the Fund’s Class A, B, C, Institutional and Service shares generated total cumulative returns, without sales charges, of 17.22%, 16.24%, 16.34%, 17.64%, and 17.05%, respectively. These figures compare favorably to the 13.69% total cumulative return of the Fund’s benchmark, the Russell 2000 Value Index.
So far this year, after several years of underperformance, small-cap value stocks have generated relatively strong results when compared to their growth stock counterparts. This was especially true from March through May, as the high valuations of many growth stocks concerned investors. For the year-to-date period that ended August 31, 2000, the Russell 2000 Value Index appreciated 14.3%, versus only a 2.3% increase for the Russell 2000 Index.
Portfolio Composition
As we seek to add value through superior stock selection, we spend the majority of our efforts performing thorough, first-hand fundamental research. We rebuild, analyze and forecast the financial statements of companies, and test our assumptions through meetings and discussions with company management, competitors, customers and suppliers. We seek to buy well positioned businesses that sell at conservative valuation levels. We also understand that our Small Cap Value clients seek a fund that will be competitive with the Russell 2000 Value Index over a long-term investment horizon. As such, we employ careful risk management techniques and thoughtful portfolio construction based on that mandate.
Portfolio Highlights
During the reporting period, the Fund’s outperformance was largely due to strong stock selection. Our disciplined investment process and intense focus on the critical factors that determine sustainable cash flow provided us with the confidence to invest in well-positioned small-cap companies during a period that was oftentimes in the midst of unusual market volatility. Our in-depth research, which includes a detailed financial analysis, a thorough assessment of possible risks, as well as visits to management, frequently allowed us to eliminate from consideration inexpensive small-cap stocks that are fundamentally poorly positioned and are likely to remain that way. Consequently, we believe our resulting portfolio was well-positioned to benefit from an earnings recovery.
2
GOLDMAN SACHS SMALL CAP VALUE FUND

Tech Data Corp. — One of the largest distributors of microcomputer hardware and software products, Tech Data was another significant contributor during the period. The firm’s stock price had come under pressure, due to concerns that the Internet would replace traditional methods of distribution. However, our analysis determined that the Internet could actually increase the growth of Tech Data’s distribution business by providing needed fulfillment. As the industry has consolidated, the company has emerged as a dominant distributor, and the market has since recognized the company’s strong fundamentals.
Portfolio Outlook
We continue to believe that the current environment offers tremendous investment opportunity for small-cap value stocks. Improved absolute returns reflect not only a renewed interest in small- capitalization stocks but, more importantly, a renaissance of value investing after a lengthy hiatus. In addition, several small-cap value companies were acquired, which further helped to generate interest in the sector. It is not surprising that the Small Cap Value Fund benefited from several takeovers in its holdings during the year. We believe merger activity should continue to be a positive catalyst for the sector, as their current prices offer large corporate buyers a very favorable return on investment.
The Fund has also benefited from an enhancement to its portfolio management team. A senior portfolio manager with twenty-eight years experience joined the team as a group head, along with another research analyst. Not only does this allow an increased degree of industry and sector specialization, but it underscores a commitment to provide continued investment excellence.
As always, we appreciate your investment and look forward to earning your continued confidence in the years to come.
Goldman Sachs Small Cap Value Investment Team
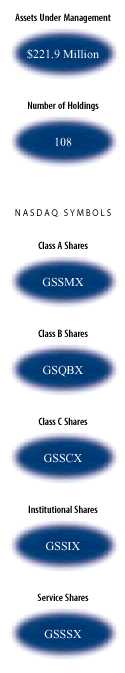
New York
September 13, 20003
GOLDMAN SACHS SMALL CAP VALUE FUND
The Goldman Sachs Advantage
Founded in 1869, Goldman, Sachs & Co. is a premier financial services firm traditionally known on Wall Street and around the world for its institutional expertise.
Today, the firm’s Investment Management Division provides individual investors the opportunity to tap the resources of a global institutional powerhouse — and put this expertise to work in their individual portfolios.
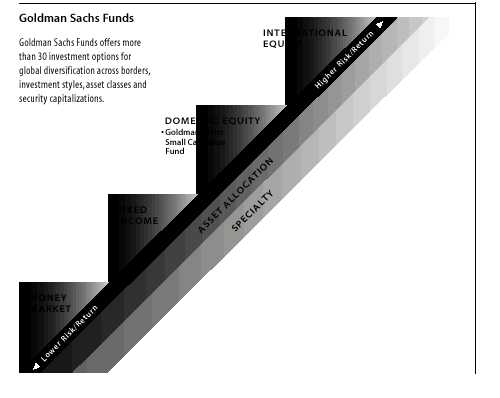
What Sets Goldman Sachs Funds Apart?
To learn more about the Goldman Sachs Funds, call your investment professional today.
4
| The following graph shows the value, as of August 31, 2000, of a $10,000 investment made on October 22, 1992 (commencement of
operations) in Class A Shares (maximum sales charge of 5.5%) in the Goldman Sachs Small Cap Value Fund. For comparative purposes, the performance of the Fund’s new benchmark, the Russell 2000 Value Index as of November 30, 1999 and the Fund’s
previous benchmark, the Russell 2000 Index are shown. This performance data represents past performance and should not be considered indicative of future performance which will fluctuate with changes in market conditions. These performance fluctuations
will cause an investor’s shares, when redeemed, to be worth more or less than their original cost. Performance of Class B, Class C, Institutional and Service Shares will vary from Class A due to differences in fees and loads.
|
| Small Cap Value Fund’s Lifetime Performance
|
| Growth of a $10,000 Investment, Distributions reinvested October 22, 1992 to August 31, 2000.
|
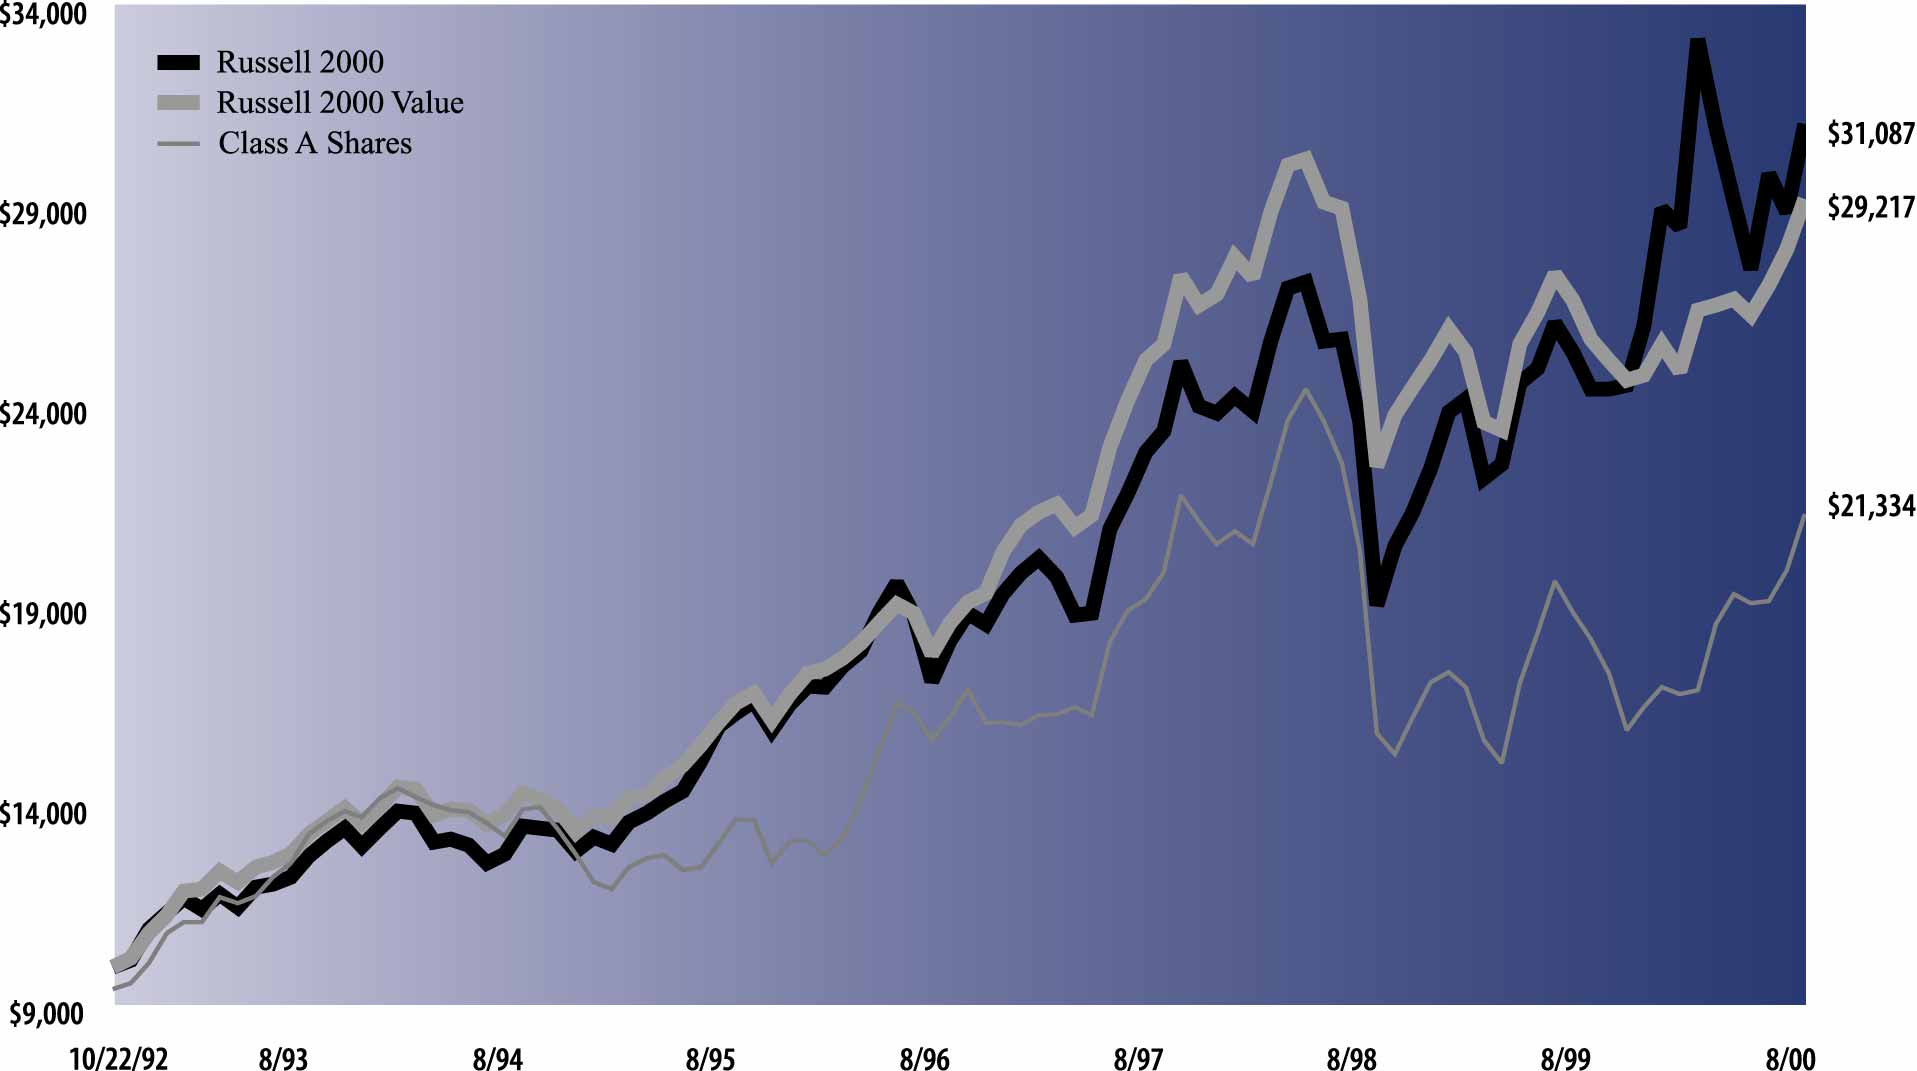 |
| Average Annual Total Return through August 31, 2000 | Since Inception | Five Years | One Year | |||||||
|---|---|---|---|---|---|---|---|---|---|---|
| Class A (commenced October 22, 1992) | ||||||||||
| Excluding sales charges | 10.91 | % | 9.23 | % | 17.22 | % | ||||
| Including sales charges | 10.11 | % | 8.00 | % | 10.79 | % | ||||
| Class B (commenced May 1, 1996) | ||||||||||
| Excluding contingent deferred sales charges | 6.98 | % | n/a | 16.24 | % | |||||
| Including contingent deferred sales charges | 6.52 | % | n/a | 11.24 | % | |||||
| Class C (commenced August 15, 1997) | ||||||||||
| Excluding contingent deferred sales charges | 2.32 | % | n/a | 16.34 | % | |||||
| Including contingent deferred sales charges | 2.32 | % | n/a | 15.34 | % | |||||
| Institutional Class (commenced August 15, 1997) | 3.46 | % | n/a | 17.64 | % | |||||
| Service Class (commenced August 15, 1997) | 2.98 | % | n/a | 17.05 | % | |||||
|
Shares |
Description | Value | |||
|---|---|---|---|---|---|
| Common Stocks – 94.1% | |||||
| Apparel – 1.3% | |||||
| 562,500 | Burlington Industries, Inc.* | $ 984,375 | |||
| 108,500 | Tropical Sportswear Int’l Corp.* | 1,959,781 | |||
| 2,944,156 | |||||
| Banks – 5.7% | |||||
| 159,100 | Community First Bankshares, Inc. | 2,863,800 | |||
| 20,500 | Corpus Bankshares, Inc. | 676,500 | |||
| 49,200 | Cullen/Frost Bankers, Inc. | 1,525,200 | |||
| 24,300 | Hamilton Bancorp, Inc.* | 361,463 | |||
| 260,500 | Pacific Century Financial Corp. | 3,647,000 | |||
| 78,600 | Susquehanna Bancshares, Inc. | 1,124,962 | |||
| 256,000 | The Colonial BancGroup, Inc. | 2,496,000 | |||
| 12,694,925 | |||||
| Chemicals – 6.8% | |||||
| 314,300 | Agrium, Inc. | 3,064,425 | |||
| 148,200 | IMC Global, Inc. | 2,176,687 | |||
| 980,800 | Methanex Corp.* | 5,884,800 | |||
| 178,000 | Millennium Chemicals, Inc. | 2,937,000 | |||
| 49,800 | The Lubrizol Corp. | 1,080,038 | |||
| 15,142,950 | |||||
| Clothing – 1.4% | |||||
| 128,300 | Urban Outfitters, Inc.* | 1,098,569 | |||
| 146,000 | Venator Group, Inc.* | 2,044,000 | |||
| 3,142,569 | |||||
| Computer Hardware – 2.8% | |||||
| 81,000 | Advanced Digital Information Corp.* | 1,377,000 | |||
| 127,100 | Ingram Micro, Inc.* | 1,906,500 | |||
| 57,100 | Tech Data Corp.* | 2,947,787 | |||
| 6,231,287 | |||||
| Computer Software – 1.7% | |||||
| 65,400 | Avant! Corp.* | 952,388 | |||
| 125,100 | Mentor Graphics Corp.* | 2,361,262 | |||
| 126,700 | Mobius Management Systems, Inc.* | 475,125 | |||
| 3,788,775 | |||||
| Construction – 1.6% | |||||
| 112,400 | D.R. Horton, Inc. | 2,205,850 | |||
| 113,300 | Morrison Knudsen Corp.* | 1,359,600 | |||
| 3,565,450 | |||||
| Consumer Durables – 2.0% | |||||
| 319,412 | Movado Group, Inc. | 4,471,768 | |||
| Department Store – 0.6% | |||||
| 118,500 | ShopKo Stores, Inc.* | 1,355,344 | |||
| Drugs – 0.2% | |||||
| 37,000 | Kos Pharmaceuticals, Inc.* | 518,000 | |||
| Electrical Equipment – 0.3% | |||||
| 113,200 | Brightpoint, Inc.* | 714,575 | |||
| Electrical Utilities – 6.0% | |||||
| 127,600 | Bangor Hydro-Electric Co. | 3,078,350 | |||
|
Shares |
Description | Value | |||
|---|---|---|---|---|---|
| Common Stocks – (continued) | |||||
| Electrical Utilities – continued | |||||
| 24,300 | IDACORP, Inc. | $ 958,331 | |||
| 285,100 | Public Service Co. of New Mexico | 6,094,012 | |||
| 106,500 | Sierra Pacific Resources | 1,883,719 | |||
| 59,000 | Western Resources, Inc. | 1,180,000 | |||
| 13,194,412 | |||||
| Energy Resources – 1.5% | |||||
| 35,200 | Louis Dreyfus Natural Gas Corp.* | 1,223,200 | |||
| 75,100 | Swift Energy Co.* | 2,173,206 | |||
| 3,396,406 | |||||
| Equity REIT – 10.4% | |||||
| 29,600 | Alexandria Real Estate Equities, Inc. | 1,036,000 | |||
| 18,700 | AvalonBay Communities, Inc. | 835,656 | |||
| 165,500 | Catellus Development Corp.* | 2,958,312 | |||
| 47,100 | CenterPoint Properties Corp. | 2,063,569 | |||
| 39,200 | Charles E. Smith Residential Realty,
Inc. |
1,612,100 | |||
| 49,700 | Cousins Properties, Inc. | 2,043,912 | |||
| 62,500 | Health Care Property Investors, Inc. | 1,644,531 | |||
| 77,400 | Liberty Property Trust | 2,022,075 | |||
| 75,400 | LNR Property Corp. | 1,602,250 | |||
| 126,600 | Prentiss Properties Trust | 3,077,962 | |||
| 43,100 | Reckson Associates Realty Corp. | 1,047,869 | |||
| 56,500 | Storage USA, Inc. | 1,702,063 | |||
| 98,100 | Trammell Crow Co.* | 1,361,138 | |||
| 23,007,437 | |||||
| Financial Services – 0.9% | |||||
| 58,800 | Allied Capital Corp. | 1,190,700 | |||
| 29,000 | Brown & Brown | 773,938 | |||
| 1,964,638 | |||||
| Food & Beverage – 1.6% | |||||
| 40,900 | Corn Products International, Inc. | 1,027,613 | |||
| 167,200 | Fleming Cos., Inc. | 2,581,150 | |||
| 3,608,763 | |||||
| Forest – 2.0% | |||||
| 145,200 | Caraustar Industries, Inc. | 2,241,525 | |||
| 178,800 | Packaging Corp. of America* | 2,089,725 | |||
| 4,331,250 | |||||
| Gas Utilities – 0.9% | |||||
| 46,900 | Laclede Gas Co. | 1,011,281 | |||
| 54,900 | Vectren Corp. | 1,043,100 | |||
| 2,054,381 | |||||
| Heavy Electrical – 2.6% | |||||
| 112,900 | Belden, Inc. | 2,949,512 | |||
| 130,000 | UCAR International, Inc.* | 1,771,250 | |||
| 144,300 | UNOVA, Inc.* | 1,082,250 | |||
| 5,803,012 | |||||
| Heavy Machinery – 1.9% | |||||
| 296,100 | AGCO Corp. | 3,109,050 | |||
| 218,300 | Titan International, Inc. | 1,105,144 | |||
| 4,214,194 | |||||
|
Shares |
Description | Value | |||
|---|---|---|---|---|---|
| Common Stocks – (continued) | |||||
| Hotels – 0.7% | |||||
| 91,500 | GTECH Holdings Corp.* | $ 1,635,563 | |||
| Industrial Parts – 4.4% | |||||
| 343,100 | Denison International PLC ADR* | 4,674,737 | |||
| 164,900 | Lydall, Inc.* | 1,989,106 | |||
| 205,400 | Milacron, Inc. | 3,170,863 | |||
| 9,834,706 | |||||
| Industrial Services – 2.8% | |||||
| 154,000 | ITT Educational Services, Inc.* | 3,542,000 | |||
| 173,200 | Pittston Brinks Group | 2,695,425 | |||
| 6,237,425 | |||||
| Information Services – 0.6% | |||||
| 124,100 | Modis Professional Services, Inc.* | 853,188 | |||
| 16,400 | National Data Corp. | 481,750 | |||
| 1,334,938 | |||||
| Life Insurance – 0.2% | |||||
| 18,600 | Liberty Financial Cos., Inc. | 439,425 | |||
| Media – 1.5% | |||||
| 63,300 | Media General, Inc. | 3,259,950 | |||
| Medical Products – 1.6% | |||||
| 81,900 | Haemonetics Corp.* | 2,062,856 | |||
| 34,400 | Varian Medical Systems, Inc. | 1,580,250 | |||
| 3,643,106 | |||||
| Medical Providers – 5.0% | |||||
| 1,070,700 | Beverly Enterprises, Inc.* | 5,554,256 | |||
| 178,300 | Foundation Health Systems, Inc.* | 3,131,394 | |||
| 170,600 | Manor Care, Inc.* | 2,281,775 | |||
| 10,967,425 | |||||
| Mining – 2.1% | |||||
| 38,400 | Commercial Metals Co. | 1,072,800 | |||
| 134,100 | Ispat International NV | 871,650 | |||
| 166,300 | Wolverine Tube, Inc.* | 2,764,738 | |||
| 4,709,188 | |||||
| Motor Vehicle – 1.3% | |||||
| 128,300 | Intermet Corp. | 994,325 | |||
| 156,900 | Lithia Motors, Inc.* | 1,922,025 | |||
| 2,916,350 | |||||
| Oil Refining – 0.5% | |||||
| 35,200 | Valero Energy Corp. | 1,060,400 | |||
| Oil Services – 1.7% | |||||
| 16,300 | Cal Dive International, Inc.* | 937,250 | |||
| 13,200 | Coflexip SA ADR | 784,163 | |||
| 104,300 | Stolt Offshore SA* | 1,447,162 | |||
| 51,100 | TETRA Technologies, Inc.* | 696,238 | |||
| 3,864,813 | |||||
| Property Insurance – 4.6% | |||||
| 93,500 | IPC Holdings Ltd. | 1,566,125 | |||
| 53,900 | Old Republic International Corp. | 1,290,231 | |||
| 196,400 | PXRE Group Ltd. | 2,675,950 | |||
| 196,700 | Zenith National Insurance Corp. | 4,560,981 | |||
| 10,093,287 | |||||
|
Shares |
Description | Value | ||||
|---|---|---|---|---|---|---|
| Common Stocks – (continued) | ||||||
| Publishing – 2.4% | ||||||
| 41,400 | ADVO, Inc.* | $ 1,694,812 | ||||
| 126,800 | Lee Enterprises, Inc. | 3,550,400 | ||||
| 5,245,212 | ||||||
| Restaurants – 2.8% | ||||||
| 245,500 | CBRL Group, Inc. | 2,961,344 | ||||
| 156,500 | Morton’s Restaurant Group, Inc.* | 3,286,500 | ||||
| 6,247,844 | ||||||
| Security/Asset Management – 0.7% | ||||||
| 35,400 | BlackRock, Inc.* | 1,451,400 | ||||
| Semiconductors – 3.4% | ||||||
| 292,300 | General Semiconductor, Inc.* | 4,256,619 | ||||
| 72,300 | MEMC Electronic Materials, Inc.* | 1,301,400 | ||||
| 41,000 | Pioneer-Standard Electronics, Inc. | 561,188 | ||||
| 11,900 | Siliconix, Inc.* | 664,912 | ||||
| 43,000 | Standard Microsystems Corp.* | 817,000 | ||||
| 7,601,119 | ||||||
| Specialty Retail – 1.8% | ||||||
| 138,500 | Brookstone, Inc.* | 1,809,156 | ||||
| 63,200 | The Boyds Collection Ltd.* | 560,900 | ||||
| 210,600 | The Good Guys, Inc.* | 1,632,150 | ||||
| 4,002,206 | ||||||
| Thrifts – 1.4% | ||||||
| 352,700 | Sovereign Bancorp, Inc. | 2,997,950 | ||||
| Truck Freight – 2.4% | ||||||
| 67,300 | Airborne Freight Corp. | 1,005,294 | ||||
| 35,000 | Landstar Systems, Inc.* | 1,785,000 | ||||
| 52,500 | Teekay Shipping Corp. | 2,428,125 | ||||
| 5,218,419 | ||||||
| TOTAL COMMON STOCKS | ||||||
| (Cost $190,973,518) | $208,905,018 | |||||
| Principal
Amount |
Interest
Rate |
Maturity
Date |
Value | ||||
|---|---|---|---|---|---|---|---|
| Repurchase Agreement – 4.7% | |||||||
| Joint Repurchase Agreement Account II /\ | |||||||
| $10,300,000 | 6.66% | 09/01/2000 | $ 10,300,000 | ||||
| TOTAL REPURCHASE AGREEMENT | |||||||
| (Cost $10,300,000) | $ 10,300,000 | ||||||
| TOTAL INVESTMENTS | |||||||
| (Cost $201,273,518) | $219,205,018 | ||||||
| * | Non-income producing security.
|
| /\
|
Joint repurchase agreement was entered into on August 31, 2000.
|
| The percentage shown for each investment category reflects the value of investments in that category as a percentage of total net
assets.
|
| |
| Investment Abbreviations:
|
| ADR —American Depositary Receipt
|
| |
August 31, 2000
| Assets:
|
| Investment in securities, at value (identified cost $201,273,518) | $219,205,018 | ||||||
| Cash | 54,991 | ||||||
| Receivables: | |||||||
| Investment securities sold | 2,865,775 | ||||||
| Fund shares sold | 888,208 | ||||||
| Dividends and interest | 194,755 | ||||||
| Reimbursement from adviser | 44,045 | ||||||
| Other assets | 5,308 | ||||||
| Total assets | 223,258,100 | ||||||
| Liabilities: | |||||||
| Payables: | |||||||
| Investment securities purchased | 579,757 | ||||||
| Fund shares repurchased | 429,342 | ||||||
| Amounts owed to affiliates | 279,287 | ||||||
| Accrued expenses and other liabilities | 23,779 | ||||||
| Total liabilities | 1,312,165 | ||||||
| Net Assets: | |||||||
| Paid-in capital | 258,062,378 | ||||||
| Accumulated net realized loss from investment and options transactions | (54,047,943 | ) | |||||
| Net unrealized gain on investments | 17,931,500 | ||||||
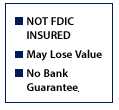
| NET ASSETS | $221,945,935 | ||||||
| Net asset value, offering and redemption price per share: (a) | |||||||
| Class A | $23.21 | ||||||
| Class B | $22.40 | ||||||
| Class C | $22.42 | ||||||
| Institutional | $23.47 | ||||||
| Service | $23.13 | ||||||
| Shares outstanding: | |||||||
| Class A | 6,798,488 | ||||||
| Class B | 1,303,543 | ||||||
| Class C | 375,860 | ||||||
| Institutional | 1,126,925 | ||||||
| Service | 3,580 | ||||||
| Total shares outstanding, $.001 par value (unlimited number of shares authorized) | 9,608,396 | ||||||
(a)
|
Maximum public offering price per share (NAV per share multiplied by 1.0582) for Class A shares is $24.56. At redemption, Class B
and Class C Shares may be subject to a contingent deferred sales charge, assessed on the amount equal to the lesser of the current net asset value or the original purchase price of the shares.
|
| |
| |
| |
| |
| |
| |
| |
| |
| |
| |
(a)
|
Foreign taxes withheld on dividends were $15,892.
|
(b)
|
Class A, Class B and Class C had Distribution and Service fees of $405,682, $285,873 and $70,710, respectively.
|
(c)
|
Class A, Class B, Class C, Institutional Class and Service Class had Transfer Agent fees of $308,318, $54,316, $13,435, $9,587 and
$21, respectively.
|
| For the
Year Ended August 31, 2000 |
For the
Seven-Months Ended August 31, 1999 |
For the
Year Ended January 31, 1999 |
||||||||
|---|---|---|---|---|---|---|---|---|---|---|
| From operations: | ||||||||||
| Net investment loss | $ (13,530 | ) | $ (764,389 | ) | $ (1,430,151 | ) | ||||
| Net realized loss on investment and options transactions | (8,307,106 | ) | (24,597,058 | ) | (21,053,205 | ) | ||||
| Net change in unrealized gain (loss) on investments | 36,005,585 | 42,816,511 | (75,425,946 | ) | ||||||
| Net increase (decrease) in net assets resulting from operations | 27,684,949 | 17,455,064 | (97,909,302 | ) | ||||||
| Distributions to shareholders: | ||||||||||
| From net realized gain on investment transactions | ||||||||||
| Class A Shares | — | — | (20,135,069 | ) | ||||||
| Class B Shares | — | — | (2,897,126 | ) | ||||||
| Class C Shares | — | — | (512,006 | ) | ||||||
| Institutional Shares | — | — | (946,473 | ) | ||||||
| Service Shares | — | — | (16,422 | ) | ||||||
| Total distributions to shareholders | — | — | (24,507,096 | ) | ||||||
| From share transactions: | ||||||||||
| Proceeds from sales of shares | 34,453,997 | 96,142,667 | 285,768,961 | |||||||
| Reinvestment of dividends and distributions | — | — | 22,881,335 | |||||||
| Cost of shares repurchased | (123,238,056 | ) | (158,916,521 | ) | (291,025,366 | ) | ||||
| Net increase (decrease) in net assets resulting from share transactions | (88,784,059 | ) | (62,773,854 | ) | 17,624,930 | |||||
| TOTAL DECREASE | (61,099,110 | ) | (45,318,790 | ) | (104,791,468 | ) | ||||
| Net assets: | ||||||||||
| Beginning of period | 283,045,045 | 328,363,835 | 433,155,303 | |||||||
| End of period | $221,945,935 | $283,045,045 | $328,363,835 | |||||||
| Accumulated net investment loss | — | — | — | |||||||
| 1. ORGANIZATION
|
| Goldman Sachs Trust (the “Trust”) is a Delaware business trust registered under the Investment Company Act of 1940 (as
amended) as an open-end management investment company. The Trust includes the Goldman Sachs Small Cap Value Fund (the “Fund”). The Fund is a diversified portfolio offering five classes of shares — Class A, Class B, Class C,
Institutional and Service.
|
| 2. SIGNIFICANT ACCOUNTING POLICIES
|
| The following is a summary of the significant accounting policies consistently followed by the Fund. The preparation of financial
statements in conformity with generally accepted accounting principles requires management to make estimates and assumptions that may affect the reported amounts. Actual results could differ from those estimates. Effective for fiscal year 1999, the Board
of Trustees approved a change in the fiscal year-end of the Fund from January 31 to August 31. Accordingly, the Statements of Changes in Net Assets, Summary of Share Transactions and the Financial Highlights of the Fund are included for the seven-month
period ended August 31, 1999 and the year ended January 31, 1999.
|
| A. Investment Valuation — Investments in
securities traded on a U.S. or foreign securities exchange or the NASDAQ system are valued daily at their last sale price on the principal exchange on which they are traded. If no sale occurs, securities are valued at the last bid price. Debt securities
are valued at prices supplied by independent pricing services, broker/dealer-supplied valuations or matrix pricing systems. Unlisted equity and debt securities for which market quotations are available are valued at the last sale price on valuation date,
or if no sale occurs, at the last bid price. Short-term debt obligations maturing in sixty days or less are valued at amortized cost, which approximates market value. Securities for which quotations are not readily available are valued at fair value using
methods approved by the Trust’s Board of Trustees.
|
| B. Security Transactions and Investment Income — Security transactions are recorded as of the trade date. Realized gains and losses on sales of portfolio securities are calculated using the identified-cost basis. Dividend income is recorded on the ex-dividend date, net of foreign withholding taxes
where applicable. Dividends for which the Fund has the choice to receive either cash or stock are recognized as investment income in an amount equal to the cash dividend. Interest income is recorded on the basis of interest accrued, premium amortized and
discount earned.
|
| Net investment income (other than class specific expenses) and unrealized and
realized gains or losses are allocated daily to each class of shares of the Fund based upon the relative proportion of net assets of each class.
|
| C. Federal Taxes — It is the Fund’s
policy to comply with the requirements of the Internal Revenue Code applicable to regulated investment companies and to distribute each year substantially all of its investment company taxable income and capital gains to its shareholders. Accordingly, no
federal tax provision is required. Income and capital gain distributions, if any, are declared and paid annually.
|
| The characterization of distributions to shareholders for financial reporting
purposes is determined in accordance with income tax rules. Therefore, the source of the Fund’s distributions may be shown in the accompanying financial statements as either from or in excess of net investment income or net realized gain on
investment transactions, or from paid-in-capital, depending on the type of book/tax differences that may exist.
|
| The Fund had approximately $42,959,499 at August 31, 2000 (the Fund’s tax
year-end) of capital loss carryforward expiring in 2006-2008 for federal tax purposes. This amount is available to be carried forward to offset future capital gains to the extent permitted by applicable laws or regulations.
|
| At August 31, 2000 the aggregate cost of portfolio securities for federal income
tax purposes is $203,053,683. Accordingly, the gross unrealized gain on investments was $34,834,050 and the gross unrealized loss on investments was $18,682,715 resulting in a net unrealized gain of $16,151,335.
|
| 2. SIGNIFICANT ACCOUNTING POLICIES (continued)
|
| D. Expenses — Expenses incurred by the
Trust that do not specifically relate to an individual fund of the Trust are allocated to the funds on a straight-line or pro rata basis depending upon the nature of the expense.
|
| Class A, Class B and Class C shareholders of the Fund bear all expenses and fees
relating to their respective Distribution and Service plans. Shareholders of Service shares bear all expenses and fees paid to service organizations. Each class of Shares of the Fund separately bears its respective class-specific Transfer Agency fees.
|
| E. Foreign Currency Translations — The
books and records of the Fund are maintained in U.S. dollars. Amounts denominated in foreign currencies are translated into U.S. dollars on the following basis: (i) investment valuations, foreign currency and other assets and liabilities initially
expressed in foreign currencies are converted each business day into U.S. dollars based upon current exchange rates; and (ii) purchases and sales of foreign investments, income and expenses are converted into U.S. dollars based upon currency exchange
rates prevailing on the respective dates of such transactions.
|
| Net realized and unrealized gain (loss) on foreign currency transactions will
represent: (i) foreign exchange gains and losses from the sale and holdings of foreign currencies; (ii) currency gains and losses between trade date and settlement date on investment securities transactions and forward exchange contracts; and (iii) gains
and losses from the difference between amounts of dividends and interest recorded and the amounts actually received.
|
| F. Segregation Transactions — The Fund may
enter into certain derivative transactions to seek to increase total return. Forward foreign currency exchange contracts, futures contracts, written options, when-issued securities and forward commitments represent examples of such transactions. As a
result of entering into these transactions, the Fund is required to segregate liquid assets on the accounting records equal to or greater than the market value of the corresponding transactions.
|
| G. Repurchase Agreements — Repurchase
agreements involve the purchase of securities subject to the seller’s agreement to repurchase them at a mutually agreed upon date and price. During the term of a repurchase agreement, the value of the underlying securities, including accrued
interest, is required to equal or exceed the value of the repurchase agreement. The underlying securities for all repurchase agreements are held in safekeeping at the Fund’s custodian.
|
| 3. AGREEMENTS
|
| Pursuant to the Investment Management Agreement (“the Agreement”), Goldman Sachs Asset Management (“GSAM”), a
unit of the Investment Management Division of Goldman, Sachs & Co. (“Goldman Sachs”), serves as the investment adviser to the Fund. Under the Agreement, the adviser, subject to the general supervision of the Trust’s Board of Trustees,
manages the Fund’s portfolio. As compensation for the services rendered pursuant to the Agreement, the assumption of the expenses related thereto and administering the Fund’s business affairs, including providing facilities, the adviser is
entitled to a fee, computed daily and payable monthly, at an annual rate equal to 1.00% of the average daily net assets of the Fund.
|
| The investment adviser has voluntarily agreed to limit certain “Other
Expenses” of the Fund (excluding Management fees, Distribution and Service fees, Transfer Agent fees, taxes, interest, brokerage, litigation, Service Share fees, indemnification costs and other extraordinary expenses) to the extent such expenses
exceed, on an annual basis, 0.06% of the average daily net assets of the Fund. For the year ended August 31, 2000, Goldman Sachs reimbursed approximately $145,000. In addition, the Fund has entered into certain offset arrangements with the custodian
resulting in a reduction in the Fund’s expenses. For the year ended August 31, 2000, custody fees were reduced by approximately $5,000.
|
| The Trust, on behalf of the Fund, has adopted Distribution and Service Plans.
Under the Distribution and Service Plans, Goldman Sachs and/or authorized dealers are entitled to a monthly fee from the Fund for distribution and shareholder maintenance services equal, on an annual basis, to 0.25%, 1.00% and 1.00% of the Fund’s
average daily net assets attributable to Class A, Class B and Class C Shares, respectively.
|
| 3. AGREEMENTS (continued)
|
| Goldman Sachs serves as the distributor of shares of the Fund pursuant to a
Distribution Agreement. Goldman Sachs may receive a portion of the Class A sales load and Class B and Class C contingent deferred sales charges and has advised the Fund that it retained approximately $49,000 during the year ended August 31, 2000.
|
| Goldman Sachs also serves as the Transfer Agent of the Fund for a fee. The fees
charged for such transfer agency services are calculated daily and payable monthly at an annual rate as follows: 0.19% of the average daily net assets for Class A, Class B and Class C Shares and .04% of the average daily net assets for Institutional and
Service shares.
|
| The Trust, on behalf of the Fund, has adopted a Service Plan. This plan allows for
Service shares to compensate service organizations for providing varying levels of account administration and shareholder liaison services to their customers who are beneficial owners of such shares. The Service Plan provides for compensation to the
service organizations in an amount up to .50% (on an annualized basis), of the average daily net asset value of the Service shares.
|
| As of August 31, 2000, the amounts owed to affiliates were approximately $184,000,
$63,000, and $32,000 for Management, Distribution and Service and Transfer Agent fees, respectively.
|
| 4. PORTFOLIO SECURITIES TRANSACTIONS
|
| The cost of purchases and proceeds of sales and maturities of securities (excluding short-term investments) for the year ended
August 31, 2000 were $162,861,797 and $260,542,665 respectively.
|
| For the year ended August 31, 2000, Goldman Sachs earned approximately $20,000 of
brokerage commissions from portfolio transactions.
|
| Option Accounting Principles — When the Fund writes
call or put options, an amount equal to the premium received is recorded as an asset and as an equivalent liability. The amount of the liability is subsequently marked-to-market to reflect the current market value of the option written. When a written
option expires on its stipulated expiration date or the Fund enters into a closing purchase transaction, the Fund realizes a gain or loss without regard to any unrealized gain or loss on the underlying security, and the liability related to such option is
extinguished. When a written call option is exercised, the Fund realizes a gain or loss from the sale of the underlying security, and the proceeds of the sale are increased by the premium originally received. When a written put option is exercised, the
amount of the premium originally received will reduce the cost of the security which the Fund purchases upon exercise. There is a risk of loss from a change in value of such options which may exceed the related premiums received.
|
| Upon the purchase of a call option or a protective put option by the Fund, the
premium paid is recorded as an investment and subsequently marked-to-market to reflect the current market value of the option. If an option which the Fund has purchased expires on the stipulated expiration date, the Fund will realize a loss in the amount
of the cost of the option. If the Fund enters into a closing sale transaction, the Fund will realize a gain or loss, depending on whether the sale proceeds for the closing sale transaction are greater or less than the cost of the option. If the Fund
exercises a purchased put option, the Fund will realize a gain or loss from the sale of the underlying security, and the proceeds from such sale will be decreased by the premium originally paid. If the Fund exercises a purchased call option, the cost of
the security which the Fund purchases upon exercise will be increased by the premium originally paid. At August 31, 2000, there were no open written option contracts.
|
| 5. LINE OF CREDIT FACILITY
|
| Effective May 31, 2000, the Fund participates in a $350,000,000 committed, unsecured revolving line of credit facility. Prior
thereto, the Fund participated in a $250,000,000 uncommitted and a $250,000,000 committed, unsecured revolving line of
credit facility. Under the most restrictive arrangement, the Fund must own securities having a market value in excess of 400% of the total bank borrowings. This facility is to be used solely for temporary or emergency purposes. The interest rate on
borrowings is based on the Federal Funds rate. The committed facility also requires a fee to be paid by the Fund based on the amount of the commitment which has not been utilized. During the year ended August 31, 2000, the Fund did not have any borrowings
under any of these facilities.
|
| 6. JOINT REPURCHASE AGREEMENT ACCOUNT
|
| The Fund, together with other registered investment companies having management agreements with GSAM or its affiliates, transfers
uninvested cash into joint accounts, the daily aggregate balance of which is invested in one or more repurchase agreements.
|
| At August 31, 2000, the Fund had an undivided interest in the repurchase
agreements in the joint account which equaled $10,300,000 in principal amount. At August 31, 2000, the following repurchase agreements held in this joint account were fully collateralized by Federal Agency obligations:
|
| Repurchase Agreements | Principal
Amount |
Interest
Rate |
Maturity
Date |
Amortized
Cost |
Maturity
Value |
|||||||
|---|---|---|---|---|---|---|---|---|---|---|---|---|
| ABN/AMRO, Inc. | $ 814,100,000 | 6.66 | % | 09/01/2000 | $ 814,100,000 | $ 814,250,608 | ||||||
| Banc of America Securities LLC | 900,000,000 | 6.67 | 09/01/2000 | 900,000,000 | 900,166,750 | |||||||
| Barclays Capital, Inc. | 500,000,000 | 6.67 | 09/01/2000 | 500,000,000 | 500,092,639 | |||||||
| Bear Stearns Companies, Inc. | 300,000,000 | 6.67 | 09/01/2000 | 300,000,000 | 300,055,583 | |||||||
| Chase Securities, Inc. | 450,000,000 | 6.67 | 09/01/2000 | 450,000,000 | 450,083,375 | |||||||
| Donaldson, Lufkin & Jenrette, Inc. | 1,000,000,000 | 6.67 | 09/01/2000 | 1,000,000,000 | 1,000,185,278 | |||||||
| J.P. Morgan & Co., Inc. | 800,000,000 | 6.65 | 09/01/2000 | 800,000,000 | 800,147,778 | |||||||
| Morgan Stanley Dean Witter & Co. | 750,000,000 | 6.65 | 09/01/2000 | 750,000,000 | 750,138,542 | |||||||
| Morgan Stanley Dean Witter & Co. | 300,000,000 | 6.60 | 09/01/2000 | 300,000,000 | 300,055,000 | |||||||
| UBS Warburg LLC | 800,000,000 | 6.65 | 09/01/2000 | 800,000,000 | 800,147,778 | |||||||
| TOTAL JOINT REPURCHASE AGREEMENT ACCOUNT II | $6,614,100,000 | $6,615,323,331 | ||||||||||
| 7. CHANGE IN INDEPENDENT ACCOUNTANTS
|
| On October 26, 1999 the Board of Trustees of the Fund upon the recommendation of the Board’s audit committee, determined not
to retain Arthur Andersen LLP and approved a change of the Fund’s independent accountants to PricewaterhouseCoopers LLP. For the period ended August 31, 1999 and the year ended January 31, 1999, Arthur Andersen LLP’s audit reports contained no
adverse opinion or disclaimer of opinion; nor were their reports qualified or modified as to uncertainty, audit scope, or accounting principles. Further, there were no disagreements between the Fund and Arthur Andersen LLP on accounting principles or
practices, financial statement disclosure or audit scope or procedure, which if not resolved to the satisfaction of Arthur Andersen LLP would have caused them to make reference to the disagreement in their reports.
|
| 8. CERTAIN RECLASSIFICATIONS
|
| In accordance with statement of Position 93-2, the Fund has reclassified $13,530 from paid-in capital to accumulated net
investment loss. This reclassification has no impact on the net asset value of the Fund and is designed to present the Fund’s capital accounts on a tax basis. Reclassifications result primarily from the difference in the tax treatment of foreign
currency, net operating losses and organization costs.
|
| 9. SUMMARY OF SHARE TRANSACTIONS
|
| Share activity is as follows:
|
| For the Year Ended
August 31, 2000 |
|||||||||||||||
|---|---|---|---|---|---|---|---|---|---|---|---|---|---|---|---|
| Shares | Dollars | ||||||||||||||
| Class A Shares | |||||||||||||||
| Shares sold | 1,375,654 | $27,265,326 | |||||||||||||
| Shares repurchased | (5,211,119 | ) | (99,633,194 | ) | |||||||||||
| (3,835,465 | ) | (72,367,868 | ) | ||||||||||||
| Class B Shares | |||||||||||||||
| Shares sold | 183,134 | 3,555,201 | |||||||||||||
| Shares repurchased | (819,879 | ) | (15,030,277 | ) | |||||||||||
| (636,745 | ) | (11,475,076 | ) | ||||||||||||
| Class C Shares | |||||||||||||||
| Shares sold | 137,123 | 2,640,911 | |||||||||||||
| Shares repurchased | (180,209 | ) | (3,309,647 | ) | |||||||||||
| (43,086 | ) | (668,736 | ) | ||||||||||||
| Institutional Shares | |||||||||||||||
| Shares sold | 47,653 | 945,353 | |||||||||||||
| Shares repurchased | (275,006 | ) | (5,233,437 | ) | |||||||||||
| (227,353 | ) | (4,288,084 | ) | ||||||||||||
| Service Shares | |||||||||||||||
| Shares sold | 2,401 | 47,206 | |||||||||||||
| Shares repurchased | (1,714 | ) | (31,501 | ) | |||||||||||
| 687 | 15,705 | ||||||||||||||
| NET DECREASE | (4,741,962 | ) | $(88,784,059 | ) | |||||||||||
| 9. SUMMARY OF SHARE TRANSACTIONS (continued)
|
| Share activity is as follows:
|
| For the Seven-Months Ended
August 31, 1999 |
|||||||
|---|---|---|---|---|---|---|---|
| Shares | Dollars | ||||||
| Class A Shares | |||||||
| Shares sold | 3,974,603 | $ 75,211,330 | |||||
| Shares repurchased | (7,479,721 | ) | (141,251,011 | ) | |||
| (3,505,118 | ) | (66,039,681 | ) | ||||
| Class B Shares | |||||||
| Shares sold | 223,866 | 4,216,615 | |||||
| Shares repurchased | (652,859 | ) | (11,537,114 | ) | |||
| (428,993 | ) | (7,320,499 | ) | ||||
| Class C Shares | |||||||
| Shares sold | 121,721 | 2,343,776 | |||||
| Shares repurchased | (156,184 | ) | (2,743,702 | ) | |||
| (34,463 | ) | (399,926 | ) | ||||
| Institutional Shares | |||||||
| Shares sold | 693,113 | 14,235,041 | |||||
| Shares repurchased | (163,344 | ) | (3,050,873 | ) | |||
| 529,769 | 11,184,168 | ||||||
| Service Shares | |||||||
| Shares sold | 7,750 | 135,905 | |||||
| Shares repurchased | (18,993 | ) | (333,821 | ) | |||
| (11,243 | ) | (197,916 | ) | ||||
| NET DECREASE | (3,450,048 | ) | $ (62,773,854 | ) | |||
| 9. SUMMARY OF SHARE TRANSACTIONS (continued)
|
| Share activity is as follows:
|
| For the Year Ended
January 31, 1999 |
|||||||
|---|---|---|---|---|---|---|---|
| Shares | Dollars | ||||||
| Class A Shares | |||||||
| Shares sold | 11,250,168 | $248,147,068 | |||||
| Reinvestments of dividends and distributions | 1,120,125 | 18,887,752 | |||||
| Shares repurchased | (13,625,605 | ) | (275,189,998 | ) | |||
| (1,255,312 | ) | (8,155,178 | ) | ||||
| Class B Shares | |||||||
| Shares sold | 1,020,790 | 24,298,444 | |||||
| Reinvestments of dividends and distributions | 159,248 | 2,632,705 | |||||
| Shares repurchased | (609,437 | ) | (12,177,880 | ) | |||
| 570,601 | 14,753,269 | ||||||
| Class C Shares | |||||||
| Shares sold | 348,913 | 8,014,845 | |||||
| Reinvestments of dividends and distributions | 24,492 | 404,852 | |||||
| Shares repurchased | (156,144 | ) | (3,072,836 | ) | |||
| 217,261 | 5,346,861 | ||||||
| Institutional Shares | |||||||
| Shares sold | 191,950 | 5,013,154 | |||||
| Reinvestments of dividends and distributions | 55,467 | 939,606 | |||||
| Shares repurchased | (30,030 | ) | (583,311 | ) | |||
| 217,387 | 5,369,449 | ||||||
| Service Shares | |||||||
| Shares sold | 13,163 | 295,450 | |||||
| Reinvestments of dividends and distributions | 974 | 16,420 | |||||
| Shares repurchased | (71 | ) | (1,341 | ) | |||
| 14,066 | 310,529 | ||||||
| NET INCREASE (DECREASE) | (235,997 | ) | $ 17,624,930 | ||||
| Income (loss) from
investment operations |
Distributions to shareholders |
||||||||||||||||||||||||
|---|---|---|---|---|---|---|---|---|---|---|---|---|---|---|---|---|---|---|---|---|---|---|---|---|---|
| Net asset
value, beginning of period |
Net
investment income (loss) |
Net realized and unrealized gain (loss) |
Total
income (loss) from investment operations |
In excess
of net investment income |
From net
realized gains |
Total
distributions |
|||||||||||||||||||
| FOR THE YEAR ENDED AUGUST 31, | |||||||||||||||||||||||||
| 2000 - Class A Shares | $19.80 | $ 0.01 | (c) | $ 3.40 | $ 3.41 | $ — | $ — | $ — | |||||||||||||||||
| 2000 - Class B Shares | 19.27 | (0.13 | ) (c) | 3.26 | 3.13 | — | — | — | |||||||||||||||||
| 2000 - Class C Shares | 19.28 | (0.12 | ) (c) | 3.26 | 3.14 | — | — | — | |||||||||||||||||
| 2000 - Institutional Shares | 19.95 | 0.10 | (c) | 3.42 | 3.52 | — | — | — | |||||||||||||||||
| 2000 - Service Shares | 19.76 | 0.01 | (c) | 3.36 | 3.37 | — | — | — | |||||||||||||||||
| FOR THE SEVEN-MONTH PERIOD ENDED AUGUST 31, | |||||||||||||||||||||||||
| 1999 - Class A Shares | 18.51 | (0.05 | ) | 1.34 | 1.29 | — | — | — | |||||||||||||||||
| 1999 - Class B Shares | 18.10 | (0.12 | ) | 1.29 | 1.17 | — | — | — | |||||||||||||||||
| 1999 - Class C Shares | 18.12 | (0.11 | ) | 1.27 | 1.16 | — | — | — | |||||||||||||||||
| 1999 - Institutional Shares | 18.62 | — | 1.33 | 1.33 | — | — | — | ||||||||||||||||||
| 1999 - Service Shares | 18.50 | (0.13 | ) | 1.39 | 1.26 | — | — | — | |||||||||||||||||
| FOR THE YEARS ENDED JANUARY
31, |
|||||||||||||||||||||||||
| 1999 - Class A Shares | 24.05 | (0.06 | ) | (4.48 | ) | (4.54 | ) | — | (1.00 | ) | (1.00 | ) | |||||||||||||
| 1999 - Class B Shares | 23.73 | (0.21 | ) | (4.42 | ) | (4.63 | ) | — | (1.00 | ) | (1.00 | ) | |||||||||||||
| 1999 - Class C Shares | 23.73 | (0.18 | ) | (4.43 | ) | (4.61 | ) | — | (1.00 | ) | (1.00 | ) | |||||||||||||
| 1999 - Institutional Shares | 24.09 | 0.03 | (4.50 | ) | (4.47 | ) | — | (1.00 | ) | (1.00 | ) | ||||||||||||||
| 1999 - Service Shares | 24.05 | (0.04 | ) | (4.51 | ) | (4.55 | ) | — | (1.00 | ) | (1.00 | ) | |||||||||||||
| 1998 - Class A Shares | 20.91 | 0.14 | 5.33 | 5.47 | — | (2.33 | ) | (2.33 | ) | ||||||||||||||||
| 1998 - Class B Shares | 20.80 | (0.01 | ) | 5.27 | 5.26 | — | (2.33 | ) | (2.33 | ) | |||||||||||||||
| 1998 - Class C Shares (commenced August 15, 1997) | 24.69 | (0.06 | ) | 1.43 | 1.37 | (0.34 | ) | (1.99 | ) | (2.33 | ) | ||||||||||||||
| 1998 - Institutional Shares (commenced August 15,
1997) |
24.91 | 0.03 | 1.48 | 1.51 | (0.28 | ) | (2.05 | ) | (2.33 | ) | |||||||||||||||
| 1998 - Service Shares (commenced August 15, 1997) | 24.91 | (0.01 | ) | 1.48 | 1.47 | (0.31 | ) | (2.02 | ) | (2.33 | ) | ||||||||||||||
| 1997 - Class A Shares | 17.29 | (0.21 | ) | 4.92 | 4.71 | — | (1.09 | ) | (1.09 | ) | |||||||||||||||
| 1997 - Class B Shares (commenced May 1, 1996) | 20.79 | (0.11 | ) | 1.21 | 1.10 | — | (1.09 | ) | (1.09 | ) | |||||||||||||||
| 1996 - Class A Shares | 16.14 | (0.23 | ) | 1.39 | 1.16 | — | (0.01 | ) | (0.01 | ) | |||||||||||||||
| |
(a)
|
Assumes investment at the net asset value at the beginning of the period, reinvestment of all dividends and distributions, a
complete redemption of the investment at the net asset value at the end of the period and no sales or redemption charges. Total return would be reduced if a sales or redemption charge were taken into account. Total returns for periods less than one full
year are not annualized.
|
(b)
|
Annualized.
|
(c)
|
Calculated based on the average shares outstanding methodology.
|
|
Ratios assuming no expense reductions |
|||||||||||||||||||||
|---|---|---|---|---|---|---|---|---|---|---|---|---|---|---|---|---|---|---|---|---|---|
| Net asset
value, end of period |
Total
return (a) |
Net assets at end of period (in 000s) |
Ratio of
net expenses to average net assets |
Ratio of
net investment income (loss) to average net assets |
Ratio of
expenses to average net assets |
Ratio of
net investment income (loss) to average net assets |
Portfolio
turnover rate |
||||||||||||||
| $23.21 | 17.22 | % | $157,791 | 1.50 | % | 0.07 | % | 1.57 | % | — | % | 75.31 | % | ||||||||
| 22.40 | 16.24 | 29,199 | 2.25 | (0.68 | ) | 2.32 | (0.75 | ) | 75.31 | ||||||||||||
| 22.42 | 16.34 | 8,428 | 2.25 | (0.65 | ) | 2.32 | (0.72 | ) | 75.31 | ||||||||||||
| 23.47 | 17.64 | 26,445 | 1.10 | 0.49 | 1.17 | 0.42 | 75.31 | ||||||||||||||
| 23.13 | 17.05 | 83 | 1.60 | 0.03 | 1.67 | (0.04 | ) | 75.31 | |||||||||||||
| 19.80 | 6.97 | 210,500 | 1.50 | (b) | (0.35 | ) (b) | 1.61 | (b) | (0.46 | ) (b) | 46.95 | ||||||||||
| 19.27 | 6.46 | 37,386 | 2.25 | (b) | (1.10 | ) (b) | 2.36 | (b) | (1.21 | ) (b) | 46.95 | ||||||||||
| 19.28 | 6.40 | 8,079 | 2.25 | (b) | (1.10 | ) (b) | 2.36 | (b) | (1.21 | ) (b) | 46.95 | ||||||||||
| 19.95 | 7.14 | 27,023 | 1.10 | (b) | 0.05 | (b) | 1.21 | (b) | (0.06 | ) (b) | 46.95 | ||||||||||
| 19.76 | 6.81 | 57 | 1.60 | (b) | (0.41 | ) (b) | 1.71 | (b) | (0.52 | ) (b) | 46.95 | ||||||||||
| 18.51 | (17.37 | ) | 261,661 | 1.50 | (0.24 | ) | 1.74 | (0.48 | ) | 98.46 | |||||||||||
| 18.10 | (18.00 | ) | 42,879 | 2.25 | (0.99 | ) | 2.29 | (1.03 | ) | 98.46 | |||||||||||
| 18.12 | (17.91 | ) | 8,212 | 2.25 | (0.99 | ) | 2.29 | (1.03 | ) | 98.46 | |||||||||||
| 18.62 | (17.04 | ) | 15,351 | 1.13 | 0.13 | 1.17 | 0.09 | 98.46 | |||||||||||||
| 18.50 | (17.41 | ) | 261 | 1.62 | (0.47 | ) | 1.66 | (0.51 | ) | 98.46 | |||||||||||
| 24.05 | 26.17 | 370,246 | 1.54 | (0.28 | ) | 1.76 | (0.50 | ) | 84.81 | ||||||||||||
| 23.73 | 25.29 | 42,677 | 2.29 | (0.92 | ) | 2.29 | (0.92 | ) | 84.81 | ||||||||||||
| 23.73 | 5.51 | 5,604 | 2.09 | (b) | (0.79 | ) (b) | 2.09 | (b) | (0.79 | ) (b) | 84.81 | ||||||||||
| 24.09 | 6.08 | 14,626 | 1.16 | (b) | 0.27 | (b) | 1.16 | (b) | 0.27 | (b) | 84.81 | ||||||||||
| 24.05 | 5.91 | 2 | 1.45 | (b) | (0.07 | ) (b) | 1.45 | (b) | (0.07 | ) (b) | 84.81 | ||||||||||
| 20.91 | 27.28 | 212,061 | 1.60 | (0.72 | ) | 1.85 | (0.97 | ) | 99.46 | ||||||||||||
| 20.80 | 5.39 | 3,674 | 2.35 | (b) | (1.63 | ) (b) | 2.35 | (b) | (1.63 | ) (b) | 99.46 | ||||||||||
| 17.29 | 7.20 | 204,994 | 1.41 | (0.59 | ) | 1.66 | (0.84 | ) | 57.58 | ||||||||||||
| To the Shareholders and Board of Trustees of
|
| Goldman Sachs Trust — Small Cap Value Fund:
|
| In our opinion, the accompanying statement of assets and liabilities, including the statement of investments, and the related
statements of operations and of changes in net assets and the financial highlights present fairly, in all material respects, the financial position of Goldman Sachs Small Cap Value Fund (“the Fund”), one of the portfolios constituting Goldman
Sachs Trust, at August 31, 2000, the results of its operations, the changes in its net assets and the financial highlights for the year then ended, in conformity with accounting principles generally accepted in the United States of America. These
financial statements and financial highlights (hereafter referred to as “financial statements”) are the responsibility of the Fund’s management; our responsibility is to express an opinion on these financial statements based on our audit.
We conducted our audit of these financial statements in accordance with auditing standards generally accepted in the United States of America, which require that we plan and perform the audit to obtain reasonable assurance about whether the financial
statements are free of material misstatement. An audit includes examining, on a test basis, evidence supporting the amounts and disclosures in the financial statements, assessing the accounting principles used and significant estimates made by management,
and evaluating the overall financial statement presentation. We believe that our audit, which included confirmation of securities at August 31, 2000 by correspondence with the custodian and brokers, provides a reasonable basis for our opinion. The
statements of changes in net assets of the Fund for the period ended August 31, 1999 and the year ended January 31, 1999 and the financial highlights for each of the periods ended on or before August 31, 1999 were audited by other independent accountants
whose report dated October 8, 1999 expressed an unqualified opinion thereon.
|
| PricewaterhouseCoopers LLP
|
| Boston, Massachusetts
|
| October 23, 2000
|
GOLDMAN SACHS FUND PROFILE
Goldman Sachs Small Cap Value Fund
An Investment Idea For The Long Term
Historically, stocks have demonstrated greater potential to build wealth over the long term than most other types of investments.
Goldman Sachs Small Cap Value Fund offers investors access to the benefits associated with equity investing. The Fund seeks long-term capital growth, primarily through equity securities of companies with public stock market capitalizations of $1 billion or less at the time of investment.
Target Your Needs
The Goldman Sachs Small Cap Value Fund has a distinct investment objective and a defined place on the risk/return spectrum. As your investment objectives change, you can exchange shares within Goldman Sachs Funds without any additional charge.* (Please note: in general, greater returns are associated with greater risk.)
For More Information
To learn more about the Goldman Sachs Small Cap Value Fund and other Goldman Sachs Funds, call your investment professional today.
*The exchange privilege is subject to termination and its terms are subject to change.
| GOLDMAN SACHS ASSET MANAGEMENT 32 OLD SLIP, 17TH FLOOR, NEW YORK, NEW YORK 10005 | |
| TRUSTEES | OFFICERS |
| Ashok N. Bakhru, Chairman | Douglas C. Grip, President |
| David B. Ford | Jesse H. Cole, Vice President |
| Douglas C. Grip | James A. Fitzpatrick, Vice President |
| Patrick T. Harker | John M. Perlowski, Treasurer |
| John P. McNulty | Peter W. Fortner, Assistant Treasurer |
| Mary P. McPherson | Philip V. Giuca, Jr., Assistant Treasurer |
| Alan A. Shuch | Howard B. Surloff, Secretary |
| William H. Springer | Amy E. Belanger, Assistant Secretary |
| Richard P. Strubel | Valerie A. Zondorak, Assistant Secretary |
| GOLDMAN, SACHS & Co. | GOLDMAN SACHS ASSET MANAGEMENT |
| Distributor and Transfer Agent | Investment Adviser |
Visit our internet address: www.gs.com/funds
This material is not authorized for distribution to prospective investors unless preceded or accompanied by a current Prospectus. Investors should read the Prospectus carefully before investing or sending money.
The Small Cap Value Fund's foreign investments may be more volatile than an investment in the U.S. securities and are subject to the risks of currency fluctuations and political developments.
The stocks of smaller companies are often more volatile and present greater risks than stocks of larger companies. At times the Fund may be unable to sell the securities it holds without a substantial drop in price, if at all.
The Fund may participate in the Initial Public Offering (IPO) market, and a portion of the Fund's returns consequently may be attributable to its investment in IPOs, which may have a magnified impact due to the Fund's small asset base. As the Fund's assets grow, it is probable that the effect of the Fund's investment in IPOs on its total returns may not be as significant.
Goldman, Sachs & Co. is the distributor of the Fund.
| Copyright 2000 Goldman, Sachs & Co. All rights reserved. Date of first use: October 30, 2000/ 00-1383 | SCVAR/24K/10-00
|
||
|
|