|
|
|
|
|
|
|
|
|
Goldman Sachs Funds
| TAX-FREE FUNDS |
Semiannual Report April 30, 2000
| High current income potential |
| from portfolios that invest primarily |
| in municipal securities. |
[GRAPHIC]
GOLDMAN SACHS TAX-FREE FUNDS
Market Overview
Dear Shareholder,
During the period under review, U.S. bond markets generally posted lackluster results, due to expanding economies and higher interest rates.
| Market Review | ||
| The Bond Market -- Steadily rising short-term interest rates led to generally sub-par performance in many sectors of the U.S. fixed income market. Overall, we have seen spreads rise, and market-specific events also took their toll on performance. For example, a scarcity of new issues and falling investor demand detracted from results in the high yield and municipal markets. |
||
| n |
| Another major factor affecting the U.S. bond market was the U.S. Treasury's decision to buy back long maturity debt. The reduction in supply is aimed at reducing the average maturity and interest cost of Treasury debt. This led to a sharp increase in demand for 30-year bonds, resulting in a strong rally and an inverted yield curve. |
||
| n | The Economy -- Despite repeated attempts by the Federal Reserve Board (the "Fed") to slow economic growth, the U.S. economy continued to grow at a rapid pace. The GDP increased 6.9% during the fourth quarter of 1999, and the economic expansion hit a record nine years in February 2000. GDP growth fell to 5.4% during the first quarter of the year, but this rate is still much higher than what is deemed acceptable by the Fed in terms of keeping inflation at bay. With the lowest unemployment rate since the 1970s and increasing wage pressures, it's a virtual certainty that further short-term interest rate hikes will occur for the time being. |
|
| Outlook |
| We expect the Fed to remain steadfast in its resolve to cool the economy and preempt inflation. The Fed has raised interest rates five times since the end of last June, yet economic growth shows no signs of abating. Based on recent economic data it now appears the Fed will need to tighten financial conditions more quickly, and by a greater amount, to slow the economy. We now believe that the Fed will raise its Federal Funds rate target in the months to follow. When it appears that the economy has sufficiently slowed we would expect spreads to tighten. |
| One final note: We're pleased to announce that Tom Kenny and Ben Barber are now leading our municipal bond portfolio management efforts. Mr. Kenny and Mr. Barber joined us from Franklin Templeton Management in December 1999, and they bring over 21 years of portfolio management and credit research experience to our firm. This enhancement of the team allowed us to round out our product line-up of national municipal bond funds with the April 2000 launch of the Goldman Sachs High Yield Municipal Fund. |
| As always, we appreciate your support and look forward to serving your investment needs in the years to come. |
| Sincerely, |
| /s/ David B. Ford | /s/ David W. Blood | /s/ Sharmin Mossavar-Rahmani | |||
| David B. Ford | David W. Blood | Sharmin Mossavar-Rahmani | |||
| Co-Head, Goldman Sachs | Co-Head, Goldman Sachs | CIO, Fixed Income Investments, | |||
| Asset Management | Asset Management | Goldman Sachs Asset Management | |||
| May 9, 2000 | |||||
| |
| NOT FDIC-INSURED |
| |
| May Lose Value |
| |
| No Bank Guarantee |
| |
GOLDMAN SACHS TAX-FREE FUNDS
Fixed Income Investment Process
With our fixed income portfolios, we seek consistent, strong performance. We actively manage our funds within a research-intensive, risk-managed framework instead of attempting to anticipate interest rate movements.
FIXED INCOME SECURITY SELECTION
Sector Allocation
1
Our sector specialists work together to assess relative value among sectors and create investment strategies to meet each fund's objectives.
Security Selection
2
In selecting securities for each portfolio, our fixed income teams have access to the vast resources of Goldman Sachs.
Yield Curve Strategies
3
We adjust the term structure of our portfolios based on our expectations of the relationship between short- and long-term interest rates, while keeping each fund's duration close to its benchmark.
Fund Basics
Short Duration Tax-Free Fund
as of April 30, 2000
Assets Under Management
$70.4 Million
NASDAQ SYMBOLS
Class A Shares
GSDTX
Class B Shares
GSDBX
Class C Shares
GSTCX
Institutional Shares
GSDUX
Service Shares
GSTAX
| |
||||
|---|---|---|---|---|
| Performance Review | ||||
| |
||||
| October 31, 1999-
April 30, 2000 |
Fund Total Return
(based on NAV)1 |
30-Day Taxable
Equivalent Yield2 |
30-Day
Standardized Yield3 |
Lehman 3-Year
Muni Bond Index4 |
| Class A | 1.02% | 7.86% | 4.75% | 1.31% |
| Class B | 0.72% | 7.02% | 4.24% | 1.31% |
| Class C | 0.64% | N/A | N/A | 1.31% |
| Institutional | 1.12% | 8.69% | 5.25% | 1.31% |
| Service | 0.97% | 7.85% | 4.74% | 1.31% |
| |
||||
| 1 | The net asset value represents the net assets of the Fund (ex-dividend) divided by the total number of shares outstanding. The Fund's performance reflects the reinvestment of dividends and other distributions. |
| 2 | The Taxable Equivalent Yield of the Fund is calculated by dividing the current 30-day Standardized Yield by 1 minus the highest 1999 federal income tax rate of 39.6%. |
| 3 | The 30-Day Standardized Yield of the Fund is calculated by dividing the net investment income per share (as defined by securities industry regulations) earned by the Fund over a 30-day period (ending on the stated month-end date) by the maximum public offering price per share of the Fund on the last day of the period. This number is compounded semiannually and then annualized. This yield does not necessarily reflect income actually earned and distributed by the Fund and, therefore, may not be correlated with the dividends or other distributions paid to shareholders. |
| 4 | The Lehman 3-Year Municipal Bond Index does not reflect any fees or expenses. Investors cannot invest directly in the Index. |
| |
|||||
|---|---|---|---|---|---|
| Standardized Total Returns | |||||
| |
|||||
| For the period ending 3/31/00 |
Class A |
Class B |
Class C |
Institutional |
Service |
| One Year5 | -1.13% | -1.79% | -0.94% | 1.21% | 0.61% |
| Five Years5 | N/A | N/A | N/A | 4.38% | 3.84% |
| Since Inception5 | 2.89% | 2.58% | 2.35% | 4.07% | 3.71% |
| (5/1/97) | (5/1/97) | (8/15/97) | (10/1/92 | (9/20/94) | |
| |
|||||
| 5 | The Standardized Total Returns are average annual returns as of the most recent calendar quarter-end. They assume reinvestment of all distributions at net asset value. These returns reflect a maximum initial sales charge of 2% for Class A shares, the assumed deferred sales charge for Class B shares (2% maximum declining to 0% after three years) and the assumed deferred sales charge for Class C shares (1% if redeemed within 12 months of purchase). Because Institutional and Service shares do not involve sales charges, such charges have not been applied to their Standardized Total Returns. |
| |
||||
|---|---|---|---|---|
| Portfolio Composition as of 4/30/006 | ||||
| |
||||
| Sector Allocation |
|
|
Credit Allocation |
|
| Revenue Bonds | 60.0% | AAA | 31.0% | |
| Pre-refunded | 12.0% | AA | 25.0% | |
| General Obligations | 19.0% | A | 32.0% | |
| Insured Revenue Bonds | 9.0% | BBB | 12.0% | |
| 6 | The Fund is actively managed and, as such, its composition may differ over time. Figures represent a percentage of total portfolio investments that have settled and include an offset to cash equivalents relating to all unsettled trades and therefore, may not sum to 100%. |
| Total return figures represent past performance and do not indicate future results, which will vary. The investment return and principal value of an investment will fluctuate and, therefore, an investor's shares, when redeemed, may be worth more or less than their original cost. Performance reflects fee waivers and expense limitations in effect. In their absence, performance would be reduced. |
Short Duration Tax-Free Fund
Dear Shareholder,
We are pleased to report on the performance of the Goldman Sachs Short Duration Tax-Free Fund for the six month period that ended April 30, 2000.
| Performance Review |
| Over the six month period that ended April 30, 2000, the Fund's Class A, B, C, Institutional and Service shares generated cumulative total returns, at net asset value, of 1.02%, 0.72%, 0.64%, 1.12% and 0.97%, respectively. Over the same time period, the Fund's benchmark, the Lehman Brothers Three-Year Municipal Bond Index, generated a cumulative total return of 1.31%. |
| Municipal Market Performance |
| During the reporting period, the municipal market generally followed the direction of U.S. Treasury interest rates, with short-term rates increasing, while longer-term rates declined. Although the yield curve inverted in the Treasury market, the municipal market maintained a positive slope, due to the relatively strong demand for 1-10 year bonds. |
| However, overall municipal demand was relatively subdued, as many investors continued to focus on the equity markets and liquidated assets to pay for tax liabilities toward the end of the reporting period. Fortunately, municipal issuance for all of 1999 and into the first quarter of 2000 decreased 21% and 37%, respectively. This was largely a result of lower refunding volume which, in turn, reflected higher interest rates. In addition, although credit trends in the municipal market have been quite positive-with the number of rating agency upgrades far outpacing downgrades-credit spreads widened to five-year highs during the latter part of 1999 and into 2000. This was generally due to a number of technical factors. As we closed out the reporting period, credit spreads began to narrow, as many investors purchased lower-quality issues at attractive levels. |
| Portfolio Composition |
| During the reporting period we increased the Fund's allocation in both the revenue bond and general obligation sectors, while decreasing the pre-refunded and insured sector exposure. In addition, although the overall portfolio credit quality remained in the AA range, we increased our A and BBB exposure in an attempt to take advantage of the attractive credit spreads described above. We also took the opportunity to replace certain bonds in the portfolio with securities we deemed to have more favorable structures, that may also be more defensive in a volatile interest rate environment. |
PERFORMANCE OVERVIEW
The Goldman Sachs Short Duration Tax-Free Fund seeks current income, consistent with low volatility of principal, that is exempt from regular federal income tax, primarily through investments in municipal securities.
| Portfolio Highlights |
| Although the reporting period proved to be a difficult one for the fixed income markets, particularly in the short-end of the yield curve, we are pleased with the Fund's performance relative to its benchmark and peer group. |
| Portfolio Outlook |
| The reporting period ended on a positive note as credit spreads began to narrow and the overall municipal market showed signs of stabilizing. Provided these trends continue, we remain cautiously optimistic on the outlook for the municipal market. Finally, we will continue to look for "value" opportunities in the municipal market and adjust the portfolio as needed. We thank you for your investment and look forward to your continued confidence. |
| Goldman Sachs U.S. Fixed Income -- Municipal Investment Management Team |
| May 9, 2000 |
FUND BASICS
Municipal Income Fund
as of April 30, 2000
Assets Under Management
$106.9 Million
NASDAQ SYMBOLS
Class A Shares
GSMIX
Class B Shares
GSMBX
Class C Shares
GSMUX
Institutional Shares
GSMTX
Service Shares
GSMEX
| |
||
| PERFORMANCE REVIEW | ||
| |
||
| October 31, 1999-
April 30, 2000 |
Fund Total Return
(based on NAV)1 |
30-Day Taxable
Equivalent Yield2 |
30-Day
Standardized Yield3 |
Lehman 15-Year
Muni Bond Index4 |
|||||
|---|---|---|---|---|---|---|---|---|---|
| Class A | 2 | .35% | 7 | .90% | 4 | .77% | 3 | .74% | |
| Class B | 1 | .90% | 7 | .02% | 4 | .24% | 3 | .74% | |
| Class C | 1 | .97% | 7 | .02% | 4 | .24% | 3 | .74% | |
| Institutional | 2 | .56% | 8 | .96% | 5 | .41% | 3 | .74% | |
| Service | 2 | .38% | N/A | N/A | 3 | .74% | |||
| 1 | The net asset value represents the net assets of the Fund (ex-dividend) divided by the total number of shares outstanding. The Fund's performance reflects the reinvestment of dividends and other distributions. |
| 2 | The Taxable Equivalent Yield of the Fund is calculated by dividing the current 30-day Standardized Yield by 1 minus the highest 1999 federal income tax rate of 39.6%. |
| 3 | The 30-Day Standardized Yield of the Fund is calculated by dividing the net investment income per share (as defined by securities industry regulations) earned by the Fund over a 30-day period (ending on the stated month-end date) by the maximum public offering price per share of the Fund on the last day of the period. This number is compounded semiannually and then annualized. This yield does not necessarily reflect income actually earned and distributed by the Fund and, therefore, may not be correlated with the dividends or other distributions paid to shareholders. |
| 4 | The Lehman Brothers 15-Year Municipal Bond Index is a total return performance benchmark for the 15-year maturity, investment-grade tax-exempt bond market. Returns and attributes for the Index are calculated semi-monthly using approximately 5,000 municipal bonds, which are priced by Muller Data Corporation. Please note that the benchmark return reflects performance data from the Fund's first full month of operation (8/1/93), which does not directly correlate with the Fund's performance since its inception. The Index figures do not reflect any fees or expenses. Investors cannot invest directly in the Index. |
| |
||
| STANDARDIZED TOTAL RETURNS | ||
| |
||
| For the period ending 3/31/00 |
Class A |
Class B |
Class C |
Institutional |
Service |
||||||
|---|---|---|---|---|---|---|---|---|---|---|---|
| One Year5 | -7.15%
|
-8.33%
|
-4.41%
|
-2.40%
|
-2.82%
|
||||||
| Five Years5 | 4.57%
|
0.0%
|
0.0%
|
0.0%
|
5.50%
|
||||||
| Since Inception5 | 4.12% | 3.52%
|
2.30%
|
3.41%
|
4.81%
|
||||||
| (7/20/93)
|
(5/1/96)
|
(8/15/97)
|
(8/15/97)
|
(7/20/93)6
|
|||||||
| 5 | The Standardized Total Returns are average annual returns as of the most recent calendar quarter-end. They assume reinvestment of all distributions at net asset value. These returns reflect a maximum initial sales charge of 4.5% for Class A shares, the assumed deferred sales charge for Class B shares (5% maximum declining to 0% after six years), and the assumed deferred sales charge for Class C shares (1% if redeemed within 12 months of purchase). Because Institutional and Service shares do not involve sales charges, such charges have not been applied to their Standardized Total Returns. |
| 6 | Performance data for Service shares prior to 8/15/97 (commencement of operations) is that of Class A shares (excluding the impact of front-end sales charges applicable to Class A shares since Service shares are not subject to any sales charges). Performance of Class A shares in the Fund reflects the expenses applicable to the Fund's Class A shares. The fees applicable to Service shares are different from those applicable to Class A shares which impact performance ratings and rankings for a class of shares. |
| |
||
| Portfolio Composition as of 4/30/007 | ||
| |
||
| Sector Allocation |
Credit Allocation |
||||||
|---|---|---|---|---|---|---|---|
| Insured Revenue Bonds | 26 | .0% | AAA | 47 | .0% | ||
| Revenue Bonds | 41 | .0% | AA | 15 | .0% | ||
| Insured General Obligations | 14 | .0% | A | 19 | .0% | ||
| General Obligations | 13 | .0% | BBB | 19 | .0% | ||
| Pre-Refunded | 4 | .0% | |||||
| VRDN | 2 | .0% | |||||
| 7 | The Fund is actively managed and, as such, its composition may differ over time. Figures represent a percentage of total portfolio investments that have settled and include an offset to cash equivalents relating to all unsettled trades and therefore, may not sum to 100%. |
| Total return figures represent past performance and do not indicate future results, which will vary. The investment return and principal value of an investment will fluctuate and, therefore, an investor's shares, when redeemed, may be worth more or less than their original cost. Performance reflects fee waivers and expense limitations in effect. In their absence, performance would be reduced. |
PERFORMANCE OVERVIEW
Municipal Income Fund
Dear Shareholder,
We are pleased to report on the performance of the Goldman Sachs Municipal Income Fund for the six month period that ended April 30, 2000.
| Performance Review |
| Over the six month reporting period that ended April 30, 2000, the Fund's Class A, B, C, Institutional and Service shares generated cumulative total returns, at net asset value, of 2.35%, 1.90%, 1.97%, 2.56% and 2.38%, respectively. These returns underperformed the 3.74% return generated by the Fund's benchmark, the Lehman Brothers 15-Year Municipal Bond Index. |
| Municipal Market Performance |
| During the reporting period, the municipal market generally followed the direction of U.S. Treasury interest rates, with short-term rates increasing, while longer-term rates declined. Although the yield curve inverted in the Treasury market, the municipal market maintained a positive slope, due to the relatively strong demand for 1-10 year bonds. |
| However, overall municipal demand was relatively subdued, as many investors continued to focus on the equity markets and liquidated assets to pay for tax liabilities toward the end of the reporting period. Fortunately, municipal issuance for all of 1999 and into the first quarter of 2000 decreased 21% and 37%, respectively. This was largely a result of lower refunding volume which, in turn, reflected higher interest rates. In addition, although credit trends in the municipal market have been quite positivew-ith the number of rating agency upgrades far outpacing downgrades-credit spreads widened to five-year highs during the latter part of 1999 and into 2000. This was generally due to a number of technical factors. As we closed out the reporting period, credit spreads began to narrow, as many investors purchased lower-quality issues at attractive levels. |
| Portfolio Composition |
| During the reporting period, we took advantage of market opportunities to refocus the portfolio structure. Specifically, we concentrated on bond structure and credit quality exposure. For example, we attempted to enhance the overall portfolio's structure by replacing bonds that were highly sensitive to interest rate changes (e.g. zero coupon and discount bonds) with more defensive structures such as par and premium bonds. In addition, as credit spreads widened, we increased the Fund's holdings in the BBB bonds and, correspondingly, decreased the AA exposure. The Fund maintained a high overall credit quality profile in the AA range, but is now much more balanced and diversified among the rating categories. Overall, these changes resulted in a higher percentage of revenue bond holdings. |
PERFORMANCE OVERVIEW
The Goldman Sachs Municipal Income Fund seeks a high level of current income exempt from regular federal income tax that is consistent with preservation of capital, primarily through investments in municipal securities.
| Portfolio Highlights |
| With some of the changes mentioned above, we have attempted to refocus the portfolio to be less volatile to interest rate changes, while investing in what we deemed to be "value" opportunities in the market. As a result, we increased the annualized distribution rate by approximately 75 basis points, or 3/4 of a percent, since January 2000, and the Fund's performance significantly improved during the second half of the reporting period. |
| Portfolio Outlook |
| The reporting period ended on a positive note as credit spreads began to narrow and the overall municipal market showed signs of stabilizing. Provided these trends continue, we remain cautiously optimistic on the outlook for the municipal market. Finally, we will continue to look for "value" opportunities in the municipal market and adjust the portfolio as needed. |
| We thank you for your investment and look forward to your continued confidence. |
| Goldman Sachs U.S. Fixed Income -- Municipal Investment Management Team |
| May 9, 2000 |
Fund Basics
High Yield Municipal Fund
as of April 30, 2000
Assets Under Management
$156.3 Million
NASDAQ Symbols
Class A Shares
GHYAX
Class B Shares
GHYBX
Class C Shares
GHYCX
Institutional Shares
GHYIX
| |
||
| Performance Review | ||
| |
||
| April 3, 2000-
April 30, 2000 |
Fund Total Return
(based on NAV)1 |
Lehman High Yield
Muncipal Bond Index2 |
Lehman Municipal
Bond Index2 |
||||
|---|---|---|---|---|---|---|---|
| Class A | 0 | .40% | -0 | .24% | -0 | .59% | |
| Class B | 0 | .44% | -0 | .24% | -0 | .59% | |
| Class C | 0 | .34% | -0 | .24% | -0 | .59% | |
| Institutional | 0 | .43% | -0 | .24% | -0 | .59% | |
| 1 | The net asset value represents the net assets of the Fund (ex-dividend) divided by the total number of shares outstanding. The Fund's performance reflects the reinvestment of dividends and other distributions. |
| 2 | The Lehman Brothers High Yield Municipal Bond Index and the Lehman Brothers Municipal Bond Index are unmanaged and do not reflect any fees or expenses. Investors cannot invest directly in the Index. |
| |
||
| Standardized Total Returns | ||
| |
||
| For the period ending 3/31/00
|
Class A |
Class B |
Class C |
Institutional |
|||||
|---|---|---|---|---|---|---|---|---|---|
| Since Inception3 | N/A
|
N/A
|
N/A
|
N/A
|
|||||
| (4/3/00) | |||||||||
| 3 | The Standardized Total Returns are average annual returns as of the most recent calendar quarter-end. They assume reinvestment of all distributions at net asset value. These returns reflect a maximum initial sales charge of 4.5% for Class A shares, the assumed deferred sales charge for Class B shares (5% maximum declining to 0% after six years), and the assumed deferred sales charge for Class C shares (1% if redeemed within 12 months of purchase). Because Institutional shares do not involve sales charges, such charges have not been applied to their Standardized Total Returns. |
| |
||
| Portfolio Composition as of 4/30/00 4 | ||
| |
||
| Sector Allocation
|
|
Credit Allocation |
|
||||
|---|---|---|---|---|---|---|---|
| Revenue Bonds | 85 | .0% | AA | 15 | .0% | ||
| VRDN | 15 | .0% | BBB | 42 | .0% | ||
| BB | 41 | .0%* | |||||
| B | 2 | .0%* | |||||
| 4 | The Fund is actively managed and, as such, its composition may differ over time. Figures represent a percentage of total portfolio investments that have settled and include an offset to cash equivalents relating to all unsettled trades and therefore, may not sum to 100%. Total return figures represent past performance and do not indicate future results, which will vary. The investment return and principal value of an investment will fluctuate and, therefore, an investor's shares, when redeemed, may be worth more or less than their original cost. Performance reflects expense limitations in effect. In their absence, performance would be reduced. |
| * | Reflects NSRO rating or internal rating if not rated. |
PERFORMANCE OVERVIEW
High Yield Municipal Fund
Dear Shareholder,
We are pleased to report on the performance of the Goldman Sachs High Yield Municipal Fund from its inception through April 30, 2000.
| Performance Review |
| During the short period of time from the Fund's inception on April 3, 2000 through April 30, 2000, the Fund's Class A, B, C and Institutional shares generated cumulative total returns, at net asset value, of 0.40%, 0.44%, 0.34% and 0.43%, respectively. |
| Investment Objective |
| The Fund seeks a high level of current income that is exempt from regular federal income tax, and invests in securities that may also have the potential for capital appreciation. |
| Portfolio Composition |
| The Goldman Sachs High Yield Municipal Fund is now almost fully invested. The Fund's launch date proved to be an attractive entry point into the high yield municipal market, and offered some extremely attractive new issues and secondary market opportunities. |
| We have overweighted the portfolio in both the healthcare and land-secured, or special assessment sectors. We believe both areas offer attractive investment opportunities while our fundamental credit research will seek to mitigate risk. In the healthcare sector we focused on issuers that offer compelling characteristics that we feel are important to their long-term success. These include firms with dominant market positions, respectable balance sheets, strong management teams, and those that generally operate in a reasonable healthcare environment from both a regulatory and competitive perspective. In the land-secured, or special assessment area, we have purchased issues in areas exhibiting strong economic and demographic profiles and strong developers that are in desirable locations. |
| Portfolio Outlook |
| The Fund held 38 different issues by the end of the reporting period, and we look to further diversify the portfolio in the coming months. Looking ahead, the high yield municipal income new issue calendar seems to be expanding for the June/July timeframe. As such, we will selectively invest in securities that we believe offer the greatest long-term potential for Fund shareholders. |
| We thank you for your investment and look forward to your continued confidence. |
| Goldman Sachs U.S. Fixed Income-Municipal Investment Management Team |
| May 9, 2000 |
GOLDMAN SACHS TAX-FREE FUNDS
The Goldman Sachs Advantage
Founded in 1869, Goldman, Sachs & Co. is a premier financial services firm traditionally known on Wall Street and around the world for its institutional expertise.
Today, the firm's Investment Management Division provides individual investors the opportunity to tap the resources of a global institutional powerhouse -- and put this expertise to work in their individual portfolios.
What Sets Goldman Sachs Funds Apart?
| 1
|
| Resources and Relationships
|
Our portfolio management teams are located on-site, around the world, in New York, London, Tokyo and Singapore. Their understanding of local economies, markets, industries and cultures helps deliver what many investors want: access to global investment opportunities and consistent, risk-adjusted performance.
| 2
|
| In-Depth Research
|
Our portfolio management teams make on-site visits to hundreds of companies each month, then construct selective portfolios with an emphasis on their best ideas. Our teams also have access to Goldman, Sachs & Co.'s Global Investment Research Department.
| 3
|
|
| Risk Management
|
In this, our institutional heritage is clear. Institutions, as well as many individual investors, often look to us to manage the risks of global investing over time in different market environments.
To learn more about the Goldman Sachs Funds, call your investment professional today.
Performance Summary
April 30, 2000 (Unaudited)
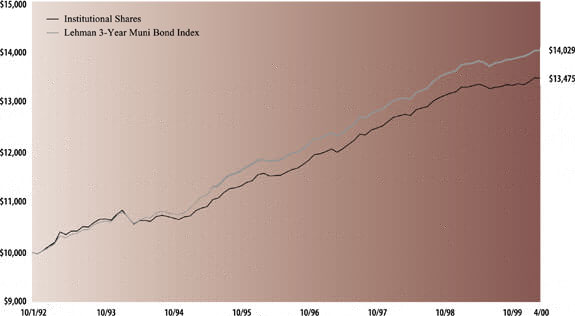
| The following
graph shows the value as of April 30, 2000, of a $10,000 investment made
on October 1, 1992 (commencement of operations) in the Institutional
shares of the Goldman Sachs Short Duration Tax-Free Fund. For comparative
purposes, the performance of the Fund’s benchmark (the Lehman
Brothers 3-Year Municipal Bond Index (“Lehman 3-Year Muni Bond
Index”)) is shown. This performance data represents past performance
and should not be considered indicative of future performance which will
fluctuate with changes in market conditions. These performance
fluctuations will cause an investor’s shares, when redeemed, to be
worth more or less than their original cost. Performance of Class A, Class
B, Class C and Service shares will vary from the Institutional shares due
to differences in fees and loads.
|
| Short Duration Tax-Free
Fund’s Lifetime Performance
|
| Growth of a $10,000
Investment, Distributions Reinvested October 1, 1992 to April 30,
2000.
|
| |
| Average Annual Total Return through April 30, 2000 | Since Inception | Five Years | One Year | Six Months(a) | |||||
|---|---|---|---|---|---|---|---|---|---|
| Class A shares (commenced May 1, 1997) | |||||||||
| Excluding sales charges | 3.45% | n/a | 0.60% | 1.02% | |||||
| Including sales charges | 2.77% | n/a | -1.43% | -0.98% | |||||
| Class B shares (commenced May 1, 1997) | |||||||||
| Excluding contingent deferred sales charges | 2.83% | n/a | 0.00% | 0.72% | |||||
| Including contingent deferred sales charges | 2.49% | n/a | -2.00% | -1.30% | |||||
| Class C shares (commenced August 15, 1997) | |||||||||
| Excluding contingent deferred sales charges | 2.25% | n/a | -0.15% | 0.64% | |||||
| Including contingent deferred sales charges | 2.25% | n/a | -1.15% | -0.37% | |||||
| Institutional shares (commenced October 1, 1992) | 4.01% | 4.31% | 0.90% | 1.12% | |||||
| Service shares (commenced September 20, 1994) | 3.66% | 3.79% | 0.40% | 0.97% | |||||
(a)
|
Not
annualized.
|
| Principal
Amount |
Interest
Rate |
Maturity
Date |
Value | |||||
|---|---|---|---|---|---|---|---|---|
| Debt Obligations – 96.3% | ||||||||
| Arkansas – 2.9% | ||||||||
| Arkansas State
Development Finance Authority Hospital RB
for Washington Regional Medical Center Series 2000 (BBB-/Baa3) |
||||||||
| $ 510,000 | 6.10 | % | 02/01/2004 | $ 508,429 | ||||
| 410,000 | 6.20 | 02/01/2005 | 408,262 | |||||
| 1,140,000 | 6.25 | 02/01/2006 | 1,132,134 | |||||
| $ 2,048,825 | ||||||||
| Colorado – 1.8% | ||||||||
| Larimer County
School District COPS No.1 Poudre Series
1991 D (AAA/Aa3)# |
||||||||
| $1,150,000 | 10.00 | % | 12/01/2001 | $ 1,239,378 | ||||
| Connecticut – 3.1% | ||||||||
| Connecticut State
Health and Educational Facilities RB for
Special Care Issue 1997 B (BBB/Baa2) |
||||||||
| $2,365,000 | 5.13 | % | 07/01/2007 | $ 2,213,522 | ||||
| District of Columbia – 0.7% | ||||||||
| District of Columbia GO Bonds Series 1993 A (BBB/Baa3) | ||||||||
| $ 520,000 | 5.50 | % | 06/01/2001 | $ 522,023 | ||||
| Illinois – 4.3% | ||||||||
| Illinois Health
Facilities Authority RB for Highland Park
Hospital Series A (FGIC) (AAA/Aaa)# |
||||||||
| $1,000,000 | 5.20 | % | 10/01/2001 | $ 1,004,960 | ||||
| Illinois Student
Assistance Community Student Loan RB
Senior Series 2000 TT (Aaa) |
||||||||
| 2,000,000 | 4.90 | 09/01/2002 | 1,997,260 | |||||
| $ 3,002,220 | ||||||||
| Indiana – 10.0% | ||||||||
| Indiana Health
Facilities Financing Authority Hospital RB for
Methodist Hospitals Series 1992 (A2) |
||||||||
| $2,200,000 | 6.75 | % | 09/15/2009 | $ 2,276,648 | ||||
| Logansport
Multi-Purpose School Building Corp. First
Mortgages Series 1992 (A) |
||||||||
| 2,195,000 | 5.90 | 07/01/2005 | 2,253,870 | |||||
| Marion County
Hospital Authority Facility RB for Methodist
Hospitals of Indiana Series 1989 (AAA/Aa3) |
||||||||
| 2,450,000 | 6.50 | 09/01/2013 | 2,488,930 | |||||
| $ 7,019,448 | ||||||||
| Louisiana – 8.1% | ||||||||
| Lake Charles Harbor
and Terminal District Port Facilities RB
for Trunkline Long Project Series 1992 (A3) |
||||||||
| $2,500,000 | 7.75 | % | 08/15/2022 | $ 2,673,375 | ||||
| Louisiana Offshore
Deepwater Port Terminal RB Series 1992
B (A/A3) |
||||||||
| 1,000,000 | 5.85 | 09/01/2000 | 1,002,740 | |||||
| Louisiana State
Correctional Facility Corp. Lease RB Series
1993 (FSA) (AAA/Aaa) |
||||||||
| $2,000,000 | 5.60 | % | 12/15/2003 | $ 2,037,220 | ||||
| $ 5,713,335 | ||||||||
| Principal
Amount |
Interest
Rate |
Maturity
Date |
Value | |||||
|---|---|---|---|---|---|---|---|---|
| Debt Obligations – (continued) | ||||||||
| Maryland – 3.7% | ||||||||
| Maryland State
Health and Higher Educational Facilities
Authority RB Series 1997 (A-)# |
||||||||
| $1,600,000 | 5.50 | % | 01/01/2021 | $ 1,597,856 | ||||
| Maryland State
Health and Higher Educational Facilities
Authority RB Series 1997 (LOC) (A)# |
||||||||
| 1,000,000 | 4.75 | 07/01/2021 | 998,610 | |||||
| $ 2,596,466 | ||||||||
| Massachusetts – 3.7% | ||||||||
| Massachusetts State GO Bonds Series 1995 A (AA-/Aa2) | ||||||||
| $2,500,000 | 6.25 | % | 07/01/2003 | $ 2,593,825 | ||||
| Missouri – 2.4% | ||||||||
| St. Louis Municipal
Finance Leasehold RB Series 1993 A
(AMBAC) (AAA/Aaa) |
||||||||
| $1,655,000 | 5.30 | % | 07/15/2002 | $ 1,670,276 | ||||
| Nebraska – 2.5% | ||||||||
| Nebraska Investment
Finance Authority MF Hsg. for Wycliffe
West RB Series 1995 A (FNMA) (AAA)# |
||||||||
| $1,720,000 | 5.50 | % | 12/01/2025 | $ 1,735,360 | ||||
| New Jersey – 3.2% | ||||||||
| New Jersey Economic
Development Authority RB First
Mortgage Keswick Pines Project Series 1993 (AAA/Aaa) |
||||||||
| $1,975,000 | 8.75 | % | 01/01/2024 | $ 2,245,930 | ||||
| New York – 8.7% | ||||||||
| New York GO Bonds Series 1991 B (A-/A3) | ||||||||
| $2,000,000 | 7.50 | % | 02/01/2003 | $ 2,114,320 | ||||
| New York GO Bonds Series 1992 A (A-/A3) | ||||||||
| 1,000,000 | 6.25 | 08/01/2003 | 1,033,290 | |||||
| New York State COPS Series 1999 (A/Baa1) | ||||||||
| 3,000,000 | 5.00 | 09/01/2001 | 3,006,270 | |||||
| $ 6,153,880 | ||||||||
| North Carolina – 0.7% | ||||||||
| North Carolina
Municipal Power Agency RB for No.1
Catawba Electric Revenue Series 1992 (BBB+/Baa1) |
||||||||
| $ 480,000 | 5.90 | % | 01/01/2003 | $ 482,179 | ||||
| Ohio – 5.7% | ||||||||
| Ohio Air Quality
Development Authority RB for Ohio Edison
Co. Series 1999 C (BB-/Baa3)# |
||||||||
| $1,000,000 | 5.80 | % | 06/01/2016 | $ 1,012,670 | ||||
| Ohio GO Bonds for
Higher Educational Capital Facilities
Series 2000 A (AA+/Aa1) |
||||||||
| 3,000,000 | 5.00 | 02/01/2004 | 3,002,820 | |||||
| $ 4,015,490 | ||||||||
| Pennsylvania – 10.5% | ||||||||
| Delaware County IDA
PCRB for Peco Energy Co. Project
Series 1999 A (BBB+/Baa2)# |
||||||||
| $1,250,000 | 5.20 | % | 04/01/2021 | $ 1,216,263 | ||||
| Pennsylvania GO Bonds Series 1992 (AA/Aa3) | ||||||||
| 2,500,000 | 6.30 | 09/15/2005 | 2,596,250 | |||||
| Principal
Amount |
Interest
Rate |
Maturity
Date |
Value | |||||
|---|---|---|---|---|---|---|---|---|
| Debt Obligations – (continued) | ||||||||
| Pennsylvania – (continued) | ||||||||
| Philadelphia Water
and Wastewater RB Prerefunded Series
1993 (FGIC) (AAA) |
||||||||
| $3,450,000 | 5.65 | 06/15/2012 | $ 3,580,030 | |||||
| $ 7,392,543 | ||||||||
| South Carolina – 3.6% | ||||||||
| Georgetown County
PCRB for International Paper Co.
Project Series 1992 (BBB+/Baa1) |
||||||||
| $2,500,000 | 6.25 | % | 06/15/2005 | $ 2,566,775 | ||||
| Tennessee – 8.0% | ||||||||
| Clarksville Public
Building Authority RB for Pooled Loan
Program Series 1993 (AA) |
||||||||
| $1,500,000 | 4.75 | % | 12/01/2000 | $ 1,502,910 | ||||
| East Ridge
Industrial Development Board RB for The Kroger
Co. Series 1993 (Baa3) |
||||||||
| 1,000,000 | 5.75 | 09/01/2000 | 1,001,640 | |||||
| Elizabethton Health
and Educational Facilities Board RB First
Mortgage Series 2000 B (MBIA) (AAA/Aaa) |
||||||||
| 1,330,000 | 5.00 | 07/01/2003 | 1,324,161 | |||||
| Johnson City Health
and Educational Facilities Board Hospital
RB First Mortgage Series 2000 A (MBIA) (AAA/Aaa) |
||||||||
| 1,785,000 | 5.00 | 07/01/2003 | 1,777,164 | |||||
| $ 5,605,875 | ||||||||
| Texas – 5.0% | ||||||||
| Memorial Villages
Water Authority GO Bonds Series 1990
(Aa3)# |
||||||||
| $ 390,000 | 7.00 | % | 09/01/2000 | $ 392,121 | ||||
| Titus County Fresh
Water RB for Southwestern Electric Power
Co. Series 1991 A (A1) |
||||||||
| 2,945,000 | 8.20 | 08/01/2011 | 3,121,229 | |||||
| $ 3,513,350 | ||||||||
| Washington – 4.0% | ||||||||
| Washington Public
Power Supply System RB for Nuclear
Project No.3 Series 1998 A (AA-/Aa1) |
||||||||
| $2,850,000 | 5.00 | % | 07/01/2002 | $ 2,841,165 | ||||
| Principal
Amount |
Interest
Rate |
Maturity
Date |
Value | |||||
|---|---|---|---|---|---|---|---|---|
| Debt Obligations – (continued) | ||||||||
| Wisconsin – 3.7% | ||||||||
| Wisconsin GO Bonds Series 1992 (AA/Aa2) | ||||||||
| $1,300,000 | 6.10 | % | 05/01/2004 | $ 1,349,764 | ||||
| Wisconsin State
Health and Educational Facility RB for
Medical College of Wisconsin Series 1993 (A) |
||||||||
| 1,240,000 | 5.30 | 12/01/2003 | 1,242,344 | |||||
| $ 2,592,108 | ||||||||
| TOTAL DEBT OBLIGATIONS | ||||||||
| (Cost $68,564,990) | $67,763,973 | |||||||
| Short-Term Obligation – 1.4% | ||||||||
| California – 1.4% | ||||||||
| Sacramento County
Housing Authority MF Hsg. RB for
Rancho Natomas Apartments Series 1 (LOC) (A3)#" |
||||||||
| $1,000,000 | 4.80 | % | 12/15/2000 | $ 1,000,000 | ||||
| TOTAL SHORT-TERM OBLIGATION | ||||||||
| (Cost $1,000,000) | $ 1,000,000 | |||||||
| TOTAL INVESTMENTS | ||||||||
| (Cost $69,564,990) | $68,763,973 | |||||||
| #
|
Variable rate
security. Coupon rate disclosed is that which is in effect at April 30,
2000.
|
|
| " | Security with “Put” features with resetting interest rates. Maturity dates disclosed are the next reset dates. |
| The percentage
shown for each investment category reflects the value of investments in
that category as a percentage of net assets.
|
| |
| Investment Abbreviations: | |||
| AMBAC | —Insured by
American Municipal Bond
Assurance Corp. |
||
| COPS | —Certificates of Participation | ||
| FGIC | —Insured by Financial Guaranty Insurance Co. | ||
| FNMA | —Insured by
Federal National Mortgage
Association |
||
| FSA | —Insured by Financial Security Assurance Co. | ||
| GO | —General Obligation | ||
| IDA | —Industrial Development Authority | ||
| LOC | —Letter of Credit | ||
| MBIA | —Insured by
Municipal Bond Investors
Assurance |
||
| MF Hsg. | —Multi-Family Housing | ||
| PCRB | —Pollution Control Revenue Bond | ||
| RB | —Revenue Bond | ||
| The following
graph shows the value as of April 30, 2000, of a $10,000 investment made
on August 1, 1993 in Class A shares (with the maximum sales charge of
4.5%) of the Goldman Sachs Municipal Income Fund. For comparative
purposes, the performance of the Fund’s benchmark (the Lehman
Brothers 15-Year Municipal Bond Index (“Lehman 15-Year Muni
Index”)) is shown. This performance data represents past performance
and should not be considered indicative of future performance which will
fluctuate with changes in market conditions. These performance
fluctuations will cause an investor’s shares, when redeemed, to be
worth more or less than their original cost. Performance of Class B, Class
C, Institutional and Service shares will vary from Class A shares due to
differences in fees and loads.
|
| Municipal Income
Fund’s Lifetime Performance
|
| Growth of a $10,000
Investment, Distributions Reinvested August 1, 1993 to April 30,
2000.(a)
|
| |
| Average Annual Total Return through April 30, 2000 | Since Inception | Five Years | One Year | Six Months (b) | |||||
|---|---|---|---|---|---|---|---|---|---|
| Class A shares (commenced July 20, 1993) | |||||||||
| Excluding sales charges | 4.67% | 5.35% | -3.38% | 2.35% | |||||
| Including sales charges | 3.96% | 4.39% | -7.73% | -2.23% | |||||
| Class B shares (commenced May 1, 1996) | |||||||||
| Excluding contingent deferred sales charges | 4.02% | n/a | -4.10% | 1.90% | |||||
| Including contingent deferred sales charges | 3.24% | n/a | -8.88% | -3.19% | |||||
| Class C shares (commenced August 15, 1997) | |||||||||
| Excluding contingent deferred sales charges | 1.93% | n/a | -4.03% | 1.97% | |||||
| Including contingent deferred sales charges | 1.93% | n/a | -4.99% | 0.95% | |||||
| Institutional shares (commenced August 15, 1997) | 3.05% | n/a | -2.99% | 2.56% | |||||
| Service shares (commenced August 15, 1997) | 2.70% | n/a | -3.39% | 2.38% | |||||
(a)
|
For comparative
purposes, initial investments are assumed to be made on the first day of
the month following the commencement of operations.
|
(b)
|
Not
annualized.
|
| Principal
Amount |
Interest
Rate |
Maturity
Date |
Value | |||||
|---|---|---|---|---|---|---|---|---|
| Debt Obligations – 95.6% | ||||||||
| Arizona – 4.2% | ||||||||
| Maricopa County MF
Hsg. IDA RB for Place Five and
Greenery Apartments Series 1996 A (AAA) |
||||||||
| $1,795,000 | 5.85 | % | 01/01/2008 | $ 1,842,747 | ||||
| Maricopa County
United School District RB No. 41 (FSA)
(AAA/Aaa) |
||||||||
| 2,500,000 | 6.25 | 07/01/2015 | 2,615,250 | |||||
| $ 4,457,997 | ||||||||
| Arkansas – 4.6% | ||||||||
| Arkansas
Development Finance Authority Hospital RB for
Washington Regional Medical Center Series 2000 (BBB-/Baa3) |
||||||||
| $5,000,000 | 7.25 | % | 02/01/2020 | $ 4,940,150 | ||||
| Colorado – 2.7% | ||||||||
| Aurora Centretech
Metropolitan District Series 1998 C (LOC)
(A+)# |
||||||||
| $2,000,000 | 4.88 | % | 12/01/2028 | $ 1,902,200 | ||||
| Denver City and
County Special Facilities Airport RB for
United Air Lines Project Series 1992 A (AMT) (BB+/Baa3) |
||||||||
| 1,000,000 | 6.88 | 10/01/2032 | 982,730 | |||||
| $ 2,884,930 | ||||||||
| Connecticut – 1.0% | ||||||||
| Mashantucket
Western Pequot Tribe Prerefunded RB Series
1996 A (AAA/Aaa) |
||||||||
| $1,000,000 | 6.50 | % | 09/01/2005 | $ 1,071,240 | ||||
| Florida – 3.0% | ||||||||
| Port Everglades Authority RB Series 1986 (AAA/Aaa) | ||||||||
| $2,785,000 | 7.13 | % | 11/01/2016 | $ 3,211,996 | ||||
| Illinois – 11.2% | ||||||||
| Chicago Midway
Airport RB Series 1996 A (MBIA)
(AAA/Aaa) |
||||||||
| $2,500,000 | 5.50 | % | 01/01/2010 | $ 2,525,850 | ||||
| Illinois Education
Facilities Authority RB for Midwestern
University Series 1998 B (ACA) (A) |
||||||||
| 2,500,000 | 5.50 | 05/15/2028 | 2,215,650 | |||||
| Lake County
Community Consolidated School District No. 041
GO Bonds Series 1999 A (FSA) (AAA/Aaa) |
||||||||
| 2,725,000 | 9.00 | 11/01/2016 | 3,692,756 | |||||
| Lake County Unified
School District No. 116 Round Lake GO
Bonds Series 1996 (FSA) (AAA/Aaa) |
||||||||
| 1,000,000 | 7.60 | 02/01/2013 | 1,182,120 | |||||
| 2,000,000 | 7.60 | 02/01/2014 | 2,355,980 | |||||
| $ 11,972,356 | ||||||||
| Indiana – 1.3% | ||||||||
| Indiana Bond Bank
for Hendricks County RB Series 1997 B
(LOC) (AA-) |
||||||||
| $1,420,000 | 6.00 | % | 02/01/2012 | $ 1,353,913 | ||||
| Principal
Amount |
Interest
Rate |
Maturity
Date |
Value | |||||
|---|---|---|---|---|---|---|---|---|
| Debt Obligations – (continued) | ||||||||
| Kentucky – 1.0% | ||||||||
| Nelson County
Industrial Building RB for Mabex Universal
Corp. Project Series 1995 (AMT) (LOC) (Aa3) |
||||||||
| $1,000,000 | 6.50 | % | 04/01/2005 | $ 1,022,230 | ||||
| Louisiana – 1.7% | ||||||||
| Orleans Levee
District Public Improvement RB Series 1995
(FSA) (AAA/Aaa)# |
||||||||
| $1,785,000 | 5.95 | % | 11/01/2015 | $ 1,837,015 | ||||
| Maine – 0.5% | ||||||||
| Maine Educational
Loan Authority RB Series 1992 A-1
(AMT) (Aaa) |
||||||||
| $ 505,000 | 6.80 | % | 12/01/2007 | $ 524,508 | ||||
| Michigan – 4.2% | ||||||||
| Michigan Higher
Educational Facility RB for the
Thomas M. Cooley Law School Series 1998 (LOC) (A+) |
||||||||
| $4,000,000 | 5.40 | % | 05/01/2018 | $ 3,639,960 | ||||
| Oakland County
Economic Development Corp. RB for
Cranbrook Community Series 1998 (Aa2) |
||||||||
| 1,000,000 | 5.00 | 11/01/2017 | 897,850 | |||||
| $ 4,537,810 | ||||||||
| Mississipi – 2.0% | ||||||||
| Mississippi
Business Finance Corp. PCRB for Systems Energy
Resources Inc. Project Series 1998 (BBB-/Ba1) |
||||||||
| $2,500,000 | 5.88 | % | 04/01/2022 | $ 2,148,325 | ||||
| Nevada – 3.9% | ||||||||
| Las Vegas New
Convention and Visitors Authority RB Series
1999 (AMBAC) (AAA/Aaa) |
||||||||
| $2,500,000 | 6.00 | % | 07/01/2014 | $ 2,577,250 | ||||
| Washoe County GO
Bonds for Reno Sparks Convention Series
2000 A (FSA) (AAA/Aaa) |
||||||||
| 1,585,000 | 6.38 | 07/01/2023 | 1,632,455 | |||||
| $ 4,209,705 | ||||||||
| New Hampshire – 1.5% | ||||||||
| New Hampshire IDA
RB Public Service Co. New Hampshire
Project Series 1991 A (BBB-/Ba3) |
||||||||
| $1,085,000 | 7.65 | % | 05/01/2021 | $ 1,112,657 | ||||
| New Hampshire IDA
RB Public Service Co. New Hampshire
Project Series 1991 C (BBB-/Ba3) |
||||||||
| 510,000 | 7.65 | 05/01/2021 | 523,000 | |||||
| $ 1,635,657 | ||||||||
| New Mexico – 5.5% | ||||||||
| Farmington PCRB
Public Service Co. New Mexico San Juan
Project Series 1997 D (Baa3) |
||||||||
| $2,760,000 | 5.80 | % | 04/01/2022 | $ 2,487,201 | ||||
| Farmington PCRB
Public Service Co. New Mexico Series
1997 D (BBB-/Baa3) |
||||||||
| 3,530,000 | 6.38 | 04/01/2022 | 3,351,241 | |||||
| $ 5,838,442 | ||||||||
| Principal
Amount |
Interest
Rate |
Maturity
Date |
Value | |||||
|---|---|---|---|---|---|---|---|---|
| Debt Obligations – (continued) | ||||||||
| New York – 12.4% | ||||||||
| Babylon Waste
Facilites GO Bonds Series 1993 (FGIC)
(AAA/Aaa) |
||||||||
| $3,000,000 | 9.00 | % | 08/01/2011 | $ 3,909,150 | ||||
| New York City
Transitional Financial Authority RB
Future Tax Secured Series 2000 B (AA/Aa3) |
||||||||
| 1,910,000 | 6.00 | 11/15/2024 | 1,927,133 | |||||
| New York GO Bonds Series 1996 G (A-/A3) | ||||||||
| 3,900,000 | 5.75 | 02/01/2014 | 3,909,243 | |||||
| New York GO Bonds Series 1997 J (A-/A3) | ||||||||
| 2,000,000 | 6.00 | 08/01/2017 | 2,027,020 | |||||
| New York State
Dormitory Authority RB for North Shore
University Hospital Series 1998 (MBIA) (AAA/Aaa) |
||||||||
| 1,500,000 | 5.50 | 11/01/2014 | 1,493,670 | |||||
| $ 13,266,216 | ||||||||
| North Dakota – 1.9% | ||||||||
| Mercer County PCRB
for Basin Electric and Power Series
1995-2 (AMBAC) (AAA/Aaa) |
||||||||
| $2,000,000 | 6.05 | % | 01/01/2019 | $ 2,018,020 | ||||
| Ohio – 2.9% | ||||||||
| Cuyahoga County
Port Authority RB for Rock and Roll Hall
of Fame Series 1997 |
||||||||
| $ 600,000 | 5.45 | % | 12/01/2005 | $ 587,742 | ||||
| Ohio Air Quality
Development Authority RB for Ohio Edison
Co. Series 1999 C (BB-/Baa3) # |
||||||||
| 2,500,000 | 5.80 | 06/01/2016 | 2,531,675 | |||||
| $ 3,119,417 | ||||||||
| Pennsylvania – 1.1% | ||||||||
| Delaware County IDA
PCRB for Peco Energy Co. Project
Series 1999 A (BBB+/Baa2) # |
||||||||
| $1,250,000 | 5.20 | % | 04/01/2021 | $ 1,216,262 | ||||
| Tennessee – 8.1% | ||||||||
| Elizabethton Health
and Educational Board RB First Mortgage
Series 2000 B (MBIA) (AAA/Aaa) |
||||||||
| $2,000,000 | 6.25 | % | 07/01/2015 | $ 2,105,900 | ||||
| Johnson City Health
and Educational Facilities Board Hospital
RB First Mortgage Series 2000 A (MBIA) (AAA/Aaa) |
||||||||
| 3,000,000 | 6.25 | 07/01/2016 | 3,142,770 | |||||
| McMinnville Housing
Authority RB First Mortgage for
Beersheba Heights Tower Series 1997 (A2) |
||||||||
| 1,280,000 | 6.00 | 10/01/2009 | 1,288,141 | |||||
| Tennessee Housing
Development Agency for Homeownership
Program 1 Series 2000 (AMT) (AA/Aa2) |
||||||||
| 2,130,000 | 5.85 | 07/01/2011 | 2,147,104 | |||||
| $ 8,683,915 | ||||||||
| Principal
Amount |
Interest
Rate |
Maturity
Date |
Value | |||||
|---|---|---|---|---|---|---|---|---|
| Debt Obligations – (continued) | ||||||||
| Texas – 7.0% | ||||||||
| Gregg County Health
Facilities Development Corp. RB for
Good Shephard Medical Center Project Series 2000 (AA/Baa2) |
||||||||
| $3,000,000 | 6.38 | % | 10/01/2025 | $ 2,968,110 | ||||
| Harris County MF
Hsg. RB for Windfern Apartments Series
1999 A (A) |
||||||||
| 4,000,000 | 5.90 | 07/01/2019 | 3,689,760 | |||||
| Waxahachie
Independent School District GO Bonds Series
2000 (PSF) (Aaa)° |
||||||||
| 1,855,000 | 6.25 | 08/15/2013 | 836,568 | |||||
| $ 7,494,438 | ||||||||
| Washington – 8.6% | ||||||||
| Chelan County
Public Utilities District No. 001 RB for Chelan
Hydro Project Series 1997 D (AMT) (MBIA) (AAA/Aaa) |
||||||||
| $2,500,000 | 6.35 | % | 07/01/2028 | $ 2,555,825 | ||||
| King County Sewer RB Series 1999-2 (FGIC) (AAA/Aaa) | ||||||||
| 3,965,000 | 6.25 | 01/01/2016 | 4,116,027 | |||||
| Washington Public
Power Supply System RB for Nuclear
Project No. 2 Series 1996 A (AMBAC) (AAA/Aaa) |
||||||||
| 2,500,000 | 5.70 | 07/01/2011 | 2,524,275 | |||||
| $ 9,196,127 | ||||||||
| Wisconsin – 5.3% | ||||||||
| Wisconsin State GO Bonds Series 1999 C (AA/Aa2) | ||||||||
| $5,380,000 | 6.25 | % | 05/01/2015 | $ 5,642,329 | ||||
| TOTAL DEBT OBLIGATIONS | ||||||||
| (Cost $102,977,487) | $ 102,282,998 | |||||||
| Short-Term Obligation – 2.6% | ||||||||
| Texas – 2.6% | ||||||||
| Harris County
Health Facilities Development Corp. RB VRDN
for Methodist Hospital Series 1994 (Morgan Guaranty Trust SPA) (AA/A-1+)# |
||||||||
| $2,800,000 | 5.80 | % | 05/01/2000 | $ 2,800,000 | ||||
| TOTAL SHORT-TERM OBLIGATION | ||||||||
| (Cost $2,800,000) | $ 2,800,000 | |||||||
| TOTAL INVESTMENTS | ||||||||
| (Cost $105,777,487) | $ 105,082,998 | |||||||
| |
#
|
Variable rate
security. Coupon rate disclosed is that which is in effect at April 30,
2000.
|
°
|
Security is issued
with a zero coupon. The interest rate disclosed for this security
represents effective yield to maturity.
|
| The percentage
shown for each investment category reflects the value of investments in
that category as a percentage of net assets.
|
| |
| Investment Abbreviations: | |||
| ACA | —Insured by American Capital Access | ||
| AMBAC | —Insured by
American Municipal Bond
Assurance Corp. |
||
| AMT | —Alternative Minimum Tax | ||
| FGIC | —Insured by Financial Guaranty Insurance Co. | ||
| FSA | —Insured by Financial Security Assurance Co. | ||
| GO | —General Obligation | ||
| IDA | —Industrial Development Authority | ||
| LOC | —Letter of Credit | ||
| MBIA | —Insured by
Municipal Bond Investors
Assurance |
||
| MF Hsg. | —Multi-Family Housing | ||
| PCRB | —Pollution Control Revenue Bond | ||
| PSF | —Guaranteed by Permanent School Fund | ||
| RB | —Revenue Bond | ||
| VRDN | —Variable Rate Demand Note | ||
| Principal
Amount |
Interest
Rate |
Maturity
Date |
Value | |||||
|---|---|---|---|---|---|---|---|---|
| Debt Obligations – 94.6% | ||||||||
| Arizona – 2.8% | ||||||||
| Pima County IDA RB
for Tucson Electric Power Co. Project
Series 1997 B (B+/Ba3) |
||||||||
| $ 5,000,000 | 6.00 | % | 09/01/2029 | $ 4,367,600 | ||||
| California – 0.8% | ||||||||
| Chula Vista
Community Facilities District RB No. 99-1-Otay
Series 2000 |
||||||||
| $ 1,225,000 | 7.63 | % | 09/01/2029 | $ 1,237,017 | ||||
| Colorado – 2.9% | ||||||||
| Denver City and
County Special Facilities Airport RB for
United Air Lines Project Series 1992 A (AMT) (BB+/Baa3) |
||||||||
| $ 1,620,000 | 6.88 | % | 10/01/2032 | $ 1,592,023 | ||||
| Saddle Rock South
Metropolitan GO Bonds Ltd. Mill Levy
Obligation Series 2000 |
||||||||
| 3,000,000 | 7.20 | 12/01/2019 | 2,973,600 | |||||
| $ 4,565,623 | ||||||||
| Connecticut – 0.4% | ||||||||
| Connecticut Health
and Educational Facility Authority RB for
St. Mary’s Hospital Corp. Series 1997 E (Baa1) |
||||||||
| $ 695,000 | 5.88 | % | 07/01/2022 | $ 587,560 | ||||
| Florida – 24.5% | ||||||||
| Arbor Greene Community Development District RB Series 2000 | ||||||||
| $ 2,000,000 | 6.50 | % | 05/01/2007 | $ 1,976,220 | ||||
| Brooks of Bonita
Springs Community Development District
RB for Capital Improvements Series 2000 A |
||||||||
| 6,000,000 | 7.00 | 05/01/2031 | 5,984,940 | |||||
| Fleming Island Plantation BAN Series 2000 | ||||||||
| 7,500,000 | 6.30 | 09/01/2000 | 7,488,225 | |||||
| Mediterra South
Community Development District RB for
Capital Improvement Series 1999 B |
||||||||
| 2,000,000 | 6.25 | 05/01/2004 | 1,986,100 | |||||
| Mediterra South
Community Development District RB for
Capital Improvement Series 1999 A |
||||||||
| 500,000 | 6.95 | 05/01/2031 | 488,175 | |||||
| Orlando Special
Assessment RB Conroy Road Interchange
Project Series 1998 A |
||||||||
| 3,250,000 | 5.80 | 05/01/2026 | 2,784,438 | |||||
| Parkway Center
Community Development District Special
Assessment Series 2000 A |
||||||||
| 905,000 | 8.25 | 05/01/2031 | 902,728 | |||||
| Parkway Center
Community Development District Special
Assessment Series 2000 B |
||||||||
| 10,000,000 | 8.00 | 05/01/2010 | 9,807,000 | |||||
| Poinciana Community
Development District Special
Assessment Series 2000 A |
||||||||
| 7,000,000 | 7.13 | 05/01/2031 | 6,832,840 | |||||
| $ 38,250,666 | ||||||||
| Hawaii – 1.9% | ||||||||
| Hawaii County
Improvement District RB No. 17 Special
Assessment Kaloko Subdivision Series 1991 |
||||||||
| $ 3,000,000 | 9.50 | % | 08/01/2011 | $ 3,018,990 | ||||
| Principal
Amount |
Interest
Rate |
Maturity
Date |
Value | |||||
|---|---|---|---|---|---|---|---|---|
| Debt Obligations – (continued) | ||||||||
| Kentucky – 0.2% | ||||||||
| Kentucky Economic
Development Finance Authority RB for
Appalachian Regional Health Care Series 1997 (BB-) |
||||||||
| $ 500,000 | 5.70 | % | 10/01/2010 | $ 385,860 | ||||
| Louisiana – 4.1% | ||||||||
| Louisiana Health
and Educational Authority RB for Lambeth
House Series 1998 A |
||||||||
| $ 6,715,000 | 5.25 | % | 01/01/2005 | $ 6,341,445 | ||||
| Maryland – 0.3% | ||||||||
| Prince Georges
County RB for Dimensions Health Corp.
Project Series 1994 (Baa1) |
||||||||
| $ 560,000 | 5.30 | % | 07/01/2024 | $ 401,649 | ||||
| Minnesota – 2.8% | ||||||||
| Maplewood Health
Care Facility RB HealthEast Project Series
1996 (BBB-/Ba1) |
||||||||
| $ 945,000 | 5.80 | % | 11/15/2003 | $ 908,872 | ||||
| St Paul Housing and
Redevelopment Hospital Authority RB
for Healtheast Project Series 1993 A (BBB-/Ba1) |
||||||||
| 3,920,000 | 6.63 | 11/01/2017 | 3,407,225 | |||||
| $ 4,316,097 | ||||||||
| Mississipi – 2.7% | ||||||||
| Mississippi
Business Finance Corp. PCRB for Systems Energy
Resources Inc. Project Series 1998 (BBB-/Ba1) |
||||||||
| $ 5,000,000 | 5.88 | % | 04/01/2022 | $ 4,296,650 | ||||
| New Hampshire – 0.6% | ||||||||
| New Hampshire
Higher Educational and Health Facility
Authority RB St. Joseph’s Hospital Series 1991 (BBB+/Baa2) |
||||||||
| $ 1,000,000 | 7.50 | % | 01/01/2016 | $ 1,013,020 | ||||
| New Jersey – 6.4% | ||||||||
| New Jersey Economic
Development Authority RB Continental
Airlines Inc. Project Series 1999 (AMT) (BB/Ba2) |
||||||||
| $11,000,000 | 6.25 | % | 09/15/2029 | $ 10,012,420 | ||||
| New Mexico – 2.8% | ||||||||
| Farmington PCRB
Public Service Co. San Juan Series 1996 B
(BBB-/Baa3) |
||||||||
| $ 1,500,000 | 6.30 | % | 12/01/2016 | $ 1,469,730 | ||||
| Farmington PCRB
Tucson Electric Power Co. San Juan Series
1997 A (B+/Ba3) |
||||||||
| 3,000,000 | 6.95 | 10/01/2020 | 2,960,040 | |||||
| $ 4,429,770 | ||||||||
| Ohio – 4.4% | ||||||||
| Cleveland Airport
Special RB for Continental Airlines Inc.
Series 1999 (AMT) (Ba2) |
||||||||
| $ 8,020,000 | 5.70 | % | 12/01/2019 | $ 6,897,280 | ||||
| Principal
Amount |
Interest
Rate |
Maturity
Date |
Value | |||||
|---|---|---|---|---|---|---|---|---|
| Debt Obligations – (continued) | ||||||||
| Oklahoma – 5.6% | ||||||||
| Oklahoma
Development Finance Authority RB for Hillcrest
Healthcare Systems Series 1999 A (BBB/Baa2) |
||||||||
| $ 5,825,000 | 5.63 | % | 08/15/2029 | $ 4,517,811 | ||||
| Oklahoma
Development Finance Authority RB for Hillcrest
Healthcare Systems Series 1999 A (BBB/Baa2) |
||||||||
| 5,320,000 | 5.63 | 08/15/2019 | 4,290,261 | |||||
| $ 8,808,072 | ||||||||
| South Carolina – 17.4% | ||||||||
| South Carolina Jobs
Economic Development Authority RB
Palmetto Health Alliance Series 2000 A (BBB/Baa1) |
||||||||
| $ 3,500,000 | 7.00 | % | 12/15/2010 | $ 3,487,470 | ||||
| 12,000,000 | 7.13 | 12/15/2015 | 11,822,760 | |||||
| 12,000,000 | 7.38 | 12/15/2021 | 11,862,240 | |||||
| $ 27,172,470 | ||||||||
| Tennessee – 11.2% | ||||||||
| Elizabethton Health
and Educational Facility Board RB First
Mortgage Series B (AAA/Baa2) |
||||||||
| $17,170,000 | 8.00 | % | 07/01/2033 | $ 17,518,551 | ||||
| Wisconsin – 0.8% | ||||||||
| Wisconsin Health
and Educational Facility Authority RB
Aurora Health Care Series 1999 B (BBB+) |
||||||||
| $ 1,500,000 | 5.63 | % | 02/15/2020 | $ 1,263,075 | ||||
| U. S. Virgin Islands – 2.0% | ||||||||
| Virgin Islands
Public Finance Authority RB Subordinated
Lien-Fund Loan Notes Series 1998 D |
||||||||
| $ 2,000,000 | 6.00 | % | 10/01/2004 | $ 1,979,860 | ||||
| Virgin Islands
Public Finance Authority RB Subordinated
Lien-Fund Loan Notes Series 1998 D |
||||||||
| 1,100,000 | 6.00 | 10/01/2005 | 1,082,631 | |||||
| $ 3,062,491 | ||||||||
| TOTAL DEBT OBLIGATIONS | ||||||||
| (Cost $148,139,358) | $147,946,306 | |||||||
| Short-Term Obligations – 15.5% | ||||||||
| Alabama – 2.5% | ||||||||
| Columbia IDA VRDN
PCRB for Alabama Power Co. Project
Series 1995 A (A/A2)# |
||||||||
| $ 4,000,000 | 5.80 | % | 05/01/2000 | $ 4,000,000 | ||||
| New York – 0.4% | ||||||||
| New York City GO
Bonds VRDN Series 1993 B (SPA-FGIC)
(AAA/Aaa)# |
||||||||
| $ 600,000 | 6.10 | % | 05/01/2000 | $ 600,000 | ||||
| North Carolina – 4.9% | ||||||||
| Wake County
Industrial Facilities VRDN PCRB Carolina
Power and Light Co. Project Series 1987 (LOC) (P1)# |
||||||||
| $ 7,600,000 | 6.10 | % | 05/01/2000 | $ 7,600,000 | ||||
| Principal
Amount |
Interest
Rate |
Maturity
Date |
Value | |||||
|---|---|---|---|---|---|---|---|---|
| Short-Term Obligations – 15.5% | ||||||||
| Texas – 7.7% | ||||||||
| Brazos River
Authority PCRB for Texas Utility Electric Co.
Series 1999 A (AMT) (BBB+/A3)#" |
||||||||
| $5,000,000 | 5.00 | % | 04/01/2001 | $ 5,000,000 | ||||
| Sabine River
Authority PCRB for Texas Utilities Electric Co.
Project Series 1995 C (AMT) (LOC) (AA+/Aa1)# |
||||||||
| 7,000,000 | 6.15 | 05/01/2000 | 7,000,000 | |||||
| $ 12,000,000 | ||||||||
| TOTAL SHORT-TERM OBLIGATIONS | ||||||||
| (Cost $24,200,000) | $ 24,200,000 | |||||||
| TOTAL INVESTMENTS | ||||||||
| (Cost $172,339,358) | $172,146,306 | |||||||
#
|
Variable rate
security. Coupon rate disclosed is that which is in effect at April 30,
2000.
|
"
|
Security with
“Put” features with resetting interest rates. Maturity dates
disclosed are the next interest reset dates.
|
| The percentage
shown for each investment category reflects the value of investments in
that category as a percentage of net assets.
|
| |
| Investment Abbreviations: | |||
| AMT | —Alternative Minimum Tax | ||
| BAN | —Bond Anticipation Note | ||
| GO | —General Obligation | ||
| IDA | —Industrial Development Authority | ||
| LOC | —Letter of Credit | ||
| PCRB | —Pollution Control Revenue Bond | ||
| RB | —Revenue Bond | ||
| SPA-FGIC | —Stand by
Purchase Agreement Insured by
Financial Guaranty Insurance Co. |
||
| VRDN | —Variable Rate Demand Note | ||
| Short Duration
Tax-Free Fund |
Municipal
Income Fund |
High Yield
Municipal Fund |
|||||||||||||||||
|---|---|---|---|---|---|---|---|---|---|---|---|---|---|---|---|---|---|---|---|
| Assets: | |||||||||||||||||||
| Investment in
securities, at value (identified cost $69,564,990, $105,777,487 and
$172,339,358, respectively) |
$68,763,973 | $105,082,998 | $172,146,306 | ||||||||||||||||
| Cash | 130,162 | 53,375 | 56,859 | ||||||||||||||||
| Receivables: | |||||||||||||||||||
| Investment securities sold | — | — | 6,140,885 | ||||||||||||||||
| Interest | 1,120,890 | 1,947,798 | 2,002,770 | ||||||||||||||||
| Fund shares sold | 440,282 | 210,529 | 95,010 | ||||||||||||||||
| Reimbursement from advisor | 19,998 | 19,790 | 35,464 | ||||||||||||||||
| Other assets | 4,017 | 12,172 | — | ||||||||||||||||
| Total assets | 70,479,322 | 107,326,662 | 180,477,294 | ||||||||||||||||
| Liabilities: | |||||||||||||||||||
| Payables: | |||||||||||||||||||
| Investment securities purchased | — | — | 23,987,339 | ||||||||||||||||
| Income distribution | 21,275 | 169,973 | 17,852 | ||||||||||||||||
| Fund shares repurchased | 36,330 | 101,569 | — | ||||||||||||||||
| Amounts owed to affiliates | 33,428 | 87,403 | 86,996 | ||||||||||||||||
| Accrued expenses and other liabilities | 28,341 | 32,068 | 35,526 | ||||||||||||||||
| Total liabilities | 119,374 | 391,013 | 24,127,713 | ||||||||||||||||
| Net Assets: | |||||||||||||||||||
| Paid-in capital | 76,397,535 | 112,950,190 | 156,194,211 | ||||||||||||||||
| Accumulated undistributed (distributions in excess of) net investment income | (17,134 | ) | 82,637 | 287,027 | |||||||||||||||
| Accumulated net realized gain (loss) on investment and futures transactions | (5,219,436 | ) | (5,402,689 | ) | 61,395 | ||||||||||||||
| Net unrealized loss on investments | (801,017 | ) | (694,489 | ) | (193,052 | ) | |||||||||||||
| NET ASSETS | $70,359,948 | $106,935,649 | $156,349,581 | ||||||||||||||||
| Net asset value, offering and redemption price per share (a) | |||||||||||||||||||
| Class A | $9.85 | $14.08 | $10.02 | ||||||||||||||||
| Class B | $9.85 | $14.08 | $10.03 | ||||||||||||||||
| Class C | $9.85 | $14.09 | $10.02 | ||||||||||||||||
| Institutional | $9.84 | $14.08 | $10.02 | ||||||||||||||||
| Service | $9.84 | $14.11 | — | ||||||||||||||||
| Shares outstanding: | |||||||||||||||||||
| Class A | 2,055,265 | 5,879,745 | 5,931,240 | ||||||||||||||||
| Class B | 175,505 | 630,326 | 653,315 | ||||||||||||||||
| Class C | 187,268 | 249,472 | 636,506 | ||||||||||||||||
| Institutional | 4,710,876 | 834,026 | 8,379,048 | ||||||||||||||||
| Service | 16,978 | 114 | — | ||||||||||||||||
| Total shares outstanding, $.001 par value (unlimited number of shares authorized) | 7,145,892 | 7,593,683 | 15,600,109 | ||||||||||||||||
| (a) Maximum
public offering price per share for Class A shares of Short Duration
Tax-Free, (NAV per share multiplied by 1.0204) for Class A shares of
Municipal Income and High Yield Municipal (NAV per share multiplied
by 1.0471) is $10.05, $14.74 and $10.49, respectively. At redemption,
Class B and Class C shares may be subject to a contingent deferred
sales charge, assessed on the amount equal to the lesser of the
current net asset value or the original purchase price of the
shares.
|
| Short Duration
Tax-Free Fund |
Municipal
Income Fund |
High Yield
Municipal Fund(c) |
||||||||
|---|---|---|---|---|---|---|---|---|---|---|
| Investment income: | ||||||||||
| Interest | $2,057,644 | $3,201,924 | $ 642,762 | |||||||
| Total income | 2,057,644 | 3,201,924 | 642,762 | |||||||
| Expenses: | ||||||||||
| Management fees | 173,787 | 309,259 | 56,715 | |||||||
| Distribution and Service fees (a) | 46,359 | 172,624 | 18,858 | |||||||
| Transfer Agent fees (b) | 36,403 | 97,485 | 11,423 | |||||||
| Custodian fees | 34,267 | 34,780 | 6,394 | |||||||
| Registration fees | 31,278 | 29,926 | 17,540 | |||||||
| Professional fees | 24,839 | 24,839 | 4,449 | |||||||
| Trustee fees | 4,921 | 4,921 | — | |||||||
| Service share fees | 419 | — | — | |||||||
| Other | 27,087 | 27,306 | 7,493 | |||||||
| Total expenses | 379,360 | 701,140 | 122,872 | |||||||
| Less-expenses reimbursed and fees waived | (143,800 | ) | (147,634 | ) | (35,464 | ) | ||||
| Net expenses | 235,560 | 553,506 | 87,408 | |||||||
| NET INVESTMENT INCOME | 1,822,084 | 2,648,418 | 555,354 | |||||||
| Realized and unrealized gain (loss) on investment transactions: | ||||||||||
| Net realized gain (loss) from: | ||||||||||
| Investment transactions | (1,376,407 | ) | (3,358,081 | ) | 61,395 | |||||
| Net change in unrealized loss on: | ||||||||||
| Investments | 547,464 | 3,410,756 | (193,052 | ) | ||||||
| Net realized and unrealized gain (loss) on investment transactions | (828,943 | ) | 52,675 | (131,657 | ) | |||||
| NET INCREASE IN NET ASSETS RESULTING FROM OPERATIONS | $ 993,141 | $2,701,093 | $ 423,697 | |||||||
(a)
|
Class A, Class
B, and Class C of the following funds had Distribution and Service
fees of:
|
| Short Duration Tax-Free
Fund — $26,824, $9,490 and $10,045,
respectively.
|
| Municipal Income
Fund — $109,112, $45,060 and $18,452,
respectively.
|
| High Yield
Municipal — $9,933, $4,573 and $4,352,
respectively.
|
(b)
|
The following
funds had Transfer Agency fees of:
|
| Short Duration Tax-Free
Fund — $20,385, $1,803, $1,909, $12,272 and $34 for
Class A, Class B, Class C, Institutional Class and Service Class,
respectively.
|
| Municipal Income
Fund — $82,925, $8,561, $3,506, $2,493 and $0 for
Class A, Class B, Class C, Institutional Class, and Service Class,
respectively.
|
| High Yield
Municipal — $7,549, $869, $827 and $2,178 for Class A,
Class B, Class C and Institutional Class, respectively.
|
(c)
|
Commencement
date of operations was April 3, 2000.
|
| Short Duration
Tax-Free Fund |
Municipal
Income Fund |
High Yield
Municipal Fund(a) |
||||||||
|---|---|---|---|---|---|---|---|---|---|---|
| From operations: | ||||||||||
| Net investment income | $ 1,822,084 | $ 2,648,418 | $ 555,354 | |||||||
| Net realized gain (loss) from investment and futures transactions | (1,376,407 | ) | (3,358,081 | ) | 61,395 | |||||
| Net change in unrealized loss on investments and futures | 547,464 | 3,410,756 | (193,052 | ) | ||||||
| Net increase in net assets resulting from operations | 993,141 | 2,701,093 | 423,697 | |||||||
| Distributions to shareholders: | ||||||||||
| From net investment income | ||||||||||
| Class A shares | (391,538 | ) | (1,978,528 | ) | (99,627 | ) | ||||
| Class B shares | (29,076 | ) | (170,535 | ) | (8,186 | ) | ||||
| Class C shares | (29,072 | ) | (69,586 | ) | (7,661 | ) | ||||
| Institutional shares | (1,250,420 | ) | (307,873 | ) | (152,853 | ) | ||||
| Service shares | (2,984 | ) | (35 | ) | — | |||||
| Total distributions to shareholders | (1,703,090 | ) | (2,526,557 | ) | (268,327 | ) | ||||
| From share transactions: | ||||||||||
| Proceeds from sales of shares | 25,960,703 | 18,645,883 | 159,264,763 | |||||||
| Reinvestment of dividends and distributions | 1,520,628 | 1,710,282 | 246,834 | |||||||
| Cost of shares repurchased | (61,079,653 | ) | (33,950,340 | ) | (3,317,386 | ) | ||||
| Net increase (decrease) in net assets resulting from share transactions | (33,598,322 | ) | (13,594,175 | ) | 156,194,211 | |||||
| TOTAL INCREASE (DECREASE) | (34,308,271 | ) | (13,419,639 | ) | 156,349,581 | |||||
| Net assets: | ||||||||||
| Beginning of period | 104,668,219 | 120,355,288 | — | |||||||
| End of period | $ 70,359,948 | $106,935,649 | $156,349,581 | |||||||
| Accumulated undistributed (distributions in excess of) net investment income | $ (17,134 | ) | $ 82,637 | $ 287,027 | ||||||
(a)
|
Commencement
date of operations was April 3, 2000.
|
| Short Duration
Tax-Free Fund |
Municipal
Income Fund |
||||||
|---|---|---|---|---|---|---|---|
| From operations: | |||||||
| Net investment income | $ 3,447,171 | $ 4,838,878 | |||||
| Net realized loss on investment and futures | (188,017 | ) | (1,471,416 | ) | |||
| Net change in unrealized gain on investments and futures | (1,991,940 | ) | (8,980,803 | ) | |||
| Net increase (decrease) in net assets resulting from operations | 1,267,214 | (5,613,341 | ) | ||||
| Distributions to shareholders: | |||||||
| From net investment income | |||||||
| Class A shares | (764,670 | ) | (3,988,967 | ) | |||
| Class B shares | (45,605 | ) | (294,527 | ) | |||
| Class C shares | (77,388 | ) | (148,156 | ) | |||
| Institutional shares | (2,578,390 | ) | (545,553 | ) | |||
| Administration shares | (2,735 | ) | — | ||||
| Service shares | (40,429 | ) | (68 | ) | |||
| In excess of net investment income | |||||||
| Class A shares | (27,843 | ) | (30,293 | ) | |||
| Class B shares | (1,661 | ) | (2,237 | ) | |||
| Class C shares | (2,818 | ) | (1,125 | ) | |||
| Institutional shares | (93,883 | ) | (4,143 | ) | |||
| Administration shares | (100 | ) | — | ||||
| Service shares | (1,472 | ) | (1 | ) | |||
| From net realized gain on investment and futures transactions | |||||||
| Class A shares | — | (577,455 | ) | ||||
| Class B shares | — | (47,276 | ) | ||||
| Class C shares | — | (18,715 | ) | ||||
| Institutional shares | — | (49,863 | ) | ||||
| Administration shares | — | — | |||||
| Service shares | — | (10 | ) | ||||
| Total distributions to shareholders | (3,636,994 | ) | (5,708,389 | ) | |||
| From share transactions: | |||||||
| Proceeds from sales of shares | 113,638,321 | 58,714,045 | |||||
| Reinvestment of dividends and distributions | 3,252,382 | 4,377,689 | |||||
| Cost of shares repurchased | (93,695,830 | ) | (38,312,817 | ) | |||
| Net increase in net assets resulting from share transactions | 23,194,873 | 24,778,917 | |||||
| TOTAL INCREASE | 20,825,093 | 13,457,187 | |||||
| Net assets: | |||||||
| Beginning of year | 83,843,126 | 106,898,101 | |||||
| End of year | $104,668,219 | $120,355,288 | |||||
| Accumulated distributions in excess of net investment income | $ (136,128 | ) | $ (39,224 | ) | |||
|
1. ORGANIZATION
|
| Goldman Sachs
Trust (the “Trust”) is a Delaware business trust registered
under the Investment Company Act of 1940 (as amended) as an open-end,
management investment company. The Trust includes the Goldman Sachs
Short Duration Tax-Free Fund (Short Duration Tax-Free), the Goldman
Sachs Municipal Income Fund (Municipal Income) and the Goldman Sachs
High Yield Municipal Fund (High Yield Municipal), collectively
“the Funds” or individually a “Fund.” Short
Duration Tax-Free and Municipal Income are diversified portfolios
offering five classes of shares — Class A, Class B, Class C,
Institutional and Service. High Yield Municipal is a non-diversified
portfolio offering four classes of shares — Class A, Class B,
Class C and Institutional. On July 20, 1999, the Administration Class
shares of the Short Duration Tax-Free Fund were liquidated and are no
longer offered.
|
| 2. SIGNIFICANT ACCOUNTING
POLICIES
|
| The following
is a summary of significant accounting policies consistently followed
by the Funds. The preparation of financial statements in conformity
with generally accepted accounting principles requires management to
make estimates and assumptions that may affect the reported amounts.
Actual results could differ from those estimates.
|
| A. Investment Valuation — Portfolio
securities for which accurate market quotations are readily available
are valued on the basis of quotations furnished by a pricing service
or provided by dealers in such securities. Portfolio securities for
which accurate market quotations are not readily available are valued
based on yield equivalents, pricing matrices or other sources, under
valuation procedures established by the Trust’s Board of
Trustees. Short-term debt obligations maturing in sixty days or less
are valued at amortized cost.
|
| B. Security
Transactions and Investment Income — Security
transactions are recorded as of the trade date. Realized gains and
losses on sales of portfolio securities are calculated using the
identified cost basis. Interest income is recorded on the basis of
interest accrued. Market premiums resulting from the purchase of
long-term debt securities are amortized to interest income over the
life of the security with a corresponding decrease in the cost basis
of the security.
|
| C. Federal
Taxes — It is each
Fund’s policy to comply with the requirements of the Internal
Revenue Code applicable to regulated investment companies and to
distribute each year substantially all of its investment company
tax-exempt and taxable income and capital gains to its shareholders.
Accordingly, no federal tax provisions are required.
|
| The
characterization of distributions to shareholders for financial
reporting purposes is determined in accordance with income tax rules.
Therefore, the source of a portfolio’s distributions may be
shown in the accompanying financial statements as either from or in
excess of net investment income or net realized gain on investment
transactions, or from paid-in capital, depending on the type of
book/tax differences that may exist.
|
|
2. SIGNIFICANT ACCOUNTING
POLICIES — continued
|
| The Short
Duration Tax-Free and Municipal Income Funds, at their most recent
tax year-ends of October 31, 1999, had approximately the following
amount of capital loss carryforwards for U.S. federal tax purposes.
These amounts are available to be carried forward to offset future
capital gains to the extent permitted by applicable laws or
regulations.
|
| Fund | Amount | Years of
Expiration |
|||
|---|---|---|---|---|---|
| Short Duration Tax-Free | $3,843,000 | 2002-2007 | |||
| Municipal Income | 2,045,000 | 2007 | |||
| At April 30,
2000 the Funds’ aggregate unrealized gains and losses based on
cost for federal income tax purposes was as follows:
|
| Fund | Tax
Cost |
Gross
Unrealized Gain |
Gross
Unrealized Loss |
Net Unrealized
Loss |
|||||||
|---|---|---|---|---|---|---|---|---|---|---|---|
| Short Duration Tax-Free | $ 69,564,990 | $ 35,868 | $ (836,885 | ) | $(801,017 | ) | |||||
| Municipal Income | 105,777,487 | 1,078,287 | (1,772,776 | ) | (694,489 | ) | |||||
| High Yield Municipal | 172,339,358 | 484,626 | (677,678 | ) | (193,052 | ) | |||||
| D. Expenses — Expenses
incurred by the Trust that do not specifically relate to an
individual Fund of the Trust are allocated to the Funds on a
straight-line or pro rata basis depending upon the nature of the
expense.
|
| Class A, Class
B and Class C shareholders of the Funds bear all expenses and fees
relating to their respective Distribution and Service plans.
Shareholders of Service shares bear all expenses and fees paid to
service organizations. Each class of shares of the Funds separately
bears its respective class-specific Transfer Agency fees.
|
| E. Segregation
Transactions — The Funds may
enter into certain derivative transactions to seek to increase total
return. Forward foreign currency exchange contracts, futures
contracts, written options, when-issued securities and forward
commitments represent examples of such transactions. As a result of
entering into those transactions, the Funds are required to segregate
liquid assets on the accounting records equal to or greater than the
market value of the corresponding transactions.
|
| 3. AGREEMENTS
|
| Goldman Sachs
Asset Management (“GSAM”), a unit of the Investment
Management Division of Goldman, Sachs & Co. (“Goldman
Sachs”), serves as each Fund’s investment adviser pursuant
to Investment Management Agreements (the “Agreements”).
Under the Agreements, GSAM, subject to the general supervision of the
Trust’s Board of Trustees, manages the Funds’ portfolios.
As compensation for the services rendered pursuant to the Agreements
and the assumption of the expenses related thereto and administering
the Funds’ business affairs, including providing facilities,
GSAM is entitled to a fee, computed daily and payable monthly at an
annual rate equal to .40%, .55% and .55% of the average daily net
assets of Short Duration Tax-Free, Municipal Income and High Yield
Municipal, respectively. GSAM has voluntarily agreed to waive a
portion of its Management fee equal annually to .05% of the average
daily net assets of Short Duration Tax-Free and Municipal Income. For
the period ended April, 30, 2000, GSAM waived approximately $22,000
and $28,000 of its Management fee attributable to the Short Duration
Tax-Free and Municipal Income Funds, respectively. GSAM may
discontinue or modify these waivers in the future at its
discretion.
|
|
GSAM has voluntarily
agreed to limit “Other Expenses” (excluding management,
distribution and service fees, transfer agent fees and Service share
fees, taxes, interest, brokerage, litigation, indemnification costs
and other extraordinary expenses) to the extent such expenses exceed,
on an annual basis, .00% of the average daily net assets of each
Fund. For the period ended April 30, 2000, Goldman Sachs has agreed
to reimburse approximately $121,000, $120,000 and $35,000 to Short
Duration Tax-Free, Municipal Income and High Yield Municipal,
respectively.
|
| Goldman Sachs
serves as the Distributor of shares of the Funds pursuant to a
Distribution Agreement. Goldman Sachs may receive a portion of the
Class A sales load and Class B and Class C contingent deferred sales
charges and has advised the Funds that it retained approximately
$15,000, $14,000 and $429,000 for the period ended April 30, 2000 for
Short Duration Tax-Free, Municipal Income and High Yield Municipal,
respectively.
|
| The Trust, on
behalf of each Fund, has adopted Distribution and Service Plans.
Under the Distribution and Service Plans, Goldman Sachs and/or
authorized dealers are entitled to a monthly fee from each Fund for
distribution and shareholder maintenance services equal, on an annual
basis, to .25%, 1.00% and 1.00% of the average daily net assets
attributable to Class A, Class B and Class C shares, respectively.
Goldman Sachs has voluntarily agreed to waive a portion of the
Distribution and Service fees equal to .15% of the average daily net
assets attributable to the Class B shares of Short Duration Tax-Free.
For the period ended April 30, 2000, Goldman Sachs has waived
approximately $1,000 of the Distribution and Service fees
attributable to the Class B shares of Short Duration Tax-Free.
Goldman Sachs may discontinue or modify this waiver in the future at
its discretion.
|
| Goldman Sachs
also serves as the Transfer Agent of the Funds for a fee. Fees
charged for such transfer agency services are calculated daily and
payable monthly at an annual rate as follows: .19% of the average
daily net assets for Class A, Class B and Class C shares and .04% of
the average daily net assets for Institutional and Service
shares.
|
| The Trust, on
behalf of the Funds, has adopted Service Plans. These plans allow for
Service shares to compensate service organizations for providing
varying levels of account administration and shareholder liaison
services to their customers who are beneficial owners of such shares.
The Service Plans provide for compensation to the service
organizations in an amount up to, on an annual basis, .50% of the
average daily net assets of the share class.
|
| At April 30,
2000, the amounts owed to affiliates were as follows (in
thousands):
|
| Fund | Management
Fees |
Distribution
and Service Fees |
Transfer
Agent Fees |
Total | |||||
|---|---|---|---|---|---|---|---|---|---|
| Short Duration Tax-Free | $21 | $ 7 | $ 5 | $33 | |||||
| Municipal Income | 45 | 27 | 15 | 87 | |||||
| High Yield Municipal | 57 | 19 | 11 | 87 | |||||
|
4. PORTFOLIO SECURITIES TRANSACTIONS
|
| Purchases and
proceeds of sales or maturities of long-term securities for the
period ended April 30, 2000, were as follows:
|
| Fund | Purchases | Sales or
Maturities |
|||
|---|---|---|---|---|---|
| Short Duration Tax-Free | $ 30,401,725 | $58,802,434 | |||
| Municipal Income | 51,736,049 | 64,602,733 | |||
| High Yield Municipal | 159,170,790 | 11,112,234 | |||
| Futures
Contracts — The Funds may
enter into futures transactions in order to hedge against changes in
interest rates, securities prices or to seek to increase total
return. Upon entering into a futures contract, the Funds are required
to deposit with a broker an amount of cash or securities equal to the
minimum “initial margin” requirement of the associated
futures exchange. Subsequent payments for futures contracts
(“variation margin”) are paid or received by the Funds
daily, dependent on the daily fluctuations in the value of the
contracts, and are recorded for financial reporting purposes as
unrealized gains or losses. When contracts are closed, the Funds
realize a gain or loss which is reported in the Statements of
Operations.
|
| The use of
futures contracts involve, to varying degrees, elements of market and
counterparty risk which may exceed the amounts recognized in the
Statements of Assets and Liabilities. Changes in the value of the
futures contract may not directly correlate with changes in the value
of the underlying securities. This risk may decrease the
effectiveness of the Funds’ strategies and potentially result in
a loss. At April 30, 2000, the Funds had no open futures
contracts.
|
| 5. LINE
OF CREDIT FACILITY
|
| The Funds
participate in a $250,000,000 uncommitted and a $250,000,000
committed, unsecured revolving line of credit facility. Under the
most restrictive arrangement, each Fund must own securities having a
market value in excess of 400% of the total bank borrowings. These
facilities are to be used solely for temporary or emergency purposes.
The interest rate on borrowings is based on the Federal Funds rate.
The committed facility also requires a fee to be paid by the Funds
based on the amount of the commitment which has not been utilized.
During the period ended April 30, 2000, the Funds did not have any
borrowings under any of these facilities.
|
| 6. CHANGE IN INDEPENDENT
AUDITORS
|
| On October 26,
1999 the Board of Trustees of the Funds, upon the recommendation of
the Board’s audit committee, determined not to retain Arthur
Andersen LLP and approved a change of the Funds’ independent
auditors to Ernst & Young LLP. For the fiscal years ended October
31, 1999 and October 31, 1998, Arthur Andersen LLP’s audit
reports contained no adverse opinion or disclaimer of opinion; nor
were their reports qualified or modified as to uncertainty, audit
scope, or accounting principles. Further, there were no disagreements
between the Funds and Arthur Andersen LLP on accounting principles or
practices, financial statement disclosure or audit scope or
procedure, which if not resolved to the satisfaction of Arthur
Andersen LLP would have caused them to make reference to the
disagreement in their report.
|
|
7. SUMMARY OF SHARE TRANSACTIONS
|
| Share activity
for the period ended April 30, 2000 is as follows:
|
| Short Duration Tax-Free Fund | Municipal Income Fund | High Yield Municipal Fund(a) | |||||||||||||||||
|---|---|---|---|---|---|---|---|---|---|---|---|---|---|---|---|---|---|---|---|
| Shares | Dollars | Shares | Dollars | Shares | Dollars | ||||||||||||||
| Class A Shares | |||||||||||||||||||
| Shares sold | 839,679 | $ 8,311,635 | 953,254 | $13,399,185 | 5,951,178 | $ 59,572,948 | |||||||||||||
| Reinvestment of dividends and distributions | 29,455 | 291,059 | 100,839 | 1,416,140 | 8,891 | 89,086 | |||||||||||||
| Shares repurchased | (1,120,325 | ) | (11,061,759 | ) | (1,601,283 | ) | (22,560,339 | ) | (28,829 | ) | (290,885 | ) | |||||||
| (251,191 | ) | (2,459,065 | ) | (547,190 | ) | (7,745,014 | ) | 5,931,240 | 59,371,149 | ||||||||||
| Class B Shares | |||||||||||||||||||
| Shares sold | 50,653 | 501,675 | 64,134 | 902,192 | 653,009 | 6,535,188 | |||||||||||||
| Reinvestment of dividends and distributions | 2,498 | 24,671 | 6,673 | 93,715 | 456 | 4,578 | |||||||||||||
| Shares repurchased | (79,168 | ) | (782,177 | ) | (103,656 | ) | (1,459,499 | ) | (150 | ) | (1,514 | ) | |||||||
| (26,017 | ) | (255,831 | ) | (32,849 | ) | (463,592 | ) | 653,315 | 6,538,252 | ||||||||||
| Class C Shares | |||||||||||||||||||
| Shares sold | 806,877 | 7,973,008 | 37,683 | 531,742 | 636,299 | 6,367,807 | |||||||||||||
| Reinvestment of dividends and distributions | 2,491 | 24,601 | 3,048 | 42,842 | 457 | 4,575 | |||||||||||||
| Shares repurchased | (830,650 | ) | (8,209,069 | ) | (102,239 | ) | (1,445,258 | ) | (250 | ) | (2,517 | ) | |||||||
| (21,282 | ) | (211,460 | ) | (61,508 | ) | (870,674 | ) | 636,506 | 6,369,865 | ||||||||||
| Institutional Shares | |||||||||||||||||||
| Shares sold | 929,949 | 9,174,385 | 273,943 | 3,812,764 | 8,663,769 | 86,788,820 | |||||||||||||
| Reinvestment of dividends and distributions | 119,175 | 1,177,156 | 11,200 | 157,550 | 14,830 | 148,595 | |||||||||||||
| Shares repurchased | (4,148,720 | ) | (41,019,242 | ) | (601,968 | ) | (8,485,244 | ) | (299,551 | ) | (3,022,470 | ) | |||||||
| (3,099,596 | ) | (30,667,701 | ) | (316,825 | ) | (4,514,930 | ) | 8,379,048 | 83,914,945 | ||||||||||
| Service Shares | |||||||||||||||||||
| Shares sold | — | — | — | — | — | — | |||||||||||||
| Reinvestment of dividends and distributions | 318 | 3,141 | 3 | 35 | — | — | |||||||||||||
| Shares repurchased | (750 | ) | (7,406 | ) | — | — | — | — | |||||||||||
| (432 | ) | (4,265 | ) | 3 | 35 | — | — | ||||||||||||
| NET INCREASE (DECREASE) | (3,398,518 | ) | $(33,598,322 | ) | (958,369 | ) | $(13,594,175 | ) | 15,600,109 | $156,194,211 | |||||||||
(a)
|
Commencement
date of operations was April 3, 2000.
|
| |
| Share activity
for the year ended October 31, 1999 is as follows:
|
| Short Duration Tax-Free Fund | Municipal Income Fund | ||||||||||||
|---|---|---|---|---|---|---|---|---|---|---|---|---|---|
| Shares | Dollars | Shares | Dollars | ||||||||||
| Class A Shares | |||||||||||||
| Shares sold | 2,642,831 | $26,739,478 | 2,487,407 | $37,239,582 | |||||||||
| Reinvestment of dividends and distributions | 60,149 | 606,852 | 236,715 | 3,547,213 | |||||||||
| Shares repurchased | (2,348,233 | ) | (23,756,336 | ) | (2,188,230 | ) | (32,704,920 | ) | |||||
| 354,747 | 3,589,994 | 535,892 | 8,081,875 | ||||||||||
| Class B Shares | |||||||||||||
| Shares sold | 143,414 | 1,452,458 | 311,533 | 4,688,547 | |||||||||
| Reinvestment of dividends and distributions | 3,915 | 39,401 | 15,176 | 227,116 | |||||||||
| Shares repurchased | (41,468 | ) | (421,907 | ) | (97,942 | ) | (1,472,016 | ) | |||||
| 105,861 | 1,069,952 | 228,767 | 3,443,647 | ||||||||||
| Class C Shares | |||||||||||||
| Shares sold | 913,925 | 9,182,624 | 200,328 | 3,041,377 | |||||||||
| Reinvestment of dividends and distributions | 6,945 | 70,046 | 7,806 | 116,917 | |||||||||
| Shares repurchased | (933,863 | ) | (9,362,292 | ) | (82,108 | ) | (1,208,599 | ) | |||||
| (12,993 | ) | (109,622 | ) | 126,026 | 1,949,695 | ||||||||
| Institutional Shares | |||||||||||||
| Shares sold | 7,455,342 | 75,314,086 | 919,438 | 13,744,539 | |||||||||
| Reinvestment of dividends and distributions | 247,700 | 2,495,701 | 32,665 | 486,364 | |||||||||
| Shares repurchased | (5,553,387 | ) | (56,277,910 | ) | (198,983 | ) | (2,927,282 | ) | |||||
| 2,149,655 | 21,531,877 | 753,120 | 11,303,621 | ||||||||||
| Administration Shares(a) | |||||||||||||
| Shares sold | 42,409 | 431,432 | — | — | |||||||||
| Reinvestment of dividends and distributions | 155 | 1,575 | — | — | |||||||||
| Shares repurchased | (94,101 | ) | (956,228 | ) | — | — | |||||||
| (51,537 | ) | (523,221 | ) | — | — | ||||||||
| Service Shares | |||||||||||||
| Shares sold | 51,278 | 518,243 | — | — | |||||||||
| Reinvestment of dividends and distributions | 3,822 | 38,807 | 5 | 79 | |||||||||
| Shares repurchased | (289,195 | ) | (2,921,157 | ) | — | — | |||||||
| (234,095 | ) | (2,364,107 | ) | 5 | 79 | ||||||||
| NET INCREASE | 2,311,638 | $23,194,873 | 1,643,810 | $24,778,917 | |||||||||
| (a) Short Duration Tax-Free Administration Class
shares were liquidated on July 20, 1999.
|
|
Income (loss) from investment operations (a) |
Distributions to
shareholders |
||||||||||||||||||||||||||||
|---|---|---|---|---|---|---|---|---|---|---|---|---|---|---|---|---|---|---|---|---|---|---|---|---|---|---|---|---|---|
| Net asset
value, beginning of period |
Net
investment income |
Net realized
and unrealized gain (loss) |
From net
investment income |
In excess
of net investment income |
Net
increase (decrease) in net asset value |
||||||||||||||||||||||||
| FOR THE SIX MONTHS ENDED APRIL 30, (Unaudited) | |||||||||||||||||||||||||||||
| 2000 - Class A Shares | $ 9.93 | $ 0.19 | $(0.09 | ) | $(0.18 | ) | $ — | $(0.08 | ) | ||||||||||||||||||||
| 2000 - Class B Shares | 9.93 | 0.17 | (0.10 | ) | (0.15 | ) | — | (0.08 | ) | ||||||||||||||||||||
| 2000 - Class C Shares | 9.93 | 0.15 | (0.09 | ) | (0.14 | ) | — | (0.08 | ) | ||||||||||||||||||||
| 2000 - Institutional Shares | 9.93 | 0.22 | (0.11 | ) | (0.20 | ) | — | (0.09 | ) | ||||||||||||||||||||
| 2000 - Service Shares | 9.92 | 0.19 | (0.09 | ) | (0.18 | ) | — | (0.08 | ) | ||||||||||||||||||||
| FOR THE YEARS ENDED OCTOBER 31, | |||||||||||||||||||||||||||||
| 1999 - Class A Shares | 10.19 | 0.34 | (0.24 | ) | (0.34 | ) | (0.02 | ) | (0.26 | ) | |||||||||||||||||||
| 1999 - Class B Shares | 10.18 | 0.28 | (0.23 | ) | (0.28 | ) | (0.02 | ) | (0.25 | ) | |||||||||||||||||||
| 1999 - Class C Shares | 10.18 | 0.26 | (0.22 | ) | (0.26 | ) | (0.03 | ) | (0.25 | ) | |||||||||||||||||||
| 1999 - Institutional Shares | 10.18 | 0.38 | (0.23 | ) | (0.39 | ) | (0.01 | ) | (0.25 | ) | |||||||||||||||||||
| 1999 - Administration Shares(f) | 10.18 | 0.26 | (e) | (0.12 | ) (e) | (0.27 | ) | — | (0.13 | ) | |||||||||||||||||||
| 1999 - Service Shares | 10.18 | 0.33 | (e) | (0.24 | ) (e) | (0.33 | ) | (0.02 | ) | (0.26 | ) | ||||||||||||||||||
| 1998 - Class A Shares | 10.08 | 0.36 | (e) | 0.13 | (e) | (0.38 | ) | — | 0.11 | ||||||||||||||||||||
| 1998 - Class B Shares | 10.08 | 0.30 | (e) | 0.12 | (e) | (0.32 | ) | — | 0.10 | ||||||||||||||||||||
| 1998 - Class C Shares | 10.07 | 0.28 | (e) | 0.14 | (e) | (0.31 | ) | — | 0.11 | ||||||||||||||||||||
| 1998 - Institutional Shares | 10.07 | 0.39 | (e) | 0.13 | (e) | (0.41 | ) | — | 0.11 | ||||||||||||||||||||
| 1998 - Administration Shares | 10.07 | 0.36 | (e) | 0.13 | (e) | (0.38 | ) | — | 0.11 | ||||||||||||||||||||
| 1998 - Service Shares | 10.07 | 0.34 | (e) | 0.13 | (e) | (0.36 | ) | — | 0.11 | ||||||||||||||||||||
| 1997 - Class A Shares (commenced May 1) | 9.94 | 0.20 | (e) | 0.14 | (e) | (0.20 | ) | — | 0.14 | ||||||||||||||||||||
| 1997 - Class B Shares (commenced May 1) | 9.94 | 0.16 | (e) | 0.14 | (e) | (0.16 | ) | — | 0.14 | ||||||||||||||||||||
| 1997 - Class C Shares (commenced August 15) | 10.04 | 0.07 | (e) | 0.03 | (e) | (0.07 | ) | — | 0.03 | ||||||||||||||||||||
| 1997 - Institutional Shares | 9.96 | 0.42 | (e) | 0.11 | (e) | (0.42 | ) | — | 0.11 | ||||||||||||||||||||
| 1997 - Administration Shares | 9.96 | 0.39 | (e) | 0.11 | (e) | (0.39 | ) | — | 0.11 | ||||||||||||||||||||
| 1997 - Service Shares | 9.97 | 0.37 | (e) | 0.10 | (e) | (0.37 | ) | — | 0.10 | ||||||||||||||||||||
| 1996 - Institutional Shares | 9.94 | 0.42 | (e) | 0.02 | (e) | (0.42 | ) | — | 0.02 | ||||||||||||||||||||
| 1996 - Administration Shares | 9.94 | 0.39 | (e) | 0.02 | (e) | (0.39 | ) | — | 0.02 | ||||||||||||||||||||
| 1996 - Service Shares | 9.95 | 0.37 | (e) | 0.02 | (e) | (0.37 | ) | — | 0.02 | ||||||||||||||||||||
| 1995 - Institutional Shares | 9.79 | 0.42 | (e) | 0.15 | (e) | (0.42 | ) | — | 0.15 | ||||||||||||||||||||
| 1995 - Administration Shares | 9.79 | 0.40 | (e) | 0.15 | (e) | (0.40 | ) | — | 0.15 | ||||||||||||||||||||
| 1995 - Service Shares | 9.79 | 0.37 | (e) | 0.16 | (e) | (0.37 | ) | — | 0.16 | ||||||||||||||||||||
(a)
|
Includes
the balancing effect of calculating per share
amounts.
|
(b)
|
Assumes
investment at the net asset value at the beginning of the period,
reinvestment of all distributions, a complete redemption of the
investment at the net asset value at the end of period and no sales
charge. Total return would be reduced if a sales or redemption
charge were taken into account.
|
(c)
|
Annualized.
|
(d)
|
Not
annualized.
|
(e)
|
Calculated based on the average shares outstanding
methodology.
|
(f)
|
Administration Class shares were liquidated on July 20,
1999. Ending net asset value shown as of July 20,
1999.
|
| Ratios assuming no
voluntary waiver of fees or expense limitations |
|||||||||||||||||||||||||||||||||||
|---|---|---|---|---|---|---|---|---|---|---|---|---|---|---|---|---|---|---|---|---|---|---|---|---|---|---|---|---|---|---|---|---|---|---|---|
| Net asset
value, end of period |
Total
return (b) |
Net
assets at end of period (in 000s) |
Ratio of
net expenses to average net assets |
Ratio of net
investment income to average net assets |
Ratio of
expenses to average net assets |
Ratio of net
investment income to average net assets |
Portfolio
turnover rate |
||||||||||||||||||||||||||||
| $ 9.85 | 1.02 | % (d) | $20,249 | 0.79 | % (c) | 3.92 | % (c) | 1.12 | % (c) | 3.59 | % (c) | 35.93 | % (d) | ||||||||||||||||||||||
| 9.85 | 0.72 | (d) | 1,728 | 1.39 | (c) | 3.34 | (c) | 1.87 | (c) | 2.86 | (c) | 35.93 | (d) | ||||||||||||||||||||||
| 9.85 | 0.64 | (d) | 1,844 | 1.54 | (c) | 3.15 | (c) | 1.87 | (c) | 2.82 | (c) | 35.93 | (d) | ||||||||||||||||||||||
| 9.84 | 1.12 | (d) | 46,372 | 0.39 | (c) | 4.35 | (c) | 0.72 | (c) | 4.02 | (c) | 35.93 | (d) | ||||||||||||||||||||||
| 9.84 | 0.97 | (d) | 167 | 0.89 | (c) | 3.85 | (c) | 1.22 | (c) | 3.52 | (c) | 35.93 | (d) | ||||||||||||||||||||||
| 9.93 | 1.00 | 22,903 | 0.79 | 3.37 | 1.06 | 3.10 | 147.20 | ||||||||||||||||||||||||||||
| 9.93 | 0.49 | 2,000 | 1.39 | 2.80 | 1.81 | 2.38 | 147.20 | ||||||||||||||||||||||||||||
| 9.93 | 0.34 | 2,070 | 1.54 | 2.62 | 1.81 | 2.35 | 147.20 | ||||||||||||||||||||||||||||
| 9.93 | 1.50 | 77,522 | 0.39 | 3.79 | 0.66 | 3.52 | 147.20 | ||||||||||||||||||||||||||||
| 10.05 (f) | 1.37 | (d) | — | 0.64 | (c) | 3.56 | (c) | 0.91 | (c) | 3.29 | (c) | 147.20 | |||||||||||||||||||||||
| 9.92 | 0.89 | 173 | 0.89 | 3.23 | 1.16 | 2.96 | 147.20 | ||||||||||||||||||||||||||||
| 10.19 | 4.97 | 19,881 | 0.71 | 3.54 | 1.74 | 2.51 | 140.72 | ||||||||||||||||||||||||||||
| 10.18 | 4.25 | 974 | 1.31 | 3.06 | 2.27 | 2.10 | 140.72 | ||||||||||||||||||||||||||||
| 10.18 | 4.19 | 2,256 | 1.46 | 2.82 | 2.27 | 2.01 | 140.72 | ||||||||||||||||||||||||||||
| 10.18 | 5.25 | 57,647 | 0.45 | 3.92 | 1.26 | 3.11 | 140.72 | ||||||||||||||||||||||||||||
| 10.18 | 4.99 | 525 | 0.70 | 3.58 | 1.51 | 2.77 | 140.72 | ||||||||||||||||||||||||||||
| 10.18 | 4.73 | 2,560 | 0.95 | 3.44 | 1.76 | 2.63 | 140.72 | ||||||||||||||||||||||||||||
| 10.08 | 3.39 | (d) | 4,023 | 0.70 | (c) | 3.81 | (c) | 1.73 | (c) | 2.78 | (c) | 194.75 | |||||||||||||||||||||||
| 10.08 | 3.07 | (d) | 106 | 1.30 | (c) | 3.31 | (c) | 2.23 | (c) | 2.38 | (c) | 194.75 | |||||||||||||||||||||||
| 10.07 | 0.97 | (d) | 2 | 1.45 | (c) | 2.60 | (c) | 2.23 | (c) | 1.82 | (c) | 194.75 | |||||||||||||||||||||||
| 10.07 | 5.40 | 28,821 | 0.45 | 4.18 | 1.23 | 3.40 | 194.75 | ||||||||||||||||||||||||||||
| 10.07 | 5.14 | 77 | 0.70 | 3.91 | 1.48 | 3.13 | 194.75 | ||||||||||||||||||||||||||||
| 10.07 | 4.77 | 2,051 | 0.95 | 3.66 | 1.73 | 2.88 | 194.75 | ||||||||||||||||||||||||||||
| 9.96 | 4.50 | 34,814 | 0.45 | 4.21 | 1.01 | 3.65 | 231.65 | ||||||||||||||||||||||||||||
| 9.96 | 4.24 | 48 | 0.70 | 3.96 | 1.26 | 3.40 | 231.65 | ||||||||||||||||||||||||||||
| 9.97 | 3.98 | 695 | 0.95 | 3.74 | 1.51 | 3.18 | 231.65 | ||||||||||||||||||||||||||||
| 9.94 | 5.98 | 58,389 | 0.45 | 4.31 | 0.77 | 3.99 | 259.52 | ||||||||||||||||||||||||||||
| 9.94 | 5.76 | 46 | 0.70 | 4.14 | 1.02 | 3.82 | 259.52 | ||||||||||||||||||||||||||||
| 9.95 | 5.59 | 454 | 0.95 | 3.87 | 1.27 | 3.55 | 259.52 | ||||||||||||||||||||||||||||
|
Income (loss) from investment operations (a) |
Distributions
to shareholders |
|||||||||||||||||||
|---|---|---|---|---|---|---|---|---|---|---|---|---|---|---|---|---|---|---|---|---|
| Net asset
value, beginning of period |
Net
investment income |
Net realized
and unrealized gain (loss) |
From
net investment income |
In excess
of net investment income |
From
net realized gain |
Net
increase (decrease) in net asset value |
||||||||||||||
| FOR THE SIX MONTHS ENDED APRIL 30, (Unaudited) | ||||||||||||||||||||
| 2000 - Class A Shares | $14.07 | $0.34 | $(0.01 | ) | $(0.32 | ) | $ — | $ — | $0.01 | |||||||||||
| 2000 - Class B Shares | 14.08 | 0.28 | (0.02 | ) | (0.26 | ) | — | — | 0.00 | |||||||||||
| 2000 - Class C Shares | 14.08 | 0.29 | (0.01 | ) | (0.27 | ) | — | — | 0.01 | |||||||||||
| 2000 - Institutional Shares | 14.07 | 0.37 | (0.01 | ) | (0.35 | ) | — | — | 0.01 | |||||||||||
| 2000 - Service Shares | 14.09 | 0.33 | 0.00 | (0.31 | ) | — | — | 0.02 | ||||||||||||
| FOR THE YEARS ENDED OCTOBER 31, | ||||||||||||||||||||
| 1999 - Class A Shares | 15.47 | 0.63 | (1.29 | ) | (0.65 | ) | — | (0.09 | ) | (1.40 | ) | |||||||||
| 1999 - Class B Shares | 15.47 | 0.51 | (1.28 | ) | (0.52 | ) | (0.01 | ) | (0.09 | ) | (1.39 | ) | ||||||||
| 1999 - Class C Shares | 15.47 | 0.51 | (1.28 | ) | (0.51 | ) | (0.02 | ) | (0.09 | ) | (1.39 | ) | ||||||||
| 1999 - Institutional Shares | 15.47 | 0.70 | (1.30 | ) | (0.70 | ) | (0.01 | ) | (0.09 | ) | (1.40 | ) | ||||||||
| 1999 - Service Shares | 15.48 | 0.65 | (1.32 | ) | (0.63 | ) | — | (0.09 | ) | (1.39 | ) | |||||||||
| 1998 - Class A Shares | 14.99 | 0.65 | 0.50 | (0.64 | ) | — | (0.03 | ) | 0.48 | |||||||||||
| 1998 - Class B Shares | 15.00 | 0.53 | 0.49 | (0.52 | ) | — | (0.03 | ) | 0.47 | |||||||||||
| 1998 - Class C Shares | 14.99 | 0.53 | 0.50 | (0.52 | ) | — | (0.03 | ) | 0.48 | |||||||||||
| 1998 - Institutional Shares | 15.00 | 0.68 | 0.50 | (0.68 | ) | — | (0.03 | ) | 0.47 | |||||||||||
| 1998 - Service Shares | 14.99 | 0.64 | 0.49 | (0.61 | ) | — | (0.03 | ) | 0.49 | |||||||||||
| 1997 - Class A Shares | 14.37 | 0.67 | 0.62 | (0.67 | ) | — | — | 0.62 | ||||||||||||
| 1997 - Class B Shares | 14.37 | 0.56 | 0.63 | (0.56 | ) | — | — | 0.63 | ||||||||||||
| 1997 - Class C Shares (commenced August 15) | 14.85 | 0.12 | 0.14 | (0.12 | ) | — | — | 0.14 | ||||||||||||
| 1997 - Institutional Shares (commenced August 15) | 14.84 | 0.15 | 0.16 | (0.15 | ) | — | — | 0.16 | ||||||||||||
| 1997 - Service Shares (commenced August 15) | 14.84 | 0.14 | 0.15 | (0.14 | ) | — | — | 0.15 | ||||||||||||
| 1996 - Class A Shares | 14.17 | 0.65 | 0.20 | (0.65 | ) | — | — | 0.20 | ||||||||||||
| 1996 - Class B Shares (commenced May 1) | 14.03 | 0.27 | 0.34 | (0.27 | ) | — | — | 0.34 | ||||||||||||
| 1995 - Class A Shares | 13.08 | 0.67 | 1.09 | (0.67 | ) | — | — | 1.09 | ||||||||||||
(a)
|
Includes the balancing effect of calculating per
share amounts.
|
(b)
|
Assumes investment at the net asset value at the
beginning of the period, reinvestment of all distributions, a
complete redemption of the investment at the net asset value
at the end of the period and no sales charge. Total return
would be reduced if a sales or redemption charge were taken
into account.
|
(c)
|
Annualized.
|
(d)
|
Not
annualized.
|
| Ratios
assuming no
voluntary waiver of fees or expense limitations |
|||||||||||||||||||||||||||||||||||||||||
|---|---|---|---|---|---|---|---|---|---|---|---|---|---|---|---|---|---|---|---|---|---|---|---|---|---|---|---|---|---|---|---|---|---|---|---|---|---|---|---|---|---|
| Net asset
value, end of period |
Total
return (b) |
Net assets
at end of period (in 000s) |
Ratio of
net expenses to average net assets |
Ratio of net
investment income to average net assets |
Ratio of
expenses to average net assets |
Ratio of net
investment income to average net assets |
Portfolio
turnover rate |
||||||||||||||||||||||||||||||||||
| $14.08 | 2.35 | % (d) | $82,796 | 0.94 | % (c) | 4.75 | % (c) | 1.20 | % (c) | 4.49 | % (c) | 46.96 | % (d) | ||||||||||||||||||||||||||||
| 14.08 | 1.90 | (d) | 8,878 | 1.69 | (c) | 4.00 | (c) | 1.95 | (c) | 3.74 | (c) | 46.96 | (d) | ||||||||||||||||||||||||||||
| 14.09 | 1.97 | (d) | 3,515 | 1.69 | (c) | 3.99 | (c) | 1.95 | (c) | 3.73 | (c) | 46.96 | (d) | ||||||||||||||||||||||||||||
| 14.08 | 2.56 | (d) | 11,745 | 0.54 | (c) | 5.17 | (c) | 0.80 | (c) | 4.91 | (c) | 46.96 | (d) | ||||||||||||||||||||||||||||
| 14.11 | 2.38 | (d) | 2 | 1.04 | (c) | 4.82 | (c) | 1.30 | (c) | 4.56 | (c) | 46.96 | (d) | ||||||||||||||||||||||||||||
| 14.07 | (4.46 | ) | 90,443 | 0.94 | 4.15 | 1.14 | 3.95 | 70.31 | |||||||||||||||||||||||||||||||||
| 14.08 | (5.10 | ) | 9,334 | 1.69 | 3.40 | 1.89 | 3.20 | 70.31 | |||||||||||||||||||||||||||||||||
| 14.08 | (5.10 | ) | 4,379 | 1.69 | 3.40 | 1.89 | 3.20 | 70.31 | |||||||||||||||||||||||||||||||||
| 14.07 | (4.07 | ) | 16,197 | 0.54 | 4.58 | 0.74 | 4.38 | 70.31 | |||||||||||||||||||||||||||||||||
| 14.09 | (4.49 | ) | 2 | 1.04 | 4.35 | 1.24 | 4.15 | 70.31 | |||||||||||||||||||||||||||||||||
| 15.47 | 7.79 | 91,158 | 0.87 | 4.25 | 1.64 | 3.48 | 56.51 | ||||||||||||||||||||||||||||||||||
| 15.47 | 6.91 | 6,722 | 1.62 | 3.44 | 2.16 | 2.90 | 56.51 | ||||||||||||||||||||||||||||||||||
| 15.47 | 6.98 | 2,862 | 1.62 | 3.38 | 2.16 | 2.84 | 56.51 | ||||||||||||||||||||||||||||||||||
| 15.47 | 8.00 | 6,154 | 0.58 | 4.41 | 1.12 | 3.87 | 56.51 | ||||||||||||||||||||||||||||||||||
| 15.48 | 7.68 | 2 | 1.08 | 4.21 | 1.62 | 3.67 | 56.51 | ||||||||||||||||||||||||||||||||||
| 14.99 | 9.23 | 64,553 | 0.85 | 4.60 | 1.62 | 3.83 | 153.12 | ||||||||||||||||||||||||||||||||||
| 15.00 | 8.48 | 1,750 | 1.60 | 3.74 | 2.12 | 3.22 | 153.12 | ||||||||||||||||||||||||||||||||||
| 14.99 | 1.75 | (d) | 130 | 1.60 | (c) | 3.24 | (c) | 2.12 | (c) | 2.72 | (c) | 153.12 | |||||||||||||||||||||||||||||
| 15.00 | 2.10 | (d) | 351 | 0.60 | (c) | 4.41 | (c) | 1.12 | (c) | 3.89 | (c) | 153.12 | |||||||||||||||||||||||||||||
| 14.99 | 1.93 | (d) | 2 | 1.10 | (c) | 4.24 | (c) | 1.62 | (c) | 3.72 | (c) | 153.12 | |||||||||||||||||||||||||||||
| 14.37 | 6.13 | 52,267 | 0.85 | 4.58 | 1.55 | 3.88 | 344.13 | ||||||||||||||||||||||||||||||||||
| 14.37 | 4.40 | (d) | 255 | 1.60 | (c) | 3.55 | (c) | 2.05 | (c) | 3.10 | (c) | 344.13 | |||||||||||||||||||||||||||||
| 14.17 | 13.79 | 53,797 | 0.76 | 4.93 | 1.49 | 4.20 | 335.55 | ||||||||||||||||||||||||||||||||||
| Income from
investment operations (a) |
Distributions to
shareholders |
||||||||||||||||||||||
|---|---|---|---|---|---|---|---|---|---|---|---|---|---|---|---|---|---|---|---|---|---|---|---|
|
Net asset value at beginning of period |
Net
investment income |
Net realized
and unrealized gain (loss) |
From
net investment income |
In excess
of net investment income |
Net
increase in net asset value |
||||||||||||||||||
| FOR THE PERIOD ENDED APRIL 30, (Unaudited) | |||||||||||||||||||||||
| 2000 - Class A Shares (commenced April 3) | $10.00 | $0.04 | $0.00 | $(0.02 | ) | $ — | $0.02 | ||||||||||||||||
| 2000 - Class B Shares (commenced April 3) | 10.00 | 0.03 | 0.01 | (0.01 | ) | — | 0.03 | ||||||||||||||||
| 2000 - Class C Shares (commenced April 3) | 10.00 | 0.03 | 0.00 | (0.01 | ) | — | 0.02 | ||||||||||||||||
| 2000 - Institutional Shares (commenced April 3) | 10.00 | 0.04 | 0.00 | (0.02 | ) | — | 0.02 | ||||||||||||||||
| |
|||||||||||||||||||||||
(a)
|
Includes the balancing effect of calculating per
share amounts.
|
(b)
|
Assumes investment at the net asset value at the
beginning of the period, reinvestment of all dividends and
distributions, a complete redemption of the investment at the
net asset value at the end of the period and no sales or
redemption charges. Total return would be reduced if a sales
or redemption charge were taken into account.
|
(c)
|
Annualized.
|
(d)
|
Not
annualized.
|
| Ratios
assuming no
expense limitations |
|||||||||||||||||||||||||||||||||||||||||
|---|---|---|---|---|---|---|---|---|---|---|---|---|---|---|---|---|---|---|---|---|---|---|---|---|---|---|---|---|---|---|---|---|---|---|---|---|---|---|---|---|---|
| Net asset
value, end of period |
Total
return(b) |
Net assets
at end of period (in 000s) |
Ratio of
net expenses to average net assets |
Ratio of net
investment income to average net assets |
Ratio of net
expenses to average net assets |
Ratio of net
investment income to average net assets |
Portfolio
turnover rate |
||||||||||||||||||||||||||||||||||
| $10.02 | 0.40 | % (d) | $59,448 | 0.99 | % (c) | 5.31 | % (c) | 1.33 | % (c) | 4.97 | % (c) | 7.51 | % (d) | ||||||||||||||||||||||||||||
| 10.03 | 0.44 | (d) | 6,548 | 1.74 | (c) | 4.43 | (c) | 2.08 | (c) | 4.09 | (c) | 7.51 | (d) | ||||||||||||||||||||||||||||
| 10.02 | 0.34 | (d) | 6,378 | 1.74 | (c) | 4.17 | (c) | 2.08 | (c) | 3.83 | (c) | 7.51 | (d) | ||||||||||||||||||||||||||||
| 10.02 | 0.43 | (d) | 83,976 | 0.59 | (c) | 5.62 | (c) | 0.93 | (c) | 5.28 | (c) | 7.51 | (d) | ||||||||||||||||||||||||||||
GOLDMAN SACHS FUND PROFILE
Goldman Sachs Tax-Free Funds
In general, tax-free fixed income investments have the potential to offer more attractive after-tax yields than many taxable fixed income investments.
Goldman Sachs Tax-Free Funds offer investors access to the benefits associated with tax-free investing. The Funds seek high levels of current income exempt from regular federal income tax, primarily through investments in municipal securities.
Target Your Needs
The Goldman Sachs Tax-Free Funds have distinct investment objectives and defined positions on the risk/return spectrum. As your investment objectives change, you can exchange shares within Goldman Sachs Funds without any additional charge.* Please note: in general, greater returns are associated with greater risk.
Goldman Sachs Fixed Income Funds
| |
HIGH YEILD
|
|
| Higher
Risk/Return
|
||
|
n High Yield Fund
|
| n Global Income Fund |
| TAXABLE
|
n Core Fixed Income Fund |
| n Government Income Fund |
| n Short Duration Government Fund |
| n Adjustable Rate Government Fund |
| TAX-FREE
|
n High Yield Municipal Fund |
| Lower
Risk/Return
|
n Municipal Income Fund |
| n Short Duration Tax-Free Fund |
For More Information
To learn more about Goldman Sachs Tax-Free Funds and other Goldman Sachs Funds, call your investment professional today.
* The exchange privilege is subject to termination and its terms are subject to change.
The Goldman Sachs Advantage
When you invest in Goldman Sachs Tax-Free Funds, you can capitalize on Goldman Sachs' 131-year history of excellence while benefiting from the firm's leadership in three areas:
1 Global Resources
With professionals based throughout the Americas, Europe
and Asia, Goldman Sachs possesses first-hand knowledge of the
world's markets and economies.
2 Fundamental Research
Goldman Sachs is recognized by the managements of corporations
worldwide as a leader in investment research. As a result, we
obtain face-to-face meetings with managers on a timely, regular
basis.
3 Risk Management
Goldman, Sachs & Co. excels in understanding, monitoring and
managing investment risk -- a process that is integrated into
all Goldman Sachs investment products.
Goldman Sachs Asset Management 32 OLD SLIP, 17TH Floor, New York, New York 10005
| Trustees | Officers | ||
|---|---|---|---|
| Ashok N. Bakhru, Chairman | Douglas C. Grip, President | ||
| David B. Ford | Jesse H. Cole, Vice President | ||
| Douglas C. Grip | Kerry Daniels, Vice President | ||
| John P. McNulty | James A. Fitzpatrick, Vice President | ||
| Mary P. McPherson | Mary Hoppa, Vice President | ||
| Alan A. Shuch | Nancy L. Mucker, Vice President | ||
| Jackson W. Smart, Jr. | John M. Perlowski, Treasurer | ||
| William H. Springer | Philip V. Giuca, Jr., Assistant Treasurer | ||
| Richard P. Strubel | Michael J. Richman, Secretary | ||
| Amy E. Belanger, Assistant Secretary | |||
| Howard B. Surloff, Assistant Secretary | |||
| Valerie A. Zondorak, Assistant Secretary | |||
Goldman, Sachs & Co.
Distributor and Transfer Agent
Goldman Sachs Asset Management
Investment Adviser
Visit our internet address: www.gs.com/funds
This material is not authorized for distribution to prospective investors unless preceded or accompanied by a current Prospectus. Investors should read the Prospectus carefully before investing or sending money.
Goldman Sachs & Co. is the distributor of the Fund.
Under normal conditions, the Short Duration
Tax-Free Fund will invest at least 80% of its net assets in
tax-exempt securities. Although it does not expect to do so, the
Fund may invest up to 20% of its net assets in private activity
bonds that may subject certain investors to the federal
alternative minimum tax. Investment income may be subject to
state income taxes.
The Municipal Income Fund may include securities whose income may be subject to the federal alternative minimum tax and state income taxes.
At times, the High Yield Municipal Fund may be unable to sell certain of its portfolio securities without a substantial drop in price, if at all. Investment income may be subject to state income taxes and the alternative minimum tax. High yield, lower rated securities involve greater price volatility and present greater risks than higher rated fixed income securities.
| Copyright 2000 Goldman, Sachs & Co. All rights reserved. Date of first use: June 30, 2000 / 00-924 | FI/TFSAR / 8K /6-00 |
|
|