
|
|
|
|
|
|
|
|
|
GOLDMAN SACHS ASIA GROWTH FUND
Market Overview
Dear Shareholder:
After generating strong returns in 1999, the Asian stock market has faltered this year, largely due to the correction in technology issues.
- Market Review: Asian Equities Decline — After generating strong performance during the fourth quarter of 1999, Asian stocks as a whole fell through the first eight months of 2000. At the regional level, rising global interest rates had the largest impact, with the banking and property sectors throughout the region taking the brunt of the impact. Individual countries were also negatively impacted by specific events. The Indonesian market suffered under continued conflict and the eventual disintegration of East Timor, while volatile cross-straits relations between Taiwan and China weighed heavily on the Taiwanese market.
- Market Outlook: Cause for Long-term Optimism —Looking ahead, we believe that Asia will benefit from the evolution of dominant technology companies in areas such as semiconductor foundries, software services and contract manufacturing. As such, we expect these companies in Taiwan, Korea, India and Singapore to do well in the medium term. On the macro front, interest rate fears have subsided, and domestic consumption has recovered to normal levels in the past year. Capital investment continues to be sluggish and overcapacity in many industries has been sharply reduced. We remain cautiously optimistic; however, a sustained rise in oil prices could threaten economic growth across the region.
As always, we appreciate your support and we look forward to serving your investment needs in the years to come.
Sincerely,
 |
 |
||
| David B. Ford | David W. Blood | ||
| Co-Head, Goldman Sachs Asset Management | Co-Head, Goldman Sachs Asset Management | ||
| September 15, 2000 |
GOLDMAN SACHS ASIA GROWTH FUND
Fund Basics
as of August 31, 2000
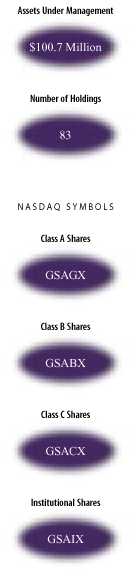
| PERFORMANCE REVIEW | ||||
| Fund Total Return | MSCI AC Asia Free | |||
| August 31, 1999–August 31, 2000 | (without sales charge)1 | (Ex Japan) Index2 | ||
| |
||||
| Class A | 0.72
|
% | –7.46
|
% |
| Class B | 0.18
|
–7.46
|
||
| Class C | 0.18
|
–7.46
|
||
| Institutional | 1.42
|
–7.46
|
||
| |
||||
1 The net asset value represents the net assets of the Fund (ex-dividend) divided by the total number of shares. The Fund’s performance assumes the reinvestment of dividends and other distributions.
2 The unmanaged Morgan Stanley Capital International (MSCI) All Country (AC) Asia Free (ex Japan) Index is a market capitalization-weighted composite of securities in 10 Asian countries, including Hong Kong, India, Indonesia, Malaysia, Pakistan, Singapore, South Korea, Sri Lanka, Thailand and the Philippines. Total returns are calculated without dividends reinvested. “Free” indicates an index that excludes shares in otherwise free markets that are not purchasable by foreigners. The Index figures do not reflect any fees or expenses. Investors cannot invest directly in the Index.
| STANDARDIZED TOTAL RETURNS 3 | ||||||||
| For the period ended 6/30/00 | Class A | Class B | Class C | Institutional | ||||
| |
||||||||
| One Year | 0.09 | % | 0.32 | % | 4.32 | % | 6.57 | % |
| Five Years | –5.82 | N/A
|
N/A
|
N/A
|
||||
| Since Inception | –3.53 | –9.73 | –10.37 | –6.88 | ||||
| (7/8/94) | (5/1/96) | (8/15/97) | (2/2/96) | |||||
| |
||||||||
3 The Standardized Total Returns are average annual total returns or cumulative total returns (only if the performance period is one year or less) as of the most recent calendar quarter-end. They assume reinvestment of all distributions at net asset value. These returns reflect a maximum initial sales charge of 5.5% for Class A shares, the assumed deferred sales charge for Class B shares (5% maximum declining to 0% after six years) and the assumed deferred sales charge for Class C shares (1% if redeemed within 12 months of purchase). Because Institutional and Service shares do not involve a sales charge, such a charge is not applied to their Standardized Total Returns.
Total return figures represent past performance and do not indicate future results, which will vary. The investment return and principal value of an investment will fluctuate and, therefore, an investor’s shares, when redeemed, may be worth more or less than their original cost. Performance reflects expense limitations in effect. In their absence, performance would be reduced.
| TOP 10 COMPANY HOLDINGS AS OF 8/ 31/ 00 | |||
| Company Holding | % of Total Net Assets | Line of Business | |
| |
|||
| Hutchinson Whampoa Ltd. | 7.1 | % | Multi-Industrial |
| Samsung Electronics | 5.8 | Semiconductors | |
| Taiwan Semiconductor | 5.0 | Semiconductors | |
| China Telecom Ltd. | 4.1 | Telecommuications | |
| United Microelectronics Corp. Ltd. | 3.7 | Semiconductors | |
| Infosys Technologies Ltd. | 2.9 | Computer Software | |
| Sun Hung Kai Properties Ltd. | 2.8 | Real Estate | |
| Hang Seng Bank Ltd. | 2.8 | Banks | |
| Li & Fung Ltd. | 2.4 | Wholesale | |
| Korea Electric Power Corp. | 2.4 | Electrical Utilities | |
| |
|||
The top 10 company holdings may not be representative of the Fund’s future investments.
GOLDMAN SACHS ASIA GROWTH FUND
Performance Overview
Dear Shareholder,
We are pleased to report on the performance of the Goldman Sachs Asia Growth Fund for the one year period that ended August 31, 2000.
Performance Review
Over the one-year period that ended August 31, 2000, the Fund’s Class A, B, C and Institutional share classes generated cumulative total returns, without sales charges, of 0.72%, 0.18%, 0.18%, and 1.42%, respectively. Over the same time period, the Fund’s benchmark, the MSCI AC Asia Free (Ex Japan) Index, generated a cumulative total return of –7.46%.
The Fund’s strong returns relative to the benchmark were largely due to astute regional allocations and stock selection.
Portfolio Composition
The Fund made a number of major shifts in its country allocation during the second quarter of 2000, partially in preparation for the re-balancing of the bellwether MSCI regional indices. Exposure was increased to returning constituent Malaysia, as well as to China and Taiwan, which was re-rated upwards. These increases were balanced by lowering our exposure to Hong Kong, Singapore, and some of the other Southeast Asian countries. As the reporting period ended, the Fund held overweight positions in Hong Kong and Taiwan, while underweighting Korea, Malaysia, Indonesia, Philippines and Thailand.
Portfolio Highlights
Portfolio Outlook
Given our view that interest rate fears have subsided, we have positioned the Fund to gain exposure to interest rate sensitive stocks, especially in Hong Kong. Also, in the light of our fear that a sustained rise in oil prices will threaten regional economic growth, our portfolio has been positioned to take this into account. For example, we are currently underweight cyclical and heavy industrial companies, and overweight oil producing companies.
We have a positive medium-term outlook for the semiconductor foundries, Indian software companies and regional contract manufacturers, due to their strong position in the various segments of the global technology value chain. At a country level, we continue to be overweight in the more developed markets of Hong Kong, Singapore and Taiwan. We remain underweight in Korea, due to structural problems in the economy, and remain underweight in the developing markets of Malaysia, Thailand and the Philippines.
We thank you for your investment and we look forward to your continued confidence in the future.
Goldman Sachs Asia Equity Investment Team
Singapore
September 15, 2000
GOLDMAN SACHS ASIA GROWTH FUND
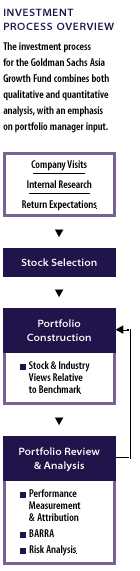
The Goldman Sachs Advantage
Founded in 1869, Goldman, Sachs & Co. is a premier financial services firm traditionally known on Wall Street and around the world for its institutional expertise.
Today, the firm’s Investment Management Division provides individual investors the opportunity to tap the resources of a global institutional powerhouse — and put this expertise to work in their individual portfolios .
What Sets Goldman Sachs Funds Apart? 
Our portfolio management teams are located on-site, around the world, in New York, London, Tokyo and Singapore. Their understanding of local economies, markets, industries and cultures helps deliver what many investors want: access to global investment opportunities and consistent, risk-adjusted performance.

Our portfolio management teams make on-site visits to hundreds of companies each month, then construct selective portfolios with an emphasis on their best ideas. Our teams also have access to Goldman, Sachs & Co.’s Global Investment Research Department.

In this, our institutional heritage is clear. Institutions, as well as many individual investors, often look to us to manage the risks of global investing over time in different market environments.
To learn more about the Goldman Sachs Funds, call your investment professional today.
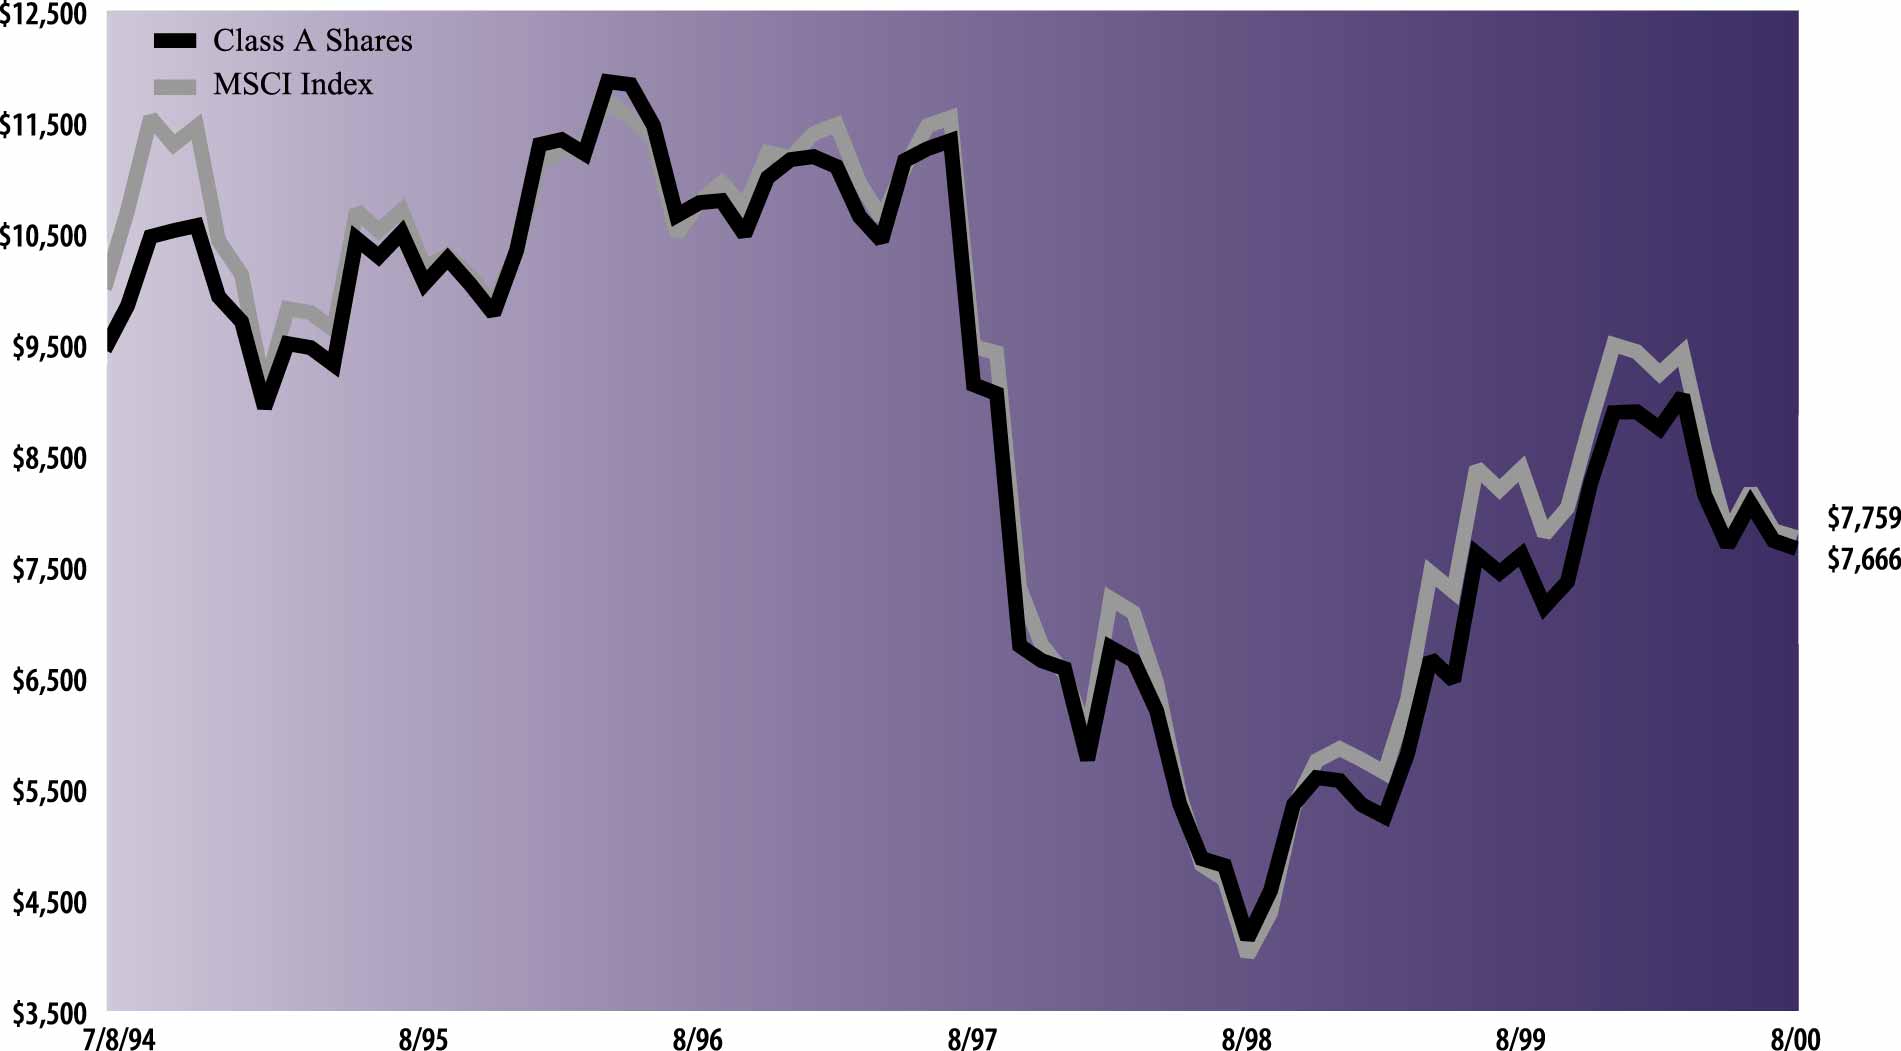
| The following graph shows the value, as of August 31, 2000, of a $10,000 investment made on July 8, 1994 (commencement of
operations) in Class A Shares (maximum sales charge of 5.5%) of the Goldman Sachs Asia Growth Fund. For comparative purposes, the performance of the Fund’s benchmark, the Morgan Stanley All Country Asia Free ex Japan Index (“MSCI Index”) is
shown. This performance data represents past performance and should not be considered indicative of future performance which will fluctuate with changes in market conditions. These performance fluctuations will cause an investor’s shares, when
redeemed, to be worth more or less than their original cost. Performance of Class B, Class C and Institutional Shares will vary from Class A due to differences in fees and loads.
|
| Asia Growth Fund’s Lifetime Performance
|
| Performance of a $10,000 Investment, Distributions Reinvested July 8, 1994 to August 31, 2000
|
 |
| Average Annual Total Return through August 31, 2000 | |||||||
|---|---|---|---|---|---|---|---|
| Since Inception | Five Years | One Year | |||||
| Class A (commenced July 8, 1994) | |||||||
| Excluding sales charges | -3.34% | -5.26% | 0.72% | ||||
| Including sales charges | -4.23% | -6.33% | -4.78% | ||||
| Class B (commenced May 1, 1996) | |||||||
| Excluding contingent deferred sales charges | -10.02% | n/a | 0.18% | ||||
| Including contingent deferred sales charges | -10.44% | n/a | -4.82% | ||||
| Class C (commenced August 15, 1997) | |||||||
| Excluding contingent deferred sales charges | -11.34% | n/a | 0.18% | ||||
| Including contingent deferred sales charges | -11.34% | n/a | -0.82% | ||||
| Institutional Class (commenced February 2, 1996) | -7.64% | n/a | 1.42% | ||||
|
Shares |
Description | Value | |||
|---|---|---|---|---|---|
| Common Stocks – 92.2% | |||||
| China – 6.8% | |||||
| 532,000 | China Mobile Ltd.*
(Telecommunications) |
$ 4,092,832 | |||
| 354,000 | Guangdong Kelon Electrical Holdings
Co. Ltd. Class H (Appliance) |
116,880 | |||
| 9,327,000 | PetroChina Co. Ltd. Class H*†
(Energy Resources) |
2,224,416 | |||
| 1,490,000 | Yanzhou Coal Mining Co. Ltd.
Class H (Mining) |
429,863 | |||
| 6,863,991 | |||||
| Hong Kong – 26.0% | |||||
| 420,000 | Amoy Properties (Real Estate) | 393,127 | |||
| 103,000 | Cheung Kong Holdings Ltd. (Real
Estate) |
1,347,096 | |||
| 202,400 | Dah Sing Financial Holdings (Banks) | 944,655 | |||
| 712,000 | Dickson Concepts International Ltd.
(Specialty Retail) |
634,492 | |||
| 1,840,000 | Giordano International Ltd. (Specialty
Retail) |
1,032,184 | |||
| 261,900 | Hang Seng Bank Ltd. (Banks) | 2,812,428 | |||
| 505,500 | Hutchison Whampoa Ltd. (Multi-
Industrial) |
7,129,760 | |||
| 1,052,000 | Johnson Electric Holdings Ltd.
(Electrical Equipment) |
2,185,203 | |||
| 552,000 | Li & Fung Ltd. (Wholesale) | 2,406,462 | |||
| 1,091,267 | Pacific Century CyberWorks Ltd.*
(Telecommunications) |
2,028,898 | |||
| 399,000 | South China Morning Post Holdings
Ltd. (Publishing) |
299,288 | |||
| 303,000 | Sun Hung Kai Properties Ltd. (Real
Estate) |
2,855,558 | |||
| 257,000 | Swire Pacific Ltd. (Multi-Industrial) | 1,762,983 | |||
| 388,000 | TCL International Holdings Ltd.*
(Electronics Equipment) |
110,694 | |||
| 55,000 | Television Broadcasts Ltd. (Media) | 311,001 | |||
| 26,253,829 | |||||
| India – 8.4% | |||||
| 850 | HCL Technologies Ltd. (Business
Services) |
24,148 | |||
| 11,800 | Hindustan Lever Ltd. (Consumer
Cyclicals) |
61,454 | |||
| 242,021 | Hindustan Lever Ltd. (Consumer
Cyclicals) |
1,260,432 | |||
| 16,800 | Infosys Technologies Ltd. (Computer
Software) |
2,956,184 | |||
| 865 | ITC Ltd. (Tobacco) | 14,689 | |||
| 64,810 | Satyam Computer Services Ltd.
(Business Services) |
813,574 | |||
| 91,700 | Satyam Computer Services Ltd.
(Computer Software) |
1,151,130 | |||
| 92,339 | Videsh Sanchar Nigam Ltd.
(Telecommunications) |
1,635,815 | |||
| 7,700 | Wipro Ltd. (Computer Software) | 552,776 | |||
| 8,470,202 | |||||
|
Shares |
Description | Value | |||
|---|---|---|---|---|---|
| Common Stocks – (continued) | |||||
| Indonesia – 1.4% | |||||
| 145,000 | Gulf Indonesia Resources Ltd.*
(Energy Resources) |
$ 1,450,000 | |||
| Malaysia – 4.9% | |||||
| 159,000 | Arab-Malaysian Finance Berhad-Alien
Market (Banks) |
165,695 | |||
| 148,400 | British American Tobacco
Berhad (Tobacco) |
1,386,368 | |||
| 187,000 | Hong Leong Bank Berhad (Banks) | 337,092 | |||
| 742,000 | IOI Corp. Berhad (Agriculture) | 632,653 | |||
| 106,800 | Malayan Banking Berhad (Banks) | 410,337 | |||
| 451,000 | Road Builder (M) Holdings Berhad
(Construction) |
503,221 | |||
| 153,000 | Star Publications Berhad (Publishing) | 563,684 | |||
| 269,000 | Tenaga Nasional Berhad (Electrical
Utilities) |
899,026 | |||
| 4,898,076 | |||||
| Singapore – 11.3% | |||||
| 194,000 | Chartered Semiconductor
Manufacturing Ltd.* (Semiconductors) |
1,623,148 | |||
| 129,000 | City Developments (Real Estate) | 640,840 | |||
| 40,000 | Datacraft Asia Ltd.
(Telecommunications) |
336,000 | |||
| 179,150 | DBS Group Holdings Ltd. (Banks) | 2,165,081 | |||
| 239,000 | Keppel Land Ltd. (Real Estate) | 370,769 | |||
| 62,000 | SIA Engineering Co.* (Airlines) | 63,041 | |||
| 102,000 | Singapore Airlines Ltd. (Airlines) | 983,789 | |||
| 59,664 | Singapore Press Holdings Ltd.
(Publishing) |
960,254 | |||
| 452,000 | Singapore Technologies Engineering
Ltd. (Machinery) |
609,285 | |||
| 587,000 | Singapore Telecommunications Ltd.
(Telecommunications) |
968,613 | |||
| 235,512 | United Overseas Bank Ltd. (Banks) | 1,847,314 | |||
| 64,000 | Venture Manufacturing Ltd. (Electrical
Equipment) |
818,081 | |||
| 11,386,215 | |||||
| South Korea – 14.4% | |||||
| 16,560 | Hite Brewery Co. (Food & Beverage) | 709,448 | |||
| 38,053 | Housing & Commercial Bank (Banks) | 813,399 | |||
| 72,190 | Hyundai Electronics Industries Co.*
(Electrical Equipment) |
1,321,720 | |||
| 80,780 | Korea Electric Power Corp. (Electrical
Utilities) |
2,375,132 | |||
| 3,900 | Korea Telecom Corp.
(Telecommunications) |
266,976 | |||
| 32,500 | LG Chemical Ltd. (Chemicals) | 548,140 | |||
| 5,577 | Pohang Iron & Steel Co. Ltd. (Steel) | 418,646 | |||
| 23,779 | Samsung Electronics (Semiconductors) | 5,865,665 | |||
| 4,580 | SK Telecom Co. Ltd.
(Telecommunications) |
1,007,910 | |||
|
Shares |
Description | Value | |||
|---|---|---|---|---|---|
| Common Stocks – (continued) | |||||
| South Korea – (continued) | |||||
| 45,248 | SK Telecom Co. Ltd. ADR
(Telecommunications) |
$ 1,159,480 | |||
| 14,486,516 | |||||
| Taiwan – 18.2% | |||||
| 510 | Acer Laboratories, Inc.
(Semiconductors) |
1,577 | |||
| 259,200 | Acer Communications, Inc.
(Computer Hardware) |
601,237 | |||
| 26,000 | Ambit Microsystems Corp. | ||||
| (Electrical Equipment) | 190,142 | ||||
| 1,105,091 | Bank Sinopac (Financial Services) | 630,158 | |||
| 191,352 | Cathay Life Insurance Co. (Insurance) | 440,775 | |||
| 985,488 | Chinatrust Commercial Bank (Banks) | 777,850 | |||
| 193,500 | Compal Electronics, Inc. (Electronic
Components) |
370,917 | |||
| 172,800 | Compeq Manufacturing Co. Ltd.
(Electrical Equipment) |
996,495 | |||
| 136,250 | Delta Electronics, Inc. (Electrical
Equipment) |
522,350 | |||
| 44 | Far Eastern Textile Ltd. (Apparel) | 49 | |||
| 201,820 | Hon Hai Precision (Electrical
Equipment) |
1,540,958 | |||
| 14,500 | Nan Ya Plastic Corp. (Chemicals) | 24,058 | |||
| 389,224 | President Chain Store Corp.
(Merchandising) |
1,153,628 | |||
| 71,000 | Procomp Informatics Co. Ltd.
(Semiconductors) |
391,140 | |||
| 36,481 | Siliconware Precis (Electrical
Equipment) |
56,414 | |||
| 90,700 | Siliconware Precision Industries Co.
ADR (Electrical Equipment) |
657,575 | |||
| 1,171,519 | Taiwan Semiconductor
(Semiconductors) |
5,076,331 | |||
| 1,387,400 | United Microelectronics Corp. Ltd.
(Semiconductors) |
3,687,516 | |||
| 423,800 | Universal Scientific Industrial Co.
Ltd. (Electrical Equipment) |
649,899 | |||
| 216,450 | Winbond Electronics Corp. (Electrical
Equipment) |
536,941 | |||
| 18,306,010 | |||||
| Thailand – 0.8% | |||||
| 138,200 | PTT Exploration & Production
Public-Alien Market (Energy Resources) |
825,075 | |||
| TOTAL COMMON STOCKS | |||||
| (Cost $88,821,757) | $ 92,939,914 | ||||
|
Units |
Description | Value | |||
|---|---|---|---|---|---|
| Warrants – 0.2% | |||||
| South Korea – 0.2% | |||||
| 9,850 | Korea Tobacco & Ginseng Corp.
exp.10/09/00* (Tobacco) |
$ 168,041 | |||
| TOTAL WARRANTS | |||||
| (Cost $316,642) | $ 168,041 | ||||
| Principal
Amount |
Interest
Rate |
Maturity
Date |
Value | |||||
|---|---|---|---|---|---|---|---|---|
| Short-Term Obligation – 2.9% | ||||||||
| State Street Bank & Trust Euro-Time Deposit | ||||||||
| $2,978,000 | 6.56 | % | 09/01/2000 | $ 2,978,000 | ||||
| TOTAL SHORT-TERM OBLIGATION | ||||||||
| (Cost $2,978,000) | $ 2,978,000 | |||||||
| TOTAL INVESTMENTS | ||||||||
| (Cost $92,116,399) | $96,085,955 | |||||||
*
|
Non-income producing security.
|
†
|
Security is exempt from registration under rule 144A of the Securities Act of 1933. Such a security may be resold, normally to
qualified institutional buyers in transactions exempt from registration. The market value of 144A securities amounts to $2,224,416 as of August 31, 2000.
|
| The percentage shown for each investment category reflects the value of investments in that category as a percentage of total net
assets.
|
| |
| Investment Abbreviations:
|
| ADR—American Depositary Receipt
|
| |
| As a % of
Total Net Assets |
|||||
|---|---|---|---|---|---|
| Common Stock Industry Classifications† | |||||
| Agriculture | 0.6 | % | |||
| Airlines | 1.0 | ||||
| Appliance | 0.1 | ||||
| Banks | 10.2 | ||||
| Business Services | 0.8 | ||||
| Chemicals | 0.6 | ||||
| Computer Hardware | 0.6 | ||||
| Computer Software | 4.6 | ||||
| Construction | 0.5 | ||||
| Consumer Cyclicals | 1.3 | ||||
| Electrical Equipment | 9.5 | ||||
| Electrical Utilities | 3.3 | ||||
| Electronic Components | 0.4 | ||||
| Electronics Equipment | 0.1 | ||||
| Energy Resources | 4.5 | ||||
| Financial Services | 0.6 | ||||
| Food & Beverage | 0.7 | ||||
| Insurance | 0.4 | ||||
| Machinery | 0.6 | ||||
| Media | 0.3 | ||||
| Merchandising | 1.2 | ||||
| Mining | 0.4 | ||||
| Multi-Industrial | 8.8 | ||||
| Publishing | 1.8 | ||||
| Real Estate | 5.6 | ||||
| Semiconductors | 16.4 | ||||
| Specialty Retail | 1.7 | ||||
| Steel | 0.4 | ||||
| Telecommunications | 11.4 | ||||
| Tobacco | 1.4 | ||||
| Wholesale | 2.4 | ||||
| TOTAL COMMON STOCK | 92.2 | % | |||
†
|
Industry concentrations greater than one tenth of one percent are disclosed.
|
| Assets: | ||||
| Investment in securities, at value (identified cost $92,116,399) | $ 96,085,955 | |||
| Cash, at value | 5,054,404 | |||
| Receivables: | ||||
| Investment securities sold, at value | 4,083,726 | |||
| Fund shares sold | 876,584 | |||
| Reimbursement from adviser | 225,340 | |||
| Dividends and interest, at value | 114,112 | |||
| Other assets | 40,330 | |||
| Total assets | 106,480,451 | |||
| Liabilities: | ||||
| Payables: | ||||
| Investment securities purchased, at value | 5,152,178 | |||
| Amounts owed to affiliates | 149,965 | |||
| Fund shares repurchased | 276,190 | |||
| Capital gains tax, at value | 8,098 | |||
| Accrued expenses and other liabilities | 85,825 | |||
| Total liabilities | 5,672,256 | |||
| Net Assets: | ||||
| Paid-in capital | 169,933,410 | |||
| Accumulated net investment loss | (372,165 | ) | ||
| Accumulated net realized loss on investment, futures and foreign currency related transactions | (72,751,513 | ) | ||
| Net unrealized gain on investments, futures and translation of assets and liabilities denominated in foreign currencies | 3,998,463 | |||
| NET ASSETS | $100,808,195 | |||
| Net asset value, offering and redemption price per share:(a) | ||||
| Class A | $11.16 | |||
| Class B | $10.91 | |||
| Class C | $10.88 | |||
| Institutional | $11.41 | |||
| Shares outstanding: | ||||
| Class A | 7,746,375 | |||
| Class B | 627,533 | |||
| Class C | 208,108 | |||
| Institutional | 458,932 | |||
| Total shares outstanding, $.001 par value (unlimited number of shares authorized) | 9,040,948 | |||
(a)
|
Maximum public offering price per share (NAV per share multiplied by 1.0582) for Class A shares is $11.80. At redemption, Class B
and Class C shares may be subject to a deferred contingent sales charge, assessed on the amount equal to the lesser of the current net asset value or the original purchase price of the shares.
|
| Investment income: | ||||
| Dividends (a) | $ 1,416,316 | |||
| Interest | 271,907 | |||
| Total income | 1,688,223 | |||
| Expenses: | ||||
| Management fees | 1,168,382 | |||
| Distribution and Service fees (b) | 584,391 | |||
| Custodian fees | 466,832 | |||
| Transfer Agent fees (c) | 205,690 | |||
| Registration fees | 68,501 | |||
| Professional fees | 49,306 | |||
| Trustee fees | 8,901 | |||
| Other | 125,617 | |||
| Total expenses | 2,677,620 | |||
| Less — expense reductions | (527,542 | ) | ||
| Net expenses | 2,150,078 | |||
| NET INVESTMENT LOSS | (461,855 | ) | ||
| Realized and unrealized gain (loss) on investment, futures and foreign currency transactions: | ||||
| Net realized gain (loss) from: | ||||
| Investment transactions | 21,929,849 | |||
| Futures transactions | 24,408 | |||
| Foreign currency related transactions | (457,786 | ) | ||
| Net change in unrealized gain (loss) on: | ||||
| Investments | (17,712,839 | ) | ||
| Translation of assets and liabilities denominated in foreign currencies | (1,827 | ) | ||
| Net realized and unrealized gain on investment, futures and foreign currency transactions | 3,781,805 | |||
| NET INCREASE IN NET ASSETS RESULTING FROM OPERATIONS | $ 3,319,950 | |||
(a)
|
Foreign taxes withheld on dividends were $170,962.
|
(b)
|
Class A, Class B and Class C had Distribution and Service fees of $475,309, $81,059 and $28,023, respectively.
|
(c)
|
Class A, Class B, Class C, Institutional Class and Service Class had Transfer Agent fees of $180,618, $15,401, $5,324, $4,347 and
$0, respectively.
|
| For the
Year Ended August 31, 2000 |
For the
Seven Months Ended August 31, 1999 |
For the
Year Ended January 31, 1999 |
||||||||
|---|---|---|---|---|---|---|---|---|---|---|
| From operations: | ||||||||||
| Net investment income (loss) | $ (461,855 | ) | $ (189,728 | ) | $ 492,262 | |||||
| Net realized gain (loss) from investment, futures and foreign currency related transactions | 21,496,471 | 3,213,321 | (27,883,885 | ) | ||||||
| Net change in unrealized gain (loss) on investments and translation of assets and
liabilities denominated in foreign currencies |
(17,714,666 | ) | 26,462,083 | 21,285,501 | ||||||
| Net increase (decrease) in net assets resulting from operations | 3,319,950 | 29,485,676 | (6,106,122 | ) | ||||||
| Distributions to shareholders: | ||||||||||
| In excess of net investment income | ||||||||||
| Institutional Shares | — | (43,226 | ) | — | ||||||
| Total distributions to shareholders | — | (43,226 | ) | — | ||||||
| From share transactions: | ||||||||||
| Proceeds from sales of shares | 144,806,450 | 97,742,029 | 138,273,446 | |||||||
| Reinvestment of dividends and distributions | — | 40,413 | — | |||||||
| Cost of shares repurchased | (153,488,825 | ) | (90,383,194 | ) | (154,943,929 | ) | ||||
| Net increase (decrease) in net assets resulting from share transactions | (8,682,375 | ) | 7,399,248 | (16,670,483 | ) | |||||
| TOTAL INCREASE (DECREASE) | (5,362,425 | ) | 36,841,698 | (22,776,605 | ) | |||||
| Net assets: | ||||||||||
| Beginning of period | 106,170,620 | 69,328,922 | 92,105,527 | |||||||
| End of period | $100,808,195 | $106,170,620 | $ 69,328,922 | |||||||
| Accumulated net investment loss | $ (372,165 | ) | $ — | $ (105,797 | ) | |||||
| 1. ORGANIZATION
|
| Goldman Sachs Trust (the “Trust”) is a Delaware business trust registered under the Investment Company Act of 1940 (as
amended) as an open-end management investment company. The Trust includes the Goldman Sachs Asia Growth Fund (the “Fund”). The Fund is a diversified portfolio offering five classes of shares — Class A, Class B, Class C,
Institutional and Service (Service shares have not commenced operations).
|
| 2. SIGNIFICANT ACCOUNTING POLICIES
|
| The following is a summary of the significant accounting policies consistently followed by the Fund. The preparation of financial
statements in conformity with generally accepted accounting principles requires management to make estimates and assumptions that may affect the reported amounts. Actual results could differ from those estimates. Effective for fiscal year 1999, the Board
of Trustees approved a change in the fiscal year end of the Fund from January 31 to August 31. Accordingly, the Statements of Changes in Net Assets, Summary of Share Transactions and Financial Highlights of the Fund are included for the seven months ended
August 31, 1999 and the year ended January 31, 1999.
|
| A. Investment Valuation — Investments in
securities traded on a U.S. or foreign securities exchange or the NASDAQ system are valued daily at their last sale price on the principal exchange on which they are traded. If no sale occurs, securities are valued at the last bid price. Debt securities
are valued at prices supplied by independent pricing services, broker/dealer-supplied valuations or matrix pricing systems. Unlisted equity and debt securities for which market quotations are available are valued at the last sale price on the valuation
date or, if no sale occurs, at the last bid price. Short-term debt obligations maturing in sixty days or less are valued at amortized cost, which approximates market value. Securities for which quotations are not readily available are valued at fair value
using methods approved by the Board of Trustees of the Trust.
|
| Investing in emerging markets may involve special risks and considerations not
typically associated with investing in the United States. These risks include revaluation of currencies, high rates of inflation, repatriation restrictions on income and capital and future adverse political and economic developments. Moreover, securities
issued in these markets may be less liquid, subject to government ownership controls, delayed settlements, and their prices may be more volatile than those of comparable securities in the United States.
|
| B. Security Transactions and Investment Income — Security transactions are recorded as of the trade date. Realized gains and losses on sales of portfolio securities are calculated using the identified-cost basis. Dividend income is recorded on the ex-dividend date, net of foreign withholding taxes
where applicable. Dividends for which the Fund has the choice to receive either cash or stock are recognized as investment income in an amount equal to the cash dividend. Interest income is recorded on the basis of interest accrued, premium amortized and
discount earned. In addition, it is the Fund’s policy to accrue for estimated capital gains taxes on appreciated foreign securities held.
|
| Net investment income (other than class specific expenses) and unrealized and
realized gains or losses are allocated daily to each class of shares of the Fund based upon the relative proportion of net assets of each class.
|
| 2. SIGNIFICANT ACCOUNTING POLICIES (continued)
|
| C. Federal Taxes — It is the Fund’s
policy to comply with the requirements of the Internal Revenue Code applicable to regulated investment companies and to distribute each year substantially all of its investment company taxable income and capital gains to its shareholders. Accordingly, no
federal tax provision is required. Income and capital gain distributions, if any, are declared and paid annually.
|
| The Fund had approximately $71,481,000 at August 31, 2000 (the Fund’s tax
year end) of capital loss carryforwards expiring 2005 through 2007 for federal tax purposes. These amounts are available to be carried forward to offset future capital gains to the extent permitted by applicable laws or regulations.
|
| The characterization of distributions to shareholders for financial reporting
purposes is determined in accordance with income tax rules. Therefore, the source of the Fund’s distributions may be shown in the accompanying financial statements as either from or in excess of net investment income or net realized gain on
investment transactions, or from paid-in capital, depending on the type of book / tax differences that may exist. At August 31, 2000, the aggregate cost of portfolio securities for federal income tax purposes is $93,387,029. Accordingly, the gross
unrealized gain on investments was $8,383,096 and the gross unrealized loss on investments was $5,684,170 resulting in a net unrealized gain of $2,698,926.
|
| D. Expenses — Expenses incurred by the
Trust which do not specifically relate to an individual Fund of the Trust are allocated to the Funds based on a straight-line or pro rata basis depending on the nature of the expense.
|
| Class A, Class B and Class C shares bear all expenses and fees relating to their
respective Distribution and Service plans. Each class of shares of the Fund separately bears its respective class-specific transfer agency fees.
|
| E. Foreign Currency Translations — The
books and records of the Fund are maintained in U.S. dollars. Amounts denominated in foreign currencies are translated into U.S. dollars on the following basis: (i) investment valuations, foreign currency and other assets and liabilities initially
expressed in foreign currencies are converted each business day into U.S. dollars based on current exchange rates; (ii) purchases and sales of foreign investments, income and expenses are converted into U.S. dollars based on currency exchange rates
prevailing on the respective dates of such transactions.
|
| Net realized and unrealized gain (loss) on foreign currency transactions will
represent: (i) foreign exchange gains and losses from the sale and holdings of foreign currencies; (ii) currency gains and losses between trade date and settlement date on investment securities transactions and forward exchange contracts; and (iii) gains
and losses from the difference between amounts of dividends, interest and foreign withholding taxes recorded and the amounts actually received.
|
| F. Derivative Financial Instruments — The
Fund may utilize derivative financial instruments such as structured notes and equity swaps. Such instruments are used by the Fund as a means of investing in a particular market or increasing the return on the Fund’s investments or both. The value of
the principal and/or interest on such securities is determined by reference to changes in the value of the financial indicators including, but not limited to indices, currencies or interest rates. These financial instruments may subject the Fund to a
greater degree of market or counterparty risk and loss than other types of securities.
|
| G. Segregation Transactions — The Fund may
enter into certain derivative transactions to seek to increase total return. Forward foreign currency exchange contracts, futures contracts, written options, mortgage dollar rolls, when-issued securities and forward commitments represent examples of such
transactions. As a result of entering into these transactions, the Fund is required to segregate liquid assets on the accounting records equal to or greater than the market value of the corresponding transactions.
|
| 3. AGREEMENTS
|
| Pursuant to the Investment Management Agreement (the “Agreement”), Goldman Sachs Asset Management International (“
GSAMI”), an affiliate of Goldman Sachs, Sachs & Co. (“Goldman Sachs”), serves as the investment adviser to the Fund. Under the Agreement, GSAMI, subject to the general supervision of the Trust’s Board of Trustees, manages the
Fund’s portfolio. As compensation for the services rendered under the Agreement, the assumption of the expenses related thereto and administering the Fund’s business affairs, including providing facilities, GSAMI is entitled to a fee, computed
daily and payable monthly, at an annual rate equal to 1.00% of the average daily net assets of the Fund.
|
| The investment adviser has voluntarily agreed to limit certain “Other
Expenses” (excluding Management fees, Distribution and Service fees, Transfer agent fees, taxes, interest, brokerage, litigation, indemnification costs and other extraordinary expenses) to the extent such expenses exceed, on an annual basis, 0.16% of
the average daily net assets of the Fund. Goldman Sachs reimbursed approximately $523,000 for the year ended August 31, 2000. In addition, the Fund has entered into certain offset arrangements with the custodian resulting in a reduction in the Fund’s
expenses. For the year ended August 31, 2000, Custody fees were reduced by approximately $5,000.
|
| The Trust, on behalf of the Fund, has adopted Distribution and Service Plans.
Under the Distribution and Service Plans, Goldman Sachs and/or authorized dealers are entitled to a monthly fee from the Fund for distribution and shareholder maintenance services equal, on an annual basis, to 0.50%, 1.00% and 1.00% of the Fund’s
average daily net assets attributable to Class A, Class B and Class C Shares, respectively.
|
| Goldman Sachs serves as the distributor of shares of the Fund pursuant to a
Distribution Agreement. Goldman Sachs may receive a portion of the Class A sales load and Class B and Class C contingent deferred sales charges and has advised the Fund that it retained approximately $92,000 for the year ended August 31, 2000.
|
| Goldman Sachs also serves as the Transfer Agent of the Fund for a fee. The fees
charged for such transfer agency services are calculated daily and payable monthly at an annual rate as follows: 0.19% of average daily net assets for Class A, Class B and Class C Shares and 0.04% of average daily net assets for Institutional Shares.
|
| As of August 31, 2000, the amounts owed to affiliates were approximately $88,000,
$46,000 and $16,000 for Management, Distribution and Service and Transfer Agent fees, respectively.
|
| 4. PORTFOLIO SECURITIES TRANSACTIONS
|
| The cost of purchases and proceeds of sales and maturities of securities (excluding short-term investments and futures
transactions) for the year ended August 31, 2000, were $223,287,721 and $239,283,135 respectively.
|
| For the year ended August 31, 2000, Goldman Sachs earned approximately $92,000 of
brokerage commissions from portfolio transactions, including futures transactions executed on behalf of the Fund.
|
| Futures Contracts — The Fund may enter into futures
transactions to hedge against changes in interest rates, securities prices, currency exchange rates or to seek to increase total return. Upon entering into a futures contract, the Fund is required to deposit with a broker or the Fund’s custodian
bank, an amount of cash or securities equal to the minimum “initial margin” requirement of the associated futures exchange. Subsequent payments for futures contracts (“variation margin”) are paid or received by the Fund, depending on
the fluctuations in the value of the contracts, and are recorded as unrealized gains or losses. When contracts are closed, the Fund realizes a gain or loss which is reported in the Statement of Operations.
|
| The use of futures contracts involve, to varying degrees, elements of market risk
which may exceed the amounts recognized in the Statement of Assets and Liabilities. Changes in the value of the futures contracts may not directly correlate with changes in the value of the underlying securities. This risk may decrease the effectiveness
of the Fund’s hedging strategies and potentially result in a loss. At August 31, 2000, the Fund had no open futures contracts.
|
| 4. PORTFOLIO SECURITIES TRANSACTIONS (continued)
|
| Forward Foreign Currency Exchange Contracts — The
Fund may enter into forward foreign currency exchange contracts for the purchase or sale of a specific foreign currency at a fixed price on a future date as a hedge or cross-hedge against either specific transactions or portfolio positions. The Fund may
also purchase and sell such contracts to seek to increase total return. All commitments are “marked-to-market” daily at the applicable translation rates and any resulting gains or losses are recorded in the Fund’s financial statements. The
Fund realizes gains or losses at the time a forward contract is offset by entry into a closing transaction or extinguished by delivery of the currency. Risks may arise upon entering these contracts from the potential inability of counterparties to meet
the terms of their contracts and from unanticipated movements in the value of a foreign currency relative to the U.S. dollar. At August 31, 2000, the Fund had no open forward foreign currency exchange contracts.
|
| Option Accounting Principles — When the Fund writes
call or put options, an amount equal to the premium received is recorded as an asset and as an equivalent liability. The amount of the liability is subsequently marked-to-market to reflect the current market value of the option written. When a written
option expires on its stipulated expiration date or the Fund enters into a closing purchase transaction, the Fund realizes a gain or loss without regard to any unrealized gain or loss on the underlying security, and the liability related to such option is
extinguished. When a written call option is exercised, the Fund realizes a gain or loss from the sale of the underlying security, and the proceeds of the sale are increased by the premium originally received. When a written put option is exercised, the
amount of the premium originally received will reduce the cost of the security which the Fund purchases upon exercise. There is a risk of loss from a change in value of such options which may exceed the related premiums received.
|
| Upon the purchase of a call option or a protective put option by the Fund, the
premium paid is recorded as an investment and subsequently marked-to-market to reflect the current market value of the option. If an option which the Fund has purchased expires on the stipulated expiration date, the Fund will realize a loss in the amount
of the cost of the option. If the Fund enters into a closing sale transaction, the Fund will realize a gain or loss, depending on whether the sale proceeds for the closing sale transaction are greater or less than the cost of the option. If the Fund
exercises a purchased put option, the Fund will realize a gain or loss from the sale of the underlying security, and the proceeds from such sale will be decreased by the premium originally paid. If the Fund exercises a purchased call option, the cost of
the security which the Fund purchases upon exercise will be increased by the premium originally paid. At August 31, 2000, there were no open written option contracts.
|
| 5. LINE OF CREDIT FACILITY
|
| Effective May 31, 2000, the Fund participates in a $350,000,000 committed, unsecured revolving line of credit facility. Prior
thereto, the Fund participated in a $250,000,000 uncommitted and a $250,000,000 committed, unsecured revolving line of credit facility. Under the most restrictive arrangement, the Fund must own securities having a market value in excess of 400% of the
total bank borrowings. These facilities are to be used solely for temporary or emergency purposes. The interest rate on borrowings is based on the Federal Funds rate. The committed facility also requires a fee to be paid by the Fund based on the amount of
the commitment which has not been utilized. During the year ended August 31, 2000, the Fund did not have any borrowings under any of these facilities.
|
| 6. CHANGE IN INDEPENDENT ACCOUNTANTS
|
| On October 26, 1999, the Board of Trustees of the Portfolios, upon the recommendation of the Board’s audit committee,
determined not to retain Arthur Andersen LLP and approved a change of the Fund’s independent accountants to PricewaterhouseCoopers LLP. For the period ended August 31, 1999 and the year ended January 31, 1999, Arthur Andersen LLP audit reports
contained no adverse opinion or disclaimer of opinion; nor were their reports qualified as to uncertainty, audit scope, or accounting principles. Further, there were no disagreements between the Fund and Arthur Andersen LLP on accounting principles or
practices, financial statement disclosure or audit scope or procedure, which if not resolved to the satisfaction of Arthur Andersen LLP would have caused them to make reference to the disagreement in their reports.
|
| 7. CERTAIN RECLASSIFICATIONS
|
| In accordance with Statement of Position 93-2, the Fund reclassified $89,690 from paid-in capital to accumulated net investment
loss and $2,643,953 from paid-in capital to accumulated net realized loss from investment, futures and foreign currency related transactions. These reclassifications have no impact on the net asset value of the Fund and are designed to present the
Fund’s capital accounts on a tax basis. Reclassifications result primarily from the difference in the tax treatment of foreign currency and net operating losses.
|
| 8. SUMMARY OF SHARE TRANSACTIONS
|
| Share activity is as follows:
|
| For the Year
Ended August 31, 2000 |
For the Seven Months Ended August 31, 1999 |
For the Year Ended January 31, 1999 |
|||||||||||||||||
|---|---|---|---|---|---|---|---|---|---|---|---|---|---|---|---|---|---|---|---|
| Shares | Dollars | Shares | Dollars | Shares | Dollars | ||||||||||||||
| Class A Shares | |||||||||||||||||||
| Shares sold | 11,913,197 | $138,502,220 | 7,428,461 | $68,519,866 | 15,227,587 | $114,095,624 | |||||||||||||
| Shares repurchased | (11,775,948 | ) | (138,970,536 | ) | (7,511,626 | ) | (69,221,284 | ) | (17,965,578 | ) | (136,028,026 | ) | |||||||
| 137,249 | (468,316 | ) | (83,165 | ) | (701,418 | ) | (2,737,991 | ) | (21,932,402 | ) | |||||||||
| Class B Shares | |||||||||||||||||||
| Shares sold | 202,864 | 2,476,344 | 201,786 | 2,022,897 | 345,699 | 2,823,123 | |||||||||||||
| Shares repurchased | (242,422 | ) | (2,884,327 | ) | (80,372 | ) | (733,280 | ) | (204,359 | ) | (1,519,808 | ) | |||||||
| (39,558 | ) | (407,983 | ) | 121,414 | 1,289,617 | 141,340 | 1,303,315 | ||||||||||||
| Class C Shares | |||||||||||||||||||
| Shares sold | 231,312 | 2,696,102 | 2,420,991 | 19,122,822 | 2,148,809 | 16,213,829 | |||||||||||||
| Shares repurchased | (233,490 | ) | (2,757,642 | ) | (2,340,851 | ) | (18,439,726 | ) | (2,071,174 | ) | (15,859,777 | ) | |||||||
| (2,178 | ) | (61,540 | ) | 80,140 | 683,096 | 77,635 | 354,052 | ||||||||||||
| Institutional Shares | |||||||||||||||||||
| Shares sold | 88,366 | 1,131,784 | 753,741 | 8,076,444 | 636,785 | 5,140,870 | |||||||||||||
| Reinvestment of dividends
and distributions |
— | — | 3,661 | 40,413 | — | — | |||||||||||||
| Shares repurchased | (729,131 | ) | (8,876,320 | ) | (188,772 | ) | (1,988,904 | ) | (209,306 | ) | (1,536,318 | ) | |||||||
| (640,765 | ) | (7,744,536 | ) | 568,630 | 6,127,953 | 427,479 | 3,604,552 | ||||||||||||
| NET INCREASE
(DECREASE) |
(545,252 | ) | $ (8,682,375 | ) | 687,019 | $ 7,399,248 | (2,091,537 | ) | $ (16,670,483 | ) | |||||||||
| Income from
investment operations |
Distributions to shareholders |
||||||||||||||||||||||
|---|---|---|---|---|---|---|---|---|---|---|---|---|---|---|---|---|---|---|---|---|---|---|---|
|
Net asset value, beginning of period |
Net
investment income (loss) |
Net realized
and unrealized gain (loss) |
Total income
from investment operations |
From net
investment income |
In excess
of net investment income |
From net
realized gains |
Total
distributions |
||||||||||||||||
| FOR THE YEAR ENDED AUGUST 31, | |||||||||||||||||||||||
| 2000 - Class A Shares | $11.07 | $(0.05) (c) | $0.14 | $0.09 | $ — | $ — | $ — | $ — | |||||||||||||||
| 2000 - Class B Shares | 10.88 | (0.11) (c) | 0.14 | 0.03 | — | — | — | — | |||||||||||||||
| 2000 - Class C Shares | 10.85 | (0.11) (c) | 0.14 | 0.03 | — | — | — | — | |||||||||||||||
| 2000 - Institutional Shares | 11.24 | 0.01 (c) | 0.16 | 0.17 | — | — | — | — | |||||||||||||||
| FOR THE SEVEN-MONTH PERIOD ENDED AUGUST 31, | |||||||||||||||||||||||
| 1999 - Class A Shares | 7.79 | (0.02) | 3.30 | 3.28 | — | — | — | — | |||||||||||||||
| 1999 - Class B Shares | 7.68 | (0.04) | 3.24 | 3.20 | — | — | — | — | |||||||||||||||
| 1999 - Class C Shares | 7.68 | (0.04) | 3.21 | 3.17 | — | — | — | — | |||||||||||||||
| 1999 - Institutional Shares | 7.91 | 0.01 | 3.36 | 3.37 | — | (0.04 | ) | — | — | ||||||||||||||
| FOR THE YEARS ENDED JANUARY 31, | |||||||||||||||||||||||
| 1999 - Class A Shares | 8.38 | 0.07 | (0.66 | ) | (0.59 | ) | — | — | — | — | |||||||||||||
| 1999 - Class B Shares | 8.31 | 0.01 | (0.64 | ) | (0.63 | ) | — | — | — | — | |||||||||||||
| 1999 - Class C Shares | 8.29 | — | (0.61 | ) | (0.61 | ) | — | — | — | — | |||||||||||||
| 1999 - Institutional Shares | 8.44 | 0.03 | (0.56 | ) | (0.53 | ) | — | — | — | — | |||||||||||||
| 1998 - Class A Shares | 16.31 | — | (7.90 | ) | (7.90 | ) | — | (0.03 | ) | — | (0.03 | ) | |||||||||||
| 1998 - Class B Shares | 16.24 | 0.01 | (7.91 | ) | (7.90 | ) | — | (0.03 | ) | — | (0.03 | ) | |||||||||||
| 1998 - Class C Shares (commenced
August 15, 1997) |
15.73 | 0.01 | (7.42 | ) | (7.41 | ) | — | (0.03 | ) | — | (0.03 | ) | |||||||||||
| 1998 - Institutional Shares | 16.33 | 0.10 | (7.96 | ) | (7.86 | ) | (0.03 | ) | — | — | (0.03 | ) | |||||||||||
| 1997 - Class A Shares | 16.49 | 0.06 | (0.11 | ) | (0.05 | ) | (0.12 | ) | — | (0.01 | ) | (0.13 | ) | ||||||||||
| 1997 - Class B Shares (commenced
May 1, 1996) |
17.31 | (0.05) | (0.48 | ) | (0.53 | ) | (0.51 | ) | (0.03 | ) | — | (0.54 | ) | ||||||||||
| 1997 - Institutional Shares (commenced
February 2, 1996) |
16.61 | 0.04 | (0.11 | ) | (0.07 | ) | (0.11 | ) | (0.06 | ) | (0.04 | ) | (0.21 | ) | |||||||||
| 1996 - Class A Shares | 13.31 | 0.17 | 3.44 | 3.61 | (0.12 | ) | (0.14 | ) | (0.17 | ) | (0.43 | ) | |||||||||||
(a)
|
Assumes investment at the net asset value at the beginning of the period, reinvestment of all dividends and distributions, a
complete redemption of the investment at the net asset value at the end of the period and no sales or redemption charges. Total return would be reduced if a sales or redemption charge were taken into account. Total returns for periods less than one full
year are not annualized.
|
(b)
|
Annualized.
|
(c)
|
Calculated based on the average shares outstanding methodology.
|
|
Ratios assuming no expense reductions |
|||||||||||||||||||||
|---|---|---|---|---|---|---|---|---|---|---|---|---|---|---|---|---|---|---|---|---|---|
| Net asset
value, end of period |
Total
return (a) |
Net assets
at end of period (in 000s) |
Ratio of
net expenses to average net assets |
Ratio of
net investment income (loss) to average net assets |
Ratio of
expenses to average net assets |
Ratio of
net investment income (loss) to average net assets |
Portfolio
turnover rate |
||||||||||||||
| $11.16 | 0.72 | % | $ 86,458 | 1.85 | % | (0.39 | )% | 2.30 | % | (0.84 | )% | 207.22 | % | ||||||||
| 10.91 | 0.18 | 6,849 | 2.35 | (0.91 | ) | 2.80 | (1.36 | ) | 207.22 | ||||||||||||
| 10.88 | 0.18 | 2,265 | 2.35 | (0.91 | ) | 2.80 | (1.36 | ) | 207.22 | ||||||||||||
| 11.41 | 1.42 | 5,236 | 1.20 | 0.12 | 1.65 | (0.33 | ) | 207.22 | |||||||||||||
| 11.07 | 42.11 | 84,269 | 1.85 | (b) | (0.38 | ) (b) | 2.27 | (b) | (0.80 | ) (b) | 96.58 | ||||||||||
| 10.88 | 41.67 | 7,258 | 2.35 | (b) | (0.90 | ) (b) | 2.77 | (b) | (1.32 | ) (b) | 96.58 | ||||||||||
| 10.85 | 41.28 | 2,281 | 2.35 | (b) | (0.89 | ) (b) | 2.77 | (b) | (1.31 | ) (b) | 96.58 | ||||||||||
| 11.24 | 42.61 | 12,363 | 1.20 | (b) | (0.14 | ) (b) | 1.62 | (b) | (0.28 | ) (b) | 96.58 | ||||||||||
| 7.79 | (7.04 | ) | 59,940 | 1.93 | 0.63 | 2.48 | 0.08 | 106.00 | |||||||||||||
| 7.68 | (7.58 | ) | 4,190 | 2.45 | 0.10 | 2.97 | (0.42 | ) | 106.00 | ||||||||||||
| 7.68 | (7.36 | ) | 999 | 2.45 | 0.10 | 2.97 | (0.42 | ) | 106.00 | ||||||||||||
| 7.91 | (6.28 | ) | 4,200 | 1.16 | 1.10 | 1.68 | 0.58 | 106.00 | |||||||||||||
| 8.38 | (48.49 | ) | 87,437 | 1.75 | 0.31 | 1.99 | 0.07 | 105.16 | |||||||||||||
| 8.31 | (48.70 | ) | 3,359 | 2.30 | (0.29 | ) | 2.50 | (0.49 | ) | 105.16 | |||||||||||
| 8.29 | (47.17 | ) | 436 | 2.35 | (b) | (0.26 | ) (b) | 2.55 | (b) | (0.46 | ) (b) | 105.16 | |||||||||
| 8.44 | (48.19 | ) | 874 | 1.11 | 0.87 | 1.31 | 0.67 | 105.16 | |||||||||||||
| 16.31 | (1.01 | ) | 263,014 | 1.67 | 0.20 | 1.87 | — | 48.40 | |||||||||||||
| 16.24 | (6.02 | ) | 3,354 | 2.21 | (b) | (0.56 | ) (b) | 2.37 | (b) | (0.72 | ) (b) | 48.40 | |||||||||
| 16.33 | (1.09 | ) | 13,322 | 1.10 | (b) | 0.54 | (b) | 1.26 | (b) | 0.38 | (b) | 48.40 | |||||||||
| 16.49 | 26.49 | 205,539 | 1.77 | 1.05 | 2.02 | 0.80 | 88.80 | ||||||||||||||
| To the Shareholders and Board of Trustees of
Goldman Sachs Trust — Asia Growth Fund: |
| In our opinion, the accompanying statement of assets and liabilities, including the statement of investments, and the related
statements of operations and of changes in net assets and the financial highlights present fairly, in all material respects, the financial position of Goldman Sachs Asia Growth Fund (“the Fund”), one of the portfolios constituting Goldman Sachs
Trust at August 31, 2000, the results of its operations, the changes in its net assets and the financial highlights for the year then ended, in conformity with accounting principles generally accepted in the United States of America. These financial
statements and financial highlights (hereafter referred to as “financial statements”) are the responsibility of the Fund’s management; our responsibility is to express an opinion on these financial statements based on our audit. We
conducted our audit of these financial statements in accordance with auditing standards generally accepted in the United States of America, which require that we plan and perform the audit to obtain reasonable assurance about whether the financial
statements are free of material misstatement. An audit includes examining, on a test basis, evidence supporting the amounts and disclosures in the financial statements, assessing the accounting principles used and significant estimates made by management,
and evaluating the overall financial statement presentation. We believe that our audit, which included confirmation of securities at August 31, 2000 by correspondence with the custodian and brokers, provides a reasonable basis for our opinion. The
statements of changes in net assets of the Fund for the period ended August 31, 1999 and the year ended January 31, 1999 and the financial highlights for each of the periods ended on or before August 31, 1999 were audited by other independent accountants
whose report dated October 8, 1999 expressed an unqualified opinion thereon.
|
| PricewaterhouseCoopers LLP
|
| Boston, Massachusetts
|
| October 23, 2000
|
GOLDMAN SACHS FUND PROFILE
Goldman Sachs Asia Growth Fund
An Investment Idea for the Long Term
History has shown that a long-term plan that includes stocks of emerging market countries is more likely to provide greater returns and reduce overall portfolio volatility over time than a portfolio that invests only in U.S.-based stocks.
Goldman Sachs Asia Growth Fund provides investors access to the benefits associated with emerging market investing. The Fund seeks long-term capital appreciation, primarily through equity securities of companies related to Asia, excluding Japan.
Target Your Needs
The Goldman Sachs Asia Growth Fund has a distinct investment objective and a defined place on the risk/return spectrum. As your investment objectives change, you can exchange shares within Goldman Sachs Funds without any additional charge.* (Please note: in general, greater returns are associated with greater risk.)
For More Information
To learn more about the Goldman Sachs Asia Growth Fund and other Goldman Sachs Funds, call your investment professional today.
*The exchange privilege is subject to termination and its terms are subject to change.
|
|