
|
|
|
|
|
|
|
|
|
Market Overview
Dear Shareholder:
During the period under review, emerging markets generated mixed results, as rising interest rates in the U.S. and a technology correction impacted equity performance.
Asia was the poorest performing region, due to a slowdown in corporate restructuring, heightened political uncertainty in Indonesia, and the technology correction which strongly impacted the markets of Taiwan, Korea and India. Latin America was the best performer, aided by a strong earnings recovery, promising economic performance and attractive valuations. In Europe, the Middle East and Africa (EMEA) region, Russia performed well, due in part to rising oil prices. However, the cyclical sell-off experienced this year negatively impacted markets such as South Africa.
As always, we appreciate your support and we look forward to serving your investment needs in the years to come.
Sincerely,
 |
 |
|
|
David B. Ford
|
David W. Blood
|
|
September 15, 2000
GOLDMAN SACHS EMERGING MARKETS EQUITY FUND
Fund Basics
as of August 31, 2000
| PERFORMANCE REVIEW | ||||
| August 31, 1999–August 31, 2000 | Fund Total Return (without sales charge)1
|
MSCI EMF Index2
|
||
| |
||||
| Class A | 16.95 | % | 6.30 | % |
| Class B | 16.40 | 6.30 | ||
| Class C | 16.34 | 6.30 | ||
| Institutional | 17.61 | 6.30 | ||
| Service | 17.46 | 6.30 | ||
| |
||||
1 The net asset value represents the net assets of the Fund (ex-dividend) divided by the total number of shares. The Fund’s performance assumes the reinvestment of dividends and other distributions.
2 The Morgan Stanley Capital International (MSCI) Emerging Markets Free (EMF) Index (with dividends reinvested) is an unmanaged market capitalization-weighted composite of securities in over 30 emerging market countries, including Argentina, Botswana, Brazil, Chile, China, Colombia, the Czech Republic, Egypt, Greece, Hong Kong, Hungary, India, Israel, Jordan, Kenya, Malaysia, Mexico, Morocco, Pakistan, Peru, Philippines, Poland, Portugal, Russia, Singapore, South Africa, South Korea, Sri Lanka, Taiwan, Thailand, Turkey, Venezuela and Zimbabwe. “Free” indicates an index that excludes shares in otherwise free markets that are not purchasable by foreigners. Investors cannot directly invest in the Index. The Index figures do not reflect any fees or expenses.
| STANDARDIZED TOTAL RETURNS 3 | |||||||||||
| For the period ended 6/30/00 | Class A
|
Class B
|
Class C
|
Institutional
|
Service
|
||||||
| |
|||||||||||
| One Year | 8.35 | % | 9.23 | % | 12.95 | % | 15.45 | % | 15.00 | % | |
| Since Inception | 3.18 | 3.93 | 5.12 | 6.28 | 4.65 | ||||||
| (12/15/97) | |||||||||||
| |
|||||||||||
3 The Standardized Total Returns are average annual total returns or cumulative total returns (only if the performance period is one year or less) as of the most recent calendar quarter-end. They assume reinvestment of all distributions at net asset value. These returns reflect a maximum initial sales charge of 5.5% for Class A shares, the assumed deferred sales charge for Class B shares (5% maximum declining to 0% after six years) and the assumed deferred sales charge for Class C shares (1% if redeemed within 12 months of purchase). Because Institutional and Service shares do not involve a sales charge, such a charge is not applied to their Standardized Total Returns.
Total return figures represent past performance and do not indicate future results, which will vary. The investment return and principal value of an investment will fluctuate and, therefore, an investor’s shares, when redeemed, may be worth more or less than their original cost. Performance reflects expense limitations in effect. In their absence, performance would be reduced.
| TOP 10 COMPANY HOLDINGS AS OF 8/31/2000 | |||
| Company Holding | % of Total Net Assets
|
Line of Business
|
|
| |
|||
| Telefonos de Mexico SA ADR | 4.4 | % | Telecommunications |
| Samsung Electronics | 4.2 | Semiconductors | |
| Petroleo Brasileiro SA ADR | 3.1 | Energy Resources | |
| China Telecom Ltd. | 2.6 | Telecommunications | |
| Taiwan Semiconductor | 2.5 | Semiconductors | |
| Check Point Software Technologies Ltd. | 2.3 | Computer Software | |
| Tele Norte Leste Participacoes SA ADR | 2.1 | Telecommunications | |
| United Microelectronics Corp. Ltd | 2.0 | Semiconductors | |
| SK Telecom Co. Ltd. | 1.5 | Telecommunications | |
| Brasil Telecom Participacoes SA ADR | 1.5 | Telecommunications | |
| |
|||
The top 10 company holdings may not be representative of the Fund’s future investments. s
GOLDMAN SACHS EMERGING MARKETS EQUITY FUND
Performance Overview
Dear Shareholder,
We are pleased to report on the performance of the Goldman Sachs Emerging Markets Equity Fund for the one year period that ended August 31, 2000.
Performance Review
Over the one-year period that ended August 31, 2000, the Fund’s Class A, B, C, Institutional and Service share classes generated cumulative total returns, without sales charges, of 16.95%, 16.40%, 16.34%, 17.61%, and 17.46%, respectively. These returns compare favorably to the Fund’s benchmark, the Morgan Stanley Capital International (MSCI) Emerging Markets Free Index, which generated a cumulative total return of 6.30%.
The Fund’s strong absolute and relative returns were largely due to appropriate regional allocations and stock selection.
Regional Allocation
The Fund was overweight in Latin America, while maintaining its underweight position in both Asia and Europe, Middle East and Africa (EMEA). The largest overweight position in Latin America was Brazil. In Asia, the largest underweight position was in China. Finally, in EMEA, Greece was the largest underweight position at the end of the period.
Portfolio Highlights
GOLDMAN SACHS EMERGING MARKETS EQUITY FUND
Portfolio Outlook
We thank you for your investment and look forward to your continued confidence.
Goldman Sachs Emerging Markets Equity Investment Team
New York, London and Singapore
September 15, 2000
GOLDMAN SACHS EMERGING MARKETS EQUITY FUND
The Goldman Sachs Advantage
Founded in 1869, Goldman, Sachs & Co. is a premier financial services firm traditionally known on Wall Street and around the world for its institutional expertise.
Today, the firm’s Investment Management Division provides individual investors the opportunity to tap the resources of a global institutional powerhouse — and put this expertise to work in their individual portfolios.
What Sets Goldman Sachs Funds Apart?

Our portfolio management teams are located on-site, around the world, in New York, London, Tokyo and Singapore. Their understanding of local economies, markets, industries and cultures helps deliver what many investors want: access to global investment opportunities and consistent, risk-adjusted performance.

Our portfolio management teams make on-site visits to hundreds of companies each month, then construct selective portfolios with an emphasis on their best ideas. Our teams also have access to Goldman, Sachs & Co.’s Global Investment Research Department.

In this, our institutional heritage is clear. Institutions, as well as many individual investors, often look to us to manage the risks of global investing over time in different market environments.
To learn more about the Goldman Sachs Funds, call your investment professional today.
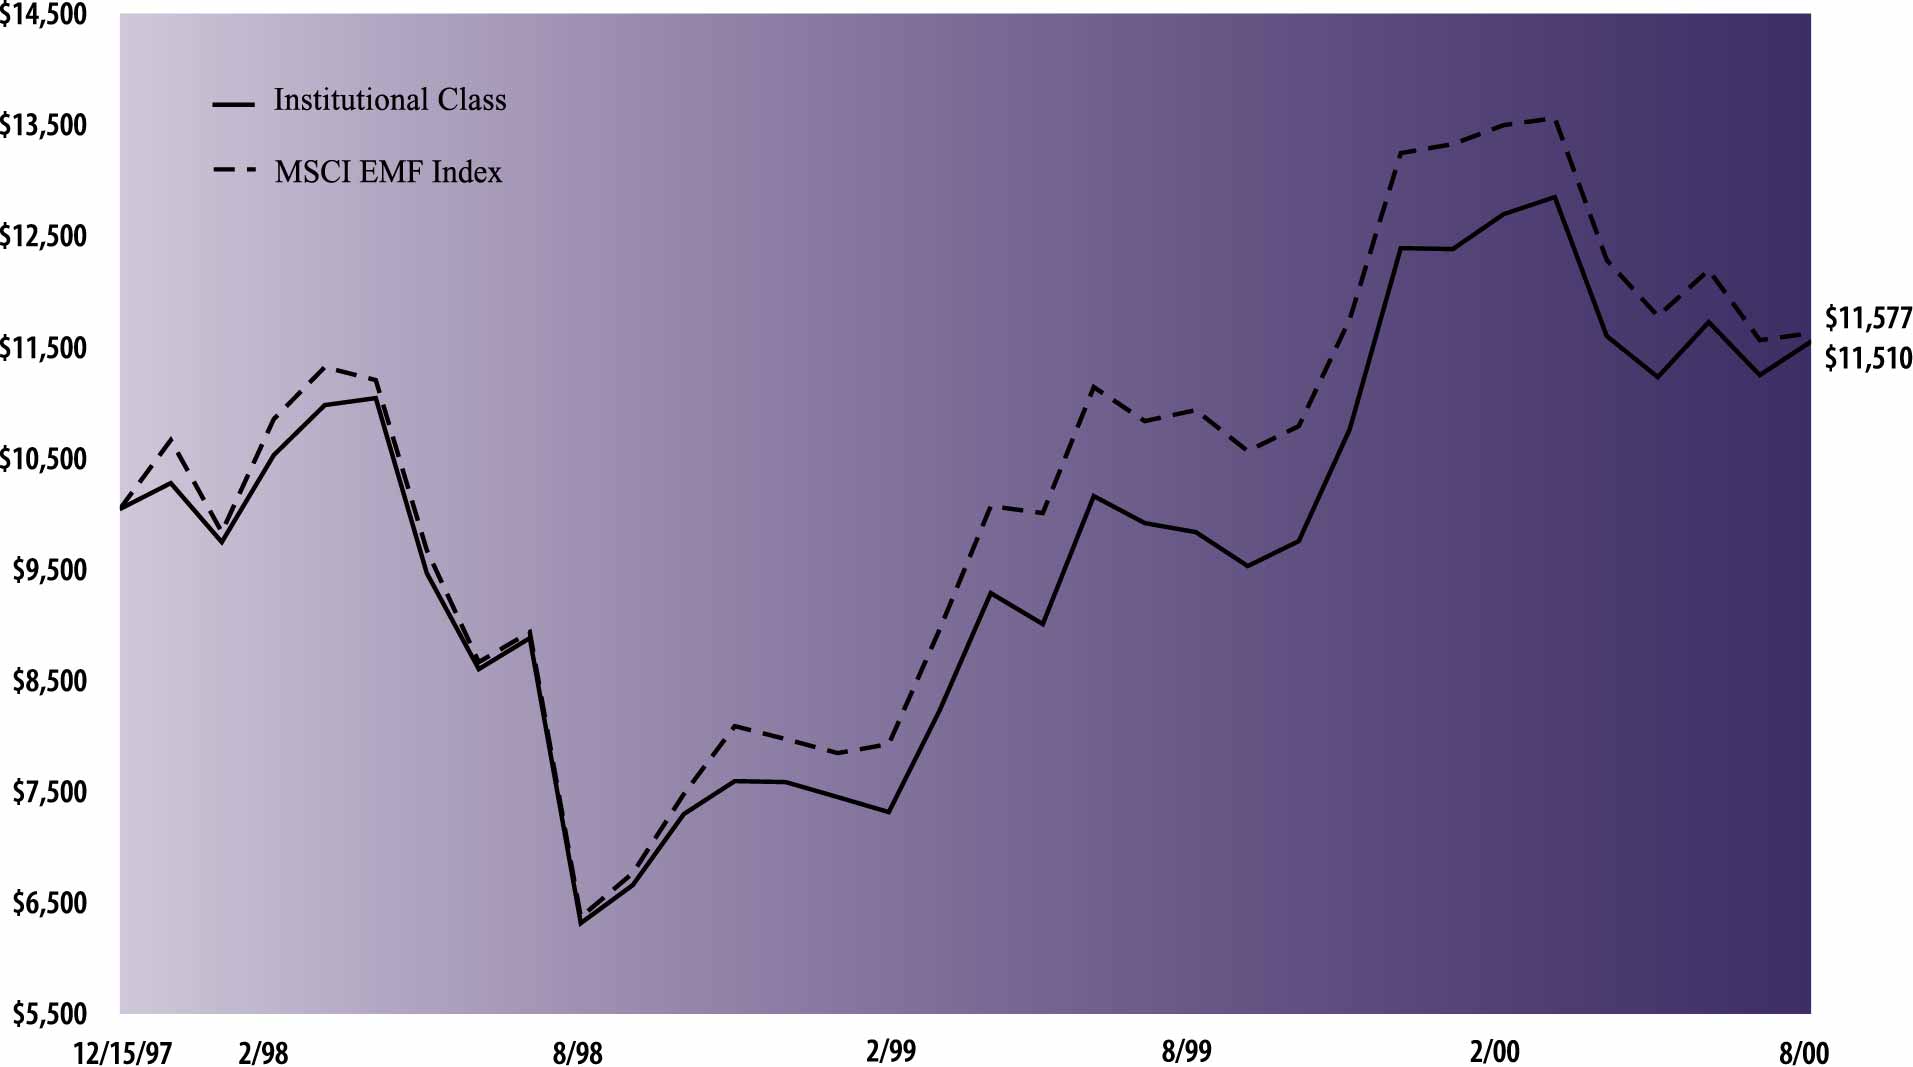
| The following graph shows the value as of August 31, 2000, of a $10,000 investment made on December 15, 1997 (commencement of
operations) in Institutional Shares (at NAV) of the Goldman Sachs Emerging Markets Equity Fund. For comparative purposes, the performance of the Fund’s benchmark (the Morgan Stanley Capital International Emerging Markets Free Index (“MSCI
EMF”)) is shown. This performance data represents past performance and should not be considered indicative of future performance which will fluctuate with changes in market conditions. These performance fluctuations will cause an investor’s
shares, when redeemed, to be worth more or less than their original cost. Performance of Class A, Class B, Class C and Service Shares will vary from Institutional Shares due to differences in fees and loads.
|
| Emerging Markets Equity Fund’s Lifetime Performance
|
| Growth of a $10,000 Investment, Distributions Reinvested December 15, 1997 to August 31, 2000
|
 |
| Average Annual Total Return through August 31, 2000 (a) | Since Inception | One Year | |||
|---|---|---|---|---|---|
| Class A | |||||
| Excluding sales charges | 4.54% | 16.95% | |||
| Including sales charges | 2.39% | 10.51% | |||
| Class B | |||||
| Excluding contingent deferred sales charges | 4.11% | 16.40% | |||
| Including contingent deferred sales charges | 3.03% | 11.40% | |||
| Class C | |||||
| Excluding contingent deferred sales charges | 4.19% | 16.34% | |||
| Including contingent deferred sales charges | 4.19% | 15.34% | |||
| Institutional Class | 5.31% | 17.61% | |||
| Service Class | 3.82% | 17.46% | |||
(a)
|
Commencement date of operations was December 15, 1997 for all share classes.
|
|
Shares |
Description | Value | |||
|---|---|---|---|---|---|
| Common Stocks – 88.3% | |||||
| Brazil – 5.3% | |||||
| 143,006 | Companhia Cervejaria Brahma
ADR (Food & Beverage) |
$ 2,967,374 | |||
| 43,000 | IdeiasNet* (Information Services) | 200,407 | |||
| 207,000 | Petroleo Brasileiro SA ADR*
(Energy Resources) |
6,585,187 | |||
| 79,100 | Votorantim Celulose e Papel SA
ADR (Paper) |
1,591,888 | |||
| 11,344,856 | |||||
| Chile – 4.0% | |||||
| 6,000 | Banco Santander Chile Series A
ADR (Financial Services) |
90,750 | |||
| 40,500 | Banco Santiago ADR (Banks) | 794,813 | |||
| 27,200 | BBV Banco BHIF ADR
(Financial Services) |
397,800 | |||
| 121,800 | Cia de Telecomunicaciones de
Chile SA ADR (Telecommunications) |
2,146,725 | |||
| 20,400 | Compania Cervecerias Unidas SA
ADR (Food & Beverage) |
471,750 | |||
| 96,600 | Distribucion y Servicio D&S SA
ADR (Merchandising) |
1,666,350 | |||
| 108,100 | Embotelladora Andina SA
Series B ADR (Food & Beverage) |
1,114,781 | |||
| 62,346 | Empresa Nacional de Electricidad
SA Endesa ADR (Electrical Utilities) |
666,323 | |||
| 70,204 | Enersis SA ADR (Electrical
Utilities) |
1,211,019 | |||
| 8,560,311 | |||||
| China – 4.7% | |||||
| 735,000 | China Mobile Ltd.*
(Telecommunications) |
5,654,571 | |||
| 2,112,000 | Huaneng Power International, Inc.
Class H (Utilities) |
880,113 | |||
| 5,699,000 | Jiangxi Copper Co. Ltd. Class H*
(Nonferrous Metals) |
730,734 | |||
| 8,339,000 | PetroChina Co. Ltd. Class H*†
(Energy Resources) |
1,988,786 | |||
| 2,846,000 | Yanzhou Coal Mining Co. Ltd.
Class H (Mining) |
821,067 | |||
| 10,075,271 | |||||
| Colombia – 0.6% | |||||
| 32,600 | Banco Ganadero SA Class B
ADR (Banks) |
118,175 | |||
| 353,400 | Bavaria SA (Food & Beverage) | 1,164,967 | |||
| 1,283,142 | |||||
| Czech Republic – 0.6% | |||||
| 3,300 | Ceske Radiokomunikace GDR*
(Telecommunications) |
146,685 | |||
| 182,600 | CEZ* (Electrical Utilities) | 496,871 | |||
| 49,215 | SPT Telecom AS*
(Telecommunications) |
742,615 | |||
| 1,386,171 | |||||
|
Shares |
Description | Value | |||
|---|---|---|---|---|---|
| Common Stocks – (continued) | |||||
| Greece – 1.4% | |||||
| 5,652 | Alpha Bank SA (Banks) | $ 172,399 | |||
| 5,561 | Attica Enterprises Holding SA
(Ship Transportation) |
38,531 | |||
| 4,120 | Commercial Bank of Greece
(Banks) |
166,782 | |||
| 3,320 | EFG Eurobank Ergasias (Banks) | 75,077 | |||
| 6,720 | Ergo Bank SA (Banks) | 109,556 | |||
| 49,015 | Hellenic Telecommunications
Organization SA (OTE) (Telecommunications) |
911,218 | |||
| 26,966 | Intracom (Electrical Equipment) | 836,705 | |||
| 20,597 | National Bank of Greece (Banks) | 695,954 | |||
| 2,910 | Titan Cement Co. (Mining) | 101,004 | |||
| 3,107,226 | |||||
| Hong Kong – 1.2% | |||||
| 2,814,000 | China Resources Beijing Land
Ltd. (Energy Resources) |
602,562 | |||
| 238,400 | China Unicom Ltd.*
(Telecommunications) |
553,281 | |||
| 194,000 | Citic Pacific Ltd. (Multi-Industry) | 925,350 | |||
| 2,478,000 | Denway Motors Ltd.* (Auto) | 406,698 | |||
| 2,487,891 | |||||
| Hungary – 0.8% | |||||
| 6,600 | Graphisoft NV* (Computer
Software) |
96,676 | |||
| 36,072 | Magyar Travkozlesi Rt ADR
(Telecommunications) |
1,019,034 | |||
| 8,680 | Mol Magyar Olaj-es Gazipari Rt
Class S GDR (Energy Resources) |
117,614 | |||
| 4,845 | OTP Bank Rt. GDR (Financial
Services) |
257,996 | |||
| 9,300 | Pannonplast Rt. (Multi-Industry) | 156,741 | |||
| 1,648,061 | |||||
| India – 6.6% | |||||
| 15,070 | Cadbury India Ltd. (Food &
Beverage) |
197,534 | |||
| 32,149 | Dr. Reddy’s Laboratories Ltd.
(Medical Products) |
930,289 | |||
| 21,711 | Hindalco Industries Ltd.
(Nonferrous Metals) |
380,802 | |||
| 430,300 | Hindustan Lever Ltd. (Consumer
Cyclicals) |
2,240,979 | |||
| 96,770 | Housing Development Finance
Corp. Ltd. (Banks) |
1,113,262 | |||
| 3,000 | Infosys Technologies Ltd.
(Computer Software) |
527,890 | |||
| 7,940 | Infosys Technologies Ltd.
(Computer Software) |
1,397,149 | |||
| 95,326 | ITC Ltd. (Tobacco) | 1,618,804 | |||
| 42,000 | Nestle India Ltd. (Food &
Beverage) |
418,808 | |||
| 52,440 | Ranbaxy Laboratories Ltd.
(Medical Products) |
789,949 | |||
|
Shares |
Description | Value | |||
|---|---|---|---|---|---|
| Common Stocks – (continued) | |||||
| India – (continued) | |||||
| 171,271 | Reliance Industries Ltd. (Energy
Resources) |
$ 1,264,762 | |||
| 59,150 | Satyam Computer Services Ltd.
(Business Services) |
742,523 | |||
| 100,000 | State Bank of India (Banks) | 431,721 | |||
| 10,000 | State Bank of India GDR (Banks) | 99,000 | |||
| 44,870 | Videsh Sanchar Nigam Ltd.
(Telecommunications) |
794,886 | |||
| 21,000 | VisualSoft Technologies Ltd.
(Computer Software) |
834,017 | |||
| 28,000 | Zee Telefilms Ltd.
(Entertainment) |
313,498 | |||
| 14,095,873 | |||||
| Indonesia – 1.6% | |||||
| 1,030,000 | PT Astra International Tbk*
(Auto) |
325,198 | |||
| 2,978,600 | PT Bank Pan Indonesia Tbk-
Alien Market* (Banks) |
103,697 | |||
| 297,000 | PT Gudang Garam Tbk (Tobacco) | 444,965 | |||
| 244,300 | PT Hanjaya Mandala Sampoerna
Tbk (Multi-Industry) |
362,198 | |||
| 1,359,500 | PT Indah Kiat Pulp & Paper
Corp.* (Paper) |
237,464 | |||
| 273,000 | PT Indofood Sukses* (Food &
Beverage) |
122,244 | |||
| 161,000 | PT Indosat (Persero) Tbk
(Telecommunications) |
143,992 | |||
| 2,480,000 | PT Matahari Putra Prima Tbk
(Specialty Retail) |
190,540 | |||
| 402,000 | PT Ramayana Lestari Sentosa
Tbk (Specialty Retail) |
248,535 | |||
| 3,120,200 | PT Telekomunikasi Indonesia
Series B (Telecommunications) |
1,082,518 | |||
| 554,000 | PT Tempo Scan Pacific Tbk
(Health) |
223,462 | |||
| 3,484,813 | |||||
| Israel – 5.7% | |||||
| 352,830 | Bank Hapoalim (Banks) | 1,123,439 | |||
| 232,907 | Bank Leumi (Banks) | 536,497 | |||
| 138,952 | Bezeq Israel Telecomm
(Telecommunications) |
862,055 | |||
| 33,100 | Check Point Software
Technologies Ltd.* (Computer Software) |
4,826,394 | |||
| 13,900 | ECI Telecom Ltd. (Electrical
Equipment) |
436,113 | |||
| 22,284 | First International Bank of Israel
Ltd. (Financial Services) |
163,582 | |||
| 4,100 | Gilat Satellite Networks Ltd.*
(Electrical Equipment) |
329,025 | |||
| 281,642 | ICL Israel Chemical (Chemicals) | 352,403 | |||
| 12,106 | IDB Holding Corp. Ltd.
(Multi-Industry) |
510,741 | |||
|
Shares |
Description | Value | |||
|---|---|---|---|---|---|
| Common Stocks – (continued) | |||||
| Israel – (continued) | |||||
| 17,513 | Koors Industries Ltd. ADR
(Multi-Industry) |
$ 369,962 | |||
| 7,900 | Matav-Cable Systems Media Ltd.
(Broadcasting) |
171,756 | |||
| 7,100 | Orbotech Ltd.* (Computer
Software) |
687,369 | |||
| 37,518 | Super Sol (Merchandising) | 140,739 | |||
| 28,920 | Teva Pharmaceutical Industries
Ltd. ADR (Medical Products) |
1,753,275 | |||
| 12,263,350 | |||||
| Malaysia – 2.3% | |||||
| 358,000 | Arab-Malaysian Finance Berhad-
Alien Market (Banks) |
373,074 | |||
| 81,000 | British American Tobacco
(Malaysia) Berhad (Tobacco) |
756,710 | |||
| 158,000 | Malayan Banking Berhad (Banks) | 607,053 | |||
| 363,000 | Malayan Cement Berhad (Mining) | 126,095 | |||
| 33,000 | Malaysian Pacific Industries
Berhad (Electrical Equipment) |
286,579 | |||
| 297,000 | Public Bank Berhad (Banks) | 254,795 | |||
| 87,000 | Resorts World Berhad (Leisure) | 179,724 | |||
| 269,000 | RHB Capital Berhad (Banks) | 291,653 | |||
| 234,000 | Sime Darby Berhad (Electrical
Equipment) |
259,863 | |||
| 117,000 | Star Publications (Malaysia)
Berhad (Publishing) |
431,053 | |||
| 65,000 | Tanjong PLC (Leisure) | 141,118 | |||
| 91,000 | Telekom Malaysia Berhad
(Telecommunications) |
258,631 | |||
| 143,000 | Tenaga Nasional Berhad
(Electrical Utilities) |
477,921 | |||
| 88,000 | Unisem (M) Berhad (Electrical
Equipment) |
458,526 | |||
| 4,902,795 | |||||
| Mexico – 11.8% | |||||
| 146,400 | Apasco SA de CV (Construction) | 905,354 | |||
| 101,061 | Cemex SA de CV ADR (Mining) | 2,368,617 | |||
| 434,700 | Grupo Carso SA Series A*
(Multi-Industry) |
1,544,907 | |||
| 4,307,600 | Grupo Financiero BBVA
Bancomer, SA de CV* (Banks) |
2,584,279 | |||
| 1,026,200 | Grupo Modelo SA Series C
(Tobacco) |
2,559,645 | |||
| 21,100 | Grupo Televisa SA ADR*
(Broadcasting) |
1,366,225 | |||
| 186,440 | Organizacion Soriana SA de CV
Series B (Merchandising) |
804,442 | |||
| 49,700 | Panamerican Beverages, Inc.
(Food & Beverage) |
922,556 | |||
| 173,339 | Telefonos de Mexico SA ADR
(Telecommunications) |
9,436,142 | |||
| 130,000 | Wal-Mart de Mexico SA de CV
Series V* (Specialty Retail) |
324,964 | |||
|
Shares |
Description | Value | |||
|---|---|---|---|---|---|
| Common Stocks – (continued) | |||||
| Mexico – (continued) | |||||
| 1,018,600 | Wal-Mart de Mexico SA de CV
Series C* (Specialty Retail) |
$ 2,391,236 | |||
| 25,208,367 | |||||
| Pakistan – 0.3% | |||||
| 79,000 | Fauji Fertilizer Co. Ltd.
(Chemicals) |
59,277 | |||
| 352,000 | Hub Power Co. Ltd.* (Electrical
Utilities) |
111,582 | |||
| 44,400 | Pakistan State Oil Co. Ltd.
(Energy Resources) |
143,105 | |||
| 610,000 | Pakistan Telecommunications Co.
Ltd. (Telecommunications) |
286,139 | |||
| 600,103 | |||||
| Peru – 0.5% | |||||
| 18,200 | Compania de Minas
Buenaventura SA Series B ADR (Mining) |
300,300 | |||
| 85,500 | Credicorp Ltd. (Financial
Services) |
716,062 | |||
| 1,016,362 | |||||
| Philippines – 0.8% | |||||
| 396,900 | ABS-CBN Broadcasting Corp.
PDR (Broadcasting) |
422,375 | |||
| 1,271,900 | Ayala Corp. (Multi-Industry) | 203,030 | |||
| 964,800 | Benpres Holdings Corp.*
(Multi-Industry) |
85,560 | |||
| 112,600 | Manila Electric Co. Class B
(Electrical Utilities) |
163,514 | |||
| 16,750 | Philippine Long Distance
Telephone Co. (Telecommunications) |
284,087 | |||
| 7,350 | Philippine Long Distance
Telephone Co. ADR (Telecommunications) |
124,031 | |||
| 106,240 | San Miguel Corp. “B” Class B
(Tobacco) |
124,836 | |||
| 1,858,400 | SM Prime (Construction) | 218,369 | |||
| 1,625,802 | |||||
| Poland – 0.5% | |||||
| 2,000 | BRE Bank SA (Financial
Services) |
64,332 | |||
| 5,330 | Elektrim Spolka Akcyjna SA
(Multi-Industry) |
60,310 | |||
| 24,500 | KGHM Polska Miedz SA
(Nonferrous Metals) |
176,617 | |||
| 4,800 | Netia Holdings SA ADR*
(Telecommunications) |
105,600 | |||
| 7,780 | Polski Koncern Naftowy Orlen
SA GDR† (Energy Resources) |
71,965 | |||
| 17,600 | Polski Koncern Naftowy SA
GDR (Energy Resources) |
162,800 | |||
|
Shares |
Description | Value | |||
|---|---|---|---|---|---|
| Common Stocks – (continued) | |||||
| Poland – (continued) | |||||
| 2,900 | Prokom Software SA (Computer
Software) |
$ 143,561 | |||
| 35,100 | Telekomunikacja Polska SA
(Telecommunications) |
208,190 | |||
| 993,375 | |||||
| Russia – 2.9% | |||||
| 33,500 | AO Tatneft ADR (Energy
Resources) |
441,781 | |||
| 3,730 | Gedeon Richter Ltd. Class S GDR
(Medical Products) |
207,948 | |||
| 2,873 | LUKoil Holding ADR (Energy
Resources) |
185,309 | |||
| 14,800 | Mobile Telesystems ADR*
(Telecommunications) |
431,050 | |||
| 38,182 | Norilsk Nickel (Mining) | 381,820 | |||
| 111,097 | RAO Unified Energy Systems
GDR (Electrical Utilities) |
1,926,977 | |||
| 132,002 | Surgutneftegaz ADR* (Energy
Resources) |
2,574,039 | |||
| 6,148,924 | |||||
| South Africa – 7.0% | |||||
| 103,300 | ABSA Group Ltd. (Financial
Services) |
426,608 | |||
| 28,800 | Anglo American Platinum Corp.
(Nonferrous Metals) |
1,125,784 | |||
| 18,429 | Angloglold (Mining) | 718,799 | |||
| 34,400 | Barlow Ltd. (Conglomerates) | 224,690 | |||
| 49,248 | Bidvest Group Ltd. (Multi-
Industry) |
356,629 | |||
| 513,400 | BOE Ltd. (Financial Services) | 321,717 | |||
| 86,000 | Comparex Holdings Ltd.
(Business Services) |
133,186 | |||
| 13,300 | Coronation Holdings Ltd.
(Financial Services) |
213,602 | |||
| 76,753 | De Beers Centenary (Agriculture) | 2,135,177 | |||
| 828,598 | FirstRand Ltd. (Financial
Services) |
908,954 | |||
| 107,598 | Gold Fields Ltd. (Mining) | 396,528 | |||
| 8,700 | Impala Platinum Holdings Ltd.
(Nonferrous Metals) |
411,690 | |||
| 28,100 | Imperial Holdings Ltd.
(Conglomerates) |
269,971 | |||
| 13,120 | Investec Group Ltd. (Banks) | 470,339 | |||
| 40,319 | Liberty Group Ltd. (Insurance) | 375,803 | |||
| 193,800 | M-Cell Ltd.
(Telecommunications) |
836,483 | |||
| 21,308 | Mobile Industries Ltd. Class N
(Financial Services) |
1,008 | |||
| 10,528 | Mobile Industries Ltd. (Financial
Services) |
498 | |||
| 88,600 | Nampak Ltd. (Consumer
Durables) |
170,881 | |||
| 40,971 | Nedcor Ltd. (Banks) | 928,262 | |||
|
Shares |
Description | Value | |||
|---|---|---|---|---|---|
| Common Stocks – (continued) | |||||
| South Africa – (continued) | |||||
| 13,676 | Omni Media Corp. Ltd.
(Publishing) |
$ 276,513 | |||
| 70,902 | Rembrandt Group (Tobacco) | 701,527 | |||
| 35,346 | RMB Holdings Ltd. (Financial
Services) |
55,753 | |||
| 441,400 | Sanlam Ltd. (Information
Services) |
531,678 | |||
| 79,300 | Sappi Ltd. (Pulp and Paper) | 693,649 | |||
| 162,125 | Sasol (Chemicals) | 1,325,139 | |||
| 116,679 | South African Brewery (Alcohol) | 854,969 | |||
| 25,628 | Tiger Oats (Food & Beverage) | 204,327 | |||
| 15,070,164 | |||||
| South Korea – 11.4% | |||||
| 13,140 | Cheil Jedang Corp. (Food &
Beverage) |
551,080 | |||
| 59,263 | Housing & Commercial Bank
(Banks) |
1,266,772 | |||
| 134,940 | Hyundai Electronics Industries
Co.* (Electrical Equipment) |
2,470,604 | |||
| 68,125 | Hyundai Motor Co. Ltd. (Auto) | 1,032,244 | |||
| 60,400 | Korea Electric Power Corp. ADR
(Electrical Utilities) |
1,019,250 | |||
| 79,570 | Korea Electric Power Corp.
(Electrical Utilities) |
2,339,555 | |||
| 3,980 | Korea Telecom Corp.
(Telecommunications) |
272,453 | |||
| 16,570 | LG Chemical Ltd. (Chemicals) | 279,467 | |||
| 10,148 | Pohang Iron & Steel Co. Ltd.
(Steel) |
761,775 | |||
| 17,110 | Samsung Electro-Mechanics Co.*
(Computer Hardware) |
726,837 | |||
| 36,216 | Samsung Electronics
(Semiconductors) |
8,933,552 | |||
| 289 | Samsung Fire & Marine Insurance
(Insurance) |
7,715 | |||
| 93,590 | Shinhan Bank (Banks) | 1,021,365 | |||
| 14,940 | SK Telecom Co. Ltd.
(Telecommunications) |
3,287,811 | |||
| 14,101 | SK Telecom Co. Ltd. ADR
(Telecommunications) |
361,338 | |||
| 1,504 | Trigem Computer, Inc.*
(Computer Hardware) |
26,384 | |||
| 24,358,202 | |||||
| Taiwan – 11.4% | |||||
| 36,400 | Acer Peripherals, Inc. (Computer
Hardware) |
84,433 | |||
| 208,152 | Ambit Microsystems Corp.
(Electrical Equipment) |
1,522,245 | |||
| 95,360 | Asustek Computer, Inc.
(Appliance) |
586,783 | |||
| 947,735 | Bank Sinopac (Financial Services) | 540,429 | |||
| 587,288 | Cathay Life Insurance Co.
(Insurance) |
1,352,806 | |||
|
Shares |
Description | Value | |||
|---|---|---|---|---|---|
| Common Stocks – (continued) | |||||
| Taiwan – (continued) | |||||
| 236,600 | China Development Industrial
Bank (Multi-Industry) |
$ 244,680 | |||
| 307,400 | Chinatrust Commercial Bank
(Banks) |
242,632 | |||
| 458,900 | Compal Electronics, Inc.
(Electronic Components) |
879,657 | |||
| 203,200 | Compeq Manufacturing Co. Ltd.
(Electrical Equipment) |
1,171,804 | |||
| 131,250 | Delta Electronics, Inc. (Electrical
Equipment) |
503,181 | |||
| 394,697 | Formosa Chemicals & Fibre Corp.
(Chemicals) |
443,780 | |||
| 242,392 | Hon Hai Precision (Electrical
Equipment) |
1,850,738 | |||
| 399,267 | Nan Ya Plastic Corp. (Chemicals) | 662,444 | |||
| 218,416 | President Chain Store Corp.
(Merchandising) |
647,367 | |||
| 18,700 | Procomp Informatics Co. Ltd.
(Semiconductors) |
103,019 | |||
| 41,000 | Siliconware Precision Industries
Co. ADR (Multi-Industry) |
297,250 | |||
| 1,250,957 | Taiwan Semiconductor
(Semiconductors) |
5,420,545 | |||
| 1,588,000 | United Microelectronics Corp.
Ltd. (Semiconductors) |
4,220,683 | |||
| 147,000 | Via Technologies, Inc. (Electrical
Equipment) |
1,960,631 | |||
| 410,000 | Winbond Electronics Corp.
(Electrical Equipment) |
1,017,075 | |||
| 107,900 | Zinwell Corp. (Electronic
Components) |
528,376 | |||
| 24,280,558 | |||||
| Thailand – 2.2% | |||||
| 82,000 | Advanced Info Service Public-
Alien Market* (Telecommunications) |
991,143 | |||
| 289,850 | Bangkok Bank Public-Alien
Market* (Banks) |
299,637 | |||
| 86,800 | BEC World PLC-Alien Market
(Entertainment) |
475,733 | |||
| 73,200 | Delta Electronics (Thailand)
Public Co. Ltd.-Alien Market (Electrical Equipment) |
537,313 | |||
| 382,700 | Land & House Public Co. Ltd.-
Alien Market* (Real Estate) |
128,753 | |||
| 139,600 | Loxley Public Co. Ltd.-Alien
Market FDR* (Telecommunications) |
119,550 | |||
| 88,700 | PTT Exploration & Production
Public-Alien Market (Energy Resources) |
529,552 | |||
| 165,400 | Shin Corp. Public Co. Ltd.-Alien
Market* (Computer Hardware) |
756,785 | |||
| 16,800 | Siam Cement Public-Alien
Market* (Construction) |
215,395 | |||
|
Shares |
Description | Value | |||
|---|---|---|---|---|---|
| Common Stocks – (continued) | |||||
| Thailand – (continued) | |||||
| 133,100 | Siam Commercial Bank Public
Co. Ltd.-Alien Market* (Banks) |
$ 61,062 | |||
| 288,800 | TelecomAsia Corp. Public-Alien
Market* (Telecommunications) |
233,188 | |||
| 516,500 | Thai Farmers Bank Public Co.
Ltd.-Alien Market* (Banks) |
315,941 | |||
| 4,664,052 | |||||
| Turkey – 3.0% | |||||
| 8,946,000 | Akcansa Cimento AS
(Construction) |
114,727 | |||
| 9,250,741 | Anadolu Efes Biracilik ve Malt
Sanayii AS* (Food & Beverage) |
494,314 | |||
| 11,045,400 | Arcelik AS (Consumer Durables) | 349,912 | |||
| 2,847,400 | Aygaz AS (Electrical Utilities) | 123,894 | |||
| 5,088,500 | Dogan Sirketler Grubu Holding
AS (Publishing) |
118,473 | |||
| 13,304,357 | Eregli Demir ve Celik Fabrikalari
TAS Erdemir (Steel) |
441,786 | |||
| 4,876,400 | Ford Otomotiv Sanayi AS (Motor
Vehicle) |
279,183 | |||
| 1,056,390 | Migros (Merchandising) | 143,540 | |||
| 11,866,000 | Tofas Turk Otomobil Fabrikasi
AS (Motor Vehicle) |
163,044 | |||
| 8,017,600 | Tupras-Turkiye Petrol Rafinerileri
AS (Energy Resources) |
361,098 | |||
| 25,000 | Turkcell Iletisim Hizmetleri AS
ADR * (Telecommunications) |
335,937 | |||
| 39,969,740 | Turkiye Garanti Bankasi AS
(Banks) |
408,851 | |||
| 93,887,246 | Turkiye Is Bankasi Isbank
Class C (Banks) |
1,899,246 | |||
| 706,300 | Vestel Elektronik Sanayi ve
Ticaret AS* (Appliance) |
134,790 | |||
| 120,151,476 | Yapi Kredi Bankesi (Banks) | 1,008,906 | |||
| 6,377,701 | |||||
| United Kingdom – 0.8% | |||||
| 177,006 | Dimension Data Holdings PLC*
(Computer Software) |
1,725,971 | |||
| United States – 0.4% | |||||
| 53,100 | Ampal-American Israel Corp.*
(Multi-Industry) |
826,369 | |||
| Venezuela – 0.5% | |||||
| 42,200 | Compania Anonima Nacional
Telefonos de Venezuela Class D ADR (Telecommunications) |
1,039,175 | |||
| TOTAL COMMON STOCKS | |||||
| (Cost $176,322,803) | $ 188,574,885 | ||||
|
Shares |
Description | Value | |||
|---|---|---|---|---|---|
| Preferred Stocks – 10.0% | |||||
| Brazil – 8.3% | |||||
| 286,426,530 | Banco Bradesco SA (Banks) | $ 2,408,533 | |||
| 46,149 | Brasil Telecom Participacoes SA
ADR (Telecommunications) |
3,250,620 | |||
| 2,000 | Companhia Vale do Rio Doce
ADR (Mining) |
54,375 | |||
| 112,700 | Companhia Vale do Rio Doce
(Mining) |
3,047,453 | |||
| 94,912 | Embratel Participacoes SA ADR
(Telecommunications) |
2,076,200 | |||
| 1,000 | Tele Centro Sul Participacoes SA
(Telecommunications) |
14 | |||
| 179,156 | Tele Norte Leste Participacoes SA
ADR (Telecommunications) |
4,568,478 | |||
| 78,515,678 | Telesp Celular Participacoes SA
(Telecommunications) |
1,160,798 | |||
| 101,100 | Ultrapar Participacoes SA ADR
(Multi-Industry) |
1,118,419 | |||
| 17,684,890 | |||||
| Russia – 1.7% | |||||
| 110,226 | LUKoil Holding ADR (Energy
Resources) |
2,755,650 | |||
| 56,000 | Surgutneftegaz ADR (Energy
Resources) |
910,000 | |||
| 3,665,650 | |||||
| TOTAL PREFERRED STOCKS | |||||
| (Cost $16,670,534) | $ 21,350,540 | ||||
| Units | Description | Value | |||
| Rights – 0.0% | |||||
| Brazil – 0.0% | |||||
| 7,851,567 | Telesp Celular Participacoes SA-
Rights exp. 10/02/00* (Telecommunications) |
$ 4,747 | |||
| TOTAL RIGHTS | |||||
| (Cost $0) | $ 4,747 | ||||
| Warrants – 0.0% | |||||
| Indonesia – 0.0% | |||||
| 277,200 | PT Bank Pan Indonesia Tbk-Alien
Market exp. 07/08/2002* (Banks) |
$ 1,897 | |||
| Thailand – 0.0% | |||||
| 276,100 | Siam Commercial Bank Public
Co. Ltd.-Alien Market exp. 05/10/2002* (Banks) |
23,644 | |||
| TOTAL WARRANTS | |||||
| (Cost $0) | $ 25,541 | ||||
| Units | Description |
Value |
|||
|---|---|---|---|---|---|
| Structured Note – 0.1% | |||||
| Switzerland – 0.1% | |||||
| Korea Tobacco & Ginseng Equity Link Note* | |||||
| 7,850 | exp 10/09/2000 | $ 133,921 | |||
| TOTAL STRUCTURED NOTE | |||||
| (Cost $252,349) | $ 133,921 | ||||
| Principal
Amount |
Interest
Rate |
Maturity
Date |
Value | |||||
|---|---|---|---|---|---|---|---|---|
| Convertible Bond – 0.0% | ||||||||
| South Africa – 0.0% | ||||||||
| Mobile Industries Ltd. E | ||||||||
| ZAR 2,011 | 6.00 | % | 12/31/2049 | $ 303 | ||||
| TOTAL CONVERTIBLE BOND | ||||||||
| (Cost $252) | $ 303 | |||||||
| Short-Term Obligation – 0.8% | ||||||||
| State Street Bank & Trust Euro-Time Deposit | ||||||||
| $1,832,000 | 6.56 | % | 09/01/2000 | $ 1,832,000 | ||||
| TOTAL SHORT-TERM OBLIGATION | ||||||||
| (Cost $1,832,000) | $ 1,832,000 | |||||||
| TOTAL INVESTMENTS | ||||||||
| (Cost $195,077,938) | $ 211,921,937 | |||||||
*
|
Non-income producing security
|
†
|
Security is exempt from registration under Rule 144A of the Securities Act of 1933. Such security may be resold, normally to
qualified institutional buyers in transactions exempt from registration. The market value of 144A Securities amounts to $2,060,751 as of August 31, 2000.
|
E
|
The principal amount of each security is stated in the currency in which the bond is denominated. See Below.
|
| The percentage shown for each investment category reflects the value of investments in that category as a percentage of total net
assets.
|
| |
| Investment Abbreviations:
|
| ADR—American Depository Receipt
|
| GDR—Global Depository Receipt
|
| PDR—Philippines Depository Receipt
|
| ZAR—South African Rand
|
| |
| As a % of
total net assets |
||||
|---|---|---|---|---|
| Common and Preferred Stock Industry Classifications† | ||||
| Agriculture | 1.0 | % | ||
| Alcohol | 0.4 | |||
| Appliance | 0.3 | |||
| Auto | 0.8 | |||
| Banks | 9.3 | |||
| Broadcasting | 0.9 | |||
| Business Services | 0.4 | |||
| Chemicals | 1.5 | |||
| Computer Hardware | 0.8 | |||
| Computer Software | 4.8 | |||
| Conglomerates | 0.2 | |||
| Constuction | 0.7 | |||
| Consumer Cyclicals | 1.1 | |||
| Consumer Durables | 0.2 | |||
| Electrical Equipment | 6.4 | |||
| Electrical Utilities | 4.0 | |||
| Electronic Components | 0.7 | |||
| Energy Resources | 8.7 | |||
| Entertainment | 0.4 | |||
| Financial Services | 2.0 | |||
| Food & Beverage | 4.0 | |||
| Health | 0.1 | |||
| Information Services | 0.3 | |||
| Insurance | 0.8 | |||
| Leisure | 0.2 | |||
| Medical Products | 1.7 | |||
| Merchandising | 1.6 | |||
| Mining | 3.9 | |||
| Motor Vehicle | 0.2 | |||
| Multi-Industry | 3.3 | |||
| Nonferrous Metals | 1.3 | |||
| Paper | 0.9 | |||
| Publishing | 0.4 | |||
| Pulp and Paper | 0.3 | |||
| Real Estate | 0.1 | |||
| Semiconductors | 8.7 | |||
| Ship Transportation | 0.0 | |||
| Specialty Retail | 1.5 | |||
| Steel | 0.6 | |||
| Telecommunications | 20.5 | |||
| Tobacco | 2.9 | |||
| Utilities | 0.4 | |||
| TOTAL COMMON AND PREFERRED STOCK | 98.3 | % | ||
†
|
Industry concentrations greater than one tenth of one percent are disclosed.
|
| Assets: | ||||
| Investment in securities, at value (identified cost $195,077,938) | $211,921,937 | |||
| Cash, at value | 1,081,659 | |||
| Receivables: | ||||
| Investment securities sold, at value | 1,217,935 | |||
| Fund shares sold | 644,184 | |||
| Dividends and interest, at value | 452,998 | |||
| Reimbursement from investment adviser | 137,060 | |||
| Deferred organization expenses, net | 6,736 | |||
| Other assets, at value | 537 | |||
| Total assets | 215,463,046 | |||
| Liabilities: | ||||
| Payables: | ||||
| Investment securities purchased, at value | 1,291,680 | |||
| Amounts owed to affiliates | 262,707 | |||
| Capital gains tax | 171,814 | |||
| Fund shares repurchased | 47,234 | |||
| Accrued expenses and other liabilities, at value | 143,501 | |||
| Total liabilities | 1,916,936 | |||
| Net Assets: | ||||
| Paid-in capital | 194,114,839 | |||
| Accumulated net investment loss | (321,626 | ) | ||
| Accumulated net realized gain from investment and foreign currency related transactions | 3,084,511 | |||
| Net unrealized gain on investments and translation of assets and liabilities denominated in foreign currencies | 16,668,386 | |||
| NET ASSETS | $213,546,110 | |||
| Net asset value, offering and redemption price per share: (a) | ||||
| Class A | $10.83 | |||
| Class B | $10.72 | |||
| Class C | $10.75 | |||
| Institutional | $11.02 | |||
| Service | $10.63 | |||
| Shares outstanding: | ||||
| Class A | 5,936,636 | |||
| Class B | 203,998 | |||
| Class C | 121,362 | |||
| Institutional | 13,232,591 | |||
| Service | 163 | |||
| Total shares outstanding, $.001 par value (unlimited number of shares authorized) | 19,494,750 | |||
(a)
|
Maximum public offering price per share (NAV per share multiplied by 1.0582) for Class A shares is $11.46. At redemption, Class B
and Class C shares may be subject to a contingent deferred sales charge, assessed on the amount equal to the lesser of the current net asset value or the original purchase price of the shares.
|
| Investment income: | ||||
| Dividends (a) | $ 3,197,954 | |||
| Interest | 235,518 | |||
| Total income | 3,433,472 | |||
| Expenses: | ||||
| Management fees | 2,576,018 | |||
| Custodian fees | 674,366 | |||
| Distribution and Service fees (b) | 414,516 | |||
| Transfer Agent fees (c) | 205,225 | |||
| Professional fees | 45,159 | |||
| Registration fees | 36,718 | |||
| Trustee fees | 8,900 | |||
| Amortization of deferred organization expenses | 2,950 | |||
| Other | 118,071 | |||
| Total expenses | 4,081,923 | |||
| Less — expense reductions | (408,592 | ) | ||
| Net expenses | 3,673,331 | |||
| NET INVESTMENT LOSS | (239,859 | ) | ||
| Realized and unrealized gain (loss) on investments and foreign currency related transactions: | ||||
| Net realized gain (loss) from: | ||||
| Investment transactions | 36,103,747 | |||
| Foreign currency related transactions | (1,755,322 | ) | ||
| Net change in unrealized gain on: | ||||
| Investments | (4,714,633 | ) | ||
| Translation of assets and liabilities denominated in foreign currencies | (13,769 | ) | ||
| Net realized and unrealized gain on investment and foreign currency related transactions | 29,620,023 | |||
| NET INCREASE IN NET ASSETS RESULTING FROM OPERATIONS | $29,380,164 | |||
(a)
|
Foreign taxes withheld on dividends were $416,710.
|
(b)
|
Class A, Class B and Class C had Distribution and Service fees of $381,208, $18,920 and $14,388, respectively.
|
(c)
|
Class A, Class B, Class C, Institutional Class and Service Class had Transfer Agent fees of $144,857, $3,595, $2,734, $54,038 and
$1, respectively.
|
| For the
Year Ended August 31, 2000 |
For the Seven
Months Ended August 31, 1999 |
For the
Year Ended January 31, 1999 |
||||||||
|---|---|---|---|---|---|---|---|---|---|---|
| From operations: | ||||||||||
| Net investment income (loss) | $ (239,859 | ) | $ 238,988 | $ 1,649,430 | ||||||
| Net realized gain (loss) on investment and foreign currency related transactions | 34,348,425 | 12,150,716 | (41,326,432 | ) | ||||||
| Net change in unrealized gain (loss) on investments and translation of assets and liabilities
denominated in foreign currencies |
(4,728,402 | ) | 31,170,452 | (8,910,101 | ) | |||||
| Net increase (decrease) in net assets resulting from operations | 29,380,164 | 43,560,156 | (48,587,103 | ) | ||||||
| Distributions to shareholders: | ||||||||||
| From net investment income | ||||||||||
| Class A Shares | — | — | (569,869 | ) | ||||||
| Class B Shares | — | — | (4,352 | ) | ||||||
| Class C Shares | — | — | (2,737 | ) | ||||||
| Institutional Shares | — | — | (1,092,333 | ) | ||||||
| Service Shares | — | — | (11 | ) | ||||||
| In excess of net investment income | ||||||||||
| Class A Shares | — | — | (1,680,766 | ) | ||||||
| Class B Shares | — | — | (12,834 | ) | ||||||
| Class C Shares | — | — | (8,074 | ) | ||||||
| Institutional Shares | — | — | (3,221,713 | ) | ||||||
| Service Shares | — | — | (33 | ) | ||||||
| Total distributions to shareholders | — | — | (6,592,722 | ) | ||||||
| From share transactions: | ||||||||||
| Proceeds from sales of shares | 106,627,300 | 32,173,466 | 220,344,538 | |||||||
| Reinvestment of dividends and distributions | — | — | 4,301,531 | |||||||
| Cost of shares repurchased | (98,802,301 | ) | (43,018,256 | ) | (62,779,701 | ) | ||||
| Net increase (decrease) in net assets resulting from share transactions | 7,824,999 | (10,844,790 | ) | 161,866,368 | ||||||
| TOTAL INCREASE | 37,205,163 | 32,715,366 | 106,686,543 | |||||||
| Net assets: | ||||||||||
| Beginning of period | 176,340,947 | 143,625,581 | 36,939,038 | |||||||
| End of period | $213,546,110 | $176,340,947 | $143,625,581 | |||||||
| Accumulated undistributed net investment income (loss) | $ (321,626 | ) | $ (45,928 | ) | $ 26,133 | |||||
| 1. ORGANIZATION
|
| Goldman Sachs Trust (the “Trust”) is a Delaware business trust registered under the Investment Company Act of 1940 (as
amended) as an open-end management investment company. The Trust includes the Goldman Sachs Emerging Markets Equity Fund (the “Fund”). The Fund is a diversified portfolio offering five classes of shares — Class A, Class B, Class
C, Institutional and Service.
|
| 2. SIGNIFICANT ACCOUNTING POLICIES
|
| The following is a summary of the significant accounting policies consistently followed by the Fund. The preparation of financial
statements in conformity with generally accepted accounting principles requires management to make estimates and assumptions that may affect the reported amounts. Actual results could differ from those estimates. Effective for fiscal year 1999, the Board
of Trustees approved a change in the fiscal year end of the Fund from January 31 to August 31. Accordingly, the Statements of Changes in Net Assets, Summary of Share Transactions and Financial Highlights of the Fund are included for the seven months ended
August 31, 1999 and the year ended January 31, 1999.
|
| A. Investment Valuation — Investments in
securities traded on a U.S. or foreign securities exchange or the NASDAQ system are valued daily at their last sale price on the principal exchange on which they are traded. If no sale occurs, securities are valued at the last bid price. Debt securities
are valued at prices supplied by independent pricing services, broker/dealer-supplied valuations or matrix pricing systems. Unlisted equity and debt securities for which market quotations are available are valued at the last sale price on valuation date
or, if no sale occurs, at the last bid price. Short-term debt obligations maturing in sixty days or less are valued at amortized cost, which approximates market value. Securities for which quotations are not readily available are valued at fair value
using methods approved by the Board of Trustees of the Trust.
|
| Investing in emerging markets may involve special risks and considerations not
typically associated with investing in the United States. These risks include revaluation of currencies, high rates of inflation, repatriation restrictions on income and capital, and adverse political and economic developments. Moreover, securities issued
in these markets may be less liquid, subject to government ownership controls, delayed settlements, and their prices more volatile than those of comparable securities in the United States.
|
| B. Security Transactions and Investment Income — Security transactions are recorded as of the trade date. Realized gains and losses on sales of portfolio securities are calculated using the identified-cost basis. Dividend income is recorded on the ex-dividend date, net of foreign withholding taxes
where applicable. Dividends for which the Fund has the choice to receive either cash or stock are recognized as investment income in an amount equal to the cash dividend. Interest income is recorded on the basis of interest accrued, premium amortized and
discount earned. It is the Fund’s policy, where necessary, to accrue for estimated capital gains taxes on appreciated foreign securities.
|
| Net investment income (other than class specific expenses) and unrealized and
realized gains or losses are allocated daily, to each class of shares of the Fund based upon the relative proportion of net assets of each class.
|
| C. Federal Taxes — It is the Fund’s
policy to comply with the requirements of the Internal Revenue Code applicable to regulated investment companies and to distribute each year substantially all of its investment company taxable income and capital gains to its shareholders. Accordingly, no
federal tax provision is required. Income and capital gains distributions, if any, are declared and paid annually.
|
| The characterization of distributions to shareholders for financial reporting
purposes is determined in accordance with income tax rules. Therefore, the source of the Fund’s distributions may be shown in the accompanying financial statements as either from or in excess of net investment income or net realized gain on
investment transactions, or from paid-in capital, depending on the type of book/tax differences that may exist.
|
| 2. SIGNIFICANT ACCOUNTING POLICIES (continued)
|
| At August 31, 2000, the aggregate cost of portfolio securities for federal income
tax purposes is $199,160,616. Accordingly, the gross unrealized gain on investments was $26,836,354 and the gross unrealized loss on investments was $14,075,033 resulting in a net unrealized gain of $12,761,321.
|
| D. Expenses — Expenses incurred by the
Trust which do not specifically relate to an individual Fund of the Trust are allocated to the Funds based on a straight-line or pro rata basis depending upon the nature of the expense.
|
| Class A, Class B and Class C Shares bear all expenses and fees relating to their
respective Distribution and Service Plans. Shareholders of Service Shares bear all expenses and fees paid to service organizations. Each class of shares separately bears its respective class-specific Transfer Agency fees.
|
| E. Deferred Organization Expenses —
Organization-related costs are amortized on a straight-line basis over a period of five years.
|
| F. Foreign Currency Translations — The
books and records of the Fund are maintained in U.S. dollars. Amounts denominated in foreign currencies are translated into U.S. dollars on the following basis: (i) investment valuations, foreign currency and other assets and liabilities initially
expressed in foreign currencies are converted each business day into U.S. dollars based on current exchange rates; and (ii) purchases and sales of foreign investments, income and expenses are converted into U.S. dollars based on currency exchange rates
prevailing on the respective dates of such transactions.
|
| Net realized and unrealized gain (loss) on foreign currency transactions will
represent: (i) foreign exchange gains and losses from the sale and holdings of foreign currencies; (ii) currency gains and losses between trade date and settlement date on investment securities transactions and forward exchange contracts; and (iii) gains
and losses from the difference between amounts of dividends, interest and foreign withholding taxes recorded and the amounts actually received.
|
| G. Derivative Financial Instruments — The
Fund may utilize derivative financial instruments such as structured notes and equity swaps. Such instruments are used by the Fund as a means of investing in a particular market or increasing the return on the Fund’s investments or both. The value of
the principal of and/or interest on such securities is determined by reference to changes in the value of the financial indicators including, but not limited to indices, currencies or interest rates. These financial instruments may subject the Fund to a
greater degree of market or counterparty risk and loss than other types of securities.
|
| H. Segregation Transactions — The Fund may
enter into certain derivative transactions to seek to increase total return. Forward foreign currency exchange contracts, futures contracts, written options, mortgage dollar rolls, when-issued securities and forward commitments represent examples of such
transactions. As a result of entering into these transactions, the Fund is required to segregate liquid assets on the accounting records equal to or greater than the market value of the corresponding transactions.
|
| 3. AGREEMENTS
|
| Pursuant to the Investment Management Agreement (the “Agreement”), Goldman Sachs Asset Management International (“
GSAMI”), an affiliate of Goldman, Sachs & Co. (“Goldman Sachs”), serves as the investment adviser to the Fund. Under the Agreement, GSAMI, subject to the general supervision of the Trust’s Board of Trustees, manages the Fund’s
portfolio. As compensation for the services rendered under the Agreement, the assumption of the expenses related thereto and administering the Fund’s business affairs, including providing facilities, GSAMI is entitled to a fee, computed daily and
payable monthly, at an annual rate equal to 1.20% of the average daily net assets of the Fund.
|
| The investment adviser has voluntarily agreed to limit certain “Other
Expenses” (excluding management fees, distribution and service fees, transfer agent fees, taxes, interest, brokerage, litigation, Service share fees, indemnification costs and other extraordinary expenses) to the extent such expenses exceed, on an
annual basis, 0.35% (0.15% prior to May 1, 2000) of the average daily net assets of the Fund. Goldman Sachs reimbursed approximately $387,000 for the year ended August 31, 2000. In addition, the Fund has entered into certain offset arrangements with the
custodian resulting in a reduction in the Fund’s expenses. For the year ended August 31, 2000, Custody fees were reduced by approximately $22,000.
|
| The Trust, on behalf of the Fund, has adopted Distribution and Service Plans.
Under the Distribution and Service Plans, Goldman Sachs and/or authorized dealers are entitled to a monthly fee from the Fund for distribution and shareholder maintenance services equal, on an annual basis, to 0.50%, 1.00% and 1.00% of the Fund’s
average daily net assets attributable to Class A, Class B and Class C Shares, respectively.
|
| Goldman Sachs serves as the distributor of shares of the Fund pursuant to a
Distribution Agreement. Goldman Sachs may receive a portion of the Class A sales load and Class B and Class C contingent deferred sales charges and has advised the Fund that it has retained approximately $149,000 for the year ended August 31, 2000.
|
| Goldman Sachs also serves as the Transfer Agent of the Fund for a fee. Fees
charged for such transfer agency services are calculated daily and payable monthly at an annual rate as follows: 0.19% of average daily net assets for Class A, Class B and Class C Shares and 0.04% of average daily net assets for Institutional and Service
Shares.
|
| The Trust, on behalf of the Fund, has adopted a Service Plan. This Plan allows for
Service Shares to compensate service organizations for providing varying levels of account administration and shareholder liaison services to their customers who are beneficial owners of such shares. The Service Plan provides for compensation to the
service organizations in an amount up to 0.50% (on an annualized basis), of the average daily net asset value of the Service Shares.
|
| As of August 31, 2000, the amounts owed to affiliates were approximately $217,000,
$30,000 and $16,000 for Management, Distribution and Service and Transfer Agent fees, respectively.
|
| 4. PORTFOLIO SECURITIES TRANSACTIONS
|
| The cost of purchases and proceeds of sales and maturities of securities (excluding short-term investments) for the year ended
August 31, 2000 were $269,545,752 and $257,071,810, respectively. For the year ended August 31, 2000, Goldman Sachs earned approximately $63,000 of brokerage commissions from portfolio transactions.
|
| Forward Foreign Currency Exchange Contracts — The
Fund may enter into forward foreign currency exchange contracts for the purchase or sale of a specific foreign currency at a fixed price on a future date as a hedge or cross-hedge against either specific transactions or portfolio positions. The Fund may
also purchase and sell such contracts to seek to increase total return. All commitments are “marked-to-market” daily at the applicable translation rates and any resulting unrealized gains or losses are recorded in the Fund’s financial
statements. The Fund realizes gains or losses at the time a forward contract is offset by entry into a closing transaction or extinguished by delivery of the currency. Risks may arise upon entering these contracts from the potential inability of
counterparties to meet the terms of their contracts and from unanticipated movements in the value of a foreign currency relative to the U.S. dollar. At August 31, 2000 the Fund had no outstanding forward foreign currency exchange contracts.
|
| Futures Contracts — The Fund may enter into futures
transactions to hedge against changes in interest rates, securities prices, currency exchange rates or to seek to increase total return. Upon entering into a futures contract, the Fund is required to deposit with a broker or the Fund’s custodian
bank, an amount of cash or securities equal to the minimum “initial margin” requirement of the associated futures exchange. Subsequent payments for futures contracts (“variation margin”) are paid or received by the Fund, depending on
the fluctuations in the value of the contracts, and are recorded for financial reporting purposes as unrealized gains or losses. When contracts are closed, the Fund realizes a gain or loss which is reported in the Statement of Operations.
|
| The use of futures contracts involve, to varying degrees, elements of market risk
which may exceed the amounts recognized in the Statement of Assets and Liabilities. Changes in the value of the futures contract may not directly correlate with changes in the value of the underlying securities. This risk may decrease the effectiveness of
the Fund’s hedging strategies and potentially result in a loss. At August 31, 2000, the Fund had no open futures contracts.
|
| 4. PORTFOLIO SECURITIES TRANSACTIONS (continued)
|
| Option Accounting Principles — When the Fund writes
call or put options, an amount equal to the premium received is recorded as an asset and as an equivalent liability. The amount of the liability is subsequently marked-to-market to reflect the current market value of the option written. When a written
option expires on its stipulated expiration date or the Fund enters into a closing purchase transaction, the Fund realizes a gain or loss without regard to any unrealized gain or loss on the underlying security, and the liability related to such option is
extinguished. When a written call option is exercised, the Fund realizes a gain or loss from the sale of the underlying security, and the proceeds of the sale are increased by the premium originally received. When a written put option is exercised, the
amount of the premium originally received will reduce the cost of the security which the Fund purchases upon exercise. There is a risk of loss from a change in value of such options which may exceed the related premiums received.
|
| Upon the purchase of a call option or a protective put option by the Fund, the
premium paid is recorded as an investment and subsequently marked-to-market to reflect the current market value of the option. If an option which the Fund has purchased expires on the stipulated expiration date, the Fund will realize a loss in the amount
of the cost of the option. If the Fund enters into a closing sale transaction, the Fund will realize a gain or loss, depending on whether the sale proceeds for the closing sale transaction are greater or less than the cost of the option. If the Fund
exercises a purchased put option, the Fund will realize a gain or loss from the sale of the underlying security, and the proceeds from such sale will be decreased by the premium originally paid. If the Fund exercises a purchased call option, the cost of
the security which the Fund purchases upon exercise will be increased by the premium originally paid. At August 31, 2000, there were no open written option contracts.
|
| 5. LINE OF CREDIT FACILITY
|
| Effective May 31, 2000, the Fund participates in a $350,000,000 committed, unsecured revolving line of credit facility. Prior
thereto, the Fund participated in a $250,000,000 uncommitted and a $250,000,000 committed, unsecured revolving line of credit facility. Under the most restrictive arrangement, the Fund must own securities having a market value in excess of 400% of the
total bank borrowings. This facility is to be used solely for temporary or emergency purposes. The interest rate on borrowings is based on the Federal Funds rate. The committed facility also requires a fee to be paid by the Fund based on the amount of the
commitment which has not been utilized. During the year ended August 31, 2000, the Fund did not have any borrowings under any of these facilities.
|
| 6. OTHER MATTERS
|
| As of August 31, 2000, the Goldman Sachs Growth and Income Strategy Portfolio, the Goldman Sachs Growth Strategy Portfolio and the
Goldman Sachs Aggressive Growth Strategy Portfolio were beneficial owners of approximately 9%, 8% and 5% of the outstanding shares of the Fund, respectively.
|
| 7. CERTAIN RECLASSIFICATIONS
|
| In accordance with AICPA Statement of Position 93-2, the Fund has reclassified $1,813,367 from paid-in-capital to accumulated net
realized gain from investment and foreign currency related transactions and $35,839 from accumulated net investment loss to accumulated net realized gain from investment and foreign currency related transactions. These reclassifications have no impact on
the net asset value of the Fund and are designed to present the Fund’s capital accounts on a tax basis. Reclassifications result primarily from the difference in the tax treatment of net operating losses and organizations costs.
|
| 8. CHANGE IN INDEPENDENT ACCOUNTANTS
|
| On October 26, 1999 the Board of Trustees of the Fund, upon the recommendation of the Board’s audit committee, determined not
to retain Arthur Andersen LLP and approved a change of the Fund’s independent accountants to PricewaterhouseCoopers LLP. For the period ended August 31, 1999 and the year ended January 31, 1999, Arthur Andersen LLP’s audit reports contained no
adverse opinion or disclaimer of opinion; nor were their reports qualified or modified as to uncertainty, audit scope, or accounting principles. Further, there were no disagreements between the Fund and Arthur Andersen LLP on accounting principles or
practices, financial statement disclosure or audit scope or procedure, which if not resolved to the satisfaction of Arthur Andersen LLP would have caused them to make reference to the disagreement in their report.
|
| 9. SUMMARY OF SHARE TRANSACTIONS
|
| Share activity is as follows:
|
| For the Year
Ended August 31, 2000 |
For the Seven Months
Ended August 31, 1999 |
For the Year
Ended January 31, 1999 |
|||||||||||||||||
|---|---|---|---|---|---|---|---|---|---|---|---|---|---|---|---|---|---|---|---|
| Shares | Dollars | Shares | Dollars | Shares | Dollars | ||||||||||||||
| Class A Shares | |||||||||||||||||||
| Shares sold | 5,026,648 | $54,984,525 | 2,397,786 | $20,583,469 | 10,357,445 | $ 89,405,582 | |||||||||||||
| Reinvestment of dividends and distributions | — | — | — | — | 318,269 | 2,176,957 | |||||||||||||
| Shares repurchased | (6,183,012 | ) | (67,304,757 | ) | (2,788,776 | ) | (23,870,559 | ) | (5,015,931 | ) | (38,121,169 | ) | |||||||
| (1,156,364 | ) | (12,320,232 | ) | (390,990 | ) | (3,287,090 | ) | 5,659,783 | 53,461,370 | ||||||||||
| Class B Shares | |||||||||||||||||||
| Shares sold | 177,799 | 2,059,925 | 54,000 | 468,026 | 73,263 | 638,031 | |||||||||||||
| Reinvestment of dividends and distributions | — | — | — | — | 1,969 | 13,468 | |||||||||||||
| Shares repurchased | (79,346 | ) | (873,521 | ) | (13,777 | ) | (120,123 | ) | (16,489 | ) | (112,961 | ) | |||||||
| 98,453 | 1,186,404 | 40,223 | 347,903 | 58,743 | 538,538 | ||||||||||||||
| Class C Shares | |||||||||||||||||||
| Shares sold | 83,030 | 978,614 | 92,068 | 838,996 | 44,699 | 387,030 | |||||||||||||
| Reinvestment of dividends and distributions | — | — | — | — | 1,550 | 10,621 | |||||||||||||
| Shares repurchased | (80,149 | ) | (857,557 | ) | (12,341 | ) | (114,463 | ) | (15,015 | ) | (115,705 | ) | |||||||
| 2,881 | 121,057 | 79,727 | 724,533 | 31,234 | 281,946 | ||||||||||||||
| Institutional Shares | |||||||||||||||||||
| Shares sold | 4,246,307 | 48,602,783 | 1,216,533 | 10,282,975 | 13,487,704 | 129,913,895 | |||||||||||||
| Reinvestment of dividends and distributions | — | — | — | — | 304,854 | 2,100,442 | |||||||||||||
| Shares repurchased | (2,606,818 | ) | (29,764,998 | ) | (2,338,484 | ) | (18,913,111 | ) | (3,049,355 | ) | (24,429,866 | ) | |||||||
| 1,639,489 | 18,837,785 | (1,121,951 | ) | (8,630,136 | ) | 10,743,203 | 107,584,471 | ||||||||||||
| Service Shares | |||||||||||||||||||
| Shares sold | 163 | 1,453 | — | — | — | — | |||||||||||||
| Reinvestment of dividends and distributions | — | — | — | — | 6 | 43 | |||||||||||||
| Share repurchased | (166 | ) | (1,468 | ) | — | — | — | — | |||||||||||
| (3 | ) | (15 | ) | — | — | 6 | 43 | ||||||||||||
| NET INCREASE (DECREASE) | 584,456 | $ 7,824,999 | (1,392,991 | ) | $(10,844,790 | ) | 16,492,969 | $161,866,368 | |||||||||||
| Income from
investment operations |
Distributions to shareholders |
||||||||||||||||||||||
|---|---|---|---|---|---|---|---|---|---|---|---|---|---|---|---|---|---|---|---|---|---|---|---|
| Net asset
value, beginning of period |
Net
investment income (loss) |
Net realized
and unrealized gain (loss) |
Total
income from investment operations |
From net
investment income |
In excess
of net investment income |
Total
distributions |
|||||||||||||||||
| FOR THE YEAR ENDED AUGUST 31, | |||||||||||||||||||||||
| 2000 - Class A Shares | $ 9.26 | $(0.05 | ) (c) | $ 1.62 | $ 1.57 | $ — | $ — | $ — | |||||||||||||||
| 2000 - Class B Shares | 9.21 | (0.11 | ) (c) | 1.62 | 1.51 | — | — | — | |||||||||||||||
| 2000 - Class C Shares | 9.24 | (0.10 | ) (c) | 1.61 | 1.51 | — | — | — | |||||||||||||||
| 2000 - Institutional Shares | 9.37 | 0.01 | (c) | 1.64 | 1.65 | — | — | — | |||||||||||||||
| 2000 - Service Shares | 9.05 | 0.01 | (c) | 1.57 | 1.58 | — | — | — | |||||||||||||||
| FOR THE SEVEN MONTHS ENDED AUGUST 31, | |||||||||||||||||||||||
| 1999 - Class A Shares | 7.04 | (0.01 | ) | 2.23 | 2.22 | — | — | — | |||||||||||||||
| 1999 - Class B Shares | 7.03 | (0.03 | ) | 2.21 | 2.18 | — | — | — | |||||||||||||||
| 1999 - Class C Shares | 7.05 | (0.03 | ) | 2.22 | 2.19 | — | — | — | |||||||||||||||
| 1999 - Institutional Shares | 7.09 | 0.02 | 2.26 | 2.28 | — | — | — | ||||||||||||||||
| 1999 - Service Shares | 6.87 | 0.01 | 2.17 | 2.18 | — | — | — | ||||||||||||||||
| FOR THE YEAR ENDED JANUARY 31, | |||||||||||||||||||||||
| 1999 - Class A Shares | 9.69 | 0.04 | (2.40 | ) | (2.36 | ) | (0.07 | ) | (0.22 | ) | (0.29 | ) | |||||||||||
| 1999 - Class B Shares | 9.69 | 0.03 | (2.41 | ) | (2.38 | ) | (0.07 | ) | (0.21 | ) | (0.28 | ) | |||||||||||
| 1999 - Class C Shares | 9.70 | 0.01 | (2.39 | ) | (2.38 | ) | (0.07 | ) | (0.20 | ) | (0.27 | ) | |||||||||||
| 1999 - Institutional Shares | 9.70 | 0.06 | (2.36 | ) | (2.30 | ) | (0.08 | ) | (0.23 | ) | (0.31 | ) | |||||||||||
| 1999 - Service Shares | 9.69 | (0.13 | ) | (2.41 | ) | (2.28 | ) | (0.07 | ) | (0.21 | ) | (0.28 | ) | ||||||||||
| FOR THE PERIOD ENDED JANUARY 31, | |||||||||||||||||||||||
| 1998 - Class A Shares (commenced December 15, 1997) | 10.00 | — | (0.31 | ) | (0.31 | ) | — | — | — | ||||||||||||||
| 1998 - Class B Shares (commenced December 15, 1997) | 10.00 | — | (0.31 | ) | (0.31 | ) | — | — | — | ||||||||||||||
| 1998 - Class C Shares (commenced December 15, 1997) | 10.00 | — | (0.30 | ) | (0.30 | ) | — | — | — | ||||||||||||||
| 1998 - Institutional Shares (commenced December 15, 1997) | 10.00 | 0.01 | (0.31 | ) | (0.30 | ) | — | — | — | ||||||||||||||
| 1998 - Service Shares (commenced December 15, 1997) | 10.00 | — | (0.31 | ) | (0.31 | ) | — | — | — | ||||||||||||||
(a)
|
Assumes investment at the net asset value at the beginning of the period, reinvestment of all dividends and distributions, a
complete redemption of the investment at the net asset value at the end of the period and no sales or redemption charges. Total return would be reduced if a sales or redemption charge were taken into account. Total returns for periods less than one full
year are not annualized.
|
(b)
|
Annualized.
|
(c)
|
Calculated based on the average shares outstanding methodology.
|
|
Ratios assuming no expense reductions |
||||||||||||||||||||
|---|---|---|---|---|---|---|---|---|---|---|---|---|---|---|---|---|---|---|---|---|
| Net asset
value, end of period |
Total
return (a) |
Net assets
at end of period (in 000s) |
Ratio of
net expenses to average net assets |
Ratio of
net investment income (loss) to average net assets |
Ratio of
expenses to average net assets |
Ratio of
net investment income (loss) to average net assets |
Portfolio
turnover rate |
|||||||||||||
| $10.83 | 16.95 | % | $64,279 | 2.11 | % | (0.49 | )% | 2.30 | % | (0.68 | )% | 125.35% | ||||||||
| 10.72 | 16.40 | 2,187 | 2.61 | (1.00 | ) | 2.80 | (1.19 | ) | 125.35 | |||||||||||
| 10.75 | 16.34 | 1,304 | 2.61 | (0.96 | ) | 2.80 | (1.15 | ) | 125.35 | |||||||||||
| 11.02 | 17.61 | 145,774 | 1.46 | 0.13 | 1.65 | (0.06 | ) | 125.35 | ||||||||||||
| 10.63 | 17.46 | 2 | 1.96 | 0.14 | 2.15 | (0.05 | ) | 125.35 | ||||||||||||
| 9.26 | 31.53 | 65,698 | 2.04 | (b) | (0.15 | ) (b) | 2.41 | (b) | (0.52 | ) (b) | 63.24 | |||||||||
| 9.21 | 31.01 | 972 | 2.54 | (b) | (0.71 | ) (b) | 2.91 | (b) | (281.08 | ) (b) | 63.24 | |||||||||
| 9.24 | 31.06 | 1,095 | 2.54 | (b) | (0.85 | ) (b) | 2.91 | (b) | (1.22 | ) (b) | 63.24 | |||||||||
| 9.37 | 32.16 | 108,574 | 1.39 | (b) | 0.50 | (b) | 1.76 | (b) | 0.13 | (b) | 63.24 | |||||||||
| 9.05 | 31.73 | 2 | 1.89 | (b) | 0.12 | (b) | 2.26 | (b) | (0.25 | ) (b) | 63.24 | |||||||||
| 7.04 | (24.32 | ) | 52,704 | 2.09 | 0.80 | 2.53 | 0.36 | 153.67 | ||||||||||||
| 7.03 | (24.51 | ) | 459 | 2.59 | 0.19 | 3.03 | (0.25 | ) | 153.67 | |||||||||||
| 7.05 | (24.43 | ) | 273 | 2.59 | 0.28 | 3.03 | (0.16 | ) | 153.67 | |||||||||||
| 7.09 | (23.66 | ) | 90,189 | 1.35 | 1.59 | 1.79 | 1.15 | 153.67 | ||||||||||||
| 6.87 | (26.17 | ) | 1 | 1.85 | (1.84 | ) | 2.29 | (2.28 | ) | 153.67 | ||||||||||
| 9.69 | (3.10 | ) | 17,681 | 1.90 | (b) | 0.55 | (b) | 5.88 | (b) | (3.43 | ) (b) | 3.35 | ||||||||
| 9.69 | (3.10 | ) | 64 | 2.41 | (b) | 0.05 | (b) | 6.39 | (b) | (3.93 | ) (b) | 3.35 | ||||||||
| 9.70 | (3.00 | ) | 73 | 2.48 | (b) | (0.27 | ) (b) | 6.46 | (b) | (4.25 | ) (b) | 3.35 | ||||||||
| 9.70 | (3.00 | ) | 19,120 | 1.30 | (b) | 0.80 | (b) | 5.28 | (b) | (3.18 | ) (b) | 3.35 | ||||||||
| 9.69 | (3.10 | ) | 2 | 2.72 | (b) | (0.05 | ) (b) | 6.70 | (b) | (4.03 | ) (b) | 3.35 | ||||||||
| To the Shareholders and Board of Trustees of
|
| Goldman Sachs Trust — Emerging Markets Equity Fund:
|
| In our opinion, the accompanying statement of assets and liabilities, including the statement of investments, and the related
statements of operations and of changes in net assets and the financial highlights present fairly, in all material respects, the financial position of Goldman Sachs Emerging Markets Equity Fund (“the Fund”), one of the portfolios constituting
Goldman Sachs Trust, at August 31, 2000, the results of its operations, the changes in its net assets and the financial highlights for the year then ended, in conformity with accounting principles generally accepted in the United States of America. These
financial statements and financial highlights (hereafter referred to as “financial statements”) are the responsibility of the Fund’s management; our responsibility is to express an opinion on these financial statements based on our audit.
We conducted our audit of these financial statements in accordance with auditing standards generally accepted in the United States of America, which require that we plan and perform the audit to obtain reasonable assurance about whether the financial
statements are free of material misstatement. An audit includes examining, on a test basis, evidence supporting the amounts and disclosures in the financial statements, assessing the accounting principles used and significant estimates made by management,
and evaluating the overall financial statement presentation. We believe that our audit, which included confirmation of securities at August 31, 2000 by correspondence with the custodian and brokers, provides a reasonable basis of our opinion. The
statements of changes in net assets of the Fund for the period ended August 31, 1999 and the year ended January 31, 1999 and the financial highlights for each of the periods ended on or before August 31, 1999 were audited by other independent accountants
whose report dated October 8, 1999 expressed an unqualified opinion thereon.
|
| PricewaterhouseCoopers LLP
|
| Boston, Massachusetts
|
| October 23, 2000
|
GOLDMAN SACHS FUND PROFILE
Goldman Sachs Emerging Markets Equity Fund
An Investment Idea for the Long Term
History has shown that a long-term plan that includes stocks of emerging market countries is more likely to provide greater returns and reduce overall portfolio volatility over time than a portfolio that invests only in U.S.-based stocks.
Goldman Sachs Emerging Markets Equity Fund offers investors access to the benefits associated with emerging market investing. The Fund seeks long-term capital appreciation, primarily through equity securities of emerging country issuers.
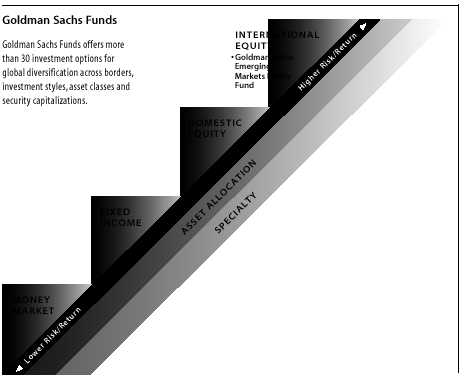
Target Your Needs
The Goldman Sachs Emerging Markets Equity Fund has a distinct investment objective and a defined place on the risk/return spectrum. As your investment objectives change, you can exchange shares within Goldman Sachs Funds without an additional charge.* (Please note: in general, greater returns are associated with greater risk.)
For More Information
To learn more about the Goldman Sachs Emerging Markets Equity Fund and other Goldman Sachs Funds, call your investment professional today.
*The exchange privilege is subject to termination and its terms are subject to change.
|
|