
|
|
|
|
|
|
|
|
|
GOLDMAN SACHS INTERNET TOLLKEEPER FUND
Market Overview
Dear Shareholder,
It has been an eventful period in the financial markets thus far in 2000—one marked by a dramatic increase in volatility, uncertainty and, ultimately, mixed performance results.
Market Review
The S&P 500 Index fell slightly during the six-month reporting period, but this masked the volatile nature of the market. For example, during the second quarter the spread between the daily high and low prices for the S&P 500 Index averaged 2.0%, versus its long-term average of 1.2%. In June, the return dispersion—the spread between the best- and worst-performing stocks—hit its highest level in over two decades.
Early in the year, the market was led by a fairly narrow band of technology issues, while most other stocks languished. However, high stock valuations, inflationary concerns, and rising interest rates caused investors to abandon the technology-heavy NASDAQ in the middle of March.
While other types of stocks were dragged down as well, technology issues experienced the brunt of the damage. By the end of the reporting period, the NASDAQ had fallen 27% from its high, while the S&P 500 Index was down roughly 5% from its peak.
The correction in the technology market was not unexpected. After the NASDAQ rose an unprecedented 86% in 1999 and gained an additional 24% prior to the March correction, many market participants believed that it had appreciated too far, too fast. While painful, the decline helped to remove some of the excess valuations in many technology stocks.
Market Outlook
Looking ahead, we are cautiously optimistic about the near term prospects for the overall U.S. equity market. The combination of more reasonable growth in the U.S., stronger demand growth outside of the U.S. (particularly in Asia), and a moderation in energy prices would be quite beneficial to equities.
In the technology sector, we believe the long-term outlook remains positive. As we’ve seen, periods of short-term volatility will occur. However, many aspects of the technological revolution are still in their early stages, with tremendous upside potential remaining. Therefore, we would urge investors to maintain a longer-term outlook, and to work with their financial professional to ensure that they maintain a well diversified portfolio.
In summary, we appreciate your confidence and look forward to serving your investment needs in the future.
Sincerely,
![]()
| David B. Ford | David W. Blood |
| Co-Head, Goldman Sachs Asset Management | Co-Head, Goldman Sachs Asset Management |
July 17, 2000
GOLDMAN SACHS INTERNET TOLLKEEPER FUND
Fund Basics
as of June 30, 2000
PERFORMANCE REVIEW
| December 31, 1999– | Fund Cumulative
|
S&P 500
|
NASDAQ
|
Goldman Sachs
|
| June 30, 2000 | Total Return (based on NAV)1
|
Index2
|
Composite Index2
|
Internet Index2
|
| |
||||
| Class A | –3.84%
|
–0.42%
|
–2.54%
|
–18.48%
|
| Class B | –4.17
|
–0.42
|
–2.54
|
–18.48
|
| Class C | –4.17
|
–0.42
|
–2.54
|
–18.48
|
| Institutional | –3.48
|
–0.42
|
–2.54
|
–18.48
|
| Service | –3.85
|
–0.42
|
–2.54
|
–18.48
|
| |
||||
1 The net asset value represents the net assets of the Fund (ex-dividend) divided by the total number of shares outstanding. The Fund’s performance reflects the investment of dividends and other distributions. Total return figures are not annualized.
2 The indexes are unmanaged and do not reflect any fees or expenses. In addition, investors cannot invest directly in the indexes. The S&P 500 and NASDAQ Composite Indexes have dividends reinvested.
STANDARDIZED TOTAL RETURNS
| For the period ended 6/30/00 | Class A
|
Class B
|
Class C
|
Institutional
|
Service
|
|
|
|||||
| Since Inception3 | 74.95%
|
79.00%
|
82.90%
|
85.80%
|
84.90%
|
| (10/1/99) | |||||
| |
|||||
3 The Standardized Total Returns are cumulative total returns (if the performance period is one year or less) as of the most recent calendar quarter-end. They assume reinvestment of all distributions at NAV. These returns reflect a maximum initial sales charge of 5.5% for Class A shares, the assumed deferred sales charge for Class B shares (5% maximum declining to 0% after six years) and the assumed deferred sales charge for Class C shares (1% if redeemed within 12 months of purchase). Because Institutional and Service shares do not involve a sales charge, such a charge is not applied to their respective Standardized Total Returns.
The Fund’s performance reflected a period of sharply rising stock prices for “internet tollkeepers” stocks, a trend that is unlikely to continue indefinitely in the future.
Total return figures represent past performance and do not indicate future results, which will vary. The investment return and principal value of an investment will fluctuate and, therefore, an investor’s shares, when redeemed, may be worth more or less than their original cost. Performance reflects expense limitations in effect. In their absence, performance would be reduced.
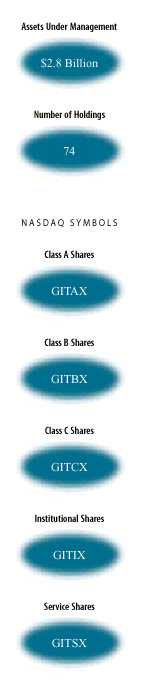
TOP 10 HOLDINGS AS OF 6/30/004
| Holding | % of Total Net Assets
|
Line of Business
|
| |
||
| VeriSign, Inc. | 4.6%
|
Internet |
| Crown Castle International Corp. | 4.2
|
Wireless |
| E-Tek Dynamics, Inc. | 4.2
|
Semiconductor |
| Viacom, Inc. Class B | 3.7
|
Media |
| Time Warner, Inc. | 3.7
|
Media |
| Corning, Inc. | 3.6
|
Electrical Equipment |
| Sprint Corp. (PCS Group) | 3.2
|
Wireless |
| Nortel Networks Corp. | 3.1
|
Electrical Equipment |
| DoubleClick, Inc. | 2.7
|
Internet |
| Infinity Broadcasting Corp. | 2.4
|
Media |
| |
||
4 The top 10 holdings may not be representative of the Fund’s future investments.
The Fund may participate in the Initial Public Offering (IPO) market, and a portion of the Fund’s returns consequently may be attributable to its investments in IPOs, which may have a magnified impact due to the Fund’s small asset base at start up. As the Fund’s assets grow, it is probable that the effect of the Fund’s investments in IPOs on its total returns may not be as significant.
GOLDMAN SACHS INTERNET TOLL KEEPER FUND
Performance Overview
Dear Shareholder,
We are pleased to report on the performance of the Goldman Sachs Internet Tollkeeper Fund. This semiannual report covers the six-month period ended June 30, 2000.
Performance Review
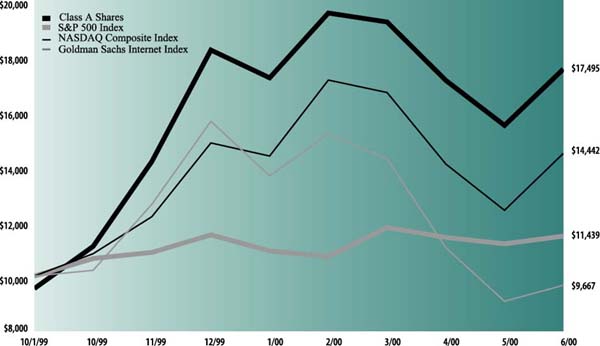
Over the six-month period that ended June 30, 2000 the Fund’s Class A, B, C, Institutional and Service classes generated, respectively –3.84%, –4.17%, –4.17%, –3.48% and –3.85% cumulative total returns at net asset value. Although the Fund does not have an official benchmark, we measure performance relative to several indices, including the Goldman Sachs Internet Index, S&P 500 Index, and NASDAQ Composite (with dividends reinvested). Over the same time period, these various benchmarks have generated cumulative total returns –18.48%, –0.42% and –2.54%, respectively.
Portfolio Positioning
The Fund invests primarily in established growth businesses within the media, telecommunications, technology and Internet sectors.
Portfolio Highlights
The period under review was marked by volatility rarely seen in the financial markets. This was most pronounced in the technology and Internet sectors, which rose rapidly early in the year, fell dramatically in mid-March through May — only to stage a rebound in June. While the Fund experienced some volatility along with Internet stocks, performance was less volatile than several technology-heavy indices. We would expect this, as we take a different — and potentially more conservative — approach to investing in the Internet.
GOLDMAN SACHS INTERNET TOLLKEEPER FUND
Portfolio Outlook
While we neither make nor rely on economic forecasts to make investment decisions, we are generally bullish on growth in technology and Internet-related businesses. Over the last decade, technological advances and the Internet have enhanced global communication and provided significant benefits to both consumers and businesses. We believe that those U.S. companies that adopt an astute Internet strategy will continue to benefit from this trend over the long term. These are generally companies with recurring revenue streams that dominate markets with high barriers to entry — firms that may grow revenue by increasing “traffic,” or customers and sales, and raising prices. Throughout the investment process, we continue to focus on the core business characteristics that provide a foundation for long-term growth, such as strength of franchise, quality of management, and free cash flow, along with favorable demographic trends. We believe that the enduring competitive advantage of the technology and Internet-related companies the Fund holds — based on the criteria mentioned above — can withstand even an uncertain market environment.
We thank you for your investment and look forward to your continued confidence.
Goldman Sachs Growth Equity Management Team
July 17, 2000
GOLDMAN SACHS INTERNET TOLLKEEPER FUND
The Goldman Sachs Advantage
Founded in 1869, Goldman, Sachs & Co. is a premier financial services firm traditionally known on Wall Street and around the world for its institutional expertise.
Today, the firm’s Investment Management Division provides individual investors the opportunity to tap the resources of a global institutional powerhouse — and put this expertise to work in their individual portfolios.
What Sets Goldman Sachs Funds Apart?
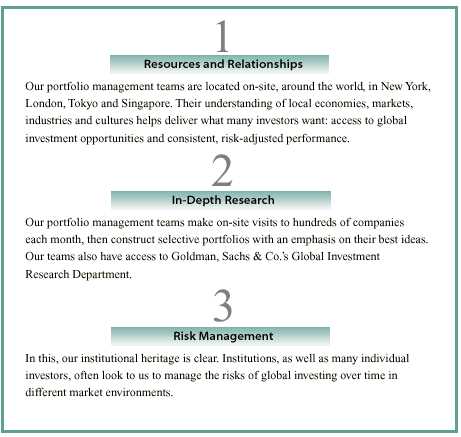
To learn more about the Goldman Sachs Funds, call your investment professional today.
| The following graph shows the value as of June 30, 2000, of a $10,000 investment made on October 1, 1999 (commencement of
operations) in Class A shares (with the maximum sales charge of 5.5%) of the Goldman Sachs Internet Tollkeeper Fund. For comparative purposes, the performance of the Fund’s benchmarks (S&P 500 Index, NASDAQ Composite Index and Goldman Sachs
Internet Index) are shown. This performance data represents past performance and should not be considered indicative of future performance which will fluctuate with changes in market conditions. These performance fluctuations will cause an investor’s
shares, when redeemed, to be worth more or less than their original cost. Performance of Class B, Class C, Institutional and Service Shares will vary from Class A due to differences in fees and loads.
|
| Internet Tollkeeper Fund’s Lifetime Performance
|
| Growth of a $10,000 Investment, October 1, 1999 to June 30, 2000.
|
 |
| Aggregate Total Return through June 30, 2000 | Since Inception(a) | Six Months(a) | |||
|---|---|---|---|---|---|
| Class A Shares (commenced October 1, 1999) | |||||
| Excluding sales charges | 85.10% | -3.84% | |||
| Including sales charges | 74.95% | -9.13% | |||
| Class B Shares (commenced October 1, 1999) | |||||
| Excluding contingent deferred sales charges | 84.00% | -4.17% | |||
| Including contingent deferred sales charges | 79.00% | -8.96% | |||
| Class C Shares (commenced October 1, 1999) | |||||
| Excluding contingent deferred sales charges | 83.90% | -4.17% | |||
| Including contingent deferred sales charges | 82.90% | -5.13% | |||
| Institutional Shares (commenced October 1, 1999) | 85.80% | -3.48% | |||
| Service Shares (commenced October 1, 1999) | 84.90% | -3.85% | |||
| (a) Not annualized.
|
| Shares | Description | Value | |||
|---|---|---|---|---|---|
| Common Stocks – 96.8% | |||||
| Computer Hardware – 8.6% | |||||
| 28,170 | Accelerated Networks, Inc. * | $ 1,188,422 | |||
| 507,600 | Apple Computer, Inc. * | 26,585,550 | |||
| 94,900 | Brocade Communications
Systems, Inc. * |
17,412,667 | |||
| 946,400 | Cisco Systems, Inc. * | 60,155,550 | |||
| 781,600 | EMC Corp. * | 60,134,350 | |||
| 263,200 | Network Appliance, Inc. * | 21,187,600 | |||
| 558,500 | Sun Microsystems, Inc. * | 50,788,594 | |||
| 237,452,733 | |||||
| Computer Software – 8.5% | |||||
| 502,400 | CheckFree Holdings Corp. * | 25,905,000 | |||
| 624,900 | Intuit, Inc. * | 25,855,237 | |||
| 752,430 | Microsoft Corp. * | 60,194,400 | |||
| 701,900 | Oracle Corp. * | 59,003,469 | |||
| 123,700 | Redback Networks, Inc. * | 22,018,600 | |||
| 306,400 | Symantec Corp. * | 16,526,450 | |||
| 142,350 | VERITAS Software Corp. * | 16,087,774 | |||
| 338,250 | Witness Systems, Inc. * | 8,244,844 | |||
| 233,835,774 | |||||
| Electrical Equipment – 8.8% | |||||
| 368,300 | Corning, Inc. | 99,394,912 | |||
| 32,870 | New Focus, Inc. * | 2,699,499 | |||
| 1,228,900 | Nortel Networks Corp. | 83,872,425 | |||
| 548,100 | QUALCOMM, Inc. * | 32,886,000 | |||
| 217,200 | Sycamore Networks, Inc. * | 23,973,450 | |||
| 242,826,286 | |||||
| Electrical Utilities – 0.8% | |||||
| 461,680 | The AES Corp. * | 21,064,150 | |||
| Home Products – 0.6% | |||||
| 879,960 | Energizer Holdings, Inc. * | 16,059,270 | |||
| Information Services – 4.5% | |||||
| 831,930 | Cendant Corp. * | 11,647,020 | |||
| 1,225,010 | First Data Corp. | 60,791,121 | |||
| 1,214,400 | Internap Network Services Corp. * | 50,416,575 | |||
| 122,854,716 | |||||
| Internet – 16.8% | |||||
| 114,900 | America Online, Inc. * | 6,060,975 | |||
| 161,600 | Ariba, Inc. * | 15,844,375 | |||
| 203,580 | Art Technology Group, Inc. * | 20,548,856 | |||
| 429,300 | BroadVision, Inc. * | 21,813,806 | |||
| 1,912,750 | DoubleClick, Inc. * | 72,923,594 | |||
| 340,720 | E.piphany, Inc. * | 36,520,925 | |||
| 156,480 | eBay, Inc. * | 8,498,820 | |||
| 280,770 | Expedia, Inc. * | 4,158,906 | |||
| 658,700 | GetThere.com, Inc. * | 6,957,519 | |||
| 184,600 | InfoSpace, Inc. * | 10,199,150 | |||
| 1,097,730 | Intertrust Technologies Corp. * | 22,572,073 | |||
| 378,300 | Interwoven, Inc. * | 41,607,089 | |||
| 618,960 | SI Corp. * | 14,429,505 | |||
| 668,800 | Travelocity.com, Inc. * | 10,951,600 | |||
| 713,978 | VeriSign, Inc. * | 126,017,029 | |||
| 363,200 | Yahoo!, Inc. * | 44,991,400 | |||
| 464,095,622 | |||||
| Media – 23.0% | |||||
| 822,200 | AMFM, Inc. * | 56,731,800 | |||
| 2,391,800 | AT&T Corp.-Liberty Media Group * | 58,001,150 | |||
| 728,900 | Cablevision Systems Corp. * | 49,474,088 | |||
| 950,150 | Comcast Corp. | 38,481,075 | |||
| 516,200 | EchoStar Communications Corp. * | 17,091,059 | |||
| 1,810,325 | Infinity Broadcasting Corp. * | 65,963,717 | |||
| Shares | Description | Value | |||
|---|---|---|---|---|---|
| Common Stocks – (continued) | |||||
| Media – (continued) | |||||
| 626,700 | Liberty Digital, Inc. * | $ 18,801,000 | |||
| 299,100 | The Walt Disney Co. | 11,608,819 | |||
| 1,321,100 | Time Warner, Inc. * | 100,403,600 | |||
| 854,400 | TV Guide, Inc. * | 29,263,200 | |||
| 485,500 | UnitedGlobalCom, Inc. * | 22,697,125 | |||
| 273,500 | Univision Communications, Inc. * | 28,307,250 | |||
| 1,475,817 | Viacom, Inc. Class B * | 100,632,272 | |||
| 1,080,800 | Westwood One, Inc. * | 36,882,300 | |||
| 634,338,455 | |||||
| Security/Asset Management – 1.1% | |||||
| 873,150 | The Charles Schwab Corp. | 29,359,669 | |||
| Semiconductors – 11.3% | |||||
| 157,800 | Analog Devices, Inc. * | 11,992,800 | |||
| 98,400 | Applied Materials, Inc. * | 8,917,500 | |||
| 413,300 | ARM Holdings PLC ADR * | 13,587,238 | |||
| 431,510 | E-Tek Dynamics, Inc. | 113,837,732 | |||
| 864,390 | Integrated Circuit Systems, Inc. * | 14,802,679 | |||
| 385,400 | Intel Corp. * | 51,523,162 | |||
| 120,300 | Maxim Integrated Products, Inc. * | 8,172,881 | |||
| 141,880 | PMC-Sierra, Inc. * | 25,210,303 | |||
| 64,800 | SDL, Inc. * | 18,480,150 | |||
| 337,500 | Texas Instruments, Inc. | 23,182,031 | |||
| 256,100 | Xilinx, Inc. * | 21,144,256 | |||
| 310,850,732 | |||||
| Telephone – 3.2% | |||||
| 555,825 | NTL, Inc. * | 33,280,022 | |||
| 730,650 | Sprint Corp. | 37,263,150 | |||
| 376,100 | WorldCom, Inc. * | 17,253,587 | |||
| 87,796,759 | |||||
| Wireless – 9.6% | |||||
| 199,850 | American Tower Corp. * | 8,331,247 | |||
| 3,171,180 | Crown Castle International Corp. * | 115,748,070 | |||
| 1,470,700 | Sprint Corp. (PCS Group) * | 87,506,650 | |||
| 1,300,700 | Vodafone AirTouch PLC ADR | 53,897,756 | |||
| 265,483,723 | |||||
| TOTAL COMMON STOCKS | |||||
| (Cost $2,432,210,116) | |||||
| $2,666,017,889 | |||||
| Principal
Amount |
Interest
Rate |
Maturity
Date |
Value | ||||
|---|---|---|---|---|---|---|---|
| Repurchase Agreement – 2.3% | |||||||
| Joint Repurchase Agreement Account II | |||||||
| $64,300,000 | 6.87% | 07/03/2000 | $ 64,300,000 | ||||
| TOTAL REPURCHASE AGREEMENT | |||||||
| (Cost $64,300,000) | $ 64,300,000 | ||||||
| TOTAL INVESTMENTS | |||||||
| (Cost $2,496,510,116) | $2,730,317,889 | ||||||
*
|
Non-income producing security.
|
| The percentage shown for each investment category reflects the value of investments in that category as a percentage of total net
assets.
|
| |
| Investment Abbreviation:
|
| ADR—American Depositary Receipt
|
| |
| Assets: | |||
| Investment in securities, at value (identified cost $2,496,510,116) | $2,730,317,889 | ||
| Cash | 91,767 | ||
| Receivables: | |||
| Investment securities sold | 22,232,444 | ||
| Dividends and interest | 205,459 | ||
| Fund shares sold | 11,095,056 | ||
| Other assets | 91,600 | ||
| Total assets | 2,764,034,215 | ||
| Liabilities: | |||
| Payables: | |||
| Investment securities purchased | 852,670 | ||
| Fund shares repurchased | 2,964,471 | ||
| Amounts owed to affiliates | 4,049,718 | ||
| Accrued expenses and other liabilities | 185,488 | ||
| Total liabilities | 8,052,347 | ||
| Net Assets: | |||
| Paid-in capital | 2,503,094,905 | ||
| Accumulated net investment loss | (17,667,050 | ) | |
| Accumulated net realized gain on investment transactions | 36,746,240 | ||
| Net unrealized gain on investments | 233,807,773 | ||
| NET ASSETS | $2,755,981,868 | ||
| Net asset value, offering and redemption price per share: (a) | |||
| Class A | $18.51 | ||
| Class B | $18.40 | ||
| Class C | $18.39 | ||
| Institutional | $18.58 | ||
| Service | $18.49 | ||
| Shares outstanding: | |||
| Class A | 57,521,747 | ||
| Class B | 53,062,013 | ||
| Class C | 30,655,679 | ||
| Institutional | 8,082,539 | ||
| Service | 14,639 | ||
| Total shares outstanding, $.001 par value (unlimited number of shares authorized) | 149,336,617 | ||
(a)
|
Maximum public offering price per share (NAV per share multiplied by 1.0582) for Class A shares is $19.59. At redemption, Class B
and Class C shares may be subject to a contingent deferred sales charge, assessed on the amount equal to the lesser of the current net asset value or the original purchase price of the shares.
|
| Investment income: | |||
| Dividends (a) | $ 573,833 | ||
| Interest | 3,790,650 | ||
| Total income | 4,364,483 | ||
| Expenses: | |||
| Management fees | 11,661,712 | ||
| Distribution and Service fees (b) | 7,718,250 | ||
| Transfer Agent fees (c) | 2,129,823 | ||
| Registration fees | 214,848 | ||
| Custodian fees | 115,812 | ||
| Professional fees | 9,711 | ||
| Trustee fees | 5,237 | ||
| Service Share fees | 381 | ||
| Other | 216,214 | ||
| Total expenses | 22,071,988 | ||
| Less — expenses reimbursed | (40,455 | ) | |
| Net expenses | 22,031,533 | ||
| NET INVESTMENT LOSS | (17,667,050 | ) | |
| Realized and unrealized gain (loss) on investment transactions: | |||
| Net realized gain from investment transactions | 9,766,303 | ||
| Net change in unrealized gain on investments | (111,585,311 | ) | |
| Net realized and unrealized loss on investment transactions: | (101,819,008 | ) | |
| NET DECREASE IN NET ASSETS RESULTING FROM OPERATIONS | $(119,486,058 | ) | |
(a)
|
Foreign withholding taxes on dividends were $19,964.
|
(b)
|
Class A, Class B and Class C had Distribution and Service fees of $1,123,593, $4,133,538 and $2,461,119, respectively.
|
(c)
|
Class A, Class B, Class C, Institutional Class and Service Class had Transfer Agent fees of $853,930, $785,372, $467,614, $22,877
and $30, respectively.
|
| For the Six
Months Ended June 30, 2000 (Unaudited) |
For the Period
Ended December 31, 1999 (a) |
||||||
|---|---|---|---|---|---|---|---|
| From operations: | |||||||
| Net investment loss | $ (17,667,050 | ) | $ (2,291,334 | ) | |||
| Net realized gain on investment transactions | 9,766,303 | 28,576,273 | |||||
| Net change in unrealized gain (loss) on investments | (111,585,311 | ) | 345,393,084 | ||||
| Net increase (decrease) in net assets resulting from operations | (119,486,058 | ) | 371,678,023 | ||||
| From share transactions: | |||||||
| Proceeds from sales of shares | 1,621,812,985 | 1,167,201,530 | |||||
| Cost of shares repurchased | (256,625,452 | ) | (28,599,160 | ) | |||
| Net increase in net assets resulting from share transactions | 1,365,187,533 | 1,138,602,370 | |||||
| TOTAL INCREASE | 1,245,701,475 | 1,510,280,393 | |||||
| Net assets: | |||||||
| Beginning of period | 1,510,280,393 | — | |||||
| End of period | $2,755,981,868 | $1,510,280,393 | |||||
| Accumulated net investment loss | $ (17,667,050 | ) | $ — | ||||
(a)
|
Commencement of operations was October 1, 1999 for all classes.
|
| 1. ORGANIZATION
|
| Goldman Sachs Trust (the “Trust”) is a Delaware business trust registered under the Investment Company Act of 1940 (as
amended) as an open-end management investment company. The Trust includes the Goldman Sachs Internet Tollkeeper Fund (the “Fund”). The Fund is a diversified portfolio offering five classes of shares — Class A, Class B, Class C,
Institutional and Service.
|
| 2. SIGNIFICANT ACCOUNTING POLICIES
|
| The following is a summary of the significant accounting policies consistently followed by the Fund. The preparation of financial
statements in conformity with generally accepted accounting principles requires management to make estimates and assumptions that may affect the reported amounts. Actual results could differ from those estimates.
|
| A. Investment Valuation — Investments in
securities traded on a U.S. or foreign securities exchange or the NASDAQ system are valued daily at their last sale price on the principal exchange on which they are traded. If no sale occurs, securities are valued at the last bid price. Unlisted equity
and debt securities for which market quotations are available are valued at the last sale price on valuation date, or if no sale occurs, at the last bid price. Short-term debt obligations maturing in sixty days or less are valued at amortized cost.
Securities for which quotations are not readily available, are valued at fair value using methods approved by the Trust’s Board of Trustees.
|
| B. Securities Transactions and Investment Income — Securities transactions are recorded as of the trade date. Realized gains and losses on sales of investments are calculated using the identified-cost basis. Dividend income is recorded on the ex-dividend date. Dividends for which the Fund has the choice
to receive either cash or stock are recognized as investment income in an amount equal to the cash dividend. This amount is also used as an estimate of the fair value of the stock received. Interest income is determined on the basis of interest accrued.
|
| C. Expenses — Expenses incurred by the
Trust which do not specifically relate to an individual fund of the Trust are allocated to the funds on a straight-line or pro-rata basis depending upon the nature of the expense.
|
| Class A, Class B and Class C shareholders of the Fund bear all expenses and fees
relating to their respective Distribution and Service Plans. Each class of shares separately bears its respective class-specific Transfer Agency fees. Shareholders of Service Shares bear all expenses and fees paid to service organizations.
|
| D. Federal Taxes — It is the Fund’s
policy to comply with the requirements of the Internal Revenue Code applicable to regulated investment companies and to distribute each year substantially all of its investment company taxable income and capital gains to its shareholders. Accordingly, no
federal tax provision is required.
|
| The characterization of distributions to shareholders for financial reporting
purposes is determined in accordance with income tax rules. Therefore, the source of the Fund’s distributions may be shown in the accompanying financial statements as either from or in excess of net investment income or net realized gain on
investment transactions, or from paid-in-capital, depending on the type of book/tax differences that may exist.
|
| At June 30, 2000, the aggregate cost of portfolio securities for federal income
tax purposes is $2,496,984,629. Accordingly, the gross unrealized gain on investments was $465,334,425 and the gross unrealized loss was $232,001,165 resulting in a net unrealized gain of $233,333,260.
|
| 3. AGREEMENTS
|
| Goldman Sachs Asset Management (“GSAM”), a unit of the Investment Management Division of Goldman, Sachs & Co. (“
Goldman Sachs”), serves as investment adviser pursuant to an Investment Management Agreement (the “Agreement”). Under the Agreement, GSAM, subject to the general supervision of the Trust’s Board of Trustees, manages the Fund’s
portfolio. As compensation for the services rendered pursuant to the Agreement, the assumption of the expenses related thereto and administering the Fund’s business affairs, including providing facilities, GSAM is entitled to a fee, computed daily
and payable monthly, at an annual rate equal to 1.00% of the average daily net assets of the Fund.
|
| 3. AGREEMENTS (continued)
|
| Goldman Sachs has voluntarily agreed to limit “Other Expenses” for the
Fund (excluding Management fees, Service Share fees, Distribution and Service fees, Transfer Agent fees, litigation and indemnification costs, taxes, interest, brokerage commissions, and extraordinary expenses) to the extent such expenses exceed .06% of
the average daily net assets of the Fund. For the six months ended June 30, 2000, there was no expense reimbursement. However, the Fund has entered into certain expense offset arrangements with the custodian resulting in a reduction in the Fund’s
expenses. For the six months ended June 30, 2000, the Custody fees were reduced by approximately $40,000 under such arrangements.
|
| Goldman Sachs serves as the Distributor of shares of the Fund pursuant to a
Distribution Agreement. Goldman Sachs may receive a portion of the Class A sales load and Class B and Class C contingent deferred sales charges and has advised the Fund that it retained approximately $3,787,000 for the six months ended June 30, 2000.
|
| The Trust, on behalf of the Fund, has adopted Distribution and Service plans.
Under the Distribution and Service plans, Goldman Sachs and/or Authorized Dealers are entitled to a monthly fee for distribution and shareholder maintenance services equal, on an annual basis, to .25%, 1.00% and 1.00% of the average daily net assets
attributable to Class A, Class B and Class C Shares, respectively.
|
| The Trust, on behalf of the Fund, has adopted a Service Plan. This Plan allows for
Service Shares to compensate service organizations for providing varying levels of account administration and shareholder liaison services to their customers who are beneficial owners of such shares. The Service Plan provides for compensation to the
service organizations in an amount up to .50% (on an annualized basis), of the average daily net asset value of the Service Shares.
|
| Goldman Sachs also serves as the Transfer Agent of the Fund for a fee. Fees
charged for such Transfer Agency services are calculated daily and payable monthly at an annual rate as follows: .19% of the average daily net assets for Class A, Class B and Class C Shares and .04% of the average daily net assets for Institutional and
Service Shares.
|
| At June 30, 2000, the Fund owed approximately $2,204,000, $1,445,000 and $401,000
for Management, Distribution and Service and Transfer Agent fees, respectively.
|
| 4. PORTFOLIO SECURITIES TRANSACTIONS
|
| Purchases and proceeds of sales or maturities of securities (excluding short-term investments) for the period ended June 30, 2000,
were $2,124,734,455 and $781,823,319, respectively.
|
| For the six months ended June 30, 2000, Goldman Sachs earned approximately $8,000
of brokerage commissions from portfolio transactions.
|
| 5. REPURCHASE AGREEMENTS
|
| During the term of a repurchase agreement, the value of the underlying securities, including accrued interest, is required to
equal or exceed the value of the repurchase agreement. The underlying securities for all repurchase agreements are held in safekeeping by a bank custodian.
|
| 6. JOINT REPURCHASE AGREEMENT ACCOUNT
|
| The Fund, together with other registered investment companies having management agreements with GSAM or its affiliates, transfers
uninvested cash into joint accounts, the daily aggregate balance of which is invested in one or more repurchase agreements.
|
| 6. JOINT REPURCHASE AGREEMENT ACCOUNT (continued)
|
| At June 30, 2000, the Fund had an undivided interest in the repurchase agreement
in the following joint account which equaled $64,300,000 in principal amount. At June 30, 2000, the following repurchase agreements held in this joint account were fully collateralized by Federal Agency obligations.
|
| Repurchase Agreements | Principal
Amount |
Interest
Rate |
Maturity
Date |
Amortized
Cost |
Maturity
Value |
|||||||
|---|---|---|---|---|---|---|---|---|---|---|---|---|
| ABN/AMRO, Inc. | $995,900,000 | 6.85 | % | 07/03/00 | $ 995,900,000 | $996,468,493 | ||||||
| Banc of America Securities LLC | 800,000,000 | 6.88 | 07/03/00 | 800,000,000 | 800,458,667 | |||||||
| Bear Stearns Companies, Inc. | 500,000,000 | 6.85 | 07/03/00 | 500,000,000 | 500,285,417 | |||||||
| Donaldson, Lufkin & Jenrette, Inc. | 500,000,000 | 6.90 | 07/03/00 | 500,000,000 | 500,287,500 | |||||||
| TOTAL JOINT REPURCHASE AGREEMENT ACCOUNT II | $2,795,900,000 | $2,797,500,077 | ||||||||||
| 7. LINE OF CREDIT FACILITY
|
| Effective May 31, 2000, the Fund participates in a $350,000,000 committed, unsecured revolving line of credit facility. Prior
thereto, the Fund participated in a $250,000,000 uncommitted and a $250,000,000 committed, unsecured revolving line of credit facility. Under the most restrictive arrangement, the Fund must own securities having a market value in excess of 400% of the
total bank borrowings. These facilities is to be used solely for temporary or emergency purposes. The interest rate on borrowings is based on the Federal Funds rate. The committed facility also requires a fee to be paid by the Fund based on the amount of
the commitment which has not been utilized. During the period ended June 30, 2000, the Fund did not have any borrowings under these facilities.
|
| 8. CHANGE IN INDEPENDENT AUDITOR
|
| On October 26, 1999, the Board of Trustees of the Fund, upon the recommendation of the Board’s audit committee, determined
not to retain Arthur Andersen LLP and approved a change of the Fund’s independent auditors to Ernst & Young LLP. For the fiscal year ended December 31, 1999, Arthur Andersen LLP’s audit report contained no adverse opinion or disclaimer of
opinion; nor was their report qualified or modified as to uncertainty, audit scope, or accounting principles. Further, there were no disagreements between the Fund and Arthur Andersen LLP on accounting principles or practices, financial statement
disclosure or audit scope or procedure, which if not resolved to the satisfaction of Arthur Andersen LLP would have caused them to make reference to the disagreement in their reports.
|
| 9. SUMMARY OF SHARE TRANSACTIONS
|
| Share activity is as follows:
|
| For the Six Months ended June 30, 2000 (Unaudited) | For the Period Ended December 31, 1999(a) | ||||||||||||
|---|---|---|---|---|---|---|---|---|---|---|---|---|---|
| Shares | Dollars | Shares | Dollars | ||||||||||
| Class A Shares | |||||||||||||
| Shares sold | 34,577,249 | $ 666,948,799 | 30,877,360 | $ 446,765,899 | |||||||||
| Shares repurchased | (6,956,294 | ) | (128,737,268 | ) | (976,568 | ) | (15,181,934 | ) | |||||
| 27,620,955 | 538,211,531 | 29,900,792 | 431,583,965 | ||||||||||
| Class B Shares | |||||||||||||
| Shares sold | 27,955,964 | 534,036,438 | 28,306,620 | 410,588,840 | |||||||||
| Shares repurchased | (2,868,177 | ) | (53,070,857 | ) | (332,394 | ) | (5,542,861 | ) | |||||
| 25,087,787 | 480,965,581 | 27,974,226 | 405,045,979 | ||||||||||
| Class C Shares | |||||||||||||
| Shares sold | 16,566,802 | 316,928,667 | 17,453,014 | 255,619,532 | |||||||||
| Shares repurchased | (3,061,454 | ) | (56,320,869 | ) | (302,683 | ) | (4,835,240 | ) | |||||
| 13,505,348 | 260,607,798 | 17,150,331 | 250,784,292 | ||||||||||
| Institutional Shares | |||||||||||||
| Shares sold | 5,546,103 | 103,675,714 | 3,805,337 | 54,197,768 | |||||||||
| Shares repurchased | (1,009,630 | ) | (18,493,252 | ) | (259,271 | ) | (3,039,125 | ) | |||||
| 4,536,473 | 85,182,462 | 3,546,066 | 51,158,643 | ||||||||||
| Service Shares | |||||||||||||
| Shares sold | 12,045 | 223,367 | 2,764 | 29,491 | |||||||||
| Shares repurchased | (170 | ) | (3,206 | ) | — | — | |||||||
| 11,875 | 220,161 | 2,764 | 29,491 | ||||||||||
| NET INCREASE | 70,762,438 | $1,365,187,533 | 78,574,179 | $1,138,602,370 | |||||||||
(a)
|
Commencement of operations was October 1, 1999 for all classes.
|
| Income (loss) from
investment operations(a) |
|||||||||||||||
|---|---|---|---|---|---|---|---|---|---|---|---|---|---|---|---|
| Net asset
value, beginning of period |
Net
investment loss(e) |
Net realized
and unrealized gain (loss)(e) |
Net increase
(decrease) in net asset value |
Net asset
value, end of period |
|||||||||||
| FOR THE SIX MONTHS ENDED JUNE 30, (UNAUDITED) | |||||||||||||||
| 2000 - Class A Shares | $19.25 | $(0.10 | ) | $(0.64 | ) | $(0.74 | ) | $18.51 | |||||||
| 2000 - Class B Shares | 19.20 | (0.17 | ) | (0.63 | ) | (0.80 | ) | 18.40 | |||||||
| 2000 - Class C Shares | 19.19 | (0.17 | ) | (0.63 | ) | (0.80 | ) | 18.39 | |||||||
| 2000 - Institutional Shares | 19.25 | (0.07 | ) | (0.60 | ) | (0.67 | ) | 18.58 | |||||||
| 2000 - Service Shares | 19.23 | (0.11 | ) | (0.63 | ) | (0.74 | ) | 18.49 | |||||||
| FOR THE PERIOD ENDED DECEMBER 31, | |||||||||||||||
| 1999 - Class A Shares (Commenced October 1) | 10.00 | (0.05) | 9.30 | 9.25 | 19.25 | ||||||||||
| 1999 - Class B Shares (Commenced October 1) | 10.00 | (0.08) | 9.28 | 9.20 | 19.20 | ||||||||||
| 1999 - Class C Shares (Commenced October 1) | 10.00 | (0.08) | 9.27 | 9.19 | 19.19 | ||||||||||
| 1999 - Institutional Shares (Commenced October 1) | 10.00 | (0.03) | 9.28 | 9.25 | 19.25 | ||||||||||
| 1999 - Service Shares (Commenced October 1) | 10.00 | (0.05) | 9.28 | 9.23 | 19.23 | ||||||||||
(a)
|
Includes the balancing effect of calculating per share amounts.
|
(b)
|
Assumes investment at the net asset value at the beginning of the period, reinvestment of all dividends and distributions, a
complete redemption of the investment at the net asset value at the end of the period and no sales or redemption charges. Total return would be reduced if a sales or redemption charge were taken into account.
|
(c)
|
Annualized.
|
(d)
|
Not annualized.
|
(e)
|
Calculated based on the average shares outstanding methodology.
|
| Ratios assuming
no expense limitations |
|||||||||||||||||
|---|---|---|---|---|---|---|---|---|---|---|---|---|---|---|---|---|---|
| Total
return(b)(d) |
Net assets
at end of period (in 000s) |
Ratio of
net expenses to average net assets(c) |
Ratio of
net investment loss to average net assets(c) |
Ratio of
expenses to average net assets(c) |
Ratio of
net investment loss to average net assets(c) |
Portfolio
turnover rate(d) |
|||||||||||
| (3.84)% | $1,064,956 | 1.49 | % | (1.11) | % | 1.49 | % | (1.11) | % | 35.74 | % | ||||||
| (4.17) | 976,638 | 2.24 | (1.86) | 2.24 | (1.86) | 35.74 | |||||||||||
| (4.17) | 563,938 | 2.24 | (1.86) | 2.24 | (1.86) | 35.74 | |||||||||||
| (3.48) | 150,179 | 1.09 | (0.71) | 1.09 | (0.71) | 35.74 | |||||||||||
| (3.85) | 271 | 1.59 | (1.23) | 1.59 | (1.23) | 35.74 | |||||||||||
| 92.50 | 575,535 | 1.50 | (1.29) | 1.79 | (1.58) | 16.16 | |||||||||||
| 92.00 | 537,282 | 2.25 | (2.04) | 2.54 | (2.33) | 16.16 | |||||||||||
| 91.90 | 329,135 | 2.25 | (2.05) | 2.54 | (2.34) | 16.16 | |||||||||||
| 92.50 | 68,275 | 1.10 | (0.88) | 1.39 | (1.17) | 16.16 | |||||||||||
| 92.30 | 53 | 1.60 | (1.35) | 1.89 | (1.64) | 16.16 | |||||||||||
GOLDMAN SACHS FUND PROFILE
Goldman Sachs Internet Tollkeeper Fund
An Investment Idea for the Long Term
The Internet may be one of the most transforming events in global economic history. It is changing the way consumers and businesses communicate, transact commerce, and compete with each other — and will likely result in decades of wealth creation.
The Goldman Sachs Internet Tollkeeper Fund seeks to provide investors with a unique solution to investing in the Internet. The Fund invests in established growth companies that are strategically positioned to benefit long-term from the growth of the Internet by providing media/content, infrastructure/backbone, and services to Internet companies and Internet users.
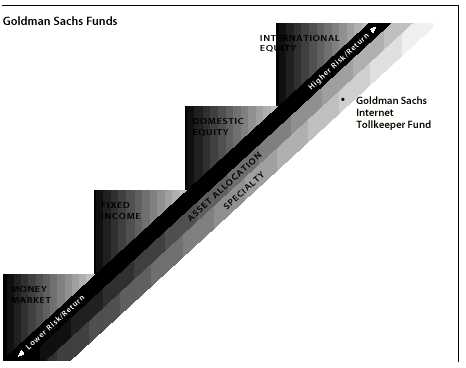
Target Your Needs
The Goldman Sachs Internet Tollkeeper Fund has a distinct investment objective and a defined place on the risk/return spectrum. As your investment objectives change, you can exchange shares within the Goldman Sachs Funds without an additional charge.* (Please note: in general, greater returns are associated with greater risk.)
For More Information
To learn more about the Goldman Sachs Internet Tollkeeper Fund and other Goldman Sachs Funds, please call your investment professional today.
*The exchange privilege is subject to termination and its terms are subject to change.
Goldman Sachs Internet Tollkeeper Fund is a service mark of Goldman, Sachs & Co.
![]()
| TRUSTEES | OFFICERS | |
| Ashok N. Bakhru, Chairman | Douglas C. Grip, President | |
| David B. Ford | Jesse H. Cole, Vice President | |
| Douglas C. Grip | James A. Fitzpatrick, Vice President | |
| John P. McNulty | Nancy L. Mucker, Vice President | |
| Mary P. McPherson | John M. Perlowski, Treasurer | |
| Alan A. Shuch | Peter Fortner, Assistant Treasurer | |
| William H. Springer | Philip V. Giuca, Jr., Assistant Treasurer | |
| Richard P. Strubel | Michael J. Richman, Secretary | |
| Howard B. Surloff, Secretary | ||
| Amy E. Belanger, Assistant Secretary | ||
| Valerie A. Zondorak, Assistant Secretary | ||
| GOLDMAN, SACHS & CO. | GOLDMAN SACHS ASSET MANAGEMENT | |
| Distributor and Transfer Agent | Investment Adviser | |
Visit our internet address: www.gs.com/funds
This material is not authorized for distribution to prospective investors unless preceded or accompanied by a current Prospectus. Investors should read the Prospectus carefully before investing or sending money.
Goldman, Sachs & Co. is the distributor of the Fund.
Goldman Sachs Internet Tollkeeper Fund is a service mark of Goldman, Sachs & Co.
Emerging markets securities are volatile. They are subject to substantial currency fluctuations and sudden economic and political developments. At times, the Fund may be unable to sell certain of its portfolio securities without a substantial drop in price, if at all.
The Fund is subject to greater risk of loss as a result of adverse economic business or other developments than if its investments were diversified across different industry sectors. Securities of issuers held by the Fund may lack sufficient market liquidity to enable the Fund to sell the securities at an advantageous time or without a substantial drop in price.
The Fund invests in “Internet Tollkeeper” companies, and its net asset value may fluctuate substantially over time. Because the Fund concentrates its investments in Internet Tollkeeper companies, the Fund’s performance may be substantially different from the returns of the broader stock market and of “pure” Internet funds. Past performance is not an indication of future returns and, depending on the timing of your investment, you may lose money even if the Fund’s past returns have been positive.
The Fund may participate in the Initial Public Offering (IPO) market, and a portion of the Fund’s returns consequently may be attributable to its investments in IPOs, which may have a magnified impact due to the Fund’s small asset base at start up. As the Fund’s assets grow, it is probable that the effect of the Fund’s investments in IPOs on its total returns may not be as significant.
| Copyright 2000 Goldman, Sachs & Co. All rights reserved. Date of first use: August 29, 2000 | 00-1156 / TOLLSAR / 230K / 8-00
|
|||
|
|