
|
|
|
|
|
|
|
|
|
|
Previous: GOLDMAN SACHS TRUST, N-30D, 2001-01-10 |
Next: CENEX HARVEST STATES COOPERATIVES, 10-Q, 2001-01-10 |

GOLDMAN SACHS TAXABLE INVESTMENT GRADE FUNDS
Market Overview
Dear Shareholder:
During the period under review, bond markets around the world posted relatively solid returns, especially compared to some sectors of the equity market.
Market Review
Throughout the period, the U.S. bond market was also affected by the Treasury Department’s repurchase of long maturity deb t. The reduction in supply is aimed at reducing the average maturity and interest cost of Treasury debt. This led to a sharp increase in demand for 30-year bonds, resulting in strong performance for longer maturity issues and an inverted yield curve .
Elsewhere, the Australian and New Zealand markets initially performed well, but as the period progressed, a steep decline in their respective currencies versus the U.S. dollar caused their spreads to widen.
Outlook
Given recent supportive data, we continue to believe that the U.S. is headed for a “soft landing” following a period of benign inflation. However, given strong consumer confidence, low unemployment, and continued pockets of solid economic growth, a soft landing is not assured. Conversely, in the short term, ongoing equity volatility coupled with recent negative earnings news could lead to continued credit spread widening and investor flight to the “safe haven” of U.S. Treasuries.
GOLDMAN SACHS TAXABLE INVESTMENT GRADE FUNDS
Our outlook in Europe is relatively positive. Signs continue to indicate that GDP growth has peaked and that growth is moderating. However, the risk of further tightening remains, given inflation levels above the ECB target and a weak currency. We are maintaining a neutral position in Japan, as we feel the market has an overly optimistic view of future growth rates.
As always, we appreciate your support and we look forward to serving your investment needs in the years to come.
Sincerely,
| David B. Ford | David W. Blood | Sharmin Mossavar-Rahmani |
| Co-Head, Goldman Sachs | Co-Head, Goldman Sachs | CIO, Fixed Income Investments, |
| Asset Management | Asset Management | Goldman Sachs Asset Management |
| November 9, 2000 |
1
FUND BASICS
Enhanced Income Fund
as of October 31, 2000

| PERFORMANCE REVIEW | ||||||||
| August 2, 2000– | Fund Total Return
|
30-Day
|
6-Month
|
1-Year
|
||||
| October 31, 2000 | (based on NAV)1
|
Standardized Yield2
|
U.S.Treasury3
|
U.S.Treasury
3
|
||||
| |
||||||||
| Class A | 1.66%
|
5.79%
|
1.57%
|
1.41%
|
||||
| Institutional | 1.76%
|
6.43%
|
1.57%
|
1.41%
|
||||
| Administration | 1.68%
|
N/A
|
1.57%
|
1.41%
|
||||
| |
||||||||
| 1
The net asset value represents the net assets of the Fund (ex-dividend) divided by the total number of net shares outstanding.
The Fund’s performance reflects the reinvestment of
dividends and other distributions.
2 The 30-Day Standardized Yield of the Fund is calculated by dividing the net investment income per share (as defined by securities industry regulations) earned by the Fund over a 30-day period (ending on the stated month-end date) by the maximum public offering price per share of the Fund on the last day of the period. This number is compounded semiannually and then annualized. This yield does not necessarily reflect income actually earned and distributed by the Fund and, therefore, may not be correlated with the dividends or other distributions paid to shareholders. 3 The 6-Month and 1-Year U.S. Treasury securities reported by Merrill Lynch do not reflect any fees or expenses. |
||||||||
| STANDARDIZED TOTAL RETURNS4 | |||||||
| For the period ending 9/30/00 | Class A | Institutional | Administration | ||||
| |
|||||||
| Since Inception | –0.39%
|
1.17%
|
1.12%
|
||||
| (8/2/00) | |||||||
| |
|||||||
| 4 The Standardized Total Returns are average annual returns or cumulative total returns (only if the performance period is one year or less) as of the most recent calendar quarter-end. They assume reinvestment of all distributions at net asset value. These returns reflect a maximum initial sales charge of 1.5% for Class A shares. Because Institutional and Administration shares do not involve sales charges, such charges have not been applied to their Standardized Total Returns. | |||||||
| PORTFOLIO COMPOSITION AS OF 10/31/005 | |||||||
| Sector Allocation | |||||||
| |
|||||||
| U.S. Treasuries | 39.3 | % | |||||
| Agency Debentures | 26.3 | % | |||||
| Asset-Backed Securities | 20.8 | % | |||||
| Corporate Bonds | 5.4 | % | |||||
| Cash Equivalents | 0.8 | % | |||||
| |
|||||||
| 5
Figures represent a percentage of net assets and may not sum to 100%. The Fund is actively
managed and, as such, its composition may differ over time.
Total return figures represent past performance and do not indicate future results, which will vary. The investment return and principal value of an investment will fluctuate and, therefore, an investor’s shares, when redeemed, may be worth more or less than their original cost. Performance reflects expense limitations in effect. In their absence, performance would be reduced. |
|||||||
2
PERFORMANCE OVERVIEW
Enhanced Income Fund
Dear Shareholder:
We are pleased to report on the performance of the Goldman Sachs Enhanced Income Fund from its inception through October 31, 2000.
 Performance Review
During the short period of time from the Fund’s inception on August 2, 2000 through October 31, 2000, the Fund’s A, Institutional and Administration share classes generated cumulative total returns, at net asset value, of 1.66%, 1.76% and 1.68%, respectively. These figures outperformed the Fund’s benchmarks, the 1-Year and Six-Month U.S. Treasury Bills, which returned 1.41% and 1.57%, respectively.
Investment Objective
The Fund seeks to generate returns in excess of traditional money market products while maintaining an emphasis on preservation of capital and liquidity. It’s important to note that the Fund is not a money market fund and its net asset value will fluctuate.
Portfolio Composition
The Goldman Sachs Enhanced Income Fund targets a duration of nine months, with diversified holdings in high credit quality (minimum “A’’) sectors including U.S. Treasuries, Agency, Corporate, Asset-Backed and Money Market Instruments. By the end of the reporting period the Fund had its largest weighting in U.S. Treasuries (39.3% of net assets), followed by Agency issues (26.3%), Asset-Backed Securities (20.8%), Corporates (5.4%) and Cash (0.38%).
As we move beyond the Fund’s initial start-up phase, we look to more broadly diversify its portfolio by increasing its exposure to Corporate securities.
Outlook
We are anticipating slower growth in the coming quarters, but we have doubts that this will prove sufficient for the Federal Reserve Board (the “Fed”) to deliver the easing that is already priced into the market. We now expect the Fed will keep policy on hold throughout 2001. Previously, we had expected a modest tightening during the first half of the year. However, this was predicated on the view that the economy would expand rapidly enough to intensify the pressures in the labor market, reviving concerns about inflation. Although we continue to expect a modest increase in core inflation, we believe Fed officials will probably look pas t this if tensions in the labor market appear to be ebbing at the same time, which now seems likely.
We thank you for your investment and look forward to your continued confidence.
Goldman Sachs U.S. Fixed Income Investment Management Team
November 9, 2000
3
FUND BASICS
Adjustable Rate Government Fund
as of October 31, 2000

| PERFORMANCE REVIEW | ||||||||
| October 31, 1999– | Fund Total Return
|
30-Day
|
6-Month
|
1-Year
|
||||
| October 31, 2000 | (based on NAV)1
|
Standardized Yield2
|
U.S.Treasury3
|
U.S.Treasury3
|
||||
| |
||||||||
| Class A | 5.12% | 6.01% | 6.06%
|
5.57% | ||||
| Institutional | 5.65% | 6.50% | 6.06%
|
5.57% | ||||
| Service | 4.95% | 6.01% | 6.06%
|
5.57% | ||||
| |
||||||||
| 1
The net asset value represents the net assets of the Fund (ex-dividend) divided by the total number of net shares outstanding. The Fund’s performance reflects the
reinvestment of dividends and other distributions.
2 The 30-Day Standardized Yield of the Fund is calculated by dividing the net investment income per share (as defined by securities industry regulations) earned by the Fund over a 30-day period (ending on the stated month-end date) by the maximum public offering price per share of the Fund on the last day of the period. This number is compounded semiannually and then annualized. This yield does not necessarily reflect income actually earned and distributed by the Fund and, therefore, may not be correlated with the dividends or other distributions paid to shareholders. 3 The 6-Month and 1-Year U.S. Treasury securities reported by Merrill Lynch do not reflect any fees or expenses. |
||||||||
| STANDARDIZED TOTAL RETURNS4 | ||||||
| For the period ending 9/30/00 | Class A | Institutional | Service | |||
| |
||||||
| One Year | 3.41%
|
5.55%
|
4.85%
|
|||
| Five Years | 4.97%
|
5.69%
|
N/A
|
|||
| Since Inception | 5.04%
|
5.33%
|
4.69%
|
|||
| (5/15/95)
|
(7/17/91)
|
(3/27/97)
|
||||
| |
||||||
| 4 The Standardized Total Returns are average annual returns as of the most recent calendar quarter-end. They assume reinvestment of all distributions at net asset value. These returns reflect a maximum initial sales charge of 1.5% for Class A shares. Because Institutional and Service shares do not involve sales charges, such charges have not been applied to their Standardized Total Returns. | ||||||
| PORTFOLIO COMPOSITION AS OF 10/31/005 | ||||||
| Sector Allocation | ||||||
| |
||||||
| Adjustable Rate Mortgage Securities | 78.6
|
% | ||||
| Cash Equivalents | 8.5 | % | ||||
| Fixed Rate Pass-Throughs | 7.2
|
% | ||||
| Collateralized Mortgage Obligations | 4.9 | % | ||||
| |
||||||
| 5
Figures represent a percentage of net assets and may not sum to 100%. The Fund is actively managed
and, as such, its composition may differ over time.
Total return figures represent past performance and do not indicate future results, which will vary. The investment return and principal value of an investment will fluctuate and, therefore, an investor’s shares, when redeemed, may be worth more or less than their original cost. Performance reflects expense limitations in effect. In their absence, performance would be reduced. |
||||||
4
PERFOR MANCE OVERVIEW
Adjustable Rate Government Fund
Dear Shareholder,
We are pleased to report on the performance of the Goldman Sachs Adjustable Rate Government Fund for the one-year period that ended October 31, 2000.
Performance Review
Over the one-year reporting period that ended October 31, 2000, the Fund’s A, Institutional and Service share classes generated cumulative total returns, at net asset value, of 5.12%, 5.65% and 4.95%, respectively. These returns generally underperformed the Fund’s benchmarks, the six-month U.S. Treasury security and the one-year U.S. Treasury security, which returned 6.06% and 5.57%, respectively.
Investment Objective
The Fund seeks a high level of current income consistent with low volatility of principal, primarily through investments in securities issued by the U.S. government, its agencies, instrumentalities or sponsored enterprises that are adjustable rate mortgage pass-through securities and other mortgage securities with periodic interest rate resets.
Portfolio Composition
We maintained our strategy of focusing on sectors and securities that we believe will generate a competitive total rate of return relative to the benchmark, while de-emphasizing directional duration management.
Portfolio Highlights
5
PERFORMANCE OVERVIEW
Portfolio Outlook
Despite holding interest rates steady in recent months, the Fed continues to warn investors that the tight labor market and rising energy costs could lead to future rate hikes. We expect the Fed to keep its current policy stance unchanged for the balance of the year.
We thank you for your investment and look forward to your continued confidence.
Goldman Sachs U.S. Fixed Income Investment Management Team
November 9, 2000
6
FUND BASICS
Short Duration Government Fund
as of October 31, 2000

| PERFORMANCE REVIEW | |||||||
| October 31, 1999– | Fund Total Return
|
30-Day
|
2-Year U.S.
|
||||
| October 31, 2000 | (based on NAV)1
|
Standardized Yield2
|
Treasury Security3
|
||||
| |
|||||||
| Class A | 5.65%
|
6.13%
|
5.44%
|
||||
| Class B | 4.80%
|
5.66%
|
5.44%
|
||||
| Class C | 4.76%
|
5.50%
|
5.44%
|
||||
| Institutional | 5.85%
|
6.67%
|
5.44%
|
||||
| Service | 5.32%
|
6.16%
|
5.44%
|
||||
| |
|||||||
| 1
The net asset value represents the net assets of the Fund (ex-dividend)
divided by the total number of net shares outstanding
. The Fund’s performance reflects the reinvestment of dividends and other distributions.
2 The 30-Day Standardized Yield of the Fund is calculated by dividing the net investment income per share (as defined by securities industry regulations) earned by the Fund over a 30-day period (ending on the stated month-end date) by the maximum public offering price per share of the Fund on the last day of the period. This number is compounded semiannually and then annualized. This yield does not necessarily reflect income actually earned and distributed by the Fund and, therefore, may not be correlated with the dividends or other distributions paid to shareholders. 3 The 2-Year U.S. Treasury security does not reflect any fees or expenses. |
|||||||
| STANDARDIZED TOTAL RETURNS4 | ||||||||||
| For the period ending 9/30/00 | Class A | Class B | Class C | Institutional | Service | |||||
| |
||||||||||
| One Year | 3.07%
|
2.40%
|
3.40%
|
5.53%
|
5.00%
|
|||||
| Five Years | N/A
|
N/A
|
N/A
|
5.84%
|
N/A
|
|||||
| Ten Years | N/A
|
N/A
|
N/A
|
6.16%
|
N/A
|
|||||
| Since Inception | 4.51%
|
4.50%
|
3.94%
|
6.67%
|
5.32%
|
|||||
| (5/1/97)
|
(5/1/97)
|
(8/15/97)
|
(8/15/88)
|
(4/10/96)
|
||||||
| |
||||||||||
| 4 The Standardized Total Returns are average annual returns as of the most recent calendar quarter-end. They assume reinvestment of all distributions at net asset value. These returns reflect a maximum initial sales charge of 2% for Class A shares, the assumed deferred sales charge for Class B shares (2% maximum declining to 0% after three years) and the assumed deferred sales charge for Class C shares (1% if redeemed within 12 months of purchase) . Because Institutional and Service shares do not involve sales charges, such charges have not been applied to their Standardized Total Returns. | ||||||||||
| PORTFOLIO COMPOSITION AS OF 10/31/005 | ||||||||||
| Sector Allocation | ||||||||||
| |
||||||||||
| Collateralized Mortgage Obligations | 42.7 | % | ||||||||
| Fixed Rate Pass-Throughs | 25.7 | % | ||||||||
| Adjustable Rate Mortgage Securities | 20.5 | % | ||||||||
| Agency Debentures | 6.7 | % | ||||||||
| U.S. Treasuries | 4.7 | % | ||||||||
| Cash Equivalents | 2.7 | % | ||||||||
| |
||||||||||
| 5
Figures represent a percentage of net assets and may not sum to 100%. The Fund is actively managed and, as such, its composition may differ over time.
Total return figures represent past performance and do not indicate future results, which will vary. The investment return and principal value of an investment will fluctuate and, therefore, an investor’s shares, when redeemed, may be worth more or less than their original cost. Performance reflects fee waivers and expense limitations in effect. In their absence, performance would be reduced. |
||||||||||
7
PERFORMANCE OVERVIEW
Short Duration Government Fund
Dear Shareholder,
We are pleased to report on the performance of the Goldman Sachs Short Duration Government Fund for the one-year period that ended October 31, 2000.
Performance Review
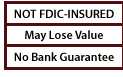
Over the one-year reporting period that ended October 31, 2000, the Fund’s A, B, C, Institutional and Service share classes generated total cumulative returns, at net asset value, of 5.65%, 4.80%, 4.76%, 5.85% and 5.32%, respectively. Over the same time period, the Fund’s benchmark, the two-year U.S. Treasury security, generated a 5. 44% cumulative total return.
Investment Objective
The Fund seeks a high level of current income and, secondarily, in seeking current income, may also consider the potential for capital appreciation, primarily through investing in U.S. government securities and repurchase agreements collateralized by such securities.
Portfolio Composition
During the one-year period, we maintained our strategy of focusing on sectors and securities that we believe will generate a competitive total rate of return relative to the benchmark, while de-emphasizing directional duration management.
Portfolio Highlights
8
PERFORMANCE OVERVIEW
Portfolio Outlook
Despite holding interest rates steady in recent months, the Fed continues to warn investors that the tight labor market and rising energy costs could lead to future rate hikes. We expect the Fed to keep its current policy stance unchanged for the balance of the year.
We thank you for your investment and look forward to your continued confidence.
Goldman Sachs U.S. Fixed Income Investment Management Team
November 9, 2000
9
FUND BASICS
Government Income Fund
as of October 31, 2000

| PERFORMANCE REVIEW | |||||||
| October 31, 1999– | Fund Total Return | 30-Day
|
Lehman Govt./ | ||||
| October 31, 2000 | (based on NAV)1 | Standardized Yield2
|
Mortgage Index3 | ||||
| |
|||||||
| Class A | 7.33%
|
6.84%
|
7.84%
|
||||
| Class B | 6.45%
|
6.40%
|
7.84%
|
||||
| Class C | 6.46%
|
6.40%
|
7.84%
|
||||
| Institutional | 7.68%
|
7.57%
|
7.84%
|
||||
| Service | 7.62%
|
7.06%
|
7.84%
|
||||
| |
|||||||
1
The net asset value represents the net assets of the Fund (ex-dividend)
divided by the total
number of net shares
outstanding. The Fund’s performance reflects the reinvestment of dividends and other
distributions.
2
The 30-Day Standardized Yield of the Fund
is calculated by dividing the net investment income per share (as defined by securities industry regulations) earned by the Fund over a 30-day period (ending on the stated month-end date) by the maximum public offering price per share of the Fund on the last day of the period. This number is compounded semiannually and then annualized. This
yield does not necessarily reflect income actually earned and
distributed by the Fund and, therefore, may not be correlated with the dividends or other
distributions paid to shareholders.
3
The Lehman Brothers Government/Mortgage Index does not reflect any fees or expenses. Investors cannot invest directly in the Index.
| STANDARDIZED TOTAL RETURNS4 | |||||||||||||
| For the period ending 9/30/00 | Class A | Class B | Class C | Institutional | Service | ||||||||
| |
|||||||||||||
| One Year | 1.97%
|
0.73%
|
4.94%
|
7.13%
|
7.07%
|
||||||||
| Five Years | 5.12%
|
N/A
|
N/A
|
N/A
|
5.97%
|
||||||||
| Since Inception | 5.70%
|
5.22%
|
4.85%
|
5.97%
|
6.26%
|
||||||||
| (2
/10/93) |
(5/1/96)
|
(8/15/97)
|
(8/15/97)
|
(2/10/93)5
|
|||||||||
4
The Standardized Total Returns are average annual returns as of the most recent calendar quarter-end. They assume reinvestment of all distributions at net asset value. These returns reflect a maximum initial sales
charge of 4.5% for Class A shares, the assumed deferred sales charge for Class B shares (5% maximum declining to 0% after six years), and the assumed deferred sales charge for Class C shares (1% if redeemed within 12 months of purchase). Because
Institutional and Service shares do not involve sales charges, such charges have not been applied to their Standardized Total Returns.
5
Performance data for Service shares prior to 8/15/97 (commencement of operations) is that of Class A shares (excluding the impact of front-end sales charges applicable to Class A shares since Service shares are not
subject to any sales charges). Performance of Class A shares in the Fund reflects the expenses applicable to the Fund's Class A shares. The fees applicable to Service shares are different from those applicable to Class A shares which impact performance
ratings and rankings for a class of shares.
| PORTFOLIO COMPOSITION AS OF 10/31/006 | |||||
| Sector Allocation | |||||
| |
|||||
| Mortgage-Backed Securities | 60.5 | % | |||
| Cash Equivalents | 16.1 | % | |||
| Agency Debentures | 15.2 | % | |||
| Asset-Backed Securities | 12.2 | % | |||
| U.S. Treasuries | 10.9 | % | |||
| Municipal Bonds | 1.6 | % | |||
| |
|||||
6
Figures represent a percentage of net assets and may
not sum to 100% . The Fund is actively managed and, as such, its composition may differ over time.
Total return figures represent past performance and do not indicate future results, which will vary. The
investment return and principal value of an investment will fluctuate and, therefore, an investor’s shares, when redeemed, may be worth more or less than their original cost. Performance reflects fee waivers and expense limitations in effect. In their absence, performance would be reduced.
10
PERFORMANCE OVERVIEW
Government Income Fund
Dear Shareholder,
We are pleased to report on the performance of the Goldman Sachs Government Income Fund for the one-year period that ended October 31, 2000.
Performance Review
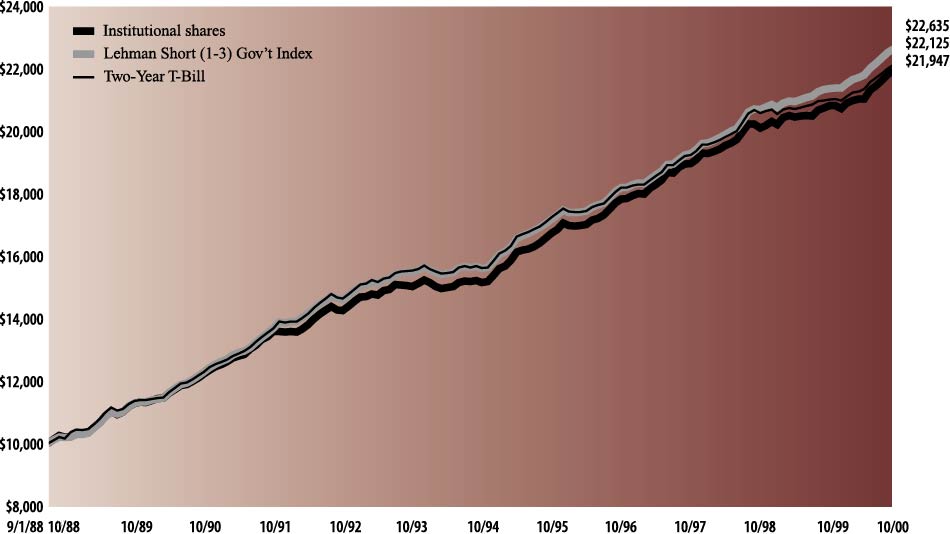
Over the one-year reporting period that ended October 31, 2000, the Fund’s A, B, C, Institutional and Service share classes generated cumulative total returns, at net asset value, of 7.33%, 6.45%, 6.46%, 7.68% and 7.62%, respectively. Over the same time period, the Fund’s benchmark, the Lehman Brothers Government/Mortgage Index, generated a 7.84% cumulative total return.
Investment Objective
The Fund seeks a high level of current income consistent with safety of principal, primarily through investing in U.S. government securities and repurchase agreements collateralized by such securities.
Portfolio Composition
During the one-year period, we maintained our strategy of focusing on sectors and securities that we believe will generate a competitive total rate of return relative to the benchmark, while de-emphasizing directional duration management.
Portfolio Highlights
11
PERFORMANCE OVERVIEW
Portfolio Outlook
Despite holding interest rates steady in recent months, the Fed continues to warn investors that the tight labor market and rising energy costs could lead to future rate hikes. We expect the Fed to keep its current policy stance unchanged for the balance of the year.
We thank you for your investment and look forward to your continued confidence.
Goldman Sachs U.S. Fixed Income Investment Management Team
November 9, 2000
12
FUND BASICS
Core Fixed Income Fund
as of October 31, 2000

| PERFORMANCE REVIEW | |||||||
| October 31, 1999– | Fund Total Return
|
30-Day
|
Lehman Aggregate
|
||||
| October 31, 2000 | (based on NAV)1
|
Standardized Yield2
|
Bond Index3
|
||||
| |
|||||||
| Class A | 6.48%
|
5.80%
|
7.30%
|
||||
| Class B | 5.69%
|
5.35%
|
7.30%
|
||||
| Class C | 5.80%
|
5.35%
|
7.30%
|
||||
| Institutional | 6.90%
|
6.52%
|
7.30%
|
||||
| Service | 6.37%
|
6.01%
|
7.30%
|
||||
| |
|||||||
| 1
The net asset value represents the net assets of the Fund (ex-dividend) divided by the total number of net shares outstanding. The Fund’s
performance reflects the reinvestment of dividends and other
distributions.
|
|||||||
| 2
The 30-Day Standardized Yield of the Fund is calculated by dividing the net investment
income per share (as defined by securities industry regulations)
earned by the Fund over a 30-day period (ending on the
stated month-end date) by the maximum public offering price per share of the Fund on the last day of the
period. This number is compounded semiannually and then annualized. This yield does not necessarily reflect income actually earned and distributed by the
Fund and, therefore, may not be correlated with the dividends or other distributions paid to shareholders.
|
|||||||
| 3 The Lehman Aggregate Bond Index does not reflect any fees or expenses. Investors cannot invest directly in the Index. | |||||||
| STANDARDIZED TOTAL RETURNS4 | ||||||||||
| For the period ending 9/30/00 | Class A | Class B | Class C | Institutional | Service | |||||
| |
||||||||||
| One Year | 1.60%
|
0.24%
|
4.55%
|
6.70%
|
6.18%
|
|||||
| Five Years | N/A
|
N/A
|
N/A
|
6.29%
|
N/A
|
|||||
| Since Inception | 4.68%
|
4.39%
|
4.61%
|
6.23%
|
5.90%
|
|||||
| (5/1/97)
|
(5/1/97)
|
(8/15/97)
|
(1/5/94)
|
(3/13/96)
|
||||||
| |
||||||||||
| 4 The Standardized Total Returns are average annual returns as of the most recent calendar quarter-end. They assume reinvestment of all distributions at net asset value. These returns reflect a maximum initial sales charge of 4.5% for Class A shares, the assumed deferred sales charge for Class B shares (5% maximum declining to 0% after six years) and the assumed deferred sales charge for Class C shares (1% if redeemed within 12 months of purchase). Because Institutional and Service shares do not involve sales charges, such charges have not been applied to their Standardized Total Returns. | ||||||||||
| PORTFOLIO COMPOSITION AS OF 10/31/005 | ||||||||||
| Sector Allocation | ||||||||||
| |
||||||||||
| Mortgage-Backed Securities | 41.4%
|
U.S. Treasuries | 3.7% | |||||||
| Corporate Bonds | 33.6%
|
Agency Debentures | 2.2% | |||||||
| Asset-Backed Securities | 10.7%
|
Cash Equivalents | 1.4% | |||||||
| Emerging Market Debt | 7.3%
|
Sovereign Credit | 1.1% | |||||||
| |
||||||||||
| 5
Figures represent a percentage of net assets and may not sum to 100%. The Fund is actively managed and, as such, its composition may
differ over time.
Total return figures represent past performance and do not indicate future results, which will vary. The investment return and principal value of an investment will fluctuate and, therefore, an investor’s shares, when redeemed, may be worth more or less than their original cost. Performance reflects expense limitations in effect. In their absence, performance would be reduced. |
||||||||||
13
PERFORMANCE OVERVIEW
Core Fixed Income Fund
Dear Shareholder,
We are pleased to report on the performance of the Goldman Sachs Core Fixed Income Fund for the one-year period that ended October 31, 2000.
Performance Review
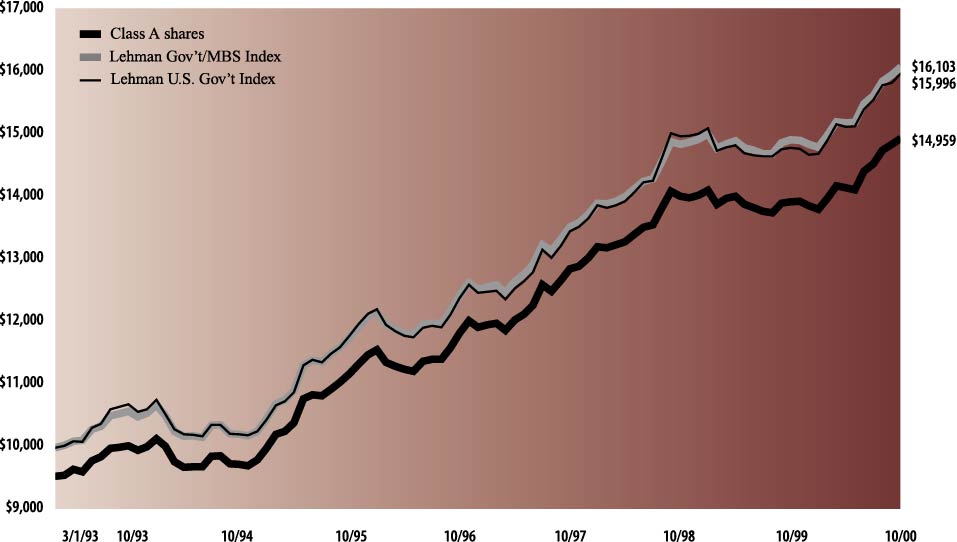
Over the one-year reporting period that ended October 31, 2000, the Fund’s A, B, C, Institutional and Service share classes generated cumulative total returns, at net asset value, of 6.48%, 5 .69%, 5.80%, 6.90% and 6. 37% respectively. Over the same time period, the Fund’s benchmark, the Lehman Brothers Aggregate Bond Index, generated a cumulative return of 7.30%.
Investment Objective
The Fund seeks total return consisting of capital appreciation and income that exceeds that of the Lehman Brothers Aggregate Bond Index, primarily through fixed income securities, including securities issued or guaranteed by the U.S. government, its agencies, instrumentalities or sponsored enterprises, corporate debt securities, mortgage-backed securities and asset-backed securities.
Portfolio Composition
During the one-year period, we maintained our strategy of focusing on sectors and securities that we believe will generate a competitive total rate of return relative to the benchmark, while de-emphasizing directional duration management. As such, during the period under review, we underweighted Treasury and agency securities relative to the benchmark, and overweighted corporate, mortgage- and asset-backed and emerging market debt securities.
14
PERFORMANCE OVERVIEW
Portfolio Highlights
Portfolio Outlook
Despite holding interest rates steady in recent months, the Fed continues to warn investors that the tight labor market and rising energy costs could lead to future rate hikes. We expect the Fed to keep its current policy stance unchanged for the balance of the year.
We thank you for your investment and look forward to your continued confidence.
Goldman Sachs U.S. Fixed Income Investment Management Team
November 9, 2000
15
FUND BASICS
Global Income Fund
as of October 31, 2000

| PERFORMANCE REVIEW | |||||||
| October 31, 1999– | Fund Total Return | 30-Day | JPM Global Govt. | ||||
| October 31, 2000 | (based on NAV)1 | Standardized Yield2 | Bond Index3 | ||||
| |
|||||||
| Class A | 5.58%
|
3.61%
|
7.80%
|
||||
| Class B | 5.14%
|
3.28%
|
7.80%
|
||||
| Class C | 5.13%
|
3.28%
|
7.80%
|
||||
| Institutional | 6.27%
|
4.43%
|
7.80%
|
||||
| Service | 5.76%
|
3.93%
|
7.80%
|
||||
| |
|||||||
| 1
The net asset value represents the net assets of the Fund (ex-dividend) divided by the total number of net shares
outstanding. The Fund’s performance reflects the reinvestment of dividends
and other distributions.
|
|||||||
| 2
The 30-Day Standardized Yield of the Fund is calculated by dividing
the net investment income per share (as defined by securities industry regulations) earned by the Fund over a 30-day
period (ending on the
stated month-end date) by the maximum public offering price
per share of the Fund on
the last day of the period. This number is compounded semiannually and then
annualized. This yield does not necessarily reflect income actually earned and distributed by the Fund and, therefore, may not
be correlated with the dividends or other distributions paid to shareholders.
|
|||||||
| 3 The composition and characteristics of the securities in the JP Morgan (JPM) Global Government Bond Index (hedged) are not identical to those of the Fund. Also, unlike the Fund’s return, the Index’s return does not reflect any fees or expenses. Investors cannot invest directly in the Index. | |||||||
| STANDARDIZED TOTAL RETURNS4 | ||||||||||||
| For the period ending 9/30/00 | Class A | Class B | Class C | Institutional | Service | |||||||
| |
||||||||||||
| One Year | 0.28%
|
–0.72%
|
3.40%
|
5.65%
|
5.13%
|
|||||||
| Five Years | 6.43%
|
N/A
|
N/A
|
8.03%
|
7.48%
|
|||||||
| Since Inception | 6.70%
|
5.96%
|
5.19%
|
8.30%
|
7.28%
|
|||||||
| (8/2/91)
|
(5/1/96)
|
(8/15/97)
|
(8/1/95)
|
(8/2/91)5
|
||||||||
| |
||||||||||||
| 4
The Standardized Total Returns are average annual returns as of the most recent calendar quarter-end. They assume reinvestment of all distributions at net asset value. These returns reflect a maximum initial sales charge of 4.5% for Class A shares, the assumed deferred sales charge for Class B shares
(5% maximum declining to 0% after six years), and the assumed deferred sales charge for Class C shares
(1% if redeemed within 12 months of purchase). Because Institutional and Service shares do not involve sales charges, such charges have not been applied
to their Standardized Total Returns.
|
||||||||||||
| 5 Performance data for Service shares prior to 3/12/97 (commencement of operations) is that of Class A shares (excluding the impact of front-end sales charges applicable to Class A shares since Service shares are not subject to any sales charges). Performance of Class A shares in the Fund reflects the expenses applicable to the Fund’s Class A shares. The fees applicable to Service shares are differ ent from those applicable to Class A shares which impact performance ratings and rankings for a class of shares. | ||||||||||||
| TOP POSITIONS AS OF 10/31/006 | |||||||
| Bonds Denomination | Bonds Denomination
|
||||||
| |
|||||||
| 1. U.S. Dollar | 33.8%
|
6. New Zealand Dollar
|
2.0%
|
||||
| 2. Euro | 25.8%
|
7. Greek Drachma
|
1.9%
|
||||
| 3. Japanese Yen | 18.7%
|
8. Danish Krone
|
1.8%
|
||||
| 4. British Pound | 6.4%
|
9. German Mark
|
1.3%
|
||||
| 5. Canadian Dollar | 2.2%
|
10. Swedish Krone
|
1.1%
|
||||
| |
|||||||
| 6
Figures represent a percentage of net assets and may not sum to 100%. The Fund is actively manage
d and, as such, its composition may differ over time.
Total return figures represent past performance and do not indicate future results, which will vary. The investment return and principal value of an investment will fluctuate and, therefore, an investor’s shares, when redeemed, may be worth more or less than their original cost. Performance reflects fee waivers and expense limitations in effect. In their absence performance would be reduced. |
|||||||
16
PERFORMANCE OVERVIEW
Global Income Fund
Dear Shareholder,
We are pleased to report on the performance of the Goldman Sachs Global Income Fund for the one-year period that ended October 31, 2000.
Performance Review
Over the one-year reporting period that ended October 31, 2000, the Fund’s A, B, C, Institutional and Service share classes generated cumulative total returns, at net asset value, of 5.58%, 5.14%, 5.13%, 6.27%, and 5.76%, respectively. Over the same time period, the Fund’s benchmark, the JP Morgan Global Government Bond Index (hedged into U.S. dollars), generated a 7.80% cumulative total return.
The Fund’s underperformance versus its benchmark is attributable to several factors. In recent months, the exposure to credit in the portfolio had an offsetting negative impact, due to a widening of swap spreads in the U.S. Currency management also retracted from overall performance, caused mainly by the fall in the Australian dollar. However, duration and yield curve positioning were positive contributors to performance over the period.
Investment Objective
The Fund seeks high total return, emphasizing current income and, to a lesser extent, providing opportunities for capital appreciation primarily through investments in fixed income securities of U.S. and foreign issuers and through transactions in foreign currencies.
Portfolio Positioning
The Fund began the reporting period with an overweight exposure in the U.S., as a slowing of economic growth was anticipated. However, we scaled back to a neutral and then an underweighted position, based on the continued robust economic expansion. As the period progressed we removed our underweight position in the U.S., as the weak equity markets dragged bond yields lower. As signs of slower growth began to appear later in the second quarter, w e introduced a long position in the middle portion of the U .S. curve. Then, at the beginning of the third quarter, we unwound our long duration position.
Overseas, during the first quarter of 2000, a position in the 2-3 year area of the UK yield curve was introduced. This was based on the belief that UK economy had entered the advanced stages of its economic upturn, and that aggressive tightening by the Monetary Policy Committee would start to have an effect on the manufacturing and retail sectors. During the summer we removed the small overweight position we had established in the UK, and increased the size of our overweight position in core Euro markets. Towards the end of the period we established an overweight position in Japan, due to weakening trends in the economic outlook for the country.
In currencies, at the start of the period, we had an underweight exposure to the dollar bloc, were neutral European currencies, and were overweight the Asian bloc. During the initial months of the period we decreased exposure within Europe, and in the first quarter of 2000 we opened a long exposure to the dollar bloc, reducing our short exposure in Europe. Over the second quarter of 2000 we increased our long exposure to the dollar bloc, reduced the short
17
PERFORMANCE OVERVIEW
exposure to Europe, and pared our long exposure to Asia. During the third quarter of 2000, we opened a short exposure to the dollar bloc, opened a long exposure in Europe and initiated a short exposure to Asia.
Portfolio Outlook
Given that global growth is slowing and inflation appears benign, we believe that interest rates may have peaked. In addition, current economic conditions and recent stock market fluctuations provide a positive backdrop for the global bond markets.
We continue to believe that the U.S. is headed for a “soft landing” with a period of benign inflation. Rising equity market volatility has also led investors to the “safe haven” of U.S. Treasuries, and, as a result, yields have reached their lowest level of the year. Although the U.S. bond markets have been the strongest performing of major bond markets this year, we believe that yields have already discounted the slowing growth scenario in the U.S.
The outlook in Europe is similarly positive. Signs continue to indicate that GDP growth has peaked and growth is moderating. The economic slowdown, however, is passing into Europe with a predictable lag. Overall, we continue to have a preference for the European bond markets relative to the U.S., as we believe the softer economic outlook is not fully reflecte d in the European yield curves.
In Japan, we are maintaining our long bond position, based on the market’s overly optimistic growth outlook for Japan. Despite signs of a modest corporate recovery in Japan, consumer demand remains weak. As such, we expect yields to continue to trade in a narrow range until the deflationary trend eases.
Overall, we continue to prefer higher quality, shorter-dated corporates, and are looking to eliminate any lower quality names that we view as vulnerable to negative event risk. Our sectoral bias at the moment is towards banks and utilities, as we continue to view these as defensive plays in the recent volatile environment. We have yet to reduce our U.S . corporate exposure, believing that there is room for these spreads to contract further from their current levels, as they still appear cheap on a relative basis to sterling and European corporates. We believe that the catalyst for this will be a reduction in volatility following the end of the earnings’ season. Nevertheless, security selection remains critical, as it has become increasingly important to avoid rapidly deteriorating credit stories in today’s challenging environment.
In currencies, we are currently overweight with respect to the U.S. dollar, supported by a positive asset market outlook and mergers and acquisition flows. We are underweight with respect to the yen, as we believe the market is continuing to overemphasize growth expectations in Japan, with spending remaining weak. We are currently neutral towards the euro against the U.S. dollar, despite intervention and the slowdown in the U.S., as economic fundamentals still point to a slowdown in Euroland.
We thank you for your investment and look forward to your continued confidence.
Goldman Sachs Global Fixed Income Investment Management Team
November 9, 2000
18
GOLDMAN SACHS TAXABLE INVESTMENT GRADE FUNDS
The Goldman Sachs Advantage
Founded in 1869, Goldman, Sachs & Co. is a premier financial services firm traditionally known on Wall Street and around the world for its institutional expertise.
Today, the firm’s Investment Management Division provides individual investors the opportunity to tap the resources of a global institutional powerhouse — and put this expertise to work in their individual portfolios.
What Sets Goldman Sachs Funds Apart?

To learn more about the Goldman Sachs Funds, call your investment professional today.
19
| Principal
Amount |
Interest
Rate |
Maturity
Date |
Value | |||||
|---|---|---|---|---|---|---|---|---|
| Agency Debentures – 26.3% | ||||||||
| Federal Home Loan Banks | ||||||||
| $ 5,000,000 | 5.13 | % | 04/17/2001 | $ 4,965,255 | ||||
| 2,000,000 | 5.62 | 04/12/2002 | 1,969,280 | |||||
| 3,000,000 | 6.75 | 08/15/2002 | 3,014,055 | |||||
| 3,570,000 | 5.35 | 12/15/2003 | 3,448,399 | |||||
| 3,000,000 | 5.63 | 02/26/2004 | 2,910,804 | |||||
| $ 16,307,793 | ||||||||
| Federal Home Loan Mortgage Corp. | ||||||||
| $ 2,500,000 | 5.87 | % | 02/04/2002 | $ 2,478,125 | ||||
| 1,500,000 | 6.00 | 04/14/2004 | 1,466,334 | |||||
| $ 3,944,459 | ||||||||
| Federal National Mortgage Association | ||||||||
| $ 4,000,000 | 5.38 | % | 04/26/2001 | $ 3,971,240 | ||||
| 2,500,000 | 5.84 | 06/12/2001 | 2,490,250 | |||||
| 1,000,000 | 5.21 | 12/10/2001 | 984,220 | |||||
| 2,000,000 | 6.50 | 07/29/2002 | 1,989,972 | |||||
| 3,000,000 | 5.50 | 01/26/2004 | 2,899,230 | |||||
| 4,750,000 | 5.96 | 02/23/2004 | 4,634,955 | |||||
| 3,000,000 | 5.81 | 03/02/2004 | 2,929,170 | |||||
| 2,000,000 | 6.00 | 03/08/2004 | 1,967,600 | |||||
| 2,400,000 | 5.74 | 05/06/2004 | 2,334,624 | |||||
| $ 24,201,261 | ||||||||
| TOTAL AGENCY DEBENTURES | ||||||||
| (Cost $44,298,886) | $ 44,453,513 | |||||||
| Asset-Backed Securities – 20.8% | ||||||||
| Auto – 14.8% | ||||||||
| Associates Automobile Receivables Trust Series 2000-2,
Class A3 |
||||||||
| $ 3,000,000 | 6.82 | % | 02/15/2005 | $ 3,007,500 | ||||
| Carco Auto Loan Master Trust | ||||||||
| 3,000,000 | 5.78 | 03/15/2004 | 2,959,470 | |||||
| Daimlerchrysler Auto Trust Series 2000-D, Class A2 | ||||||||
| 5,000,000 | 6.70 | 06/08/2003 | 4,999,960 | |||||
| Ford Credit Auto Owner Trust Series 2000-C, Class A4 | ||||||||
| 5,000,000 | 7.24 | 02/15/2004 | 5,024,650 | |||||
| Ford Credit Auto Owner Trust Series 2000-E, Class A4 | ||||||||
| 5,000,000 | 6.74 | 06/15/2004 | 5,011,034 | |||||
| Household Automotive Trust | ||||||||
| 1,500,000 | 7.05 | 02/17/2005 | 1,512,404 | |||||
| WFS Financial Owner Trust Series 2000-A, Class A3 | ||||||||
| 2,000,000 | 7.22 | 09/20/2004 | 2,015,908 | |||||
| WFS Financial Owner Trust Series 2000-C, Class A2 | ||||||||
| 500,000 | 7.01 | 08/20/2003 | 500,607 | |||||
| 25,031,533 | ||||||||
| Credit Card – 6.0% | ||||||||
| Advanta Credit Card Master Trust Series 1996-D, Class A | ||||||||
| $ 1,150,000 | 6.77 | % | 06/15/2005 | $ 1,152,174 | ||||
| Chemical Master Credit Card Trust I Series 1995-4, Class A | ||||||||
| 1,000,000 | 6.88 | 07/25/2005 | 1,001,960 | |||||
| Principal
Amount |
Interest
Rate |
Maturity
Date |
Value | |||||
|---|---|---|---|---|---|---|---|---|
| Asset-Backed Securities – (continued) | ||||||||
| Credit Card – (continued) | ||||||||
| Discover Card Master Trust I Series 1999-4, Class A | ||||||||
| $ 5,000,000 | 5.65 | % | 11/15/2004 | $ 4,915,685 | ||||
| MBNA Master Credit Card Trust Series 1995-E, Class A | ||||||||
| 1,000,000 | 6.84 | 01/15/2005 | 1,002,890 | |||||
| Standard Credit Card Master Trust Series 1994-4, Class A | ||||||||
| 2,000,000 | 8.25 | 11/07/2003 | 2,024,940 | |||||
| $ 10,097,649 | ||||||||
| TOTAL ASSET-BACKED SECURITIES | ||||||||
| (Cost $35,112,128) | $ 35,129,182 | |||||||
| Corporate Bonds – 5.4% | ||||||||
| Automotive – 1.1% | ||||||||
| Ford Motor Credit Co. | ||||||||
| $ 1,150,000 | 6.50 | % | 02/28/2002 | $ 1,144,452 | ||||
| General Motors Acceptance Corp. | ||||||||
| 750,000 | 6.75 | 02/07/2002 | 748,907 | |||||
| 1,893,359 | ||||||||
| Commercial Banks – 2.2% | ||||||||
| Bank of America Corp. | ||||||||
| $ 900,000 | 8.38 | % | 03/15/2002 | $ 914,899 | ||||
| 500,000 | 7.75 | 07/15/2002 | 505,820 | |||||
| Citigroup, Inc. | ||||||||
| 750,000 | 7.45 | 06/06/2002 | 758,861 | |||||
| The Bank of New York Co., Inc. | ||||||||
| 400,000 | 7.63 | 07/15/2002 | 405,653 | |||||
| 460,000 | 7.88 | 11/15/2002 | 470,013 | |||||
| Wells Fargo & Co. | ||||||||
| 570,000 | 7.20 | 05/01/2003 | 574,827 | |||||
| 3,630,073 | ||||||||
| Mortgage Banks – 0.1% | ||||||||
| Countrywide Funding Corp. | ||||||||
| $ 215,000 | 6.38 | % | 10/08/2002 | $ 212,219 | ||||
| Retailers – 0.3% | ||||||||
| Sears Roebuck Acceptance Corp. | ||||||||
| $ 375,000 | 6.86 | % | 08/06/2001 | $ 375,327 | ||||
| 200,000 | 6.41 | 11/19/2002 | 197,654 | |||||
| 572,981 | ||||||||
| Tobacco – 0.5% | ||||||||
| Philip Morris Cos., Inc. | ||||||||
| $ 800,000 | 7.13 | % | 08/15/2002 | $ 798,648 | ||||
| Yankee Banks – 0.3% | ||||||||
| Quebec Province | ||||||||
| $ 430,000 | 7.50 | % | 07/15/2002 | $ 434,760 | ||||
| Principal
Amount |
Interest
Rate |
Maturity
Date |
Value | |||||
|---|---|---|---|---|---|---|---|---|
| Corporate Bonds – (continued) | ||||||||
| Finance Companies – 0.9% | ||||||||
| Heller Financial, Inc. | ||||||||
| $ 585,000 | 7.50 | % | 08/23/2002 | $ 585,480 | ||||
| Household Finance Corp. | ||||||||
| 1,030,000 | 5.88 | 11/01/2002 | 1,009,417 | |||||
| $ 1,594,897 | ||||||||
| TOTAL CORPORATE BONDS | ||||||||
| (Cost $9,137,176) | $ 9,136,937 | |||||||
| U.S. Treasury Obligations – 39.3% | ||||||||
| United States Treasury Notes | ||||||||
| $ 8,200,000 | 5.25 | % | 05/31/2001 | $ 8,144,420 | ||||
| 58,600,000 | 5.50 | 08/31/2001 | 58,197,008 | |||||
| TOTAL U.S. TREASURY OBLIGATIONS | ||||||||
| (Cost $66,365,270) | $ 66,341,428 | |||||||
| Short-Term Obligation – 6.7% | ||||||||
| Federal National Mortgage Association | ||||||||
| $ 12,000,000 | 6.16 | % | 09/06/2001 | $ 11,361,600 | ||||
| TOTAL SHORT-TERM OBLIGATION | ||||||||
| (Cost $11,364,919) | $ 11,361,600 | |||||||
| Principal
Amount |
Interest
Rate |
Maturity
Date |
Value | |||||
|---|---|---|---|---|---|---|---|---|
| Repurchase Agreement – 0.8% | ||||||||
| Joint Repurchase Agreement Account Ù V | ||||||||
| $ 1,300,000 | 6.62 | % | 11/01/2000 | $ 1,300,000 | ||||
| TOTAL REPURCHASE AGREEMENT | ||||||||
| (Cost $1,300,000) | $ 1,300,000 | |||||||
| TOTAL INVESTMENTS | ||||||||
| (Cost $167,578,379) | $ 167,722,660 | |||||||
V
|
Joint repurchase agreement was entered into on October 31, 2000.
|
Ù
|
A portion of this security is segregated as collateral for initial margin requirement on futures transactions.
|
| The percentage shown for each investment category reflects the value of investments in that category as a percentage of net assets.
|
| The following graph shows the value as of October 31, 2000, of a $10,000 investment made on August 1, 1991 in the Institutional
shares of the Adjustable Rate Government Fund. For comparative purposes, the performance of the Fund’s benchmarks, the Six-Month and One-Year U.S. Treasury Bills (“Six-Month T-Bill/One-Year T-Bill”), as well as the Lehman Brothers Mutual
Fund Short (1-2) U.S. Government Index (“Lehman 1-2 Index”), are shown. This performance data represents past performance and should not be considered indicative of future performance which will fluctuate with changes in market conditions. These
performance fluctuations will cause an investor’s shares, when redeemed, to be worth more or less than their original cost. Performance of Class A and Service shares will vary from Institutional shares due to differences in fees and loads.
|
| Adjustable Rate Government Fund’s Lifetime Performance
|
| Growth of a $10,000 Investment, Distributions Reinvested August 1, 1991 to October 31, 2000.
(a)
|
 |
| Average Annual Total Return through October 31, 2000 | Since Inception | Five Years | One Year | ||||
|---|---|---|---|---|---|---|---|
| Class A shares (commenced May 15, 1995) | |||||||
| Excluding sales charges | 5.35% | 5.29% | 5.12% | ||||
| Including sales charges | 5.06% | 4.97% | 3.51% | ||||
| Institutional shares (commenced July 17, 1991) | 5.34% | 5.67% | 5.65% | ||||
| Service shares (commenced March 27, 1997) | 4.72% | n/a | 4.95% | ||||
(a)
|
For comparative purposes, initial investments are assumed to be made on the first day of the month following commencement of
operations.
|
| Principal
Amount |
Interest
Rate |
Maturity
Date |
Value | |||||
|---|---|---|---|---|---|---|---|---|
| Mortgage Backed Obligations – 90.7% | ||||||||
| Adjustable Rate Federal Home Loan Mortgage Corp.
(FHLMC)# – 30.3% |
||||||||
| $ 1,178,139 | 8.06 | % | 07/01/2018 | $ 1,189,731 | ||||
| 2,697,454 | 7.61 | 11/01/2018 | 2,728,151 | |||||
| 621,619 | 7.85 | 12/01/2018 | 625,989 | |||||
| 3,473,096 | 7.65 | 05/01/2019 | 3,498,068 | |||||
| 6,609,267 | 8.06 | 11/01/2019 | 6,747,665 | |||||
| 5,334,864 | 7.89 | 01/01/2020 | 5,327,395 | |||||
| 2,004,000 | 8.12 | 05/01/2020 | 2,032,497 | |||||
| 10,306,993 | 7.94 | 06/01/2020 | 10,459,949 | |||||
| 15,220,227 | 8.11 | 02/01/2022 | 15,550,810 | |||||
| 2,997,035 | 7.81 | 06/01/2022 | 3,031,860 | |||||
| 1,714,344 | 7.82 | 08/01/2022 | 1,735,945 | |||||
| 2,259,167 | 7.67 | 09/01/2022 | 2,275,003 | |||||
| 2,886,251 | 8.06 | 09/01/2022 | 2,930,902 | |||||
| 3,978,843 | 8.02 | 06/01/2024 | 4,033,552 | |||||
| 1,457,524 | 7.62 | 02/01/2028 | 1,465,045 | |||||
| 2,436,496 | 7.98 | 07/01/2030 | 2,435,107 | |||||
| $ 66,067,669 | ||||||||
| Adjustable Rate Federal National Mortgage
Association (FNMA)# – 44.3% |
||||||||
| $ 557,913 | 7.33 | % | 04/01/2003 | 553,382 | ||||
| 480,720 | 8.22 | 11/01/2014 | 491,483 | |||||
| 2,896,404 | 7.28 | 03/01/2017 | 2,948,134 | |||||
| 1,584,973 | 7.68 | 03/01/2017 | 1,615,927 | |||||
| 6,362,111 | 7.26 | 04/01/2017 | 6,332,463 | |||||
| 252,822 | 8.03 | 11/01/2017 | 258,278 | |||||
| 2,166,191 | 7.00 | 03/01/2018 | 2,139,958 | |||||
| 517,987 | 7.66 | 03/01/2018 | 522,959 | |||||
| 378,512 | 7.97 | 05/01/2018 | 379,091 | |||||
| 4,026,763 | 8.03 | 06/01/2018 | 4,105,284 | |||||
| 1,649,219 | 8.03 | 08/01/2018 | 1,696,535 | |||||
| 913,107 | 7.75 | 10/01/2018 | 931,944 | |||||
| 85,540 | 7.51 | 11/01/2018 | 87,177 | |||||
| 2,743,913 | 7.85 | 11/01/2018 | 2,800,657 | |||||
| 1,473,865 | 7.57 | 06/01/2019 | 1,491,080 | |||||
| 1,808,891 | 8.30 | 07/01/2019 | 1,828,537 | |||||
| 764,183 | 7.30 | 08/01/2019 | 778,610 | |||||
| 297,551 | 7.09 | 09/01/2019 | 295,730 | |||||
| 2,780,858 | 8.28 | 11/01/2019 | 2,845,180 | |||||
| 8,772,111 | 8.14 | 05/01/2020 | 8,972,378 | |||||
| 4,290,902 | 8.00 | 07/01/2020 | 4,388,263 | |||||
| 4,408,951 | 6.86 | 12/25/2020 | 4,347,157 | |||||
| 2,438,075 | 8.02 | 01/01/2021 | 2,493,249 | |||||
| 19,808,910 | 7.96 | 09/01/2021 | 20,253,421 | |||||
| 185,804 | 7.60 | 01/01/2022 | 189,330 | |||||
| 1,017,314 | 7.14 | 05/01/2022 | 1,018,881 | |||||
| 758,760 | 8.08 | 08/01/2022 | 776,613 | |||||
| 2,304,073 | 8.31 | 02/01/2023 | 2,347,643 | |||||
| 130,532 | 6.71 | 12/01/2023 | 129,141 | |||||
| 6,829,426 | 7.11 | 06/01/2024 | 6,839,944 | |||||
| 2,849,675 | 7.76 | 08/01/2027 | 2,913,850 | |||||
| Principal
Amount |
Interest
Rate |
Maturity
Date |
Value | |||||
|---|---|---|---|---|---|---|---|---|
| Mortgage Backed Obligations – (continued) | ||||||||
| Adjustable Rate Federal National Mortgage
Association (FNMA)# – (continued) |
||||||||
| $ 1,137,484 | 7.84 | % | 10/01/2027 | $ 1,148,153 | ||||
| 398,978 | 7.97 | 01/01/2028 | 407,524 | |||||
| 8,463,449 | 7.08 | 07/01/2030 | 8,362,954 | |||||
| $ 96,690,910 | ||||||||
| Adjustable Rate Government National Mortgage
Association (GNMA)# – 4.0% |
||||||||
| $ 1,807,853 | 7.38 | % | 03/20/2016 | 1,823,102 | ||||
| 2,484,048 | 7.75 | 08/20/2018 | 2,524,141 | |||||
| 2,939,870 | 7.38 | 02/20/2021 | 2,994,698 | |||||
| 1,418,872 | 7.38 | 06/20/2022 | 1,431,600 | |||||
| $ 8,773,541 | ||||||||
| Federal Home Loan Mortgage Corp. (FHLMC) – 4.1% | ||||||||
| $ 1,661,580 | 6.50 | % | 03/01/2013 | $ 1,627,319 | ||||
| 3,260,042 | 6.50 | 04/01/2013 | 3,192,820 | |||||
| 1,410,739 | 6.50 | 05/01/2013 | 1,381,481 | |||||
| 2,703,361 | 6.50 | 06/01/2013 | 2,652,363 | |||||
| $ 8,853,983 | ||||||||
| Federal National Mortgage Association (FNMA) – 1.6% | ||||||||
| $ 3,549,407 | 8.00 | % | 11/01/2017 | $ 3,614,219 | ||||
| Government National Mortgage Association (GNMA) – 1.5% | ||||||||
| $ 3,287,870 | 6.50 | % | 08/15/2027 | $ 3,184,565 | ||||
| Collateralized Mortgage Obligations – 4.9% | ||||||||
| IOette· # – 0.1% | ||||||||
| FNMA Remic Trust Series 1990-145, Class B | ||||||||
| $ 10,834 | 35.00 | % | 12/25/2020 | $ 260,945 | ||||
| Regular Floater CMOs# – 2.7% | ||||||||
| FNMA Series 1998-66, Class FC | ||||||||
| $ 5,888,092 | 7.12 | % | 11/17/2028 | $ 5,883,793 | ||||
| Sequential Fixed Rate CMOs – 2.1% | ||||||||
| FHLMC Series 1980, Class C | ||||||||
| $ 496,598 | 6.85 | % | 10/15/2021 | $ 494,776 | ||||
| FNMA Remic Trust Series 1993-14, Class A | ||||||||
| 2,038,741 | 6.00 | 02/25/2008 | 2,001,085 | |||||
| FNMA Remic Trust Series G93-39, Class A | ||||||||
| 1,168,642 | 5.70 | 08/25/2016 | 1,156,173 | |||||
| FNMA Series 1996-22, Class B | ||||||||
| 911,456 | 7.25 | 02/25/2024 | 907,121 | |||||
| $ 4,559,155 | ||||||||
| TOTAL COLLATERALIZED
MORTGAGE OBLIGATIONS |
$ 10,703,893 | |||||||
| TOTAL MORTGAGE BACKED OBLIGATIONS | ||||||||
| (Cost $202,190,723) | $ 197,888,780 | |||||||
| Principal
Amount |
Interest
Rate |
Maturity
Date |
Value | |||||
|---|---|---|---|---|---|---|---|---|
| Repurchase Agreement – 8.5% | ||||||||
| Joint Repurchase Agreement Account Ù V | ||||||||
| $18,500,000 | 6.62 | % | 11/01/2000 | $ 18,500,000 | ||||
| TOTAL REPURCHASE AGREEMENT | ||||||||
| (Cost $18,500,000) | $ 18,500,000 | |||||||
| TOTAL INVESTMENTS | ||||||||
| (Cost $220,690,723) | $ 216,388,780 | |||||||
#
|
Variable rate security. Coupon rate disclosed is that which is in effect at October 31, 2000.
|
Ù
|
A portion of this security is segregated as collateral for initial margin requirement on futures transactions.
|
V
|
Joint repurchase agreement was entered into on October 31, 2000.
|
Ÿ
|
Represents security with notional or nominal principal amount. The actual effective yield of this security is different than the
stated coupon due to the amortization of related premiums.
|
| The percentage shown for each investment category reflects the value of investments in that category as a percentage of total net
assets.
|
| The following graph shows the value as of October 31, 2000, of a $10,000 investment made on September 1, 1988 in the
Institutional shares of the Goldman Sachs Short Duration Government Fund. For comparative purposes, the performance of the Fund’s benchmark (the U.S. 2-Year Treasury Bill (“Two-Year T-Bill”)), as well as the Lehman Brothers Mutual Fund
Short (1-3) U.S. Government Index (“Lehman Short (1-3) Gov’t Index”), are shown. This performance data represents past performance and should not be considered indicative of future performance which will fluctuate with changes in market
conditions. These performance fluctuations will cause an investor’s shares, when redeemed, to be worth more or less than their original cost. Performance of Class A, Class B, Class C and Service shares will vary from Institutional shares due to
differences in fees and loads.
|
| Short Duration Government Fund’s Lifetime Performance
|
| Growth of a $10,000 Investment, Distributions Reinvested September 1, 1988 to October 31, 2000.(a)
|
 |
| Average Annual Total Return through October 31, 2000 | Since Inception | Ten Years | Five Years | One Year | |||||
|---|---|---|---|---|---|---|---|---|---|
| Class A shares (commenced May 1, 1997) | |||||||||
| Excluding sales charges | 5.17% | n/a | n/a | 5.65% | |||||
| Including sales charges | 4.56% | n/a | n/a | 3.48% | |||||
| Class B shares (commenced May 1, 1997) | |||||||||
| Excluding contingent deferred sales charges | 4.54% | n/a | n/a | 4.80% | |||||
| Including contingent deferred sales charges | 4.54% | n/a | n/a | 2.71% | |||||
| Class C shares (commenced August 15, 1997) | |||||||||
| Excluding contingent deferred sales charges | 3.99% | n/a | n/a | 4.76% | |||||
| Including contingent deferred sales charges | 3.99% | n/a | n/a | 3.71% | |||||
| Institutional shares (commenced August 15, 1988) | 6.67% | 6.12% | 5.76% | 5.85% | |||||
| Service shares (commenced April 10, 1996) | 5.34% | n/a | n/a | 5.32% | |||||
(a)
|
For comparative purposes, initial investments are assumed to be made on the first day of the month following commencement of
operations.
|
| Principal
Amount |
Interest
Rate |
Maturity
Date |
Value | |||||
|---|---|---|---|---|---|---|---|---|
| Mortgage Backed Obligations – 88.9% | ||||||||
| Adjustable Rate Federal Home Loan Mortgage Corp.
(FHLMC) # – 5.2% |
||||||||
| $ 788,342 | 8.13 | % | 08/01/2017 | $ 788,594 | ||||
| 810,208 | 7.37 | 05/01/2018 | 805,023 | |||||
| 2,303,972 | 7.67 | 06/01/2018 | 2,341,550 | |||||
| 836,312 | 7.61 | 12/01/2018 | 842,191 | |||||
| 3,434,594 | 7.97 | 02/01/2022 | 3,509,193 | |||||
| 952,937 | 7.78 | 10/01/2025 | 951,746 | |||||
| $ 9,238,297 | ||||||||
| Adjustable Rate Federal National Mortgage
Association (FNMA) # – 15.3% |
||||||||
| $ 1,153,727 | 8.22 | % | 11/01/2014 | $ 1,179,559 | ||||
| 1,934,599 | 7.85 | 11/01/2017 | 1,973,911 | |||||
| 2,192,373 | 7.41 | 02/01/2018 | 2,224,820 | |||||
| 2,143,343 | 7.85 | 06/01/2018 | 2,165,205 | |||||
| 1,990,536 | 8.07 | 03/01/2019 | 2,034,248 | |||||
| 4,350,529 | 8.14 | 05/01/2020 | 4,449,852 | |||||
| 2,844,489 | 7.83 | 12/01/2020 | 2,905,048 | |||||
| 2,925,690 | 8.02 | 01/01/2021 | 2,991,898 | |||||
| 758,760 | 8.08 | 08/01/2022 | 776,613 | |||||
| 2,227,227 | 7.98 | 01/01/2023 | 2,279,968 | |||||
| 2,758,629 | 7.47 | 07/01/2028 | 2,788,836 | |||||
| 1,503,881 | 8.04 | 01/01/2031 | 1,531,146 | |||||
| $ 27,301,104 | ||||||||
| Federal Home Loan Mortgage Corp. (FHLMC) – 7.4% | ||||||||
| $ 2,750,803 | 6.00 | % | 04/01/2003 | 2,704,232 | ||||
| 3,041,444 | 6.50 | 01/01/2013 | 2,986,789 | |||||
| 825,587 | 6.50 | 04/01/2013 | 810,752 | |||||
| 1,726,864 | 6.50 | 05/01/2013 | 1,690,828 | |||||
| 785,314 | 6.50 | 06/01/2013 | 769,992 | |||||
| 2,390,390 | 6.00 | 11/01/2028 | 2,247,349 | |||||
| 2,000,000 | 8.00 | 06/01/2030 | 2,027,420 | |||||
| $ 13,237,362 | ||||||||
| Federal National Mortgage Association (FNMA) – 13.6% | ||||||||
| $ 800,915 | 8.50 | % | 05/01/2010 | 822,027 | ||||
| 24,065 | 6.00 | 08/01/2010 | 23,392 | |||||
| 27,408 | 6.00 | 11/01/2010 | 26,641 | |||||
| 71,390 | 6.00 | 01/01/2011 | 69,100 | |||||
| 125,256 | 6.00 | 02/01/2011 | 121,238 | |||||
| 3,948,353 | 6.00 | 03/01/2011 | 3,823,374 | |||||
| 1,647,768 | 6.00 | 04/01/2011 | 1,595,138 | |||||
| 1,840,968 | 6.00 | 05/01/2011 | 1,781,910 | |||||
| 231,347 | 6.00 | 06/01/2011 | 223,926 | |||||
| 210,008 | 6.00 | 07/01/2011 | 204,134 | |||||
| 563,612 | 6.00 | 09/01/2011 | 547,847 | |||||
| 46,160 | 6.00 | 12/01/2011 | 44,679 | |||||
| 56,589 | 6.00 | 01/01/2012 | 54,581 | |||||
| 316,663 | 6.00 | 03/01/2012 | 305,425 | |||||
| 233,750 | 6.00 | 04/01/2013 | 226,251 | |||||
| 301,103 | 6.00 | 11/01/2013 | 291,443 | |||||
| 496,598 | 6.00 | 01/01/2014 | 469,593 | |||||
| 1,756,099 | 6.00 | 03/01/2014 | 1,646,342 | |||||
| 484,055 | 6.00 | 04/01/2028 | 454,901 | |||||
| 126,061 | 6.50 | 12/01/2028 | 121,316 | |||||
| Principal
Amount |
Interest
Rate |
Maturity
Date |
Value | |||||
|---|---|---|---|---|---|---|---|---|
| Mortgage Backed Obligations – (continued) | ||||||||
| Federal National Mortgage Association (FNMA) – continued | ||||||||
| $ 183,404 | 6.50 | % | 01/01/2029 | $ 176,501 | ||||
| 2,092,691 | 8.50 | 05/01/2030 | 2,138,583 | |||||
| 2,000,000 | 6.50 | TBA-30 yr® | 1,921,880 | |||||
| 2,000,000 | 7.00 | TBA-30 yr® | 1,960,000 | |||||
| 5,000,000 | 8.50 | TBA-30 yr® | 5,109,400 | |||||
| $ 24,159,622 | ||||||||
| Government National Mortgage Association (GNMA) – 4.7% | ||||||||
| $ 876,642 | 6.50 | % | 06/15/2008 | $ 871,014 | ||||
| 481,183 | 6.50 | 07/15/2008 | 478,093 | |||||
| 1,613,835 | 6.50 | 08/15/2008 | 1,603,474 | |||||
| 929,034 | 6.50 | 09/15/2008 | 923,070 | |||||
| 156,439 | 6.50 | 10/15/2008 | 155,435 | |||||
| 43,348 | 6.50 | 11/15/2008 | 43,070 | |||||
| 124,278 | 9.00 | 12/15/2008 | 129,867 | |||||
| 69,069 | 6.50 | 01/15/2009 | 68,593 | |||||
| 149,773 | 9.00 | 01/15/2009 | 156,485 | |||||
| 12,944 | 6.50 | 03/15/2009 | 12,854 | |||||
| 62,063 | 6.50 | 04/15/2009 | 61,635 | |||||
| 722,499 | 6.50 | 05/15/2009 | 717,514 | |||||
| 70,152 | 6.50 | 07/15/2009 | 69,668 | |||||
| 69,675 | 6.50 | 11/15/2009 | 69,194 | |||||
| 59,013 | 9.00 | 01/15/2010 | 61,645 | |||||
| 480,798 | 9.00 | 07/15/2012 | 502,001 | |||||
| 199,333 | 6.50 | 10/15/2023 | 193,700 | |||||
| 1,587,297 | 7.00 | 10/15/2023 | 1,572,043 | |||||
| 15,493 | 6.50 | 11/15/2023 | 15,055 | |||||
| 1,149,793 | 6.50 | 12/15/2023 | 1,117,300 | |||||
| 620,994 | 6.50 | 01/15/2024 | 603,271 | |||||
| 168,230 | 6.50 | 02/15/2024 | 163,429 | |||||
| 734,323 | 6.50 | 04/15/2024 | 713,366 | |||||
| 1,643,935 | 6.50 | 08/15/2027 | 1,592,283 | |||||
| $ 11,894,059 | ||||||||
| Collateralized Mortgage Obligations – 42.7% | ||||||||
| Inverse Floater# – 1.3% | ||||||||
| FNMA Remic Trust Series 1990-134, Class SC | ||||||||
| $ 751,873 | 11.66 | % | 11/25/2020 | $ 813,557 | ||||
| FNMA Remic Trust Series 1993-231, Class SA | ||||||||
| 1,580,751 | 2.63 | 12/25/2008 | 1,422,405 | |||||
| $ 2,235,962 | ||||||||
| Inverse Floating Rate – Interest Only # · – 0.0% | ||||||||
| FHLMC Series 1684, Class JD | ||||||||
| $ 752,646 | 2.99 | % | 08/15/2020 | $ 21,217 | ||||
| IOette· # – 0.3% | ||||||||
| FHLMC Series 1161, Class U | ||||||||
| $ 18,130 | 35.00 | % | 11/15/2021 | $ 550,051 | ||||
| Planned Amortization Class (PAC) CMOs – 13.2% | ||||||||
| FHLMC Series 1556, Class G | ||||||||
| $ 2,000,000 | 6.35 | % | 10/15/2010 | $ 1,982,200 | ||||
| FHLMC Series 1916, Class PC | ||||||||
| 3,700,000 | 6.75 | 12/15/2011 | 3,571,832 | |||||
| Principal
Amount |
Interest
Rate |
Maturity
Date |
Value | |||||
|---|---|---|---|---|---|---|---|---|
| Mortgage Backed Obligations – (continued) | ||||||||
| Planned Amortization Class (PAC) CMOs – continued | ||||||||
| FHLMC Series 1987, Class L | ||||||||
| $ 4,000,000 | 6.20 | % | 08/25/2022 | $ 3,869,720 | ||||
| FHLMC Series 2055, Class OD | ||||||||
| 3,000,000 | 6.00 | 01/15/2012 | 2,876,670 | |||||
| FHLMC Series 2130, Class QY | ||||||||
| 2,810,256 | 8.50 | 02/15/2019 | 2,876,307 | |||||
| FHLMC Series 2149, Class TF | ||||||||
| 1,500,000 | 6.50 | 05/15/2024 | 1,459,440 | |||||
| FNMA Remic Trust Series 1997-84, Class PA | ||||||||
| 4,000,000 | 5.90 | 11/25/2021 | 3,875,598 | |||||
| FNMA Series G93-32, Class PH | ||||||||
| 3,000,000 | 6.50 | 11/25/2022 | 2,947,530 | |||||
| $ 23,459,297 | ||||||||
| Planned Amortization – Interest Only· – 0.1% | ||||||||
| FHLMC Series 1587, Class HA | ||||||||
| $ 2,006,861 | 6.50 | % | 10/15/2008 | $ 218,640 | ||||
| Principal Only° – 1.1% | ||||||||
| FNMA Remic Trust Series G92-28, Class A | ||||||||
| $ 2,316,618 | 7.63 | % | 05/25/2007 | $ 2,007,628 | ||||
| Regular Floater CMOs# – 4.7% | ||||||||
| FHLMC Series 1684, Class JC | ||||||||
| $ 752,646 | 6.01 | % | 08/15/2020 | $ 743,705 | ||||
| FNMA Remic Trust Series 1993-226, Class F | ||||||||
| 3,000,000 | 8.00 | 12/25/2023 | 3,035,747 | |||||
| FNMA Series 1993-203, Class FA | ||||||||
| 4,510,858 | 7.88 | 10/25/2023 | 4,609,453 | |||||
| $ 8,388,905 | ||||||||
| Sequential Fixed Rate CMOs – 20.3% | ||||||||
| FHLMC Series 1033, Class G | ||||||||
| $ 850,887 | 8.00 | % | 01/15/2006 | $ 858,885 | ||||
| FHLMC Series 1468, Class ZB | ||||||||
| 5,468,620 | 9.00 | 02/15/2021 | 5,708,092 | |||||
| FHLMC Series 1812, Class D | ||||||||
| 778,862 | 6.00 | 07/15/2008 | 771,777 | |||||
| FHLMC Series 1883, Class E | ||||||||
| 5,915,762 | 7.00 | 03/15/2010 | 5,914,939 | |||||
| FHLMC Series 1998, Class DB | ||||||||
| 2,156,393 | 9.50 | 01/17/2025 | 2,226,300 | |||||
| FHLMC Series 2152, Class AB | ||||||||
| 2,744,309 | 6.25 | 01/15/2026 | 2,656,903 | |||||
| FNMA Remic Trust Series 1990-16, Class E | ||||||||
| 6,056,201 | 9.00 | 03/25/2020 | 6,288,032 | |||||
| FNMA Remic Trust Series 1989-74, Class J | ||||||||
| 1,320,803 | 9.80 | 10/25/2019 | 1,385,059 | |||||
| Principal
Amount |
Interest
Rate |
Maturity
Date |
Value | |||||
|---|---|---|---|---|---|---|---|---|
| Mortgage Backed Obligations – (continued) | ||||||||
| Sequential Fixed Rate CMOs – continued | ||||||||
| FNMA Remic Trust Series 1993-33, Class ZA | ||||||||
| $ 7,228,033 | 7.50 | % | 09/25/2021 | $ 7,259,653 | ||||
| FNMA Series 1988-12, Class A | ||||||||
| 1,749,171 | 10.00 | 02/25/2018 | 1,817,519 | |||||
| GNMA Remic Trust Series 1995-3, Class DZ | ||||||||
| 1,072,836 | 8.05 | 06/16/2025 | 1,109,892 | |||||
| $ 35,997,051 | ||||||||
| Super Floater# – 0.7% | ||||||||
| FNMA Remic Trust Series 88-12, Class B | ||||||||
| $ 1,380,925 | 5.27 | % | 02/25/2018 | $ 1,301,470 | ||||
| Support – 1.0% | ||||||||
| FHLMC Series 16, Class M | ||||||||
| $ 1,796,524 | 7.00 | % | 08/25/2023 | $ 1,725,975 | ||||
| TOTAL COLLATERALIZED
MORTGAGE OBLIGATIONS |
$ 75,906,196 | |||||||
| TOTAL MORTGAGE BACKED
OBLIGATIONS |
||||||||
| (Cost $164,435,979) | $ 161,736,640 | |||||||
| Agency Debentures – 6.7% | ||||||||
| Federal National Mortgage Association | ||||||||
| $ 4,530,000 | 7.25 | % | 01/15/2010 | $ 4,694,072 | ||||
| 2,000,000 | 7.13 | 06/15/2010 | 2,061,990 | |||||
| Small Business Administration | ||||||||
| 1,284,782 | 7.20 | 06/01/2017 | 1,289,449 | |||||
| 1,764,723 | 6.30 | 05/01/2018 | 1,691,493 | |||||
| 2,236,080 | 6.30 | 06/01/2018 | 2,141,899 | |||||
| TOTAL AGENCY DEBENTURES | ||||||||
| (Cost $12,138,878) | $ 11,878,903 | |||||||
| U.S. Treasury Obligation – 4.7% | ||||||||
| United States Treasury Note | ||||||||
| $ 8,500,000 | 5.25 | % | 08/15/2003 | $ 8,359,401 | ||||
| TOTAL U.S. TREASURY OBLIGATION | ||||||||
| (Cost $8,392,950) | $ 8,359,401 | |||||||
| Principal
Amount |
Interest
Rate |
Maturity
Date |
Value | |||||
|---|---|---|---|---|---|---|---|---|
| Repurchase Agreement – 2.7% | ||||||||
| Joint Repurchase Agreement Account ÙV | ||||||||
| $ 4,700,000 | 6.62 | % | 11/01/2000 | $ 4,700,000 | ||||
| TOTAL REPURCHASE AGREEMENT | ||||||||
| (Cost $4,700,000) | $ 4,700,000 | |||||||
| TOTAL INVESTMENTS | ||||||||
| (Cost $189,667,807) | $ 186,674,944 | |||||||
#
|
Variable rate security. Coupon rate disclosed is that which is in effect at October 31, 2000.
|
®
|
TBA (To Be Assigned) securities are purchased on a forward commitment basis with an approximate (generally +/-2.5%) principal
amount and no definite maturity date. The actual principal amount and maturity date will be determined upon settlement when the specific mortgage pools are assigned.
|
·
|
Represents security with notional or nominal principal amount. The actual effective yield of this security is different than the
stated coupon due to the amortization of related premiums.
|
°
|
Security is issued with a zero coupon. The interest rate disclosed represents effective yield to maturity.
|
Ù
|
A portion of this security is segregated as collateral for initial margin requirement on futures transactions.
|
V
|
Joint repurchase agreement was entered into on October 31, 2000.
|
| The percentage shown for each investment category reflects the value of investments in that category as a percentage of net assets.
|
| The following graph shows the value as of October 31, 2000, of a $10,000 investment made on March 1, 1993 in Class A shares (with
the maximum sales charge of 4.5%) of the Goldman Sachs Government Income Fund. For comparative purposes, the performance of the Fund’s benchmark (the Lehman Brothers Mutual Fund Government/Mortgage Index (“Lehman Gov’t/MBS Index”)), as
well as the Lehman Brothers Mutual Fund General U.S. Government Index (“Lehman U.S. Gov’t Index”), are shown. This performance data represents past performance and should not be considered indicative of future performance which will
fluctuate with changes in market conditions. These performance fluctuations will cause an investor’s shares, when redeemed, to be worth more or less than their original cost. Performance of Class B, Class C, Institutional and Service shares will vary
from Class A shares due to differences in fees and loads.
|
| Government Income Fund’s Lifetime Performance
|
| Growth of a $10,000 Investment, Distributions Reinvested March 1, 1993 to October 31, 2000.(a)
|
 |
| Average Annual Total Return through October 31, 2000 | Since Inception | Five Years | One Year | ||||
|---|---|---|---|---|---|---|---|
| Class A shares (commenced February 10, 1993) | |||||||
| Excluding sales charges | 6.36% | 5.98% | 7.33% | ||||
| Including sales charges | 5.73% | 5.01% | 2.47% | ||||
| Class B shares (commenced May 1, 1996) | |||||||
| Excluding contingent deferred sales charges | 5.73% | n/a | 6.45% | ||||
| Including contingent deferred sales charges | 5.26% | n/a | 1.18% | ||||
| Class C shares (commenced August 15, 1997) | |||||||
| Excluding contingent deferred sales charges | 4.91% | n/a | 6.46% | ||||
| Including contingent deferred sales charges | 4.91% | n/a | 5.40% | ||||
| Institutional shares (commenced August 15, 1997) | 6.04% | n/a | 7.68% | ||||
| Service shares (commenced August 15, 1997) | 5.57% | n/a | 7.62% | ||||
(a)
|
For comparative purposes, initial investments are assumed to be made on the first day of the month following commencement of
operations.
|
| Principal
Amount |
Interest
Rate |
Maturity
Date |
Value | |||||
|---|---|---|---|---|---|---|---|---|
| Mortgage Backed Obligations – 60.5% | ||||||||
| Federal Home Loan Mortgage Corp. (FHLMC) – 5.2% | ||||||||
| $ 2,154,660 | 6.50 | % | 08/01/2010 | $ 2,127,942 | ||||
| 951,096 | 6.00 | 07/01/2028 | 894,183 | |||||
| 946,561 | 6.00 | 02/01/2029 | 889,919 | |||||
| 1,000,000 | 8.00 | 06/01/2030 | 1,013,710 | |||||
| 494,167 | 8.00 | 07/01/2030 | 500,942 | |||||
| 999,351 | 8.00 | 09/01/2030 | 1,013,052 | |||||
| $ 6,439,748 | ||||||||
| Federal National Mortgage Association (FNMA) – 28.6% | ||||||||
| $ 295,842 | 6.50 | % | 08/01/2025 | $ 285,949 | ||||
| 186,073 | 6.50 | 09/01/2025 | 179,974 | |||||
| 205,135 | 6.50 | 10/01/2025 | 198,411 | |||||
| 257,919 | 6.50 | 11/01/2025 | 249,756 | |||||
| 350,579 | 6.50 | 12/01/2025 | 338,887 | |||||
| 16,140 | 6.50 | 05/01/2026 | 15,611 | |||||
| 90,308 | 6.50 | 06/01/2028 | 86,908 | |||||
| 1,455,859 | 6.50 | 09/01/2028 | 1,401,061 | |||||
| 398,490 | 6.00 | 11/01/2028 | 374,489 | |||||
| 1,650,774 | 6.50 | 11/01/2028 | 1,588,639 | |||||
| 1,626,218 | 6.00 | 12/01/2028 | 1,528,271 | |||||
| 3,417,270 | 6.50 | 12/01/2028 | 3,288,643 | |||||
| 564,473 | 6.00 | 01/01/2029 | 530,474 | |||||
| 44,053 | 6.00 | 02/01/2029 | 41,400 | |||||
| 484,521 | 6.50 | 03/01/2029 | 465,969 | |||||
| 2,489,378 | 6.50 | 04/01/2029 | 2,394,060 | |||||
| 237,638 | 6.00 | 05/01/2029 | 223,325 | |||||
| 484,545 | 6.50 | 06/01/2029 | 465,992 | |||||
| 27,459 | 6.00 | 11/01/2029 | 25,805 | |||||
| 323,176 | 8.50 | 07/01/2030 | 330,263 | |||||
| 1,000,000 | 7.00 | TBA-30 yr® | 980,000 | |||||
| 20,000,000 | 8.00 | TBA-30 yr® | 20,218,800 | |||||
| $ 35,212,687 | ||||||||
| Government National Mortgage Association (GNMA) – 9.7% | ||||||||
| $ 20,108 | 6.50 | % | 04/15/2023 | $ 19,539 | ||||
| 387,626 | 7.00 | 07/15/2023 | 383,900 | |||||
| 519,497 | 7.00 | 08/15/2023 | 514,504 | |||||
| 208,107 | 6.50 | 09/15/2023 | 202,226 | |||||
| 117,426 | 7.00 | 09/15/2023 | 116,297 | |||||
| 868,872 | 6.50 | 10/15/2023 | 844,318 | |||||
| 424,642 | 7.00 | 10/15/2023 | 420,561 | |||||
| 754,845 | 6.50 | 11/15/2023 | 733,513 | |||||
| 1,802,801 | 6.50 | 12/15/2023 | 1,751,854 | |||||
| 32,429 | 7.00 | 12/15/2023 | 32,117 | |||||
| 2,345,164 | 6.50 | 01/15/2024 | 2,278,233 | |||||
| 417,639 | 6.50 | 02/15/2024 | 405,720 | |||||
| 96,106 | 6.50 | 03/15/2024 | 93,363 | |||||
| 369,752 | 6.50 | 04/15/2024 | 359,200 | |||||
| 124,559 | 6.50 | 10/15/2024 | 121,045 | |||||
| 287,922 | 6.50 | 01/15/2026 | 279,330 | |||||
| 655,093 | 6.50 | 03/15/2026 | 635,545 | |||||
| 17,900 | 6.50 | 04/15/2026 | 17,366 | |||||
| 561,113 | 6.50 | 07/15/2028 | 542,153 | |||||
| 42,207 | 8.00 | 12/15/2029 | 42,921 | |||||
| 56,659 | 8.00 | 02/15/2030 | 57,597 | |||||
| 2,000,001 | 8.00 | 08/15/2030 | 2,033,241 | |||||
| $ 11,884,543 | ||||||||
| Principal
Amount |
Interest
Rate |
Maturity
Date |
Value | |||||
|---|---|---|---|---|---|---|---|---|
| Mortgage Backed Obligations – (continued) | ||||||||
| Collateralized Mortgage Obligations – 17.0% | ||||||||
| Interest Only · – 0.1% | ||||||||
| FNMA Interest-Only Stripped Security Series 151, Class 2 | ||||||||
| $ 219,139 | 9.50 | % | 07/01/2022 | $ 58,208 | ||||
| Inverse Floater# – 1.6% | ||||||||
| FNMA Remic Trust Series 1993-138, Class SM | ||||||||
| $ 921,052 | 9.95 | % | 12/25/2021 | $ 936,266 | ||||
| FNMA Remic Trust Series 1993-231, Class SA | ||||||||
| 1,185,563 | 2.63 | 12/25/2008 | 1,066,804 | |||||
| $ 2,003,070 | ||||||||
| Inverse Floating Rate – Interest Only#· – 0.1% | ||||||||
| Salomon Brothers Mortgage Securities VII Series 1996-6E,
Class A2 |
||||||||
| $ 4,837,823 | 2.48 | % | 03/30/2025 | $ 110,012 | ||||
| Non-Agency CMOs – 1.0% | ||||||||
| CS First Boston Mortgage Securities Corp. Series 1997-C2,
Class A2 |
||||||||
| $ 800,000 | 6.52 | % | 07/17/2007 | $ 784,830 | ||||
| First Union-Lehman Brothers Commercial Mortgage Services
Series 1997-C1, Class A2 |
||||||||
| 400,000 | 7.30 | 12/18/2006 | 405,221 | |||||
| 1,190,051 | ||||||||
| Planned Amortization Class (PAC) CMOs – 6.1% | ||||||||
| Federal Home Loan Mortgage Corp. Series 1623, Class PG | ||||||||
| $ 2,000,000 | 3.00 | % | 07/15/2021 | $ 1,738,120 | ||||
| FHLMC Series 2055, Class OD | ||||||||
| 4,000,000 | 6.00 | 01/15/2012 | 3,835,560 | |||||
| FNMA REMIC Trust Series 1997-84, Class PB | ||||||||
| 2,000,000 | 5.50 | 01/25/2008 | 1,899,360 | |||||
| $ 7,473,040 | ||||||||
| Planned Amortization – Interest Only· – 0.8% | ||||||||
| FHLMC Series 2205, Class PI | ||||||||
| $ 4,424,000 | 7.50 | % | 05/15/2027 | $ 1,004,336 | ||||
| Principal Only° – 0.1% | ||||||||
| FNMA Remic Trust Series G-35, Class N | ||||||||
| $ 184,719 | 5.64 | % | 10/25/2021 | $ 147,504 | ||||
| Regular Floater CMOs# – 1.5% | ||||||||
| FNMA Remic Trust 1993 138 Class FM | ||||||||
| $ 2,000,000 | 9.47 | % | 12/25/2021 | $ 1,891,760 | ||||
| Sequential Fixed Rate CMOs – 3.1% | ||||||||
| Citicorp Mortgage Securities, Inc. Series 1993-11, Class A6 | ||||||||
| $ 308,090 | 6.25 | % | 09/25/2008 | $ 298,783 | ||||
| FNMA Remic Trust Series 1998-58, Class VA | ||||||||
| 3,166,347 | 6.00 | 10/25/2008 | 3,035,101 | |||||
| GE Capital Mortgage Services, Inc. Series 1995-1, Class A8 | ||||||||
| 533,720 | 8.40 | 02/25/2025 | 531,569 | |||||
| $ 3,865,453 | ||||||||
| Principal
Amount |
Interest
Rate |
Maturity
Date |
Value | |||||
|---|---|---|---|---|---|---|---|---|
| Mortgage Backed Obligations – (continued) | ||||||||
| Support – 2.6% | ||||||||
| FHLMC Series 16, Class M | ||||||||
| $ 898,262 | 7.00 | % | 08/25/2023 | $ 862,987 | ||||
| Housing Securities, Inc. Series 1994-1, Class A13 | ||||||||
| 1,455,585 | 6.50 | 03/25/2009 | 1,382,806 | |||||
| Salomon Brothers Mortgage Securities VII Series 1996-6H,
Class A1 |
||||||||
| 1,000,000 | 6.00 | 09/30/2008 | 928,750 | |||||
| $ 3,174,543 | ||||||||
| TOTAL COLLATERALIZED MORTGAGE
OBLIGATIONS |
$ 20,917,977 | |||||||
| TOTAL MORTGAGE BACKED OBLIGATIONS | ||||||||
| (Cost $76,554,207) | $ 74,454,955 | |||||||
| Agency Debentures – 15.2% | ||||||||
| Federal Home Loan Bank | ||||||||
| $ 1,000,000 | 5.68 | % | 12/03/2007 | $ 985,165 | ||||
| Federal National Mortgage Association | ||||||||
| 3,000,000 | 5.45 | 02/05/2004 | 2,905,218 | |||||
| 3,000,000 | 6.00 | 02/19/2004 | 2,910,930 | |||||
| 3,800,000 | 7.00 | 07/15/2005 | 3,868,936 | |||||
| 1,490,000 | 7.25 | 01/15/2010 | 1,543,966 | |||||
| Small Business Administration | ||||||||
| 1,663,470 | 6.70 | 12/01/2016 | 1,631,632 | |||||
| 1,370,387 | 7.15 | 03/01/2017 | 1,371,939 | |||||
| 1,148,246 | 7.50 | 04/01/2017 | 1,166,616 | |||||
| 647,124 | 7.30 | 05/01/2017 | 652,320 | |||||
| 882,362 | 6.30 | 05/01/2018 | 845,746 | |||||
| 894,432 | 6.30 | 06/01/2018 | 856,759 | |||||
| TOTAL AGENCY DEBENTURES | ||||||||
| (Cost $18,755,633) | $ 18,739,227 | |||||||
| Asset-Backed Securities – 12.2% | ||||||||
| Auto – 0.3% | ||||||||
| CPS Auto Grantor Trust Series 1996-3, Class A | ||||||||
| $ 371,301 | 6.30 | % | 08/15/2002 | $ 369,044 | ||||
| Credit Card – 8.3% | ||||||||
| Discover Card Master Trust I Series 1999-2, Class A | ||||||||
| $ 2,500,000 | 5.90 | % | 10/15/2004 | $ 2,472,650 | ||||
| Discover Card Master Trust I Series 1999-6, Class A | ||||||||
| 3,000,000 | 6.85 | 07/17/2007 | 2,997,850 | |||||
| Fingerhut Master Trust Series 1998-2, Class A | ||||||||
| 2,750,000 | 6.23 | 02/15/2007 | 2,716,533 | |||||
| MBNA Master Credit Card Trust Series 1998-C, Class A # | ||||||||
| 2,000,000 | 6.70 | 11/15/2005 | 2,000,520 | |||||
| $ 10,187,553 | ||||||||
| Principal
Amount |
Interest
Rate |
Maturity
Date |
Value | |||||
|---|---|---|---|---|---|---|---|---|
| Asset-Backed Securities – (continued) | ||||||||
| Home Equity – 0.2% | ||||||||
| First Franklin Mortgage Loan Series 1997-FF2, Class A # | ||||||||
| $ 231,842 | 6.86 | % | 08/25/2028 | $ 231,819 | ||||
| Lease – 2.8% | ||||||||
| AESOP Funding II LLC Series 1998-1, Class A† | ||||||||
| $ 2,000,000 | 6.14 | % | 05/20/2006 | $ 1,922,640 | ||||
| First Sierra Receivables Series 1998-1, Class A4 | ||||||||
| 1,600,000 | 5.63 | 08/12/2004 | 1,576,128 | |||||
| $ 3,498,768 | ||||||||
| Manufactured Housing – 0.6% | ||||||||
| Mid-State Trust Series 4, Class A | ||||||||
| $ 706,587 | 8.33 | % | 04/01/2030 | $ 726,385 | ||||
| TOTAL ASSET-BACKED SECURITIES | ||||||||
| (Cost $15,200,801) | $ 15,013,569 | |||||||
| Insured Revenue Bond – 1.6% | ||||||||
| New Jersey Economic Development Authority Series A | ||||||||
| $ 2,000,000 | 7.43 | % | 02/15/2029 | $ 1,972,520 | ||||
| TOTAL INSURED REVENUE BOND | ||||||||
| (Cost $2,000,000) | $ 1,972,520 | |||||||
| U.S. Treasury Obligations – 10.9% | ||||||||
| United States Treasury Interest-Only Stripped Securities· | ||||||||
| $ 1,780,000 | 6.16 | % | 05/15/2013 | $ 846,157 | ||||
| 2,100,000 | 6.17 | 02/15/2014 | 953,608 | |||||
| United States Treasury Principal-Only Stripped Securities° | ||||||||
| 2,590,000 | 6.17 | 11/15/2009 | 1,488,929 | |||||
| 2,000,000 | 6.17 | 11/15/2018 | 682,518 | |||||
| 4,450,000 | 6.16 | 05/15/2020 | 1,388,712 | |||||
| 1,000,000 | 6.20 | 05/15/2021 | 294,009 | |||||
| 1,000,000 | 6.11 | 11/15/2022 | 270,599 | |||||
| 380,000 | 6.04 | 08/15/2025 | 88,410 | |||||
| United States Treasury Bond | ||||||||
| 400,000 | 6.88 | 08/15/2025 | 445,525 | |||||
| United States Treasury Notes | ||||||||
| 3,300,000 | 6.00 | 08/15/2009 | 3,334,267 | |||||
| 2,700,000 | 8.75 | 08/15/2020 | 3,547,587 | |||||
| TOTAL U.S. TREASURY OBLIGATIONS | ||||||||
| (Cost $13,185,874) | $ 13,340,321 | |||||||
| Principal
Amount |
Interest
Rate |
Maturity
Date |
Value | |||||
|---|---|---|---|---|---|---|---|---|
| Repurchase Agreement – 16.1% | ||||||||
| Joint Repurchase Agreement Account Ù V | ||||||||
| $ 19,800,000 | 6.62 | % | 11/01/2000 | $ 19,800,000 | ||||
| TOTAL REPURCHASE AGREEMENT | ||||||||
| (Cost $19,800,000) | $ 19,800,000 | |||||||
| TOTAL INVESTMENTS | ||||||||
| (Cost $145,496,515) | $ 143,320,592 | |||||||
®
|
TBA (To Be Assigned) securities are purchased on a forward commitment basis with an approximate (generally +/-2.5%) principal
amount and no definite maturity date. The actual principal amount and maturity date will be determined upon settlement when the specific mortgage pools are assigned.
|
·
|
Represents security with notional or nominal principal amount. The actual effective yield of this security is different than the
stated coupon due to the amortization of related premiums.
|
#
|
Variable rate security. Coupon rate disclosed is that which is in effect at October 31, 2000.
|
°
|
Security is issued with a zero coupon. The interest rate disclosed represents effective yield to maturity.
|
†
|
Security is exempt from registration under Rule 144A of the Securities Act of 1933. Such securities may be resold, normally to
qualified institutional buyers in transactions exempt from registration. Total market value of 144A securities amounted to $1,922,640 as of October 31, 2000.
|
Ù
|
A portion of this security is segregated as collateral for initial margin requirement on futures transactions.
|
V
|
Joint repurchase agreement was entered into on October 31, 2000.
|
| The percentage shown for each investment category reflects the value of investments in that category as a percentage of net assets.
|
| The following graph shows the value as of October 31, 2000, of a $10,000 investment made on January 5, 1994 (commencement of
operations) in the Institutional shares of the Goldman Sachs Core Fixed Income Fund. For comparative purposes, the performance of the Fund’s benchmark (the Lehman Brothers Aggregate Bond Index (“Lehman Aggregate Index”)) is shown. This
performance data represents past performance and should not be considered indicative of future performance which will fluctuate with changes in market conditions. These performance fluctuations will cause an investor’s shares, when redeemed, to be
worth more or less than their original cost. Performance of Class A, Class B, Class C, and Service shares will vary from Institutional shares due to differences in fees and loads.
|
| Core Fixed Income Fund’s Lifetime Performance
|
| Growth of a $10,000 Investment, Distributions Reinvested January 5, 1994 to October 31, 2000.
|
 |
| Average Annual Total Return through October 31, 2000 | Since Inception | Five Years | One Year | |||||||||||||||||||
|---|---|---|---|---|---|---|---|---|---|---|---|---|---|---|---|---|---|---|---|---|---|---|
| Class A shares (commenced May 1, 1997) | ||||||||||||||||||||||
| Excluding sales charges | 6.08% | n/a | 6.48% | |||||||||||||||||||
| Including sales charges | 4.69% | n/a | 1.67% | |||||||||||||||||||
| Class B shares (commenced May 1, 1997) | ||||||||||||||||||||||
| Excluding contingent deferred sales charges | 5.30% | n/a | 5.69% | |||||||||||||||||||
| Including contingent deferred sales charges | 4.39% | n/a | 0.41% | |||||||||||||||||||
| Class C shares (commenced August 15, 1997) | ||||||||||||||||||||||
| Excluding contingent deferred sales charges | 4.60% | n/a | 5.80% | |||||||||||||||||||
| Including contingent deferred sales charges | 4.60% | n/a | 4.74% | |||||||||||||||||||
| Institutional shares (commenced January 5, 1994) | 6.22% | 6.11% | 6.90% | |||||||||||||||||||
| Service shares (commenced March 13, 1996) | 5.89% | n/a | 6.37% | |||||||||||||||||||
| Principal
Amount |
Interest
Rate |
Maturity
Date |
Value | ||||||
|---|---|---|---|---|---|---|---|---|---|
| Corporate Bonds – 33.6% | |||||||||
| Aerospace/Defense – 0.4% | |||||||||
| Raytheon Co. | |||||||||
| $ 250,000 | 6.45 | % | 08/15/2002 | $ 246,607 | |||||
| 1,300,000 | 5.70 | 11/01/2003 | 1,247,870 | ||||||
| $ 1,494,477 | |||||||||
| Airlines – 0.9% | |||||||||
| Continental Airlines, Inc. | |||||||||
| $ 516,004 | 8.56 | % | 07/02/2014 | $ 538,455 | |||||
| 333,968 | 7.26 | 03/15/2020 | 322,222 | ||||||
| Northwest Airlines, Inc. | |||||||||
| 1,924,352 | 8.97 | 01/02/2015 | 1,956,585 | ||||||
| NWA Trust | |||||||||
| 123,025 | 8.26 | 03/10/2006 | 123,644 | ||||||
| US Airways, Inc. | |||||||||
| 514,802 | 6.76 | 04/15/2008 | 467,976 | ||||||
| $ 3,408,882 | |||||||||
| Automotive – 4.0% | |||||||||
| Chrysler Financial Corp. | |||||||||
| $ 430,000 | 6.09 | % | 04/06/2001 | $ 428,987 | |||||
| DaimlerChrysler NA Holding Corp. | |||||||||
| 260,000 | 6.67 | 02/15/2002 | 258,757 | ||||||
| 1,310,000 | 6.90 | 09/01/2004 | 1,298,049 | ||||||
| Ford Capital BV | |||||||||
| 325,000 | 9.88 | 05/15/2002 | 337,980 | ||||||
| Ford Motor Co. | |||||||||
| 785,000 | 6.63 | 10/01/2028 | 650,058 | ||||||
| Ford Motor Credit Co. | |||||||||
| 1,685,000 | 6.00 | 01/14/2003 | 1,643,180 | ||||||
| 1,900,000 | 5.75 | 02/23/2004 | 1,811,715 | ||||||
| 1,190,000 | 6.70 | 07/16/2004 | 1,165,486 | ||||||
| General Motors Acceptance Corp. | |||||||||
| 1,500,000 | 8.50 | 01/01/2003 | 1,540,847 | ||||||
| 1,400,000 | 7.48 | 02/28/2003 | 1,413,205 | ||||||
| 200,000 | 5.75 | 11/10/2003 | 192,529 | ||||||
| 1,450,000 | 6.85 | 06/17/2004 | 1,436,138 | ||||||
| The Hertz Corp. | |||||||||
| 1,075,000 | 6.70 | 06/15/2002 | 1,066,303 | ||||||
| 1,200,000 | 6.00 | 01/15/2003 | 1,175,077 | ||||||
| 500,000 | 7.00 | 07/15/2003 | 499,740 | ||||||
| $ 14,918,051 | |||||||||
| Automotive Parts – 0.5% | |||||||||
| TRW, Inc. | |||||||||
| $ 65,000 | 6.50 | % | 06/01/2002 | $ 63,828 | |||||
| 1,400,000 | † | 6.63 | 06/01/2004 | 1,338,550 | |||||
| 550,000 | 6.05 | 01/15/2005 | 510,150 | ||||||
| $ 1,912,528 | |||||||||
| Broker Dealer – 0.1% | |||||||||
| World Financial Properties† | |||||||||
| $ 455,437 | 6.91 | % | 09/01/2013 | $ 441,169 | |||||
| Principal
Amount |
Interest
Rate |
Maturity
Date |
Value | |||||
|---|---|---|---|---|---|---|---|---|
| Corporate Bonds – (continued) | ||||||||
| Commercial Banks – 4.9% | ||||||||
| Bank of America Corp. | ||||||||
| $ 400,000 | 7.50 | % | 10/15/2002 | $ 403,860 | ||||
| 730,000 | 7.88 | 12/01/2002 | 742,324 | |||||
| 1,200,000 | 9.20 | 05/15/2003 | 1,259,177 | |||||
| 1,155,000 | 6.63 | 06/15/2004 | 1,137,204 | |||||
| 700,000 | 6.38 | 05/15/2005 | 680,039 | |||||
| 110,000 | 7.88 | 05/16/2005 | 112,912 | |||||
| 430,000 | 7.25 | 10/15/2025 | 396,499 | |||||
| Citicorp | ||||||||
| 900,000 | 8.00 | 02/01/2003 | 918,450 | |||||
| 1,200,000 | 7.20 | 06/15/2007 | 1,190,448 | |||||
| Dime Bancorp, Inc. | ||||||||
| 810,000 | 6.38 | 01/30/2001 | 806,209 | |||||
| First Union Corp. | ||||||||
| 500,000 | 7.10 | 08/15/2004 | 495,172 | |||||
| FleetBoston Financial Corp. | ||||||||
| 1,210,000 | 7.25 | 09/15/2005 | 1,209,806 | |||||
| Long Island Savings Bank | ||||||||
| 2,650,000 | 6.20 | 04/02/2001 | 2,642,562 | |||||
| Norwest Financial, Inc. | ||||||||
| 400,000 | 6.38 | 09/15/2002 | 396,705 | |||||
| Security Pacific Corp. | ||||||||
| 995,000 | 11.50 | 11/15/2000 | 996,295 | |||||
| The Bank of New York Co., Inc. | ||||||||
| 1,100,000 | 7.88 | 11/15/2002 | 1,123,944 | |||||
| The Money Store, Inc. | ||||||||
| 630,000 | 7.30 | 12/01/2002 | 634,709 | |||||
| Wells Fargo & Co. | ||||||||
| 2,440,000 | 6.63 | 07/15/2004 | 2,410,232 | |||||
| Wells Fargo Bank NA# | ||||||||
| 550,000 | 7.80 | 06/15/2010 | 564,930 | |||||
| $ 18,121,477 | ||||||||
| Conglomerates – 0.6% | ||||||||
| Tyco International Group SA | ||||||||
| $ 475,000 | 5.88 | % | 11/01/2004 | $ 453,755 | ||||
| 1,850,000 | 6.38 | 06/15/2005 | 1,790,010 | |||||
| $ 2,243,765 | ||||||||
| Consumer Cyclicals – 0.2% | ||||||||
| Cendant Corp. | ||||||||
| $ 865,000 | 7.75 | % | 12/01/2003 | $ 839,003 | ||||
| Credit Card Banks – 0.6% | ||||||||
| Capital One Bank | ||||||||
| $ 1,450,000 | 6.38 | % | 02/15/2003 | $ 1,414,402 | ||||
| 350,000 | 6.65 | 03/15/2004 | 339,433 | |||||
| 100,000 | 8.25 | 06/15/2005 | 100,508 | |||||
| Capital One Financial Corp. | ||||||||
| 355,000 | 7.25 | 12/01/2003 | 348,461 | |||||
| $ 2,202,804 | ||||||||
| Principal
Amount |
Interest
Rate |
Maturity
Date |
Value | |||||
|---|---|---|---|---|---|---|---|---|
| Corporate Bonds – (continued) | ||||||||
| Electric – 1.1% | ||||||||
| Calenergy, Inc. | ||||||||
| $ 1,000,000 | 7.23 | % | 09/15/2005 | $ 988,614 | ||||
| Edison Mission Energy Funding Corp.† | ||||||||
| 90,687 | 6.77 | 09/15/2003 | 88,094 | |||||
| Niagara Mohawk Power Corp. | ||||||||
| 650,000 | 6.88 | 04/01/2003 | 646,627 | |||||
| 400,000 | 7.38 | 08/01/2003 | 402,236 | |||||
| 389,000 | 8.00 | 06/01/2004 | 397,415 | |||||
| Texas Utilities Electric Co. | ||||||||
| 1,500,000 | 6.75 | 04/01/2003 | 1,491,606 | |||||
| $ 4,014,592 | ||||||||
| Energy – 1.6% | ||||||||
| Enron Corp.† | ||||||||
| $ 960,000 | 8.00 | % | 08/15/2005 | $ 975,325 | ||||
| Norsk Hydro ASA | ||||||||
| 460,000 | 7.15 | 01/15/2029 | 422,806 | |||||
| Occidental Petroleum Corp. | ||||||||
| 930,000 | 7.65 | 02/15/2006 | 944,701 | |||||
| 375,000 | 7.20 | 04/01/2028 | 342,122 | |||||
| Osprey Trust/Osprey I, Inc.† | ||||||||
| 545,000 | 7.80 | 01/15/2003 | 545,217 | |||||
| Phillips Petroleum Co. | ||||||||
| 580,000 | 8.50 | 05/25/2005 | 611,873 | |||||
| The Williams Cos., Inc. | ||||||||
| 2,030,000 | 6.13 | 02/15/2002 | 1,988,168 | |||||
| $ 5,830,212 | ||||||||
| Environmental – 0.6% | ||||||||
| Republic Services, Inc. | ||||||||
| $ 1,545,000 | 6.63 | % | 05/15/2004 | $ 1,469,623 | ||||
| Waste Management, Inc.# | ||||||||
| 700,000 | 6.13 | 07/15/2001 | 686,422 | |||||
| $ 2,156,045 | ||||||||
| Finance Companies – 2.4% | ||||||||
| Associates Corp. of North America | ||||||||
| $ 950,000 | 5.75 | % | 11/01/2003 | $ 921,509 | ||||
| 1,200,000 | 5.80 | 04/20/2004 | 1,154,804 | |||||
| 1,000,000 | 6.00 | 07/15/2005 | 955,380 | |||||
| Comdisco, Inc. | ||||||||
| 2,410,000 | 6.13 | 01/15/2003 | 1,759,300 | |||||
| Heller Financial, Inc. | ||||||||
| 1,235,000 | 7.50 | 08/23/2002 | 1,236,013 | |||||
| Household Finance Corp. | ||||||||
| 900,000 | 5.88 | 11/01/2002 | 882,015 | |||||
| 1,300,000 | 7.25 | 07/15/2003 | 1,303,628 | |||||
| 900,000 | 6.00 | 05/01/2004 | 865,409 | |||||
| $ 9,078,058 | ||||||||
| Food – 0.4% | ||||||||
| Nabisco, Inc.# | ||||||||
| $ 1,650,000 | 6.00 | % | 02/15/2001 | $ 1,638,763 | ||||
| Principal
Amount |
Interest
Rate |
Maturity
Date |
Value | |||||
|---|---|---|---|---|---|---|---|---|
| Corporate Bonds – (continued) | ||||||||
| Insurance Companies – 1.2% | ||||||||
| American General Finance Corp. | ||||||||
| $ 1,200,000 | 7.49 | % | 03/03/2003 | $ 1,213,715 | ||||
| 1,500,000 | 5.75 | 11/01/2003 | 1,448,361 | |||||
| AXA Financial, Inc. | ||||||||
| 690,000 | 7.75 | 08/01/2010 | 699,636 | |||||
| Conseco, Inc. | ||||||||
| 945,000 | 8.50 | 10/15/2002 | 741,825 | |||||
| MIC Financing Trust I† | ||||||||
| 360,000 | 8.38 | 02/01/2027 | 323,670 | |||||
| $ 4,427,207 | ||||||||
| Media-Cable – 2.1% | ||||||||
| Cox Communications, Inc. | ||||||||
| $ 635,000 | 7.50 | % | 08/15/2004 | $ 637,532 | ||||
| 220,000 | 7.75 | 08/15/2006 | 222,433 | |||||
| 375,000 | 6.40 | 08/01/2008 | 346,676 | |||||
| 520,000 | 6.80 | 08/01/2028 | 442,094 | |||||
| Lenfest Communications, Inc. | ||||||||
| 1,800,000 | 8.38 | 11/01/2005 | 1,872,358 | |||||
| Time Warner Entertainment Co. | ||||||||
| 850,000 | 9.63 | 05/01/2002 | 876,858 | |||||
| Time Warner, Inc. | ||||||||
| 1,100,000 | 7.98 | 08/15/2004 | 1,125,186 | |||||
| 1,200,000 | 8.18 | 08/15/2007 | 1,249,128 | |||||
| 1,000,000 | 6.85 | 01/15/2026 | 989,724 | |||||
| $ 7,761,989 | ||||||||
| Media-Non Cable – 1.9% | ||||||||
| Chancellor Media Corp. LA | ||||||||
| $ 725,000 | 8.00 | % | 11/01/2008 | $ 726,813 | ||||
| J. Seagram & Sons, Inc. | ||||||||
| 1,050,000 | 6.25 | 12/15/2001 | 1,043,309 | |||||
| News America Holdings, Inc. | ||||||||
| 540,000 | 8.00 | 10/17/2016 | 511,666 | |||||
| 55,000 | 8.15 | 10/17/2036 | 50,940 | |||||
| PanAmSat Corp. | ||||||||
| 880,000 | 6.13 | 01/15/2005 | 815,725 | |||||
| Viacom, Inc. | ||||||||
| 2,250,000 | 6.75 | 01/15/2003 | 2,236,252 | |||||
| 455,000 | 7.75 | 06/01/2005 | 464,737 | |||||
| 690,000 | 7.70 | 07/30/2010 | 703,531 | |||||
| Westinghouse Electric Corp. | ||||||||
| 665,000 | 6.88 | 09/01/2003 | 660,801 | |||||
| $ 7,213,774 | ||||||||
| Mortgage Banks – 1.5% | ||||||||
| Countrywide Capital Corp. III | ||||||||
| $ 1,080,000 | 8.05 | % | 06/15/2027 | $ 957,530 | ||||
| Countrywide Funding Corp. | ||||||||
| 1,000,000 | 6.97 | 03/28/2003 | 994,964 | |||||
| Countrywide Home Loans, Inc. | ||||||||
| 400,000 | 6.45 | 02/27/2003 | 393,763 | |||||
| 200,000 | 6.70 | 03/10/2005 | 193,856 | |||||
| Principal
Amount |
Interest
Rate |
Maturity
Date |
Value | |||||
|---|---|---|---|---|---|---|---|---|
| Corporate Bonds – (continued) | ||||||||
| Mortgage Banks – (continued) | ||||||||
| Homeside Lending, Inc. | ||||||||
| $ 1,760,000 | 6.20 | % | 05/15/2003 | $ 1,722,850 | ||||
| 1,360,000 | 6.75 | 08/01/2004 | 1,335,584 | |||||
| $ 5,598,547 | ||||||||
| Paper – 0.3% | ||||||||
| International Paper Co.† | ||||||||
| $ 1,030,000 | 8.00 | % | 07/08/2003 | $ 1,046,887 | ||||
| REIT – 0.6% | ||||||||
| Liberty Property LP | ||||||||
| $ 115,000 | 7.10 | % | 08/15/2004 | $ 112,199 | ||||
| Meditrust Cos. | ||||||||
| 355,000 | 7.82 | 09/10/2026 | 291,100 | |||||
| Simon Property Group, Inc. | ||||||||
| 1,495,000 | 6.63 | 06/15/2003 | 1,455,651 | |||||
| 500,000 | 6.75 | 02/09/2004 | 481,531 | |||||
| $ 2,340,481 | ||||||||
| Retailers – 1.1% | ||||||||
| Federated Department Stores, Inc. | ||||||||
| $ 35,000 | 8.13 | % | 10/15/2002 | $ 34,922 | ||||
| 700,000 | 8.50 | 06/15/2003 | 703,851 | |||||
| Sears Roebuck Acceptance Corp. | ||||||||
| 500,000 | 6.41 | 11/19/2002 | 494,135 | |||||
| 1,600,000 | 6.00 | 03/20/2003 | 1,554,043 | |||||
| 820,000 | 6.71 | 09/17/2003 | 806,522 | |||||
| The Pep Boys-Manny, Moe & Jack | ||||||||
| 550,000 | 6.75 | 03/10/2004 | 341,000 | |||||
| $ 3,934,473 | ||||||||
| Supermarkets – 0.9% | ||||||||
| Ahold Finance USA, Inc. | ||||||||
| $ 490,000 | 8.25 | % | 07/15/2010 | $ 496,809 | ||||
| Fred Meyer, Inc. | ||||||||
| 700,000 | 7.38 | 03/01/2005 | 692,097 | |||||
| 575,000 | 7.45 | 03/01/2008 | 555,902 | |||||
| Safeway, Inc. | ||||||||
| 1,565,000 | 6.05 | 11/15/2003 | 1,508,565 | |||||
| $ 3,253,373 | ||||||||
| Telecommunications – 3.1% | ||||||||
| 360 Communications Co. | ||||||||
| $ 1,015,000 | 7.13 | % | 03/01/2003 | $ 1,010,947 | ||||
| Bellsouth Capital Funding Corp. | ||||||||
| 675,000 | 7.88 | 02/15/2030 | 687,783 | |||||
| Deutsche Telekom International Finance B.V. | ||||||||
| 1,170,000 | 7.75 | 06/15/2005 | 1,189,910 | |||||
| GTE California, Inc. | ||||||||
| 370,000 | 7.65 | 03/15/2007 | 378,215 | |||||
| 330,000 | 6.75 | 05/15/2027 | 294,000 | |||||
| GTE Corp. | ||||||||
| 330,000 | 6.94 | 04/15/2028 | 300,962 | |||||
| Principal
Amount |
Interest
Rate |
Maturity
Date |
Value | |||||
|---|---|---|---|---|---|---|---|---|
| Corporate Bonds – (continued) | ||||||||
| Telecommunications – (continued) | ||||||||
| MCI WorldCom, Inc. | ||||||||
| $ 450,000 | 8.88 | % | 01/15/2006 | $ 463,571 | ||||
| Metronet Communications Corp.§ | ||||||||
| 1,045,000 | 0.00/9.95 | 06/15/2008 | 856,900 | |||||
| New England Telephone & Telegraph Co. | ||||||||
| 200,000 | 7.65 | 06/15/2007 | 204,307 | |||||
| Qwest Capital Funding, Inc.† | ||||||||
| 700,000 | 7.75 | 08/15/2006 | 709,772 | |||||
| Sprint Capital Corp. | ||||||||
| 1,695,000 | 5.88 | 05/01/2004 | 1,617,305 | |||||
| Telecom de Puerto Rico† | ||||||||
| 470,000 | 6.15 | 05/15/2002 | 460,299 | |||||
| 590,000 | 6.65 | 05/15/2006 | 561,574 | |||||
| US West Capital Funding, Inc.† | ||||||||
| 975,000 | 6.88 | 07/15/2028 | 858,187 | |||||
| Vodafone AirTouch PLC† | ||||||||
| 1,950,000 | 7.75 | 02/15/2010 | 1,979,815 | |||||
| $ 11,573,547 | ||||||||
| Tobacco – 1.2% | ||||||||
| Philip Morris Cos., Inc. | ||||||||
| $ 550,000 | 8.75 | % | 06/01/2001 | $ 553,949 | ||||
| 2,250,000 | 7.13 | 08/15/2002 | 2,226,598 | |||||
| 500,000 | 7.50 | 04/01/2004 | 495,248 | |||||
| R.J. Reynolds Tobacco Holdings, Inc. | ||||||||
| 1,380,000 | 7.38 | 05/15/2003 | 1,307,012 | |||||
| $ 4,582,807 | ||||||||
| Yankee Banks – 1.4% | ||||||||
| Asian Development Bank | ||||||||
| $ 2,000,000 | 5.82 | % | 06/16/2028 | $ 1,877,862 | ||||
| Bayerische Landesbank Girozentrale | ||||||||
| 600,000 | 5.88 | 12/01/2008 | 543,670 | |||||
| HSBC Holdings PLC | ||||||||
| 450,000 | 7.50 | 07/15/2009 | 449,640 | |||||
| Merita Bank Ltd. | ||||||||
| 650,000 | 6.50 | 04/01/2009 | 602,034 | |||||
| National Westminster Bank PLC | ||||||||
| 1,140,000 | 7.38 | 10/01/2009 | 1,127,893 | |||||
| Republic New York Corp. | ||||||||
| 440,000 | 7.75 | 05/15/2009 | 444,174 | |||||
| $ 5,045,273 | ||||||||
| TOTAL CORPORATE BONDS | ||||||||
| (Cost $127,462,240) | $ 125,078,184 | |||||||
| Principal
Amount |
Interest
Rate |
Maturity
Date |
Value | |||||
|---|---|---|---|---|---|---|---|---|
| Agency Debentures – 2.2% | ||||||||
| AID-Israel° | ||||||||
| $ 6,000,000 | 6.58 | % | 05/15/2023 | $ 1,398,571 | ||||
| Federal National Mortgage Association | ||||||||
| 900,000 | 7.00 | 07/15/2005 | 916,327 | |||||
| 3,690,000 | 7.25 | 01/15/2010 | 3,823,648 | |||||
| Small Business Administration | ||||||||
| 2,236,080 | 6.30 | 06/01/2018 | 2,141,898 | |||||
| TOTAL AGENCY DEBENTURES | ||||||||
| (Cost $8,528,918) | $ 8,280,444 | |||||||
| Asset-Backed Securities – 10.7% | ||||||||
| Auto – 2.6% | ||||||||
| Onyx Acceptance Auto Trust Series 1999-D, Class A4 | ||||||||
| $ 2,600,000 | 7.00 | % | 11/15/2004 | $ 2,613,702 | ||||
| Rental Car Finance Corp. Series 1997-1, Class A2† | ||||||||
| 2,500,000 | 6.45 | 08/25/2005 | 2,458,065 | |||||
| WFS Financial Owner Trust Series 2000-B, Class A4 | ||||||||
| 4,500,000 | 7.84 | 02/20/2006 | 4,588,335 | |||||
| $ 9,660,102 | ||||||||
| Credit Card – 3.4% | ||||||||
| Citibank Credit Card Master Trust I Series 1999-7, Class A | ||||||||
| $ 5,000,000 | 6.65 | % | 11/15/2006 | $ 4,969,149 | ||||
| Discover Card Master Trust I Series 1996-4, Class B# | ||||||||
| 850,000 | 7.17 | 10/16/2013 | 843,642 | |||||
| MBNA Master Credit Card Trust Series 2000-1, Class A | ||||||||
| 7,000,000 | 6.90 | 01/15/2008 | 7,036,610 | |||||
| $ 12,849,401 | ||||||||
| Home Equity – 2.3% | ||||||||
| Aames Mortgage Trust Series 1998-B, Class A6F | ||||||||
| $ 3,500,000 | 6.46 | % | 09/15/2028 | $ 3,389,767 | ||||
| IMC Home Equity Loan Trust Series 1998-3, Class A8 | ||||||||
| 5,200,000 | 6.34 | 08/20/2029 | 5,024,968 | |||||
| $ 8,414,735 | ||||||||
| Lease – 0.9% | ||||||||
| AESOP Funding II LLC Series 1998-1, Class A† | ||||||||
| $ 3,400,000 | 6.14 | % | 05/20/2006 | $ 3,268,488 | ||||
| Manufactured Housing – 1.5% | ||||||||
| Green Tree Financial Corp. Series 1997-6, Class A8 | ||||||||
| $ 3,197,138 | 7.07 | % | 01/15/2029 | $ 3,071,203 | ||||
| Mid-State Trust Series 4, Class A | ||||||||
| 2,355,289 | 8.33 | 04/01/2030 | 2,421,284 | |||||
| $ 5,492,487 | ||||||||
| TOTAL ASSET-BACKED SECURITIES | ||||||||
| (Cost $40,175,631) | $ 39,685,213 | |||||||
| Principal
Amount |
Interest
Rate |
Maturity
Date |
Value | |||||
|---|---|---|---|---|---|---|---|---|
| Emerging Market Debt – 2.2% | ||||||||
| Korea Electric Power Corp. | ||||||||
| 760,000 | 7.75 | % | 04/01/2013 | $ 697,685 | ||||
| Pemex Finance Ltd. | ||||||||
| 600,000 | 8.02 | 05/15/2007 | 615,462 | |||||
| 700,000 | 9.15 | 11/15/2018 | 775,084 | |||||
| Republic of Korea | ||||||||
| 1,110,000 | 8.88 | 04/15/2008 | 1,157,175 | |||||
| Republic of Poland# | ||||||||
| 780,000 | 3.50 | 10/27/2024 | 487,988 | |||||
| 1,360,000 | 4.25 | 10/27/2024 | 924,800 | |||||
| State of Qatar | ||||||||
| 370,000 | 9.50 | 05/21/2009 | 371,850 | |||||
| 250,000 | 9.75 | † | 06/15/2030 | 241,250 | ||||
| 460,000 | 9.75 | 06/15/2030 | 443,900 | |||||
| United Mexican States | ||||||||
| 760,000 | 10.38 | 02/17/2009 | 804,650 | |||||
| 560,000 | 9.88 | 02/01/2010 | 582,050 | |||||
| YPF Sociedad Anonima | ||||||||
| 48,444 | 7.00 | 10/26/2002 | 47,899 | |||||
| 874,313 | 7.50 | 10/26/2002 | 874,313 | |||||
| TOTAL EMERGING MARKET DEBT | ||||||||
| (Cost $7,974,841) | $ 8,024,106 | |||||||
| Foreign Debt Obligations € – 5.1% | ||||||||
| Euro Currency – 4.0% | ||||||||
| Federal Republic of Germany | ||||||||
| EUR 8,700,000 | 5.25 | % | 07/04/2010 | $ 7,397,072 | ||||
| Republic of France | ||||||||
| 8,900,000 | 5.00 | 07/12/2005 | 7,501,941 | |||||
| $ 14,899,013 | ||||||||
| New Zealand – 1.1% | ||||||||
| Government of New Zealand | ||||||||
| NZD 9,600,000 | 8.00 | 11/15/2006 | $ 4,063,211 | |||||
| TOTAL FOREIGN DEBT OBLIGATIONS | ||||||||
| (Cost $19,901,606) | $ 18,962,224 | |||||||
| Principal
Amount |
Interest
Rate |
Maturity
Date |
Value | |||||
|---|---|---|---|---|---|---|---|---|
| Mortgage Backed Obligations – 41.4% | ||||||||
| Federal Home Loan Mortgage Corp. (FHLMC) – 5.9% | ||||||||
| $ 106,648 | 7.00 | % | 10/01/2017 | $ 105,543 | ||||
| 3,578,396 | 6.00 | 09/01/2028 | 3,364,265 | |||||
| 953,226 | 6.00 | 11/01/2028 | 896,185 | |||||
| 1,927,251 | 6.00 | 01/01/2029 | 1,811,924 | |||||
| 6,392,239 | 8.00 | 06/01/2030 | 6,479,877 | |||||
| 2,601,311 | 8.00 | 07/01/2030 | 2,636,975 | |||||
| 2,999,918 | 8.00 | 08/01/2030 | 3,041,047 | |||||
| 3,646,696 | 8.00 | 09/01/2030 | 3,696,692 | |||||
| $ 22,032,508 | ||||||||
| Federal National Mortgage Association (FNMA) – 12.6% | ||||||||
| $ 3,985,944 | 6.00 | % | 01/01/2019 | $ 3,806,338 | ||||
| 61,254 | 6.50 | 02/01/2026 | 59,066 | |||||
| 977,361 | 7.00 | 04/01/2026 | 960,569 | |||||
| 161,622 | 6.50 | 08/01/2026 | 156,324 | |||||
| 144,502 | 6.50 | 09/01/2027 | 139,297 | |||||
| 51,420 | 6.50 | 11/01/2027 | 49,584 | |||||
| 254,130 | 6.00 | 04/01/2028 | 238,824 | |||||
| 234,414 | 6.50 | 04/01/2028 | 225,590 | |||||
| 1,766,084 | 6.50 | 06/01/2028 | 1,699,609 | |||||
| 33,496 | 6.00 | 09/01/2028 | 31,479 | |||||
| 1,063,065 | 6.50 | 09/01/2028 | 1,023,052 | |||||
| 36,553 | 6.00 | 10/01/2028 | 34,351 | |||||
| 344,683 | 6.00 | 11/01/2028 | 323,923 | |||||
| 3,907,782 | 6.00 | 12/01/2028 | 3,672,416 | |||||
| 5,586,633 | 6.00 | 01/01/2029 | 5,250,150 | |||||
| 380,606 | 6.50 | 01/01/2029 | 366,033 | |||||
| 1,722,411 | 6.00 | 02/01/2029 | 1,616,371 | |||||
| 243,529 | 6.50 | 02/01/2029 | 234,205 | |||||
| 809,176 | 7.00 | 02/01/2029 | 793,567 | |||||
| 425,334 | 6.00 | 03/01/2029 | 399,716 | |||||
| 396,979 | 6.50 | 03/01/2029 | 381,779 | |||||
| 567,015 | 7.00 | 03/01/2029 | 556,259 | |||||
| 324,831 | 6.00 | 04/01/2029 | 305,266 | |||||
| 3,439,070 | 6.50 | 04/01/2029 | 3,307,691 | |||||
| 140,763 | 6.00 | 05/01/2029 | 132,047 | |||||
| 449,266 | 6.50 | 05/01/2029 | 432,064 | |||||
| 700,904 | 7.00 | 05/01/2029 | 687,608 | |||||
| 719,891 | 6.50 | 06/01/2029 | 692,327 | |||||
| 370,546 | 6.50 | 07/01/2029 | 356,358 | |||||
| 259,994 | 6.00 | 10/01/2029 | 245,647 | |||||
| 587,534 | 7.00 | 12/01/2029 | 576,200 | |||||
| 421,890 | 7.00 | 01/01/2030 | 413,886 | |||||
| 492,144 | 7.50 | 02/01/2030 | 491,460 | |||||
| 408,931 | 7.00 | 04/01/2030 | 401,043 | |||||
| 448,461 | 8.50 | 04/01/2030 | 458,296 | |||||
| 1,279,013 | 8.50 | 07/01/2030 | 1,315,001 | |||||
| 178,374 | 8.50 | 09/01/2030 | 182,285 | |||||
| 973,486 | 8.50 | 10/01/2030 | 994,835 | |||||
| 2,000,000 | 6.50 | TBA-30 yr® | 1,921,880 | |||||
| 1,000,000 | 7.00 | TBA-30 yr® | 979,690 | |||||
| 9,000,000 | 8.00 | TBA-30 yr® | 9,098,460 | |||||
| 2,026,514 | 8.50 | TBA-30 yr® | 2,070,854 | |||||
| $ 47,081,400 | ||||||||
| Principal
Amount |
Interest
Rate |
Maturity
Date |
Value | |||||
|---|---|---|---|---|---|---|---|---|
| Mortgage Backed Obligations – (continued) | ||||||||
| Government National Mortgage Association (GNMA) – 10.6% | ||||||||
| $ 148,788 | 8.00 | % | 02/15/2017 | $ 152,467 | ||||
| 503,353 | 6.50 | 06/15/2023 | 489,128 | |||||
| 604,765 | 7.00 | 07/15/2023 | 598,995 | |||||
| 527,192 | 6.50 | 08/15/2023 | 512,293 | |||||
| 1,101,722 | 6.50 | 09/15/2023 | 1,070,588 | |||||
| 3,539,184 | 6.50 | 10/15/2023 | 3,439,166 | |||||
| 393,021 | 7.00 | 10/15/2023 | 389,118 | |||||
| 3,291,600 | 6.50 | 11/15/2023 | 3,198,579 | |||||
| 9,279,674 | 6.50 | 12/15/2023 | 9,017,431 | |||||
| 1,016,145 | 6.50 | 01/15/2024 | 987,144 | |||||
| 544,639 | 6.50 | 02/15/2024 | 529,095 | |||||
| 402,662 | 6.50 | 03/15/2024 | 391,170 | |||||
| 2,925,448 | 6.50 | 04/15/2024 | 2,841,956 | |||||
| 1,321,874 | 6.50 | 05/15/2024 | 1,284,147 | |||||
| 27,860 | 6.50 | 02/15/2026 | 27,029 | |||||
| 2,736,827 | 6.50 | 03/15/2026 | 2,655,160 | |||||
| 2,000,000 | 7.00 | 08/20/2027 | 1,964,064 | |||||
| 88,408 | 7.00 | 02/15/2028 | 87,247 | |||||
| 480,854 | 6.50 | 07/15/2028 | 464,606 | |||||
| 35,940 | 7.00 | 09/15/2028 | 35,467 | |||||
| 43,690 | 7.00 | 01/15/2029 | 43,102 | |||||
| 79,447 | 7.00 | 04/15/2029 | 78,380 | |||||
| 167,381 | 7.00 | 05/15/2029 | 165,131 | |||||
| 40,232 | 7.00 | 07/15/2029 | 39,691 | |||||
| 808,963 | 7.00 | 10/15/2029 | 798,090 | |||||
| 612,856 | 7.50 | 10/15/2029 | 615,430 | |||||
| 841,784 | 7.00 | 11/15/2029 | 830,470 | |||||
| 1,071,358 | 7.50 | 11/15/2029 | 1,075,858 | |||||
| 816,165 | 8.00 | 12/15/2029 | 829,975 | |||||
| 759,176 | 8.00 | 01/15/2030 | 771,793 | |||||
| 24,947 | 8.00 | 06/15/2030 | 25,361 | |||||
| 1,645,595 | 8.00 | 07/15/2030 | 1,672,945 | |||||
| 354,405 | 8.00 | 08/15/2030 | 360,295 | |||||
| 953,788 | 7.00 | TBA-30 yra | 1,963,438 | |||||
| $ 39,404,809 | ||||||||
| Collateralized Mortgage Obligations – 12.2% | ||||||||
| Inverse Floater# – 1.7% | ||||||||
| FHLMC Series 1684, Class QC | ||||||||
| $ 2,937,930 | 8.63 | % | 03/15/2024 | $ 2,731,340 | ||||
| FNMA Remic Trust Series 1993-138, Class SM | ||||||||
| 3,000,000 | 9.47 | 12/25/2021 | 3,049,554 | |||||
| Prudential Home Mortgage Securities Co. Series 1992-99,
Class A5 |
||||||||
| 720,753 | 5.33 | 12/25/2007 | 704,580 | |||||
| $ 6,485,474 | ||||||||
| IOette· # – 0.1% | ||||||||
| FNMA Series 1992-24, Class N | ||||||||
| $ 12,149 | 14.89 | % | 03/25/2007 | $ 193,794 | ||||
| Principal
Amount |
Interest
Rate |
Maturity
Date |
Value | |||||
|---|---|---|---|---|---|---|---|---|
| Mortgage Backed Obligations – (continued) | ||||||||
| Non-Agency CMOs – 3.9% | ||||||||
| Asset Securitization Corp. Series 1997-D4, Class A1D | ||||||||
| $ 900,000 | 7.49 | % | 04/14/2029 | $ 917,314 | ||||
| Commercial Mortgage Acceptance Corp. Series 1998-C1,
Class A2 |
||||||||
| 2,200,000 | 6.49 | 05/15/2008 | 2,120,665 | |||||
| CS First Boston Mortgage Sercurities Corp. Series 1997-C2,
Class A3 |
||||||||
| 3,250,000 | 6.55 | 11/17/2007 | 3,154,879 | |||||
| First Union-Lehman Brothers Commercial Mortgage Services
Series 1997-C1, Class A2 |
||||||||
| 600,000 | 7.30 | 12/18/2006 | 607,832 | |||||
| First Union-Lehman Brothers Commercial Mortgage Services
Series 1997-C2, Class A2 |
||||||||
| 1,075,000 | 6.60 | 05/18/2007 | 1,060,578 | |||||
| JP Morgan Commercial Mortgage Finance Corp. Series 1999-
C8, Class A2 |
||||||||
| 3,000,000 | 7.40 | 07/15/2031 | 3,044,518 | |||||
| Merrill Lynch Mortgage Investors, Inc. Series 1998-C2,
Class A2 |
||||||||
| 3,690,000 | 6.39 | 02/15/2030 | 3,553,544 | |||||
| $ 14,459,330 | ||||||||
| Planned Amortization Class (PAC) CMOs – 1.4% | ||||||||
| FHLMC Series 2055, Class OD | ||||||||
| $ 3,000,000 | 6.00 | % | 01/15/2012 | $ 2,876,670 | ||||
| FHLMC Series 2149, Class TF | ||||||||
| 1,250,000 | 6.50 | 05/15/2024 | 1,216,200 | |||||
| FNMA Remic Trust Series 1999-28, Class PL | ||||||||
| 1,000,000 | 6.00 | 01/25/2028 | 931,484 | |||||
| $ 5,024,354 | ||||||||
| Regular Floater CMOs# – 2.7% | ||||||||
| FHLMC Series 1632, Class FB | ||||||||
| $ 3,833,333 | 7.83 | % | 11/15/2023 | $ 3,925,966 | ||||
| FNMA Remic Trust 1993 138 Class FM | ||||||||
| 6,500,000 | 5.13 | 12/25/2021 | 6,148,220 | |||||
| $ 10,074,186 | ||||||||
| Sequential Fixed Rate CMOs – 1.0% | ||||||||
| Residential Funding Mortgage Securities I Series 1998-S2,
Class A3 |
||||||||
| $ 4,000,000 | 7.00 | % | 01/25/2028 | $ 3,741,240 | ||||
| Principal
Amount |
Interest
Rate |
Maturity
Date |
Value | |||||
|---|---|---|---|---|---|---|---|---|
| Mortgage Backed Obligations – (continued) | ||||||||
| Support – 1.4% | ||||||||
| Countrywide Funding Corp. Series 1993-2, Class A5A | ||||||||
| $ 2,398,914 | 6.50 | % | 10/25/2008 | $ 2,327,378 | ||||
| Federal National Mortgage Association | ||||||||
| 3,250,455 | 6.25 | 03/25/2029 | 3,039,176 | |||||
| $ 5,366,554 | ||||||||
| TOTAL COLLATERALIZED
MORTGAGE OBLIGATIONS |
$ 45,344,932 | |||||||
| TOTAL MORTGAGE BACKED OBLIGATIONS | ||||||||
| (Cost $153,595,783) | $ 153,863,649 | |||||||
| Sovereign Credit – 1.1% | ||||||||
| Province of Quebec | ||||||||
| $ 2,935,000 | 7.50 | % | 07/15/2023 | $ 2,913,651 | ||||
| 320,000 | 5.74 | # | 03/02/2026 | 318,433 | ||||
| 595,000 | 7.50 | 09/15/2029 | 601,547 | |||||
| Province of Saskatchewan | ||||||||
| 275,000 | 8.50 | 07/15/2022 | 310,095 | |||||
| TOTAL SOVEREIGN CREDIT | ||||||||
| (Cost $4,280,368) | $ 4,143,726 | |||||||
| U.S. Treasury Obligations – 3.7% | ||||||||
| United States Treasury Interest-Only Stripped Security· | ||||||||
| $ 2,600,000 | 6.02 | % | 05/15/2008 | $ 1,681,001 | ||||
| United States Treasury Principal-Only Stripped Securities° | ||||||||
| 11,880,000 | 6.17 | 11/15/2009 | 6,829,527 | |||||
| 560,000 | 6.18 | 05/15/2018 | 196,884 | |||||
| 1,780,000 | 6.18 | 05/15/2020 | 555,483 | |||||
| 2,100,000 | 6.06 | 11/15/2024 | 507,043 | |||||
| 4,710,000 | 6.04 | 08/15/2025 | 1,095,824 | |||||
| 13,330,000 | 6.01 | 08/15/2026 | 2,931,520 | |||||
| TOTAL U.S. TREASURY OBLIGATIONS | ||||||||
| (Cost $13,361,064) | $ 13,797,282 | |||||||
| Principal
Amount |
Interest
Rate |
Maturity
Date |
Value | ||||
|---|---|---|---|---|---|---|---|
| Repurchase Agreement – 1.4% | |||||||
| Joint Repurchase Agreement Account_V | |||||||
| $ 5,100,000 | 6.62% | 11/01/2000 | $ 5,100,000 | ||||
| TOTAL REPURCHASE AGREEMENT | |||||||
| (Cost $5,100,000) | $ 5,100,000 | ||||||
| TOTAL INVESTMENTS | |||||||
| (Cost $380,380,451) | $ 376,934,828 | ||||||
†
|
Securities are exempt from registration under Rule 144A of the Securities Act of 1933. Such securities may be resold, normally to
qualified institutional buyers in transactions exempt from registration. Total market value of Rule 144A securities amounted to $15,296,362 as of October 31, 2000.
|
#
|
Variable rate security. Coupon rate disclosed is that which is in effect at October 31, 2000.
|
a
|
TBA (To Be Assigned) securities are purchased on a forward commitment basis with an approximate (generally +/-2.5%) principal
amount and no definite maturity date. The actual principal amount and maturity date will be determined upon settlement when the specific mortgage pools are assigned.
|
·
|
Represents security with notional or nominal principal amount. The actual effective yield of this security is different than the
stated coupon due to amortization of related premiums.
|
§
|
These securities are issued with a zero coupon which increases to the stated rate at a set date in the future.
|
°
|
This security is issued with a zero coupon. The interest rate disclosed for this security represents effective yield to maturity.
|
€
|
The principal amount of each security is stated in the currency in which the bond is denominated. See below.
|
| EUR = Euro currency
|
| NZD = New Zealand Dollar
|
Ù
|
A portion of this security is segregated as collateral for initial margin requirement on futures transactions.
|
V
|
Joint repurchase agreement was entered into on October 31, 2000.
|
| The percentage shown for each investment category reflects the value of investments in that category as a percentage of net assets.
|
| The following graph shows the value as of October 31, 2000, of a $10,000 investment made on September 1, 1991 in Class A shares
(with the maximum sales charge of 4.5%) of the Goldman Sachs Global Income Fund. For comparative purposes, the performance of the Fund’s benchmark (the J.P. Morgan Global Government Bond Index hedged to U.S. Dollars (the “J.P. Morgan GGB Index -
$ Hedged”)) is shown. This performance data represents past performance and should not be considered indicative of future performance which will fluctuate with changes in market conditions. These performance fluctuations will cause an investor’s
shares, when redeemed, to be worth more or less than their original cost. Performance of Class B, Class C, Institutional and Service shares will vary from Class A due to differences in fees and loads.
|
| Global Income Fund’s Lifetime Performance
|
| Growth of a $10,000 Investment, Distributions Reinvested September 1, 1991 to October 31, 2000.(a)
|
 |
| Average Annual Total Return through October 31, 2000 | Since Inception | Five Years | One Year | |||||||||||||||||||
|---|---|---|---|---|---|---|---|---|---|---|---|---|---|---|---|---|---|---|---|---|---|---|
| Class A shares (commenced August 2, 1991) | ||||||||||||||||||||||
| Excluding sales charges | 7.24% | 7.17% | 5.58% | |||||||||||||||||||
| Including sales charges | 6.70% | 6.19% | 0.84% | |||||||||||||||||||
| Class B shares (commenced May 1, 1996) | ||||||||||||||||||||||
| Excluding contingent deferred sales charges | 6.43% | n/a | 5.14% | |||||||||||||||||||
| Including contingent deferred sales charges | 5.98% | n/a | -0.04% | |||||||||||||||||||
| Class C shares (commenced August 15, 1997) | ||||||||||||||||||||||
| Excluding contingent deferred sales charges | 5.23% | n/a | 5.13% | |||||||||||||||||||
| Including contingent deferred sales charges | 5.23% | n/a | 4.09% | |||||||||||||||||||
| Institutional shares (commenced August 1, 1995) | 8.30% | 7.80% | 6.27% | |||||||||||||||||||
| Service shares (commenced March 12, 1997) | 6.10% | n/a | 5.76% | |||||||||||||||||||
(a)
|
For comparative purposes, initial investments are assumed to be made on the first day of the month following commencement of
operations.
|
| Principal
AmountÎ |
Interest
Rate |
Maturity
Date |
Value | |||||
|---|---|---|---|---|---|---|---|---|
| Foreign Debt Obligations – 61.2% | ||||||||
| British Pound Sterling – 6.4% | ||||||||
| Abbey National Treasury | ||||||||
| GBP 4,000,000 | 8.00 | % | 04/02/2003 | $ 5,999,478 | ||||
| Eastern Electricity PLC | ||||||||
| 550,000 | 8.38 | 03/31/2004 | 829,312 | |||||
| General Motors Acceptance Corp. | ||||||||
| 450,000 | 6.50 | 03/23/2004 | 646,071 | |||||
| Lehman Brothers Holdings PLC | ||||||||
| 2,900,000 | 6.95 | 06/22/2004 | 4,193,000 | |||||
| Lloyds Bank PLC | ||||||||
| 2,900,000 | 7.75 | 06/18/2007 | 4,513,345 | |||||
| North American Capital Corp. | ||||||||
| 1,300,000 | 8.25 | 11/17/2003 | 1,934,201 | |||||
| Royal Bank of Scotland PLC | ||||||||
| 1,500,000 | 8.38 | 01/29/2007 | 2,342,415 | |||||
| United Kingdom Treasury | ||||||||
| 1,400,000 | 7.25 | 12/07/2007 | 2,245,374 | |||||
| 2,300,000 | 9.00 | 08/06/2012 | 4,444,023 | |||||
| 1,500,000 | 8.00 | 06/07/2021 | 3,093,787 | |||||
| 3,700,000 | 6.00 | 12/07/2028 | 6,550,658 | |||||
| Vodafone AirTouch PLC | ||||||||
| 1,500,000 | 7.50 | 03/19/2004 | 2,220,684 | |||||
| $ 39,012,348 | ||||||||
| Canadian Dollar – 2.2% | ||||||||
| Government of Canada | ||||||||
| CAD 20,800,000 | 5.50 | % | 06/01/2009 | $ 13,294,162 | ||||
| Danish Krone – 1.8% | ||||||||
| Kingdom of Denmark | ||||||||
| DKK 69,000,000 | 8.00 | % | 05/15/2003 | $ 8,311,134 | ||||
| 22,000,000 | 8.00 | 03/15/2006 | 2,790,028 | |||||
| $ 11,101,162 | ||||||||
| Euro Currency – 25.8% | ||||||||
| Countrywide Home Loans, Inc. | ||||||||
| EUR 2,500,000 | 4.13 | % | 07/22/2002 | $ 2,059,863 | ||||
| Federal Republic of Germany | ||||||||
| 2,450,000 | 6.00 | 07/04/2007 | 2,165,394 | |||||
| 100,000 | 4.50 | 07/04/2009 | 80,638 | |||||
| General Motors Acceptance Corp.† | ||||||||
| 4,800,000 | 5.00 | 01/18/2005 | 3,935,808 | |||||
| Government of France | ||||||||
| 21,800,000 | 4.50 | 07/12/2002 | 18,303,393 | |||||
| 34,000,000 | 3.50 | 07/12/2004 | 27,385,873 | |||||
| 18,400,000 | 6.50 | 10/25/2006 | 16,618,945 | |||||
| 9,800,000 | 5.50 | 04/25/2010 | 8,397,999 | |||||
| 900,000 | 8.50 | 10/25/2019 | 1,013,942 | |||||
| 17,500,000 | 5.50 | 04/25/2029 | 14,431,366 | |||||
| Kingdom of Belgium | ||||||||
| 4,300,000 | 6.50 | 03/31/2005 | 3,805,680 | |||||
| 4,300,000 | 4.75 | 09/28/2005 | 3,552,283 | |||||
| Osprey Trust† | ||||||||
| 2,900,000 | 6.38 | 01/15/2003 | 2,466,601 | |||||
| Principal
AmountÎ |
Interest
Rate |
Maturity
Date |
Value | |||||
|---|---|---|---|---|---|---|---|---|
| Foreign Debt Obligations – (continued) | ||||||||
| Euro Currency – (continued) | ||||||||
| Republic of Italy | ||||||||
| EUR 21,900,000 | 3.25 | % | 04/15/2004 | $ 17,387,869 | ||||
| 13,810,000 | 4.25 | 11/01/2009 | 10,663,777 | |||||
| 18,100,000 | 6.50 | 11/01/2027 | 16,417,272 | |||||
| Standard Chartered Bank PLC | ||||||||
| 1,449,000 | 5.38 | 05/06/2009 | 1,112,979 | |||||
| Tecnost International NV | ||||||||
| 3,800,000 | 6.58 | 07/30/2009 | 2,989,741 | |||||
| Tyco International Group SA | ||||||||
| 6,120,000 | 6.13 | 04/04/2007 | 5,086,242 | |||||
| $ 157,875,665 | ||||||||
| German Mark – 1.3% | ||||||||
| Citicorp | ||||||||
| DEM 4,500,000 | 6.25 | % | 09/19/2009 | $ 1,919,783 | ||||
| 1,100,000 | 5.50 | 06/30/2010 | 441,436 | |||||
| Gallaher Group | ||||||||
| 5,266,306 | 5.88 | 08/06/2008 | 4,183,305 | |||||
| Royal Bank of Scotland PLC | ||||||||
| 3,700,000 | 5.25 | 07/22/2008 | 1,516,132 | |||||
| $ 8,060,656 | ||||||||
| Greek Drachma – 1.9% | ||||||||
| Republic of Greece | ||||||||
| GRD 4,650,000,000 | 6.30 | % | 01/29/2009 | $ 11,852,759 | ||||
| Japanese Yen – 18.7% | ||||||||
| European Investment Bank | ||||||||
| JPY 200,000,000 | 2.13 | % | 09/20/2007 | $ 1,905,692 | ||||
| Government of Japan | ||||||||
| 1,000,000,000 | 1.10 | 06/20/2005 | 9,179,031 | |||||
| 2,200,000,000 | 1.20 | 09/20/2005 | 20,236,815 | |||||
| 7,480,000,000 | 0.90 | 12/22/2008 | 64,473,125 | |||||
| 250,000,000 | 1.50 | 03/20/2019 | 1,964,693 | |||||
| 820,000,000 | 2.40 | 02/20/2030 | 6,869,844 | |||||
| International Bank for Reconstruction & Development | ||||||||
| 430,000,000 | 2.00 | % | 02/18/2008 | 4,085,597 | ||||
| Oesterreichische Kontrollbank AG | ||||||||
| 180,000,000 | 1.80 | 03/22/2010 | 1,647,785 | |||||
| Republic of Italy | ||||||||
| 390,000,000 | 3.75 | 06/08/2005 | 3,998,405 | |||||
| $ 114,360,987 | ||||||||
| New Zealand Dollar – 2.0% | ||||||||
| Government of New Zealand | ||||||||
| NZD 28,300,000 | 8.00 | 11/15/2006 | $ 11,978,008 | |||||
| Swedish Krona – 1.1% | ||||||||
| Kingdom of Sweden | ||||||||
| SEK 72,000,000 | 3.50 | 04/20/2006 | $ 6,676,113 | |||||
| TOTAL FOREIGN DEBT OBLIGATIONS | ||||||||
| (Cost $408,355,481) | $ 374,211,860 | |||||||
| Principal
AmountÎ |
Interest
Rate |
Maturity
Date |
Value | |||||
|---|---|---|---|---|---|---|---|---|
| Corporate Bonds – 9.4% | ||||||||
| Aerospace/Defense – 0.0% | ||||||||
| Raytheon Co. | ||||||||
| USD 310,000 | 5.70 | % | 11/01/2003 | $ 297,569 | ||||
| Airlines – 0.2% | ||||||||
| Continental Airlines, Inc. | ||||||||
| USD 282,608 | 6.54 | % | 09/15/2009 | $ 269,713 | ||||
| Northwest Airlines, Inc. | ||||||||
| 236,290 | 8.07 | 01/02/2015 | 234,929 | |||||
| 229,090 | 8.97 | 01/02/2015 | 232,927 | |||||
| 261,909 | 7.67 | 07/02/2016 | 256,904 | |||||
| $ 994,473 | ||||||||
| Automotive – 1.0% | ||||||||
| Chrysler Financial Corp. | ||||||||
| USD 445,000 | 6.09 | % | 04/06/2001 | $ 443,952 | ||||
| Ford Motor Credit Co. | ||||||||
| 510,000 | 6.00 | 01/14/2003 | 497,342 | |||||
| 185,000 | 5.75 | 02/23/2004 | 176,404 | |||||
| 3,500,000 | 7.60 | 08/01/2005 | 3,523,163 | |||||
| General Motors Acceptance Corp. | ||||||||
| 610,000 | 5.75 | 11/10/2003 | 587,215 | |||||
| 160,000 | 6.85 | 06/17/2004 | 158,470 | |||||
| The Hertz Corp. | ||||||||
| 485,000 | 6.70 | 06/15/2002 | 481,076 | |||||
| 250,000 | 6.00 | 01/15/2003 | 244,808 | |||||
| $ 6,112,430 | ||||||||
| Automotive Parts – 0.1% | ||||||||
| TRW, Inc. | ||||||||
| USD 375,000 | 6.63 | % | 06/01/2004 | $ 358,540 | ||||
| Commercial Banks – 1.0% | ||||||||
| Bank of America Corp. | ||||||||
| USD 300,000 | 9.20 | % | 05/15/2003 | $ 314,794 | ||||
| 2,000,000 | 6.63 | 06/15/2004 | 1,969,184 | |||||
| 200,000 | 6.38 | 05/15/2005 | 194,297 | |||||
| 200,000 | 7.88 | 05/16/2005 | 205,295 | |||||
| 150,000 | 7.25 | 10/15/2025 | 138,314 | |||||
| Citicorp | ||||||||
| 300,000 | 8.00 | 02/01/2003 | 306,150 | |||||
| 100,000 | 7.20 | 06/15/2007 | 99,204 | |||||
| DBS Group Holdings Ltd. | ||||||||
| 1,000,000 | 7.88 | 08/10/2009 | 1,008,297 | |||||
| Dime Bancorp, Inc. | ||||||||
| 215,000 | 6.38 | 01/30/2001 | 213,994 | |||||
| FleetBoston Financial Corp. | ||||||||
| 265,000 | 7.25 | 09/15/2005 | 264,958 | |||||
| Long Island Savings Bank | ||||||||
| 300,000 | 7.00 | 06/13/2002 | 299,515 | |||||
| The Bank of New York Co., Inc. | ||||||||
| 175,000 | 8.50 | 12/15/2004 | 184,116 | |||||
| The Money Store, Inc. | ||||||||
| 225,000 | 7.30 | 12/01/2002 | 226,682 | |||||
| Principal
AmountÎ |
Interest
Rate |
Maturity
Date |
Value | |||||
|---|---|---|---|---|---|---|---|---|
| Corporate Bonds – (continued) | ||||||||
| Commercial Banks – (continued) | ||||||||
| Wells Fargo & Co. | ||||||||
| USD 360,000 | 6.63 | % | 07/15/2004 | $ 355,608 | ||||
| Wells Fargo Bank # | ||||||||
| 160,000 | 7.80 | 06/15/2010 | 164,343 | |||||
| $ 5,944,751 | ||||||||
| Conglomerates – 0.1% | ||||||||
| Tyco International Group SA | ||||||||
| USD 385,000 | 5.88 | % | 11/01/2004 | $ 367,780 | ||||
| 190,000 | 6.38 | 06/15/2005 | 183,839 | |||||
| $ 551,619 | ||||||||
| Consumer Cyclicals – 0.0% | ||||||||
| Cendant Corp. | ||||||||
| USD 165,000 | 7.75 | % | 12/01/2003 | $ 160,041 | ||||
| Credit Card Banks – 0.1% | ||||||||
| Capital One Bank | ||||||||
| USD 180,000 | 6.48 | % | 06/28/2002 | $ 177,524 | ||||
| 300,000 | 6.65 | 03/15/2004 | 290,943 | |||||
| $ 468,467 | ||||||||
| Electric – 0.1% | ||||||||
| Mid American Energy Holdings Corp. | ||||||||
| USD 200,000 | 7.23 | % | 09/15/2005 | $ 197,723 | ||||
| Niagara Mohawk Power Corp. | ||||||||
| 250,000 | 6.88 | 04/01/2003 | 248,702 | |||||
| 275,000 | 8.00 | 06/01/2004 | 280,949 | |||||
| $ 727,374 | ||||||||
| Energy – 0.2% | ||||||||
| Enron Corp.† | ||||||||
| USD 190,000 | 8.00 | % | 08/15/2005 | $ 193,033 | ||||
| Norsk Hydro ASA | ||||||||
| 60,000 | 7.15 | 01/15/2029 | 55,148 | |||||
| Occidental Petroleum Corp. | ||||||||
| 190,000 | 7.65 | 02/15/2006 | 193,003 | |||||
| 90,000 | 7.20 | 04/01/2028 | 82,110 | |||||
| Phillips Petroleum Co. | ||||||||
| 130,000 | 8.50 | 05/25/2005 | 137,144 | |||||
| The Williams Cos., Inc. | ||||||||
| 200,000 | 6.13 | 02/01/2001 | 199,359 | |||||
| 390,000 | 6.13 | 02/15/2012 | 381,963 | |||||
| $ 1,241,760 | ||||||||
| Environmental – 0.1% | ||||||||
| Republic Services, Inc. | ||||||||
| USD 370,000 | 6.63 | % | 05/15/2004 | $ 351,948 | ||||
| Waste Management, Inc. # | ||||||||
| 300,000 | 6.13 | 07/15/2001 | 294,181 | |||||
| $ 646,129 | ||||||||
| Finance Companies – 1.1% | ||||||||
| Associates Corp. of North America | ||||||||
| USD 750,000 | 5.75 | % | 11/01/2003 | $ 727,507 | ||||
| Principal
AmountÎ |
Interest
Rate |
Maturity
Date |
Value | |||||
|---|---|---|---|---|---|---|---|---|
| Corporate Bonds – (continued) | ||||||||
| Finance Companies – (continued) | ||||||||
| Beneficial Corp. | ||||||||
| USD 500,000 | 6.43 | % | 04/10/2002 | $ 496,051 | ||||
| Comdisco, Inc. | ||||||||
| 450,000 | 6.13 | 01/15/2003 | 328,500 | |||||
| Heller Financial, Inc. | ||||||||
| 245,000 | 7.50 | 08/23/2002 | 245,201 | |||||
| Household Financial Corp. | ||||||||
| 4,000,000 | 6.00 | 05/01/2004 | 3,846,260 | |||||
| 200,000 | 8.00 | 05/09/2005 | 204,587 | |||||
| 1,000,000 | 8.00 | 07/15/2010 | 1,011,351 | |||||
| $ 6,859,457 | ||||||||
| Food – 0.1% | ||||||||
| Nabisco, Inc. # | ||||||||
| USD 700,000 | 6.00 | % | 02/15/2001 | $ 695,233 | ||||
| Insurance Companies – 0.4% | ||||||||
| American General Finance Corp. | ||||||||
| USD 490,000 | 5.75 | % | 11/01/2003 | $ 473,131 | ||||
| AXA Financial, Inc. | ||||||||
| 135,000 | 7.75 | 08/01/2010 | 136,885 | |||||
| Conseco, Inc. | ||||||||
| 200,000 | 8.50 | 10/15/2002 | 157,000 | |||||
| Prudential Insurance Co. of America | ||||||||
| 1,900,000 | 6.38 | 07/23/2006 | 1,799,931 | |||||
| $ 2,566,947 | ||||||||
| Media-Cable – 0.3% | ||||||||
| Cox Communications, Inc. | ||||||||
| USD 125,000 | 7.50 | % | 08/15/2004 | $ 125,498 | ||||
| 45,000 | 7.75 | 08/15/2006 | 45,498 | |||||
| 75,000 | 6.40 | 08/01/2008 | 69,335 | |||||
| 105,000 | 6.80 | 08/01/2028 | 89,269 | |||||
| Lenfest Communications, Inc. | ||||||||
| 350,000 | 8.38 | 11/01/2005 | 364,070 | |||||
| Time Warner Entertainment Co. | ||||||||
| 900,000 | 9.63 | 05/01/2002 | 928,437 | |||||
| Time Warner, Inc. | ||||||||
| 175,000 | 8.11 | 08/15/2006 | 181,334 | |||||
| 250,000 | 6.85 | 01/15/2026 | 247,431 | |||||
| $ 2,050,872 | ||||||||
| Media-Non Cable – 0.3% | ||||||||
| AMFM, Inc. | ||||||||
| USD 145,000 | 8.00 | % | 11/01/2008 | $ 145,363 | ||||
| CBS Corp. | ||||||||
| 170,000 | 6.88 | 09/01/2003 | 168,927 | |||||
| J. Seagram & Sons, Inc. | ||||||||
| 175,000 | 6.25 | 12/15/2001 | 173,885 | |||||
| News America Holdings, Inc. | ||||||||
| 200,000 | 7.43 | 10/01/2026 | 194,592 | |||||
| PanAmSat Corp. | ||||||||
| 165,000 | 6.13 | 01/15/2005 | 152,948 | |||||
| Principal
AmountÎ |
Interest
Rate |
Maturity
Date |
Value | |||||
|---|---|---|---|---|---|---|---|---|
| Corporate Bonds – (continued) | ||||||||
| Media-Non Cable – (continued) | ||||||||
| Paramount Communications, Inc. | ||||||||
| 300,000 | 7.50 | % | 01/15/2002 | $ 300,929 | ||||
| Viacom, Inc. | ||||||||
| 450,000 | 7.75 | 06/01/2005 | 459,630 | |||||
| $ 1,596,274 | ||||||||
| Mortgage Banks – 0.2% | ||||||||
| Countrywide Home Loans, Inc. | ||||||||
| USD 450,000 | 6.45 | % | 02/27/2003 | $ 442,983 | ||||
| 200,000 | 6.84 | 10/22/2004 | 195,668 | |||||
| Homeside Lending, Inc. | ||||||||
| 400,000 | 6.20 | 05/15/2003 | 391,557 | |||||
| $ 1,030,208 | ||||||||
| Paper – 0.0% | ||||||||
| International Paper Co.† | ||||||||
| USD 185,000 | 8.00 | % | 07/08/2003 | $ 188,033 | ||||
| REIT – 0.2% | ||||||||
| Chelsea GCA Realty, Inc. | ||||||||
| USD 250,000 | 7.75 | % | 01/26/2001 | $ 249,803 | ||||
| Liberty Property LP | ||||||||
| 235,000 | 6.97 | 12/11/2003 | 230,009 | |||||
| Simon Property Group LP | ||||||||
| 450,000 | 6.63 | 06/15/2003 | 438,156 | |||||
| $ 917,968 | ||||||||
| Retailers – 0.1% | ||||||||
| Federated Department Stores, Inc. | ||||||||
| USD 175,000 | 8.13 | % | 10/15/2002 | $ 174,609 | ||||
| Sears Roebuck Acceptance Corp. | ||||||||
| 240,000 | 6.72 | 09/17/2003 | 236,887 | |||||
| The Pep Boys-Manny, Moe & Jack | ||||||||
| 225,000 | 6.75 | 03/10/2004 | 139,500 | |||||
| $ 550,996 | ||||||||
| Supermarkets – 0.7% | ||||||||
| Ahold Finance USA, Inc. | ||||||||
| USD 3,720,000 | 8.25 | % | 07/15/2010 | $ 3,771,689 | ||||
| Fred Meyer, Inc. | ||||||||
| 325,000 | 7.38 | 03/01/2005 | 321,331 | |||||
| Safeway, Inc. | ||||||||
| 315,000 | 5.88 | 11/15/2001 | 310,681 | |||||
| 170,000 | 6.05 | 11/15/2003 | 163,870 | |||||
| $ 4,567,571 | ||||||||
| Telecommunications – 0.5% | ||||||||
| 360 Communications Co. | ||||||||
| USD 300,000 | 7.13 | % | 03/01/2003 | $ 298,802 | ||||
| AT&T Canada, Inc. § | ||||||||
| 240,000 | 0.00/9.95 | 06/15/2008 | 196,800 | |||||
| Bellsouth Capital Funding Corp. | ||||||||
| 140,000 | 7.88 | 02/15/2030 | 142,651 | |||||
| Deutsche Telekom International Finance B.V. | ||||||||
| 255,000 | 7.75 | 06/15/2005 | 259,339 | |||||
| Principal
AmountÎ |
Interest
Rate |
Maturity
Date |
Value | |||||
|---|---|---|---|---|---|---|---|---|
| Corporate Bonds – (continued) | ||||||||
| Telecommunications – (continued) | ||||||||
| GTE California, Inc. | ||||||||
| USD 80,000 | 7.65 | % | 03/15/2007 | $ 81,776 | ||||
| 65,000 | 6.75 | 05/15/2027 | 57,909 | |||||
| GTE Corp. | ||||||||
| 70,000 | 6.94 | 04/15/2028 | 63,840 | |||||
| MCI WorldCom, Inc. | ||||||||
| 200,000 | 6.13 | 08/15/2001 | 198,140 | |||||
| 160,000 | 6.40 | 08/15/2005 | 154,087 | |||||
| New England Telephone & Telegraph Co. | ||||||||
| 35,000 | 7.65 | 06/15/2007 | 35,754 | |||||
| QWest Communications, Inc. | ||||||||
| 300,000 | 7.20 | 11/01/2004 | 298,919 | |||||
| Sprint Capital Corp. | ||||||||
| 420,000 | 5.88 | 05/01/2004 | 400,748 | |||||
| Tele-Communications, Inc. | ||||||||
| 280,000 | 8.25 | 01/15/2003 | 288,464 | |||||
| Telecom de Puerto Rico† | ||||||||
| 135,000 | 6.15 | 05/15/2002 | 132,214 | |||||
| 155,000 | 6.65 | 05/15/2006 | 147,532 | |||||
| US West Capital Funding, Inc.† | ||||||||
| 150,000 | 6.88 | 07/15/2028 | 132,029 | |||||
| Vodafone AirTouch PLC† | ||||||||
| 360,000 | 7.75 | 02/15/2010 | 365,505 | |||||
| $ 3,254,509 | ||||||||
| Tobacco – 0.6% | ||||||||
| Imperial Tobacco Overseas BV | ||||||||
| USD 2,800,000 | 7.13 | % | 04/01/2009 | $ 2,561,768 | ||||
| Philip Morris Cos., Inc. | ||||||||
| 180,000 | 9.00 | 01/01/2001 | 180,328 | |||||
| 100,000 | 8.75 | 06/01/2001 | 100,718 | |||||
| 350,000 | 7.50 | 04/01/2004 | 346,674 | |||||
| 95,000 | 6.95 | 06/01/2006 | 94,433 | |||||
| R.J. Reynolds Tobacco Holdings, Inc.† | ||||||||
| 285,000 | 7.38 | 05/15/2003 | 269,926 | |||||
| $ 3,553,847 | ||||||||
| Yankee Banks – 2.0% | ||||||||
| Asian Development Bank | ||||||||
| USD 4,000,000 | 5.82 | % | 06/16/2028 | $ 3,755,724 | ||||
| Bayerische Landesbank Girozentrale | ||||||||
| 250,000 | 5.88 | 12/01/2008 | 226,529 | |||||
| HSBC Holdings PLC | ||||||||
| 90,000 | 7.50 | 07/15/2009 | 89,928 | |||||
| Merita Bank Ltd. | ||||||||
| 1,010,000 | 6.50 | 04/01/2009 | 944,449 | |||||
| National Australia Bank Ltd. | ||||||||
| 3,000,000 | 8.60 | 05/19/2010 | 3,185,124 | |||||
| National Westminster Bank PLC | ||||||||
| 1,000,000 | 7.38 | 10/01/2009 | 989,380 | |||||
| Nordbanken AB† # | ||||||||
| 1,200,000 | 8.95 | 11/29/2049 | 1,213,850 | |||||
| Principal
AmountÎ |
Interest
Rate |
Maturity
Date |
Value | |||||
|---|---|---|---|---|---|---|---|---|
| Corporate Bonds – (continued) | ||||||||
| Yankee Banks – (continued) | ||||||||
| Republic New York Corp. | ||||||||
| USD 85,000 | 7.75 | % | 05/15/2009 | $ 85,806 | ||||
| Sparebanken Rogaland† # | ||||||||
| 1,800,000 | 9.20 | 08/18/2009 | 1,844,831 | |||||
| $ 12,335,621 | ||||||||
| TOTAL CORPORATE BONDS | ||||||||
| (Cost $58,956,267) | $ 57,670,689 | |||||||
| Agency Debentures – 0.1% | ||||||||
| Federal National Mortgage Association | ||||||||
| USD 820,000 | 7.25 | % | 01/15/2010 | $ 849,700 | ||||
| TOTAL AGENCY DEBENTURES | ||||||||
| (Cost $855,051) | $ 849,700 | |||||||
| Asset-Backed Securities – 2.6% | ||||||||
| Auto – 0.7% | ||||||||
| Arcadia Automobile Receivables Series 1999-C, Class A3 | ||||||||
| USD 1,087,562 | 7.20 | % | 06/15/2007 | $ 1,095,816 | ||||
| Rental Car Finance Corp. Series 1997-1, Class A2† | ||||||||
| 2,000,000 | 6.45 | 08/25/2005 | 1,966,452 | |||||
| WFS Financial Owner Trust Series 2000-B, Class A4 | ||||||||
| 1,500,000 | 7.84 | 02/20/2006 | 1,529,445 | |||||
| $ 4,591,713 | ||||||||
| Credit Card – 0.2% | ||||||||
| Fingerhut Master Trust Series 1998-2, Class A | ||||||||
| USD 1,000,000 | 6.23 | % | 02/15/2007 | $ 987,830 | ||||
| Home Equity – 0.9% | ||||||||
| American Business Financial Services Series 1998-2, Class A6 | ||||||||
| USD 2,250,000 | 6.46 | % | 09/25/2029 | $ 2,185,313 | ||||
| BankBoston Home Equity Loan Trust Series 1998-2, Class A7 | ||||||||
| 1,750,000 | 6.14 | 06/25/2013 | 1,663,655 | |||||
| Saxon Asset Securities Trust Series 1998-1, Class AF6 | ||||||||
| 1,500,000 | 6.52 | 11/25/2027 | 1,457,610 | |||||
| $ 5,306,578 | ||||||||
| Lease – 0.3% | ||||||||
| AESOP Funding II LLC Series 1998-1, Class A† | ||||||||
| USD 1,000,000 | 6.14 | % | 05/20/2006 | $ 961,320 | ||||
| First Sierra Receivables Series 1998-1, Class A4 | ||||||||
| 900,000 | 5.63 | 08/12/2004 | 886,572 | |||||
| $ 1,847,892 | ||||||||
| Manufactured Housing – 0.2% | ||||||||
| Mid-State Trust Series 4, Class A | ||||||||
| USD 1,046,795 | 8.33 | % | 04/01/2030 | $ 1,076,126 | ||||
| Student Loans – 0.3% | ||||||||
| Union Financial Services Series 1998-A, Class A9 | ||||||||
| USD 2,000,000 | 5.73 | % | 12/01/2005 | $ 1,905,740 | ||||
| TOTAL ASSET-BACKED SECURITIES | ||||||||
| (Cost $16,015,786) | $ 15,715,879 | |||||||
| Principal
AmountÎ |
Interest
Rate |
Maturity
Date |
Value | ||||||
|---|---|---|---|---|---|---|---|---|---|
| Mortgage Backed Obligations – 3.8% | |||||||||
| Federal Home Loan Mortgage Corp. (FHLMC) – 0.4% | |||||||||
| USD | 670,949 | 6.00 | % | 09/01/2028 | $ 630,800 | ||||
| 953,226 | 6.00 | 11/01/2028 | 896,185 | ||||||
| 188,170 | 8.00 | 06/01/2030 | 190,750 | ||||||
| 811,830 | 8.00 | 08/01/2030 | 822,733 | ||||||
| |
|||||||||
| $ 2,540,468 | |||||||||
| |
|||||||||
| Federal National Mortgage Association (FNMA) – 0.1% | |||||||||
| USD | 701,520 | 6.00 | % | 01/01/2029 | $ 659,267 | ||||
| 61,908 | 6.00 | 05/01/2029 | 58,180 | ||||||
| |
|||||||||
| $ 717,447 | |||||||||
| |
|||||||||
| Government National Mortgage Association (GNMA) – 0.9% | |||||||||
| USD | 52,375 | 9.00 | % | 03/15/2005 | $ 53,733 | ||||
| 88,892 | 9.00 | 02/15/2006 | 91,198 | ||||||
| 284,308 | 9.00 | 02/15/2010 | 290,705 | ||||||
| 596,914 | 6.00 | 01/15/2011 | 579,210 | ||||||
| 448,774 | 7.00 | 07/15/2023 | 444,462 | ||||||
| 499,508 | 7.00 | 08/15/2023 | 494,708 | ||||||
| 266,971 | 7.00 | 09/15/2023 | 264,406 | ||||||
| 376,511 | 7.00 | 10/15/2023 | 372,892 | ||||||
| 213,712 | 7.00 | 11/15/2023 | 211,658 | ||||||
| 1,396,041 | 6.00 | 11/15/2028 | 1,317,429 | ||||||
| 3,122,506 | 6.00 | 12/15/2028 | 2,947,560 | ||||||
| |
|||||||||
| $ 7,067,961 | |||||||||
| |
|||||||||
| Collateralized Mortgage Obligations – 2.4% | |||||||||
| Inverse Floater# – 0.2% | |||||||||
| FNMA Remic Trust Series 1994-13, Class SH USD | |||||||||
| USD | 962,660 | 5.09 | % | 02/25/2009 | $ 835,406 | ||||
| GE Capital Mortgage Services, Inc. Series 1994-2, Class A9 | |||||||||
| 564,879 | 3.21 | 01/25/2009 | 499,455 | ||||||
| |
|||||||||
| $ 1,334,861 | |||||||||
| |
|||||||||
| Non-Agency CMOs – 0.4% | |||||||||
| Asset Securitization Corp. Series 1997-D5, Class A1B | |||||||||
| USD | 450,000 | 6.66 | % | 02/14/2041 | $ 444,226 | ||||
| Chase Commercial Mortgage Securities Corp. Series 1997-1,
Class A2 |
|||||||||
| 300,000 | 7.37 | 02/19/2007 | 304,973 | ||||||
| First Union-Lehman Brothers Commercial Mortgage Services
Series 1997-C1, Class A2 |
|||||||||
| 200,000 | 7.30 | 12/18/2006 | 202,611 | ||||||
| GMAC Commercial Mortgage Securities, Inc. Series 1997-C1,
Class A2 |
|||||||||
| 450,000 | 6.85 | 09/15/2006 | 448,475 | ||||||
| Merrill Lynch Mortgage Investors, Inc. Series 1998-C2,
Class A2 |
|||||||||
| 750,000 | 6.39 | 02/15/2030 | 722,265 | ||||||
| |
|||||||||
| $ 2,122,550 | |||||||||
| |
|||||||||
| Planned Amortization Class (PAC) CMOs – 0.4% | |||||||||
| Federal Home Loan Mortgage Corp. Series 1623, Class PG | |||||||||
| USD | 3,000,000 | 3.00 | % | 07/15/2021 | $ 2,607,180 | ||||
| |
|||||||||
| Principal
AmountÎ |
Interest
Rate |
Maturity Date | Value | ||||||
|---|---|---|---|---|---|---|---|---|---|
| Mortgage Backed Obligations – (continued) | |||||||||
| Regular Floater CMOs# – 0.3% | |||||||||
| FNMA Series 1993-203, Class FA | |||||||||
| USD | 1,804,343 | 7.88 | % | 10/25/2023 | $ 1,843,781 | ||||
| |
|||||||||
| Sequential Fixed Rate CMOs – 0.4% | |||||||||
| FHLMC Series 2152, Class AB | |||||||||
| USD | 2,703,930 | 6.25 | % | 01/15/2026 | $ 2,617,810 | ||||
| |
|||||||||
| Support — 0.5% | |||||||||
| GE Capital Mortgage Services, Inc. Series 1994-6, Class A9 | |||||||||
| USD | 3,179,229 | 6.50 | % | 09/25/2022 | $ 3,072,883 | ||||
| |
|||||||||
| Target Amortization Class (TAC) – 0.2% | |||||||||
| Countrywide Funding Corp. Series 1994-2, Class A10A | |||||||||
| USD | 1,000,000 | 6.50 | % | 02/25/2009 | $ 984,200 | ||||
| |
|||||||||
| TOTAL COLLATERALIZED MORTGAGE | |||||||||
| OBLIGATIONS | $ 14,583,265 | ||||||||
| |
|||||||||
| TOTAL MORTGAGE BACKED OBLIGATIONS | |||||||||
| (Cost $25,160,956) | $ 24,909,141 | ||||||||
| |
|||||||||
| Sovereign Credit – 0.1% | |||||||||
| Province of Quebec | |||||||||
| USD | 585,000 | 7.50 | % | 07/15/2023 | $ 580,745 | ||||
| 80,000 | 5.74 | # | 03/02/2026 | 79,608 | |||||
| Province of Saskatchewan | |||||||||
| 65,000 | 8.50 | 07/15/2022 | 73,295 | ||||||
| |
|||||||||
| TOTAL SOVEREIGN CREDIT | |||||||||
| (Cost $779,205) | $ 733,648 | ||||||||
| |
|||||||||
| U.S. Treasury Obligations – 16.2% | |||||||||
| United States Inflation-Indexed Treasury Note | |||||||||
| USD | 5,986,120 | 3.63 | % | 01/15/2008 | $ 5,890,719 | ||||
| United States Treasury Interest-Only Stripped Securities · | |||||||||
| 300,000 | 6.15 | 02/15/2013 | 145,002 | ||||||
| 400,000 | 6.17 | 02/15/2014 | 181,639 | ||||||
| United States Treasury Principal-Only Stripped Securities° | |||||||||
| 1,520,000 | 6.17 | 11/15/2009 | 873,812 | ||||||
| 1,690,000 | 6.17 | 11/15/2018 | 576,728 | ||||||
| 6,210,000 | 6.16 | 05/15/2020 | 1,937,948 | ||||||
| 1,000,000 | 6.20 | 05/15/2021 | 294,009 | ||||||
| 1,000,000 | 6.11 | 11/15/2022 | 270,599 | ||||||
| 2,070,000 | 6.06 | 11/15/2024 | 499,799 | ||||||
| 2,400,000 | 6.04 | 08/15/2025 | 558,382 | ||||||
| 1,500,000 | 6.01 | 08/15/2026 | 329,879 | ||||||
| 3,710,000 | 6.00 | 11/15/2026 | 803,990 | ||||||
| United States Treasury Bonds | |||||||||
| 8,900,000 | 8.13 | 08/15/2019 | 10,997,018 | ||||||
| 800,000 | 8.75 | 08/15/2020 | 1,051,137 | ||||||
| 1,000,000 | 6.88 | 08/15/2025 | 1,113,813 | ||||||
| 900,000 | 6.75 | 08/15/2026 | 990,562 | ||||||
| 12,000,000 | 5.25 | 02/15/2029 | 10,935,516 | ||||||
| 9,100,000 | 6.25 | 05/15/2030 | 9,692,920 | ||||||
| Principal
AmountÎ |
Interest
Rate |
Maturity
Date |
Value | |||||
|---|---|---|---|---|---|---|---|---|
| U.S. Treasury Obligations – (continued) | ||||||||
| United States Treasury Notes | ||||||||
| USD 2,800,000 | 5.88 | % | 11/15/2004 | $ 2,802,632 | ||||
| 40,900,000 | 7.00 | 07/15/2006 | 43,115,349 | |||||
| 6,300,000 | 6.00 | 08/15/2009 | 6,365,419 | |||||
| TOTAL U.S. TREASURY OBLIGATIONS | ||||||||
| (Cost $97,787,481) | $ 99,426,872 | |||||||
| Short-Term Obligation – 1.6% | ||||||||
| State Street Bank & Trust Euro-Time Deposit Ù | ||||||||
| USD 9,552,000 | 6.56 | % | 11/01/2000 | $ 9,552,000 | ||||
| TOTAL SHORT-TERM OBLIGATION | ||||||||
| (Cost $9,552,000) | $ 9,552,000 | |||||||
| TOTAL INVESTMENTS | ||||||||
| (Cost $617,462,227) | $ 583,069,789 | |||||||
Î
|
The principal amount of each security is stated in the currency in which the bond is denominated. See below.
|
CAD
|
= Canadian Dollar
|
DKK
|
= Danish Krone
|
DEM
|
= German Mark
|
EUR
|
= Euro Currency
|
GBP
|
= Great Britain Pound
|
GRD
|
= Greek Drachma
|
JPY
|
= Japanese Yen
|
NZD
|
= New Zealand Dollar
|
SEK
|
= Swedish Krona
|
USD
|
= United States Dollar
|
†
|
Securities are exempt from registration under Rule 144A of the Securities Act of 1933. Such securities may be resold, normally to
qualified institutional buyers in transactions exempt from registration. Total market value of Rule 144A securities amounted to $11,972,303 as of October 31, 2000.
|
#
|
Variable rate security. Coupon rate disclosed is that which is in effect at October 31, 2000.
|
§
|
These securities are issued with a zero coupon rate which increases to the stated rate at a set date in the future.
|
·
|
Represents security with notional or nominal amount. The actual effective yield of this security is different than the stated
coupon due to the amortization of related premiums.
|
°
|
Security is issued with a zero coupon. The interest rate disclosed for this security represents effective yield to maturity.
|
Ù
|
A portion of this security is segregated as collateral for initial margin requirement on futures transactions.
|
| The percentage shown for each investment category reflects the value of investments in that category as a percentage of net assets.
|
|
Enhanced Income Fund |
|||||
|---|---|---|---|---|---|
| Assets: | |||||
| Investment in securities, at value (identified cost $166,278,379, $202,190,723, $184,967,807, $125,696,515, $375,280,451
and $617,462,227) |
$166,422,660 | ||||
| Repurchase Agreement | 1,300,000 | ||||
| Cash, at value | 10,120 | ||||
| Receivables: | |||||
| Investment securities sold | 5,012,138 | ||||
| Interest, at value | 1,783,930 | ||||
| Fund shares sold | 180,544 | ||||
| Forward foreign currency exchange contracts | — | ||||
| Variation margin | 1,688 | ||||
| Reimbursement from adviser | 117,724 | ||||
| Other assets | — | ||||
| Total assets | 174,828,804 | ||||
| Liabilities: | |||||
| Due to bank | — | ||||
| Payables: | |||||
| Investment securities purchased | 5,810,958 | ||||
| Income distribution | 20,071 | ||||
| Fund shares repurchased | — | ||||
| Amounts owed to affiliates | 27,864 | ||||
| Forward foreign currency exchange contracts | — | ||||
| Variation margin | — | ||||
| Forward sale contract, at value | — | ||||
| Accrued expenses and other liabilities | 107,326 | ||||
| Total liabilities | 5,966,219 | ||||
| Net Assets: | |||||
| Paid-in capital | 168,866,449 | ||||
| Accumulated undistributed (distributions in excess of) net investment income | (116,946 | ) | |||
| Accumulated undistributed net realized gain (loss) on investment, futures and foreign currency related transactions | (7,926 | ) | |||
| Net unrealized gain (loss) on investments, futures and translation of assets and liabilities denominated in foreign currencies | 121,008 | ||||
| NET ASSETS | $168,862,585 | ||||
| Net asset value, offering and redemption price per share (a) | |||||
| Class A | $10.00 | ||||
| Class B | — | ||||
| Class C | — | ||||
| Institutional | $10.00 | ||||
| Administration | $10.00 | ||||
| Service | — | ||||
| Shares outstanding: | |||||
| Class A | 1,233,295 | ||||
| Class B | — | ||||
| Class C | — | ||||
| Institutional | 15,653,616 | ||||
| Administration | 152 | ||||
| Service | — | ||||
| Total shares outstanding, $.001 par value (unlimited number of shares authorized) | 16,887,063 | ||||
(a)
|
Maximum public offering price per share for Class A shares of Enhanced Income and Adjustable Rate Government (NAV per share
multiplied by 1.0152), for Class A shares of Short Duration Government (NAV per share multiplied by $1.0204), for Class A shares of Government Income, Core Fixed Income, and Global Income (NAV per share multiplied by 1.0471) is $10.15, $9.71, $9.68,
$14.49, $9.47 and $15.37, respectively. At redemption, Class B and Class C shares may be subject to a contingent sales charge, assessed on the amount equal to the lesser of the current net asset value or the original purchase price of the shares.
|
| Adjustable Rate
Government Fund |
Short Duration
Government Fund |
Government
Income Fund |
Core Fixed
Income Fund |
Global
Income Fund |
|||||||||
|---|---|---|---|---|---|---|---|---|---|---|---|---|---|
| $197,888,780 | $181,974,944 | $123,520,592 | $371,834,828 | $583,069,789 | |||||||||
| 18,500,000 | 4,700,000 | 19,800,000 | 5,100,000 | — | |||||||||
| 85,478 | — | 21,764 | 89,578 | 1,249,854 | |||||||||
| 1,052,749 | 25,798,728 | 36,964,445 | 71,934,330 | 14,032,376 | |||||||||
| 1,665,410 | 1,493,761 | 979,187 | 4,596,193 | 9,533,085 | |||||||||
| 30,209 | 70,750 | 317,092 | 2,052,076 | 8,626,764 | |||||||||
| — | — | — | 496,744 | 8,152,783 | |||||||||
| 4,958 | 95,661 | — | — | 2,340,885 | |||||||||
| 14,732 | 96,645 | 78,393 | 58,438 | 107,571 | |||||||||
| 5,239 | 298 | — | 389 | 943 | |||||||||
| 219,247,555 | 214,230,787 | 181,681,473 | 456,162,576 | 627,114,050 | |||||||||
| — | 1,923,880 | — | — | — | |||||||||
| 73,347 | 29,243,134 | 52,554,287 | 77,428,772 | 10,021,267 | |||||||||
| 601,046 | 483,876 | 68,914 | 555,623 | — | |||||||||
| 315,057 | 1,009,079 | 196,517 | 155,272 | 1,333,206 | |||||||||
| 92,830 | 102,809 | 113,246 | 191,821 | 540,360 | |||||||||
| — | — | — | — | 1,724,907 | |||||||||
| — | — | 40,578 | 122,489 | — | |||||||||
| — | 3,512,213 | 5,658,848 | 5,766,632 | 1,611,901 | |||||||||
| 25,097 | 42,687 | 49,275 | 77,107 | 103,597 | |||||||||
| 1,107,377 | 36,317,678 | 58,681,665 | 84,297,716 | 15,335,238 | |||||||||
| 274,084,489 | 199,938,349 | 127,438,509 | 384,133,943 | 615,620,266 | |||||||||
| (159,492) | 339,755 | (16,145 | ) | 412,143 | 37,890,362 | ||||||||
| (51,422,516) | (19,276,146 | ) | (4,178,004 | ) | (10,802,986 | ) | (13,593,837 | ) | |||||
| (4,362,303) | (3,088,849 | ) | (244,552 | ) | (1,878,240 | ) | (28,137,979 | ) | |||||
| $218,140,178 | $177,913,109 | $122,999,808 | $371,864,860 | $611,778,812 | |||||||||
| $9.56 | $9.49 | $13.84 | $9.52 | $14.68 | |||||||||
| — | $9.46 | $13.85 | $9.54 | $14.65 | |||||||||
| — | $9.45 | $13.84 | $9.55 | $14.63 | |||||||||
| $9.58 | $9.47 | $13.82 | $9.54 | $14.67 | |||||||||
| — | — | — | — | — | |||||||||
| $9.58 | $9.46 | $13.82 | $9.54 | $14.66 | |||||||||
| 4,306,289 | 3,102,710 | 6,414,628 | 7,754,959 | 20,077,099 | |||||||||
| — | 606,855 | 1,352,119 | 1,466,852 | 1,502,798 | |||||||||
| — | 542,723 | 549,624 | 639,507 | 407,091 | |||||||||
| 18,469,893 | 13,876,025 | 543,580 | 28,127,786 | 19,576,156 | |||||||||
| — | — | — | — | — | |||||||||
| 7,454 | 648,175 | 26,977 | 989,541 | 131,991 | |||||||||
| 22,783,636 | 18,776,488 | 8,886,928 | 38,978,645 | 41,695,135 | |||||||||
| Enhanced
Income Fund (a) |
|||||
|---|---|---|---|---|---|
| Investment income: | |||||
| Interest (b) | $1,420,848 | ||||
| Total income | 1,420,848 | ||||
| Expenses: | |||||
| Management fees | 53,061 | ||||
| Distribution and service fees (c) | 1,568 | ||||
| Transfer agent fees (d) | 9,430 | ||||
| Custodian fees | 17,712 | ||||
| Registration fees | 82,450 | ||||
| Professional fees | 39,452 | ||||
| Trustee fees | 2,197 | ||||
| Service share fees | — | ||||
| Organization expenses | 7,307 | ||||
| Other | 73,560 | ||||
| Total expenses | 286,737 | ||||
| Less — expense reductions | (230,320 | ) | |||
| Net Expenses | 56,417 | ||||
| NET INVESTMENT INCOME | 1,364,431 | ||||
| Realized and unrealized gain (loss) on investment, futures and foreign currency transactions: | |||||
| Net realized gain (loss) from: | |||||
| Investment transactions | 15,185 | ||||
| Futures transactions | (23,111 | ) | |||
| Foreign currency related transactions | — | ||||
| Net change in unrealized gain (loss) on: | |||||
| Investments | 144,281 | ||||
| Futures | (23,273 | ) | |||
| Translation of assets and liabilities denominated in foreign currencies | — | ||||
| Net realized and unrealized gain (loss) on investment, futures and foreign currency transactions: | 113,082 | ||||
| NET INCREASE IN NET ASSETS RESULTING FROM OPERATIONS | $1,477,513 | ||||
(a)
|
Commencement date of operations was August 2, 2000 for all share classes.
|
(b)
|
Net of $3,647 and $43,038 in foreign withholding tax for the Core Fixed Income and Global Income Funds, respectively.
|
(c)
|
Class A, Class B and Class C of the following funds had distribution and service fees of:
|
| Enhanced Income Fund – $1,568 for Class A only.
|
| Adjustable Rate Government Fund – $68,688 for Class A only.
|
| Short Duration Government Fund – $101,903, $60,746 and $66,246, respectively.
|
| Government Income Fund – $193,367, $178,660 and $77,509, respectively.
|
| Core Fixed Income Fund – $202,867, $137,237 and $63,731 respectively.
|
| Global Income Fund – $1,365,960, $190,559 and $65,023, respectively.
|
(d)
|
The following funds had transfer agency fees of:
|
| Enhanced Income Fund – $1,191 and $8,239 for Class A and Institutional Class, respectively.
|
| Adjustable Rate Government Fund – $52,201, $91,456 and $186 for Class A, Institutional Class and Service Class,
respectively.
|
| Short Duration Government Fund – $77,450, $11,542, $12,587, $52,884 and $2,524 for Class A, Class B, Class C,
Institutional Class, and Service Class, respectively.
|
| Government Income Fund – $146,959, $33,946, $14,727, $2,876 and $139 for Class A, Class B, Class C, Institutional
Class and Service Class, respectively.
|
| Core Fixed Income Fund – $154,191, $26,075, $12,109, $95,245 and $3,473 for Class A, Class B, Class C,
Institutional Class, and Service Class, respectively.
|
| Global Income Fund – $519,066, $36,206, $12,354, $113,796 and $609 for Class A, Class B, Class C, Institutional
Class and Service Class, respectively.
|
| Adjustable Rate
Government |
Short Duration
Government Fund |
Government
Income Fund |
Core Fixed
Income Fund |
Global
Income Fund |
|||||||||
|---|---|---|---|---|---|---|---|---|---|---|---|---|---|
| $16,696,846 | $13,819,086 | $7,720,886 | $24,352,030 | $31,452,118 | |||||||||
| 16,696,846 | 13,819,086 | 7,720,886 | 24,352,030 | 31,452,118 | |||||||||
| 1,026,314 | 963,322 | 718,266 | 1,392,274 | 5,262,870 | |||||||||
| 68,688 | 228,895 | 449,536 | 403,835 | 1,621,542 | |||||||||
| 143,843 | 156,987 | 198,647 | 291,093 | 682,031 | |||||||||
| 101,042 | 126,035 | 118,061 | 201,295 | 427,389 | |||||||||
| 40,282 | 70,821 | 64,899 | 93,718 | 77,742 | |||||||||
| 48,707 | 53,209 | 47,461 | 54,661 | 47,495 | |||||||||
| 7,879 | 7,879 | 7,953 | 7,879 | 8,847 | |||||||||
| 2,324 | 31,548 | 1,741 | 43,414 | 7,615 | |||||||||
| — | — | — | — | — | |||||||||
| 114,643 | 112,850 | 98,059 | 110,524 | 93,716 | |||||||||
| 1,553,722 | 1,751,546 | 1,704,623 | 2,598,693 | 8,229,247 | |||||||||
| (174,001) | (372,199 | ) | (453,570 | ) | (106,086 | ) | (2,093,691 | ) | |||||
| 1,379,721 | 1,379,347 | 1,251,053 | 2,492,607 | 6,135,556 | |||||||||
| 15,317,125 | 12,439,739 | 6,469,833 | 21,859,423 | 25,316,562 | |||||||||
| (2,170,926) | (434,089 | ) | (1,775,839 | ) | (4,311,155 | ) | (10,738,612 | ) | |||||
| (535,391) | (2,423,041 | ) | 34,287 | 324,943 | (1,100,129 | ) | |||||||
| — | — | — | 524,224 | 39,845,500 | |||||||||
| 999,828 | 248,939 | 2,640,039 | 4,901,647 | (27,246,955 | ) | ||||||||
| 143,267 | 568,752 | 45,865 | 141,602 | (142,119 | ) | ||||||||
| — | — | — | 469,634 | 7,739,900 | |||||||||
| (1,563,222) | (2,039,439 | ) | 944,352 | 2,050,895 | 8,357,585 | ||||||||
| $13,753,903 | $10,400,300 | $7,414,185 | $23,910,318 | $33,674,147 | |||||||||
| Enhanced
Income Fund (a) |
||||
|---|---|---|---|---|
| From operations: | ||||
| Net investment income | $ 1,364,431 | |||
| Net realized gain (loss) on investment, futures and foreign currency related transactions | (7,926 | ) | ||
| Net change in unrealized gain (loss) on investments, futures and translation of assets and liabilities denominated in foreign
currencies |
121,008 | |||
| Net increase in net assets resulting from operations | 1,477,513 | |||
| Distributions to shareholders: | ||||
| From net investment income | ||||
| Class A shares | (29,575 | ) | ||
| Class B shares | — | |||
| Class C shares | — | |||
| Institutional shares | (1,334,833 | ) | ||
| Administration shares | (23 | ) | ||
| Service shares | — | |||
| In excess of net investment income | ||||
| Class A shares | (2,893 | ) | ||
| Class B shares | — | |||
| Class C shares | — | |||
| Institutional shares | (130,586 | ) | ||
| Administration shares | (2 | ) | ||
| Service shares | — | |||
| Total distributions to shareholders | (1,497,912 | ) | ||
| From share transactions: | ||||
| Proceeds from sales of shares | 179,675,493 | |||
| Reinvestment of dividends and distributions | 1,465,163 | |||
| Cost of shares repurchased | (12,257,672 | ) | ||
| Net increase (decrease) in net assets resulting from share transactions | 168,882,984 | |||
| TOTAL INCREASE (DECREASE) | 168,862,585 | |||
| Net assets: | ||||
| Beginning of period | — | |||
| End of period | $168,862,585 | |||
| Accumulated (distribution in excess of) net investment income | $ (116,946) | |||
(a)
|
Commencement date of operations was August 2, 2000 for all share classes.
|
| Adjustable Rate
Government |
Short Duration
Government Fund |
Government
Income Fund |
Core Fixed
Income Fund |
Global
Income Fund |
|||||||||
|---|---|---|---|---|---|---|---|---|---|---|---|---|---|
| $ 15,317,125 | $ 12,439,739 | $ 6,469,833 | $ 21,859,423 | $ 25,316,562 | |||||||||
| (2,706,317) | (2,857,130 | ) | (1,741,552 | ) | (3,461,988 | ) | 28,006,759 | ||||||
| 1,143,095 | 817,691 | 2,685,904 | 5,512,883 | (19,649,174 | ) | ||||||||
| 13,753,903 | 10,400,300 | 7,414,185 | 23,910,318 | 33,674,147 | |||||||||
| (1,581,084) | (2,620,472 | ) | (4,674,605 | ) | (4,947,469 | ) | (11,250,827 | ) | |||||
| — | (350,485 | ) | (947,791 | ) | (728,692 | ) | (700,564 | ) | |||||
| — | (365,855 | ) | (411,775 | ) | (339,200 | ) | (233,403 | ) | |||||
| (13,711,811) | (8,983,466 | ) | (463,351 | ) | (15,447,735 | ) | (13,586,547 | ) | |||||
| — | — | — | — | — | |||||||||
| (24,231) | (395,302 | ) | (21,569 | ) | (519,027 | ) | (67,471 | ) | |||||
| (16,463) | — | (11,577 | ) | (12,428 | ) | — | |||||||
| — | — | (2,347 | ) | (1,830 | ) | — | |||||||
| — | — | (1,020 | ) | (852 | ) | — | |||||||
| (142,776) | — | (1,148 | ) | (38,804 | ) | — | |||||||
| — | — | — | — | — | |||||||||
| (252) | — | (53 | ) | (1,304 | ) | — | |||||||
| (15,476,617) | (12,715,580 | ) | (6,535,236 | ) | (22,037,341 | ) | (25,838,812 | ) | |||||
| 183,272,654 | 88,870,759 | 88,984,845 | 285,373,785 | 171,233,955 | |||||||||
| 7,523,319 | 7,208,933 | 5,564,245 | 14,856,148 | 15,181,240 | |||||||||
| (309,615,880) | (134,719,290 | ) | (90,181,045 | ) | (242,847,919 | ) | (159,550,174 | ) | |||||
| (118,819,907) | (38,639,598 | ) | 4,368,045 | 57,382,014 | 26,865,021 | ||||||||
| (120,542,621) | (40,954,878 | ) | 5,246,994 | 59,254,991 | 34,700,356 | ||||||||
| 338,682,799 | 218,867,987 | 117,752,814 | 312,609,869 | 577,078,456 | |||||||||
| $218,140,178 | $177,913,109 | $122,999,808 | $371,864,860 | $611,778,812 | |||||||||
| $ (159,492) | $ 339,755 | $ (16,145) | $ 412,143 | $ 37,890,362 | |||||||||
| Adjustable Rate
Government Fund |
|||||
|---|---|---|---|---|---|
| From operations: | |||||
| Net investment income | $ 21,741,895 | ||||
| Net realized loss on investment, futures and foreign currency related transactions | (752,580 | ) | |||
| Net change in unrealized gain (loss) on investments, futures and translation of assets and liabilities denominated in foreign
currencies |
(1,219,471 | ) | |||
| Net increase (decrease) in net assets resulting from operations | 19,769,844 | ||||
| Distributions to shareholders: | |||||
| From net investment income | |||||
| Class A shares | (1,554,543 | ) | |||
| Class B shares | — | ||||
| Class C shares | — | ||||
| Institutional shares | (17,799,251 | ) | |||
| Administration shares | (156,305 | ) | |||
| Service shares | (33,888 | ) | |||
| From capital | |||||
| Class A shares | (199,076 | ) | |||
| Class B shares | — | ||||
| Class C shares | — | ||||
| Institutional shares | (2,279,391 | ) | |||
| Administration shares | (20,017 | ) | |||
| Service shares | (4,340 | ) | |||
| From net realized gain on investment, futures and foreign currency transactions | |||||
| Class A shares | — | ||||
| Class B shares | — | ||||
| Class C shares | — | ||||
| Institutional shares | — | ||||
| Administration shares | — | ||||
| Service shares | — | ||||
| Total distributions to shareholders | (22,046,811 | ) | |||
| From share transactions: | |||||
| Proceeds from sales of shares | 505,773,211 | ||||
| Reinvestment of dividends and distributions | 11,575,172 | ||||
| Cost of shares repurchased | (685,219,828 | ) | |||
| Net increase (decrease) in net assets resulting from share transactions | (167,871,445 | ) | |||
| TOTAL INCREASE (DECREASE) | (170,148,412 | ) | |||
| Net assets: | |||||
| Beginning of year | 508,831,211 | ||||
| End of year | $338,682,799 | ||||
| Accumulated undistributed net investment income | $ — | ||||
| Short Duration
Government Fund |
Government
Income Fund |
Core Fixed
Income Fund |
Global
Income Fund |
|||||||
|---|---|---|---|---|---|---|---|---|---|---|
| $ 13,380,044 | $ 6,563,309 | $ 17,029,832 | $ 22,635,219 | |||||||
| (1,966,703) | (2,232,045 | ) | (6,434,738 | ) | (6,101,567 | ) | ||||
| (6,265,046) | (5,231,809 | ) | (11,888,878 | ) | (22,918,010 | ) | ||||
| 5,148,295 | (900,545 | ) | (1,293,784 | ) | (6,384,358 | ) | ||||
| (2,885,366) | (4,701,931 | ) | (3,111,344 | ) | (10,433,058 | ) | ||||
| (267,022) | (881,113 | ) | (579,641 | ) | (456,703 | ) | ||||
| (316,483) | (489,690 | ) | (337,695 | ) | (263,007 | ) | ||||
| (8,877,237) | (267,417 | ) | (11,800,204 | ) | (11,462,739 | ) | ||||
| (278,181) | — | (495,974 | ) | — | ||||||
| (341,400) | (484 | ) | (368,926 | ) | (40,207 | ) | ||||
| — | — | — | (457,628 | ) | ||||||
| — | — | — | (20,032 | ) | ||||||
| — | — | — | (11,536 | ) | ||||||
| — | — | — | (502,793 | ) | ||||||
| — | — | — | — | |||||||
| — | — | — | (1,764 | ) | ||||||
| — | (1,930,242 | ) | (896,935 | ) | (5,398,726 | ) | ||||
| — | (406,494 | ) | (144,240 | ) | (219,025 | ) | ||||
| — | (228,993 | ) | (92,870 | ) | (129,352 | ) | ||||
| — | (63,106 | ) | (2,576,039 | ) | (4,630,914 | ) | ||||
| — | — | (181,000 | ) | — | ||||||
| — | (39 | ) | (84,628 | ) | (17,604 | ) | ||||
| (12,965,689) | (8,969,509 | ) | (20,669,496 | ) | (34,045,088 | ) | ||||
| 285,443,513 | 249,312,834 | 303,446,837 | 348,114,845 | |||||||
| 8,005,144 | 7,441,375 | 13,487,926 | 20,654,882 | |||||||
| (292,142,829) | (258,554,530 | ) | (265,160,385 | ) | (160,439,290 | ) | ||||
| 1,305,828 | (1,800,321 | ) | 51,774,378 | 208,330,437 | ||||||
| (6,511,566) | (11,670,375 | ) | 29,811,098 | 167,900,991 | ||||||
| 225,379,553 | 129,423,189 | 282,798,771 | 409,177,465 | |||||||
| $218,867,987 | $117,752,814 | $312,609,869 | $577,078,456 | |||||||
| $ 615,596 | $ 49,258 | $ 122,700 | $ 2,395,515 | |||||||
| 1. ORGANIZATION
|
| Goldman Sachs Trust (the “Trust”) is a Delaware business trust registered under the Investment Company Act of 1940 (as
amended) as an open-end, management investment company. The Trust includes Goldman Sachs Enhanced Income Fund (Enhanced Income), Goldman Sachs Adjustable Rate Government Fund (Adjustable Rate Government), Goldman Sachs Short Duration Government Fund
(Short Duration Government), Goldman Sachs Government Income Fund (Government Income), Goldman Sachs Core Fixed Income Fund (Core Fixed Income) and Goldman Sachs Global Income Fund (Global Income), collectively, “the Funds” or individually a
“Fund.” Enhanced Income, Adjustable Rate Government, Short Duration Government, Government Income and Core Fixed Income are diversified portfolios of the Trust whereas Global Income is a non-diversified portfolio. Enhanced Income offers three
classes of shares — Class A, Institutional and Administration. Adjustable Rate Government offers three classes of shares — Class A, Institutional and Service. Government Income, Short Duration Government, Core Fixed Income
and Global Income offer five classes of shares — Class A, Class B, Class C, Institutional and Service. On July 20, 1999, Administration Class shares for Adjustable Rate Government, Short Duration Government and Core Fixed Income were
liquidated and are no longer offered.
|
| 2. SIGNIFICANT ACCOUNTING POLICIES
|
| The following is a summary of significant accounting policies consistently followed by the Funds. The preparation of financial
statements in conformity with generally accepted accounting principles requires management to make estimates and assumptions that may affect the reported amounts. Actual results could differ from those estimates.
|
| A. Investment Valuation — Portfolio
securities for which accurate market quotations are readily available are valued on the basis of quotations furnished by a pricing service or provided by dealers in such securities. Portfolio securities for which accurate market quotations are not readily
available are valued based on yield equivalents, pricing matrices or other sources, under valuation procedures established by the Trust’s Board of Trustees. Short-term debt obligations maturing in sixty days or less are valued at amortized cost.
|
| B. Security Transactions and Investment Income — Security transactions are recorded as of the trade date. Realized gains and losses on sales of portfolio securities are calculated using the identified cost basis. Interest income is recorded on the basis of interest accrued, net of foreign withholding
taxes where applicable. Premiums on interest-only securities and on collateralized mortgage obligations with nominal principal amounts are amortized, on an effective yield basis, over the expected lives of the respective securities. Net investment income
(other than class specific expenses) and unrealized and realized gains or losses are allocated daily to each class of shares of the Fund based upon the relative proportion of net assets of each class.
|
| Certain mortgage security paydown gains and losses are taxable as ordinary income.
Such paydown gains and losses increase or decrease taxable ordinary income available for distribution and are classified as interest income in the accompanying Statements of Operations. Original issue discounts (“OID”) on debt securities are
amortized to interest income over the life of the security with a corresponding increase in the cost basis of that security. OID amortization on mortgage backed REMIC securities is initially recorded based on estimates of principal paydowns using the most
recent OID factors available from the issuer. Recorded amortization amounts are adjusted when actual OID factors are received. Market discounts and market premiums on debt securities, other than mortgage backed REMIC securities, are amortized to interest
income over the life of the security with a corresponding adjustment in the cost basis of that security for Core Fixed Income. Global Income amortizes only market discounts on debt securities other than REMIC mortgage backed securities.
|
| 2. SIGNIFICANT ACCOUNTING POLICIES (continued)
|
| In November 2000 the American Institute of Certified Public Accountants (AICPA)
issued a revised version of the AICPA Audit and Accounting Guide for Investment Companies (the Guide). The revised version of the Guide is effective November 1, 2001 for the Funds and will require the Funds to amortize/accrete all premiums and discounts
on debt securities. The Funds currently do not amortize/accrete all such premiums and discounts. Upon adoption, the Funds will be required to record the cumulative effect of this change. The cumulative effect will impact net investment income and realized
and unrealized gains and losses but will not impact net assets. At this time, the Funds have not completed their analysis of the impact of this accounting change.
|
| C. Federal Taxes — It is each Fund’s
policy to comply with the requirements of the Internal Revenue Code applicable to regulated investment companies and to distribute each year substantially all of its investment company taxable and tax-exempt income and capital gains to its shareholders.
Accordingly, no federal tax provisions are required. Income distributions are declared daily and paid monthly. Capital gain distributions, if any, are declared and paid annually.
|
| The characterization of distributions to shareholders for financial reporting
purposes is determined in accordance with income tax rules. Therefore, the source of a Fund’s distributions may be shown in the accompanying financial statements as either from or in excess of net investment income or net realized gain on investment
transactions, or from paid-in-capital, depending on the type of book/tax differences that may exist.
|
| The Funds, at their most recent tax year-ends of October 31, 2000, had
approximately the following amounts of capital loss carryforward for U.S. federal tax purposes. These amounts are available to be carried forward to offset future capital gains to the extent permitted by applicable laws or regulations.
|
| Fund | Amount | Years of
Expiration |
|||
|---|---|---|---|---|---|
| Enhanced Income | $ 30,594 | 2008 | |||
| Adjustable Rate Government | 51,458,376 | 2001-2008 | |||
| Short Duration Government | 19,387,082 | 2002-2008 | |||
| Government Income | 4,175,845 | 2007-2008 | |||
| Core Fixed Income | 10,774,612 | 2007-2008 | |||
| Global Income | 7,505,436 | 2007-2008 | |||
| At October 31, 2000 the Funds’ aggregate unrealized gains and losses based on
cost for federal income tax purposes was as follows:
|
| Fund | Tax Cost | Gross
Unrealized Gain |
Gross
Unrealized Loss |
Net Unrealized
Gain (Loss) |
|||||||
|---|---|---|---|---|---|---|---|---|---|---|---|
| Enhanced Income | $167,578,379 | $ 189,070 | $ (68,062 | ) | $ 121,008 | ||||||
| Adjustable Rate Government | 220,715,223 | 115,029 | (4,501,832 | ) | (4,386,803 | ) | |||||
| Short Duration Government | 189,667,807 | 409,546 | (3,498,395 | ) | (3,088,849 | ) | |||||
| Government Income | 145,496,559 | 1,041,856 | (1,286,452 | ) | (244,596 | ) | |||||
| Core Fixed Income | 380,434,319 | 3,379,607 | (5,311,715 | ) | (1,932,108 | ) | |||||
| Global Income | 618,702,054 | 5,723,864 | (35,101,670 | ) | (29,377,806 | ) | |||||
| 2. SIGNIFICANT ACCOUNTING POLICIES (continued)
|
| D. Expenses — Expenses incurred by the
Trust that do not specifically relate to an individual Fund of the Trust are allocated to the Funds on a straight-line or pro rata basis depending upon the nature of the expense.
|
| Class A, Class B and Class C shareholders of the Funds bear all expenses and fees
relating to their respective distribution and service plans. Shareholders of Service shares bear all expenses and fees paid to service organizations. Each class of shares of the Funds separately bears its respective class-specific transfer agency fees.
|
| E. Foreign Currency Translations — The
books and records of the Funds are maintained in U.S. dollars. Amounts denominated in foreign currencies are translated into U.S. dollars on the following basis: (i) investment valuations, foreign currency and other assets and liabilities initially
expressed in foreign currencies are converted each business day into U.S. dollars based upon current exchange rates; (ii) purchases and sales of foreign investments, income and expenses are converted into U.S. dollars based upon currency exchange rates
prevailing on the respective dates of such transactions.
|
| Net realized and unrealized gain (loss) on foreign currency transactions will
represent: (i) foreign exchange gains and losses from the sale and holdings of foreign currencies and sale of investments; (ii) gains and losses between trade date and settlement date on investment securities transactions and forward exchange contracts;
and (iii) gains and losses from the difference between amounts of interest recorded and the amounts actually received.
|
| F. Mortgage Dollar Rolls — The Funds may
enter into mortgage “dollar rolls” in which the Funds sell securities in the current month for delivery and simultaneously contract with the same counterparty to repurchase similar (same type, coupon and maturity) but not identical securities on
a specified future date. For financial reporting and tax reporting purposes, the Funds treat mortgage dollar rolls as two separate transactions; one involving the purchase of a security and a separate transaction involving a sale.
|
| G. Segregation Transactions — The Funds
may enter into certain derivative transactions to seek to increase total return. Forward foreign currency exchange contracts, futures contracts, written options, mortgage dollar rolls, when-issued securities and forward commitments represent examples of
such transactions. As a result of entering into those transactions, the Funds are required to segregate liquid assets on the accounting records equal to or greater than the market value of the corresponding transactions.
|
| H. Repurchase Agreements — Repurchase
agreements involve the purchase of securities subject to the seller’s agreement to repurchase them at a mutually agreed upon date and price. During the term of a repurchase agreement, the value of the underlying securities, including accrued
interest, is required to equal or exceed the value of the repurchase agreement. The underlying securities for all repurchase agreements are held in safekeeping by a bank custodian.
|
| 3. AGREEMENTS
|
| Pursuant to the Investment Management Agreements (the “Agreements”), Goldman Sachs Funds Management, L.P. (“
GSFM”), an affiliate of Goldman, Sachs & Co. (“Goldman Sachs”), serves as the investment adviser for Adjustable Rate Government and Short Duration Government. Goldman Sachs Asset Management (“GSAM”), a unit of the Investment
Management Division of Goldman Sachs, serves as the investment adviser for Enhanced Income, Government Income and Core Fixed Income. Goldman Sachs Asset Management International (“GSAMI”), an affiliate of GSAM, serves as the investment adviser
for Global Income. Under the Agreements, the respective adviser, subject to the general supervision of the Trust’s Board of Trustees, manages the Funds’ portfolios. As compensation for the services rendered pursuant to the Agreements, the
assumption of the expenses related thereto and administering the Funds’ business affairs, including providing facilities, the adviser is entitled to a fee, computed daily and payable monthly at an annual rate equal to .25%, .40%, .50%, .65%, .40% and
.90% of average daily net assets of Enhanced Income, Adjustable Rate Government, Short Duration Government, Government Income, Core Fixed Income and Global Income, respectively. For the period ended October 31, 2000, the advisers for Enhanced Income,
Government Income and Global Income voluntarily have agreed to waive a portion of their management fee equal annually to .05%, .11% and .25%, respectively, of each Fund’s average daily net assets. The advisers may discontinue or modify these waivers
in the future at their discretion.
|
| Each adviser has voluntarily agreed to limit “Other Expenses” (excluding
management fees, distribution and service fees, transfer agent fees, taxes, interest, brokerage, litigation, service share fees, indemnification costs and other extraordinary expenses) to the extent that such expenses exceed, on an annual basis, .01%,
.05%, .00%, .00%, .10% and .00% of the average daily net assets of Enhanced Income, Adjustable Rate Government, Short Duration Government, Government Income, Core Fixed Income and Global Income, respectively.
|
| Goldman Sachs serves as Distributor of the shares of the Funds pursuant to a
Distribution Agreement. Goldman Sachs may receive a portion of the Class A sales load and Class B and Class C contingent deferred sales charges and has advised the Funds that it retained approximately $1,000, $7,000, $8,000, $42,000, $112,000 and $104,000
for the period ended October 31, 2000
for Enhanced Income, Adjustable Rate Government, Short Duration Government, Government Income, Core Fixed Income and Global Income, respectively. |
| The Trust, on behalf of each Fund, has adopted Distribution and Service Plans.
Under the Distribution and Service Plans, Goldman Sachs and/or Authorized Dealers are entitled to a monthly fee from each fund for distribution services and shareholder maintenance equal, on an annual basis, to .25% for Enhanced Income Class A, .50%,
1.00% and 1.00% for Global Income and .25%, 1.00% and 1.00% of each of the other funds’ average daily net assets attributable to Class A, Class B and Class C shares, respectively. For the period ended October 31, 2000, Goldman Sachs has voluntarily
agreed to waive a portion of the Distribution and Service fees equal to .15% of the average daily net assets attributable to the Class B shares of Short Duration Government. Goldman Sachs may discontinue or modify this waiver in the future at its discretion
.
|
| Goldman Sachs also serves as Transfer Agent of the Funds for a fee. Fees charged
for such transfer agency services are calculated daily and payable monthly at an annual rate as follows: .19% of the average daily net assets for Class A, Class B and Class C shares and .04% of the average daily net assets for Administration (Enhanced
Income only), Institutional and Service shares.
|
| The Trust, on behalf of the Funds, has adopted Service Plans. In addition, the
Trust, on behalf of Enhanced Income, has adopted an Administration Plan. These plans allow for Administration and Service shares to compensate service organizations for providing varying levels of account administration and shareholder liaison services to
their customers who are beneficial owners of such shares. The Administration and Service Plans provide for compensation to the service organizations in an amount up to, on an annual basis, .25% and .50%, respectively, of the average daily net asset value
of each share class.
|
| 3. AGREEMENTS (continued)
|
| For the period ended October 31, 2000, the advisors and distributor have
voluntarily agreed to waive certain fees and reimburse other expenses. In addition, the Funds have entered into certain offset arrangements with the Custodian resulting in a reduction of the Funds’ expenses. For the period ended October 31, 2000,
expense reductions were as follows (in thousands):
|
| Fund | Waivers |
Expense
Reimbursement |
Custody
Credit |
Total
Expense Reductions |
|||||||
|---|---|---|---|---|---|---|---|---|---|---|---|
| Management | Class B
Distribution and Service |
||||||||||
| Enhanced Income | $ 11 | $— | $217 | $ 2 | $ 230 | ||||||
| Adjustable Rate Government | — | — | 171 | 3 | 174 | ||||||
| Short Duration Government | — | 9 | 359 | 4 | 372 | ||||||
| Government Income | 122 | — | 330 | 2 | 454 | ||||||
| Core Fixed Income | — | — | 91 | 15 | 106 | ||||||
| Global Income | 1,462 | — | 621 | 11 | 2,094 | ||||||
| 4. PORTFOLIO SECURITY TRANSACTIONS
|
| At October 31, 2000, the amounts owed to affiliates were as follows (in thousands):
|
| Fund | Management | Distribution
and Service |
Transfer
Agent |
Total | |||||
|---|---|---|---|---|---|---|---|---|---|
| Enhanced Income | $ 22 | $ 1 | $ 5 | $ 28 | |||||
| Adjustable Rate Government | 72 | 9 | 12 | 93 | |||||
| Short Duration Government | 76 | 15 | 12 | 103 | |||||
| Government Income | 55 | 40 | 18 | 113 | |||||
| Core Fixed Income | 130 | 35 | 27 | 192 | |||||
| Global Income | 334 | 145 | 61 | 540 | |||||
| 4. PORTFOLIO SECURITY TRANSACTIONS (continued)
|
| Cost of purchases and proceeds of sales and maturities of long-term securities for the period ended October 31, 2000, were as
follows:
|
| Fund | Purchases of
U.S. Government and agency obligations |
Purchases
(excluding U.S. Government and agency obligations) |
Sales and
maturities of U.S. Government and agency obligations |
Sales and maturities
(excluding U.S. Government and agency obligations) |
|||||
|---|---|---|---|---|---|---|---|---|---|
| Enhanced Income | $153,968,257 | $ 44,250,334 | $ 32,186,461 | $ — | |||||
| Adjustable Rate Government | 26,303,927 | — | 101,744,473 | — | |||||
| Short Duration Government | 249,279,097 | — | 265,861,733 | — | |||||
| Government Income | 375,985,226 | 2,996,790 | 362,022,227 | 5,330,542 | |||||
| Core Fixed Income | 851,217,228 | 143,033,481 | 821,371,682 | 96,569,833 | |||||
| Global Income | 337,881,081 | 750,426,226 | 297,386,658 | 723,802,129 | |||||
| Forward Foreign Currency Exchange Contracts — Core
Fixed Income and Global Income may enter into forward foreign currency exchange contracts for the purchase or sale of a specific foreign currency at a fixed price on a future date as a hedge or cross-hedge against either specific transactions or portfolio
positions. Core Fixed Income and Global Income may also purchase and sell forward contracts to seek to increase total return. All commitments are “marked-to-market” daily at the applicable translation rates and any resulting unrealized gains or
losses are recorded in the Funds’ financial statements.
The Funds record realized gains or losses at the time a forward contract is offset by entry into a closing transaction or extinguished by delivery of the currency. Risks may arise upon entering into these contracts from the potential inability of counterparties to meet the terms of their contracts and from unanticipated movements in the value of a foreign currency relative to the U.S. dollar. |
| At October 31, 2000, Core Fixed Income had outstanding forward foreign currency
exchange contracts to sell foreign currencies as follows:
|
| Open Foreign Currency
Sales Contracts |
Value on
Settlement Date |
Current Value | Unrealized |
||||||
|---|---|---|---|---|---|---|---|---|---|
| Gain | Loss | ||||||||
| Euro Currency | |||||||||
| expiring 11/13/2000 | $15,499,357 | $15,070,122 | $429,235 | $— | |||||
| New Zealand Dollar | |||||||||
| expiring 11/15/2000 | 4,236,515 | 4,169,006 | 67,509 | — | |||||
| TOTAL OPEN FOREIGN CURRENCY SALE CONTRACTS | $19,735,872 | $19,239,128 | $496,744 | $— | |||||
| 4. PORTFOLIO SECURITY TRANSACTIONS (continued)
|
| At October 31, 2000, Global Income had outstanding forward foreign currency
exchange contracts, both to purchase and sell foreign currencies as follows:
|
| Open Foreign Currency
Purchase Contracts |
Value on
Settlement Date |
Current Value | Unrealized |
||||||
|---|---|---|---|---|---|---|---|---|---|
| Gain | Loss | ||||||||
| Euro Currency | |||||||||
| expiring 11/17/2000 | $ 231,692 | $ 225,203 | $ — | $ 6,489 | |||||
| expiring 12/14/2000 | 3,772,584 | 3,731,381 | — | 41,203 | |||||
| expiring 1/18/2001 | 1,236,701 | 1,240,430 | 3,729 | — | |||||
| TOTAL OPEN FOREIGN CURRENCY PURCHASE CONTRACTS | $5,240,977 | $5,197,014 | $3,729 | $47,692 | |||||
| Open Foreign Currency
Sale Contracts |
Value on
Settlement Date |
Current Value | Unrealized |
||||||
| Gain | Loss | ||||||||
| Australian Dollar | |||||||||
| expiring 1/19/2001 | $ 7,573,000 | $ 7,529,498 | $ 43,502 | $ — | |||||
| British Pounds | |||||||||
| expiring 12/14/2000 | 38,762,990 | 40,025,099 | — | 1,262,109 | |||||
| Canadian Dollar | |||||||||
| expiring 12/13/2000 | 14,093,375 | 13,859,722 | 233,653 | — | |||||
| Danish Krone | |||||||||
| expiring 1/24/2001 | 11,261,997 | 11,247,944 | 14,053 | — | |||||
| Euro Currency | |||||||||
| expiring 1/18/2001 | 182,136,414 | 177,716,444 | 4,419,970 | — | |||||
| Greek Drachma | |||||||||
| expiring 11/10/2000 | 12,893,906 | 12,029,988 | 863,918 | — | |||||
| Japanese Yen | |||||||||
| expiring 11/17/2000 | 116,341,593 | 114,590,808 | 1,750,785 | — | |||||
| New Zealand Dollar | |||||||||
| expiring 11/15/2000 | 12,610,640 | 12,272,211 | 338,429 | — | |||||
| Swedish Krona | |||||||||
| expiring 12/12/2000 | 6,793,770 | 6,653,515 | 140,255 | — | |||||
| TOTAL OPEN FOREIGN CURRENCY SALE CONTRACTS | $402,467,685 | $395,925,229 | $7,804,565 | $1,262,109 | |||||
| 4. PORTFOLIO SECURITY TRANSACTIONS (continued)
|
| Closed but Unsettled Forward
Currency Contracts |
Purchase
Value |
Sale Value | Realized |
||||||
|---|---|---|---|---|---|---|---|---|---|
| Gain | Loss | ||||||||
| Japanese Yen | |||||||||
| expiring 11/17/2000 | $21,810,974 | $21,647,732 | $ — | $163,242 | |||||
| expiring 11/17/2000 | 22,267,891 | 22,346,225 | 78,334 | — | |||||
| Euro Currency | |||||||||
| expiring 11/17/2000 | 11,408,930 | 11,432,158 | 23,228 | — | |||||
| expiring 11/17/2000 | 3,715,858 | 3,711,843 | — | 4,015 | |||||
| expiring 1/18/2001 | 374,197 | 384,211 | 10,014 | — | |||||
| Canadian Dollar | |||||||||
| expiring 12/13/2000 | 955,351 | 956,560 | 1,209 | — | |||||
| British Pounds | |||||||||
| expiring 12/14/2000 | 1,324,403 | 1,308,257 | — | 16,145 | |||||
| TOTAL CLOSED BUT UNSETTLED FORWARD
CURRENCY CONTRACTS |
$61,857,604 | $61,786,986 | $112,785 | $183,402 | |||||
| The contractual amounts of forward foreign currency exchange contracts do not
necessarily represent the amounts potentially subject to risk. The measurement of the risks associated with these instruments is meaningful only when all related and offsetting transactions are considered. At October 31, 2000, Global Income and Core Fixed
Income had sufficient cash and/or securities to cover any commitments under these contracts.
|
| Futures Contracts — The Funds may enter into futures
transactions to hedge against changes in interest rates, securities prices, currency exchange rates (in the case of Core Fixed Income and Global Income) or to seek to increase total return. Upon entering into a futures contract, the Funds are required to
deposit with a broker an amount of cash or securities equal to the minimum “initial margin” requirement of the associated futures exchange. Subsequent payments for futures contracts (“variation margin”) are paid or received by the
Funds daily, dependent on the daily fluctuations in the value of the contracts, and are recorded for financial reporting purposes as unrealized gains or losses. When contracts are closed, the Funds realize a gain or loss which is reported in the
Statements of Operations.
|
| The use of futures contracts involve, to varying degrees, elements of market and
counterparty risk which may exceed the amounts recognized in the Statements of Assets and Liabilities. Changes in the value of the futures contract may not directly correlate with changes in the value of the underlying securities. This risk may decrease
the effectiveness of the Funds’ strategies and potentially result in a loss.
|
| For the period ended October 31, 2000, Enhanced Income, Adjustable Rate
Government, Short Duration Government, Government Income, Core Fixed Income and Global Income incurred commission expenses of approximately $700, $15,000, $22,000, $5,000, $19,000 and $65,000, respectively, in connection with futures contracts entered
into with Goldman Sachs.
|
| 4. PORTFOLIO SECURITY TRANSACTIONS (continued)
|
| At October 31, 2000 the following futures contracts were open as follows:
|
| Fund | Type | Number of
Contracts Long (Short) |
Settlement Month | Market Value | Unrealized
Gain (Loss) |
||||||||
|---|---|---|---|---|---|---|---|---|---|---|---|---|---|
| Enhanced Income Fund | 5 Year U.S. Treasury Notes | (78) | December 2000 | $ 7,853,615 | $ (12,609 | ) | |||||||
| 2 Year U.S. Treasury Notes | (51) | December 2000 | 10,206,375 | (10,664 | ) | ||||||||
| $ 18,059,990 | $ (23,273 | ) | |||||||||||
| Adjustable Rate Government Fund | Euro Dollars | 160 | December 2000 | $ 37,316,000 | $ 19,665 | ||||||||
| Euro Dollars | 20 | March 2001 | 4,674,250 | 130 | |||||||||
| 5 Year U.S. Treasury Notes | 48 | December 2000 | 4,833,000 | 15,580 | |||||||||
| 10 Year U.S. Treasury Notes | (93) | December 2000 | (9,365,391 | ) | (83,418 | ) | |||||||
| 20 Year U.S. Treasury Bonds | 26 | December 2000 | 2,595,938 | (12,317 | ) | ||||||||
| $ 40,053,797 | $ (60,360 | ) | |||||||||||
| Short Duration Government Fund | Euro Dollars | 50 | December 2000 | $ 11,661,250 | $ (17,929 | ) | |||||||
| 2 Year U.S. Treasury Notes | 488 | December 2000 | 97,661,000 | 358,372 | |||||||||
| 5 Year U.S. Treasury Notes | (350) | December 2000 | (35,240,626 | ) | (294,785 | ) | |||||||
| 10 Year U.S. Treasury Notes | (136) | December 2000 | (13,695,626 | ) | (126,743 | ) | |||||||
| 20 Year U.S. Treasury Notes | (23) | December 2000 | (2,296,406 | ) | (29,851 | ) | |||||||
| $ 58,089,592 | $(110,936 | ) | |||||||||||
| Government Income Fund | Euro Dollars | 32 | December 2000 | $ 7,463,200 | $ 6,240 | ||||||||
| Euro Dollars | 10 | March 2001 | 2,337,125 | 8,200 | |||||||||
| Euro Dollars | 10 | June 2001 | 2,339,375 | 11,325 | |||||||||
| Euro Dollars | 10 | September 2001 | 2,340,250 | 12,200 | |||||||||
| 2 Year U.S. Treasury Notes | 20 | December 2000 | 4,002,500 | 16,775 | |||||||||
| 5 Year U.S. Treasury Notes | (72) | December 2000 | 7,249,500 | (55,772 | ) | ||||||||
| 10 Year U.S. Treasury Notes | 115 | December 2000 | 11,580,859 | 22,184 | |||||||||
| 20 Year U.S. Treasury Bonds | 43 | December 2000 | 4,293,282 | (19,035 | ) | ||||||||
| $ 41,606,091 | $ 2,117 | ||||||||||||
| Core Fixed Income Fund | Eurodollars | 39 | September 2002 | $ 9,113,813 | $ 62,549 | ||||||||
| Eurodollars | 39 | December 2002 | 9,103,575 | 55,712 | |||||||||
| Eurodollars | 39 | March 2003 | 9,106,500 | 52,300 | |||||||||
| Eurodollars | 39 | June 2003 | 9,102,600 | 48,400 | |||||||||
| Eurodollars | 39 | September 2003 | 9,099,188 | 45,125 | |||||||||
| Eurodollars | 39 | December 2003 | 9,089,925 | 41,225 | |||||||||
| Eurodollars | 39 | March 2004 | 9,092,850 | 39,237 | |||||||||
| Eurodollars | 39 | June 2004 | 9,088,950 | 38,262 | |||||||||
| 2 Year U.S. Treasury Notes | 125 | December 2000 | 25,015,625 | 100,000 | |||||||||
| 5 Year U.S. Treasury Notes | (633) | December 2000 | 63,735,187 | (464,337 | ) | ||||||||
| 10 Year U.S. Treasury Notes | 170 | December 2000 | 17,119,531 | 88,421 | |||||||||
| 30 Year U.S. Treasury Bonds | 261 | December 2000 | 26,059,219 | (75,524 | ) | ||||||||
| $204,726,963 | $ 31,370 | ||||||||||||
| Global Income Fund | 5 Year Euro | 107 | December 2000 | $ 9,405,089 | $ 72,640 | ||||||||
| 10 Year Euro | 359 | December 2000 | 32,128,128 | 188,033 | |||||||||
| 5 Year U.S. Treasury Notes | (268) | December 2000 | (26,984,250 | ) | (289,078 | ) | |||||||
| 10 Year U.S. Treasury Notes | 60 | December 2000 | 6,042,188 | 60,242 | |||||||||
| 10 Year U.S. Treasury Notes | (364) | December 2000 | (36,655,938 | ) | (483,438 | ) | |||||||
| 20 Year U.S. Treasury Bonds | 81 | December 2000 | (8,087,344 | ) | (56,063 | ) | |||||||
| 20 Year U.S. Treasury Bonds | (16) | December 2000 | (1,597,500 | ) | (3,625 | ) | |||||||
| 10 Year Japan Bonds | 23 | December 2000 | 28,106,311 | 546,764 | |||||||||
| $ 2,356,684 | $ 35,475 | ||||||||||||
| 5. JOINT REPURCHASE AGREEMENT ACCOUNT
|
| The Funds, together with other registered investment companies having management agreements with GSFM, GSAMI and GSAM or their
affiliates, transfer uninvested cash into joint accounts, the daily aggregate balance of which is invested in one or more repurchase agreements.
|
| At October 31, 2000, Enhanced Income, Adjustable Rate Government, Short Duration
Government, Government Income and Core Fixed Income had undivided interests in repurchase agreements in the following joint account which equaled $1,300,000, $18,500,000, $4,700,000, $19,800,000 and $5,100,000, respectively, in principal amount. At
October 31, 2000, the following repurchase agreements held in this joint account were fully collateralized by Federal Agency obligations.
|
| Repurchase Agreements | Principal
Amount |
Interest
Rate |
Maturity
Date |
Amortized
Cost |
Maturity
Value |
|||||||
|---|---|---|---|---|---|---|---|---|---|---|---|---|
| ABN/AMRO, Inc. | $400,000,000 | 6.63 | % | 11/01/2000 | $ 400,000,000 | $ 400,073,667 | ||||||
| ABN/AMRO, Inc. | 150,000,000 | 6.56 | 11/01/2000 | 150,000,000 | 150,027,333 | |||||||
| Banc of America Securities LLC | 900,000,000 | 6.62 | 11/01/2000 | 900,000,000 | 900,165,500 | |||||||
| Barclays Capital, Inc. | 200,000,000 | 6.62 | 11/01/2000 | 200,000,000 | 200,036,778 | |||||||
| Bear Stearns Companies, Inc. | 500,000,000 | 6.62 | 11/01/2000 | 500,000,000 | 500,091,944 | |||||||
| Chase Securities, Inc. | 300,000,000 | 6.62 | 11/01/2000 | 300,000,000 | 300,055,167 | |||||||
| Salomon Smith Barney Holdings, Inc. | 809,100,000 | 6.62 | 11/01/2000 | 809,100,000 | 809,248,785 | |||||||
| SG Cowen Securities | 100,000,000 | 6.62 | 11/01/2000 | 100,000,000 | 100,018,389 | |||||||
| TOTAL JOINT REPURCHASE AGREEMENT ACCOUNT | $3,359,100,000 | $3,359,717,563 | ||||||||||
| 6. LINE OF CREDIT FACILITY
|
| Effective May 31, 2000, the Funds participate in a $350,000,000 committed, unsecured revolving line of credit facility. Prior
thereto, the Funds participated in a $250,000,000 uncommitted and a $250,000,000 committed, unsecured revolving line of credit facility. Under the most restrictive arrangement, each Fund must own securities having a market value in excess of 400% of the
total bank borrowings. These facilities are to be used solely for temporary or emergency purposes. The interest rate on borrowings is based on the Federal Funds rate. The committed facilities also require a fee to be paid by the Funds based on the amount
of the commitment. During the period ended October 31, 2000, the Funds did not have any borrowings under any of these facilities.
|
| 7. OTHER MATTERS
|
| As of October 31, 2000, the Goldman Sachs Growth and Income Strategy Portfolio was the beneficial owner of approximately 9%, 16%
and 6% of Core Fixed Income, Global Income and Short Duration Government, respectively. The Goldman Sachs Growth Strategy Portfolio was the beneficial owner of approximately 6% of Global Income. The Goldman Sachs Conservative Strategy Portfolio was the
beneficial owner of approximately 5% of Short Duration Government. The Goldman Sachs Balanced Strategy Portfolio was the beneficial owner of approximately 17% of Short Duration Government.
|
| 8. CERTAIN RECLASSIFICATIONS
|
| In accordance with Statement of Position 93-2, Enhanced Income has reclassified $16,535 from paid-in capital to accumulated
distributions in excess of net investment income. Adjustable Rate Government has reclassified $1,137,543 from paid-in capital to accumulated net realized loss on investment, futures and foreign currency related transactions. Core Fixed Income has
reclassified $467,361 and $3,020 from accumulated undistributed net investment income and paid-in capital, respectively, to accumulated net realized loss on investment, futures and foreign currency related transactions. Global Income has reclassified
$36,017,097 from accumulated realized gain on investment, futures and foreign currency related transactions to accumulated undistributed net investment income.
|
| These reclassifications have no impact on the net asset value of each Fund and are
designed to present each Fund’s capital accounts on a tax basis. Reclassifications result primarily from the difference in the tax treatment of net operating losses and organization costs.
|
| 9. CHANGE IN INDEPENDENT AUDITORS
|
| On October 26, 1999, the Board of Trustees of the Funds, upon the recommendation of the Board’s audit committee, determined
not to retain Arthur Andersen LLP and approved a change of the Funds’ independent auditors to Ernst & Young LLP. For the fiscal years ended October 31, 1999 and October 31, 1998, Arthur Andersen LLP’s audit reports contained no adverse
opinion or disclaimer of opinion; nor were their reports qualified or modified as to uncertainty, audit scope, or accounting principles. Further, there were no disagreements between the Funds and Arthur Andersen LLP on accounting principles or practices,
financial statement disclosure or audit scope or procedure, which if not resolved to the satisfaction of Arthur Andersen LLP would have caused them to make reference to the disagreement in their report.
|
| 9. SUMMARY OF SHARE TRANSACTIONS
|
| Share activity for the period ended October 31, 2000 is as follows:
|
| Enhanced Income Fund
(a)
|
Adjustable Rate Government Fund |
||||||||||||||||||||||||||||||||
|---|---|---|---|---|---|---|---|---|---|---|---|---|---|---|---|---|---|---|---|---|---|---|---|---|---|---|---|---|---|---|---|---|---|
| Shares | Dollars | Shares | Dollars | ||||||||||||||||||||||||||||||
| Class A Shares | |||||||||||||||||||||||||||||||||
| Shares sold | 1,309,122 | $ 13,096,645 | 7,631,735 | $ 73,106,073 | |||||||||||||||||||||||||||||
| Reinvestment of dividends and distributions | 3,795 | 37,952 | 149,653 | 1,436,142 | |||||||||||||||||||||||||||||
| Shares repurchased | (79,622 | ) | (793,412 | ) | (5,848,957 | ) | (56,084,810 | ) | |||||||||||||||||||||||||
| 1,233,295 | 12,341,185 | 1,932,431 | 18,457,405 | ||||||||||||||||||||||||||||||
| Class B Shares | |||||||||||||||||||||||||||||||||
| Shares sold | — | — | — | — | |||||||||||||||||||||||||||||
| Reinvestment of dividends and distributions | — | — | — | — | |||||||||||||||||||||||||||||
| Shares repurchased | — | — | — | — | |||||||||||||||||||||||||||||
| — | — | — | — | ||||||||||||||||||||||||||||||
| Class C Shares | |||||||||||||||||||||||||||||||||
| Shares sold | — | — | — | — | |||||||||||||||||||||||||||||
| Reinvestment of dividends and distributions | — | — | — | — | |||||||||||||||||||||||||||||
| Shares repurchased | — | — | — | — | |||||||||||||||||||||||||||||
| — | — | — | — | ||||||||||||||||||||||||||||||
| Institutional Shares | |||||||||||||||||||||||||||||||||
| Shares sold | 16,657,796 | 166,577,348 | 11,421,530 | 109,930,117 | |||||||||||||||||||||||||||||
| Reinvestment of dividends and distributions | 142,745 | 1,427,186 | 630,939 | 6,063,431 | |||||||||||||||||||||||||||||
| Shares repurchased | (1,146,925 | ) | (11,464,260 | ) | (26,248,723 | ) | (252,545,273 | ) | |||||||||||||||||||||||||
| 15,653,616 | 156,540,274 | (14,196,254 | ) | (136,551,725 | ) | ||||||||||||||||||||||||||||
| Administration Shares | |||||||||||||||||||||||||||||||||
| Shares sold | 150 | 1,500 | — | — | |||||||||||||||||||||||||||||
| Reinvestment of dividends and distributions | 2 | 25 | — | — | |||||||||||||||||||||||||||||
| Shares repurchased | — | — | — | — | |||||||||||||||||||||||||||||
| 152 | 1,525 | — | — | ||||||||||||||||||||||||||||||
| Service Shares | |||||||||||||||||||||||||||||||||
| Shares sold | — | — | 24,586 | 236,464 | |||||||||||||||||||||||||||||
| Reinvestment of dividends and distributions | — | — | 2,465 | 23,746 | |||||||||||||||||||||||||||||
| Shares repurchased | — | — | (102,148 | ) | (985,797 | ) | |||||||||||||||||||||||||||
| — | — | (75,097 | ) | (725,587 | ) | ||||||||||||||||||||||||||||
| NET INCREASE (DECREASE) | 16,887,063 | $168,882,984 | (12,338,920 | ) | $(118,819,907 | ) | |||||||||||||||||||||||||||
(a)
|
Commencement date of operations was August 2, 2000 for all share classes.
|
| Short Duration Government Fund | Government Income Fund | Core Fixed Income Fund | Global Income Fund | |||||||||||||||||||
|---|---|---|---|---|---|---|---|---|---|---|---|---|---|---|---|---|---|---|---|---|---|---|
| Shares | Dollars | Shares | Dollars | Shares | Dollars | Shares | Dollars | |||||||||||||||
| 4,415,482 | $41,870,067 | 5,324,059 | $72,667,974 | 14,298,789 | $134,060,216 | 7,863,577 | $114,466,099 | |||||||||||||||
| 196,214 | 1,854,058 | 311,987 | 4,248,495 | 400,626 | 3,770,640 | 648,182 | 9,418,387 | |||||||||||||||
| (6,966,508 | ) | (65,814,234 | ) | (5,212,114 | ) | (70,878,881 | ) | (13,828,458 | ) | (129,964,521) | (7,198,137 | ) | (104,729,225 | ) | ||||||||
| (2,354,812 | ) | (22,090,109 | ) | 423,932 | 6,037,588 | 870,957 | 7,866,335 | 1,313,622 | 19,155,261 | |||||||||||||
| 592,013 | 5,589,396 | 735,536 | 10,054,831 | 543,494 | 5,131,440 | 604,473 | 8,781,301 | |||||||||||||||
| 25,868 | 243,817 | 45,530 | 623,559 | 48,050 | 453,218 | 40,323 | 585,085 | |||||||||||||||
| (737,108 | ) | (6,954,462 | ) | (864,110 | ) | (11,749,089 | ) | (663,871 | ) | (6,256,295) | (299,038 | ) | (4,335,150 | ) | ||||||||
| (119,227 | ) | (1,121,249 | ) | (83,044 | ) | (1,070,699 | ) | (72,327 | ) | (671,637) | 345,758 | 5,031,236 | ||||||||||
| 719,492 | 6,779,324 | 176,657 | 2,409,167 | 209,522 | 1,979,413 | 120,937 | 1,753,653 | |||||||||||||||
| 33,486 | 314,963 | 25,375 | 345,364 | 24,376 | 230,007 | 11,865 | 171,647 | |||||||||||||||
| (947,132 | ) | (8,919,036 | ) | (385,865 | ) | (5,225,078 | ) | (375,956 | ) | (3,538,345) | (265,152 | ) | (3,841,528 | ) | ||||||||
| (194,154 | ) | (1,824,749 | ) | (183,833 | ) | (2,470,547 | ) | (142,058 | ) | (1,328,925) | (132,350 | ) | (1,916,228 | ) | ||||||||
| 3,408,576 | 32,148,069 | 167,902 | 2,256,752 | 14,904,707 | 140,874,419 | 3,105,059 | 45,145,774 | |||||||||||||||
| 466,462 | 4,400,822 | 24,417 | 332,186 | 1,049,101 | 9,904,167 | 340,260 | 4,938,631 | |||||||||||||||
| (5,269,038 | ) | (49,759,937 | ) | (79,548 | ) | (1,070,688 | ) | (10,622,506 | ) | (100,502,849) | (3,184,125 | ) | (46,287,361 | ) | ||||||||
| (1,394,000 | ) | (13,211,046 | ) | 112,771 | 1,518,250 | 5,331,302 | 50,275,737 | 261,194 | 3,797,044 | |||||||||||||
| — | — | — | — | — | — | — | — | |||||||||||||||
| — | — | — | — | — | — | — | — | |||||||||||||||
| — | — | — | — | — | — | — | — | |||||||||||||||
| — | — | — | — | — | — | — | — | |||||||||||||||
| 263,184 | 2,483,903 | 116,168 | 1,596,121 | 353,223 | 3,328,297 | 74,768 | 1,087,128 | |||||||||||||||
| 41,945 | 395,273 | 1,075 | 14,641 | 52,796 | 498,116 | 4,648 | 67,490 | |||||||||||||||
| (348,084 | ) | (3,271,621 | ) | (91,374 | ) | (1,257,309 | ) | (274,799 | ) | (2,585,909) | (24,484 | ) | (356,910 | ) | ||||||||
| (42,955 | ) | (392,445 | ) | 25,869 | 353,453 | 131,220 | 1,240,504 | 54,932 | 797,708 | |||||||||||||
| (4,105,148 | ) | $(38,639,598 | ) | 295,695 | $ 4,368,045 | 6,119,094 | $ 57,382,014 | 1,843,156 | $ 26,865,021 | |||||||||||||
| 9. SUMMARY OF SHARE TRANSACTIONS
|
| Share activity for the year ended October 31, 1999 is as follows:
|
| Adjustable Rate Government | Short Duration Government | ||||||||||||
|---|---|---|---|---|---|---|---|---|---|---|---|---|---|
| Shares | Dollars | Shares | Dollars | ||||||||||
| Class A Shares | |||||||||||||
| Shares sold | 31,904,130 | $307,792,374 | 10,095,040 | $ 98,117,271 | |||||||||
| Reinvestment of dividends and distributions | 119,965 | 1,158,237 | 216,498 | 2,098,601 | |||||||||
| Shares repurchased | (35,923,098 | ) | (346,731,900 | ) | (10,580,288 | ) | (102,834,224 | ) | |||||
| (3,899,003 | ) | (37,781,289 | ) | (268,750 | ) | (2,618,352 | ) | ||||||
| Class B Shares | |||||||||||||
| Shares sold | — | — | 536,977 | 5,189,723 | |||||||||
| Reinvestment of dividends and distributions | — | — | 19,167 | 185,709 | |||||||||
| Shares repurchased | — | — | (338,423 | ) | (3,279,805 | ) | |||||||
| — | — | 217,721 | 2,095,627 | ||||||||||
| Class C Shares | |||||||||||||
| Shares sold | — | — | 8,886,376 | 86,234,626 | |||||||||
| Reinvestment of dividends and distributions | — | — | 20,160 | 197,199 | |||||||||
| Shares repurchased | — | — | (8,627,888 | ) | (83,700,711 | ) | |||||||
| — | — | 278,648 | 2,731,114 | ||||||||||
| Institutional Shares | |||||||||||||
| Shares sold | 20,323,432 | 196,917,377 | 9,547,581 | 92,884,069 | |||||||||
| Reinvestment of dividends and distributions | 1,061,620 | 10,265,385 | 513,104 | 4,969,995 | |||||||||
| Shares repurchased | (34,221,185 | ) | (331,249,902 | ) | (9,495,933 | ) | (92,157,561 | ) | |||||
| (12,836,133 | ) | (124,067,140 | ) | 564,752 | 5,696,503 | ||||||||
| Administration Shares | |||||||||||||
| Shares sold | 68,624 | 664,460 | 89,932 | 879,455 | |||||||||
| Reinvestment of dividends and distributions | 11,849 | 114,653 | 21,750 | 212,241 | |||||||||
| Shares repurchased | (699,098 | ) | (6,780,446 | ) | (853,809 | ) | (8,273,964 | ) | |||||
| (618,625 | ) | (6,001,333 | ) | (742,127 | ) | (7,182,268 | ) | ||||||
| Service Shares | |||||||||||||
| Shares sold | 41,184 | 399,000 | 220,831 | 2,138,369 | |||||||||
| Reinvestment of dividends and distributions | 3,813 | 36,897 | 35,301 | 341,399 | |||||||||
| Shares repurchased | (47,218 | ) | (457,580 | ) | (195,427 | ) | (1,896,564 | ) | |||||
| (2,221 | ) | (21,683 | ) | 60,705 | 583,204 | ||||||||
| NET INCREASE (DECREASE) | (17,355,982 | ) | $(167,871,445 | ) | 110,949 | $ 1,305,828 | |||||||
| Government Income | Core Fixed Income | Global Income | ||||||||||||||
|---|---|---|---|---|---|---|---|---|---|---|---|---|---|---|---|---|
| Shares | Dollars | Shares | Dollars | Shares | Dollars | |||||||||||
| 15,480,704 | $221,875,202 | 15,664,674 | $153,790,343 | 11,408,207 | $172,565,659 | |||||||||||
| 399,303 | 5,661,524 | 364,578 | 3,579,460 | 893,424 | 13,446,916 | |||||||||||
| (16,666,682 | ) | (239,289,704) | (14,632,982 | ) | (143,984,124 | ) | (7,423,402 | ) | (111,559,802 | ) | ||||||
| (786,675 | ) | (11,752,978) | 1,396,270 | 13,385,679 | 4,878,229 | 74,452,773 | ||||||||||
| 995,374 | 14,092,144 | 1,292,427 | 12,801,294 | 799,694 | 11,962,762 | |||||||||||
| 63,277 | 898,159 | 45,231 | 443,248 | 37,347 | 559,007 | |||||||||||
| (704,136 | ) | (9,886,884) | (499,533 | ) | (4,888,859 | ) | (200,617 | ) | (2,973,643 | ) | ||||||
| 354,515 | 5,103,419 | 838,125 | 8,355,683 | 636,424 | 9,548,126 | |||||||||||
| 584,857 | 8,274,255 | 731,786 | 7,234,043 | 427,735 | 6,481,148 | |||||||||||
| 44,022 | 624,389 | 26,464 | 260,185 | 19,764 | 296,195 | |||||||||||
| (541,898 | ) | (7,636,754) | (519,952 | ) | (5,098,447 | ) | (170,181 | ) | (2,517,755 | ) | ||||||
| 86,981 | 1,261,890 | 238,298 | 2,395,781 | 277,318 | 4,259,588 | |||||||||||
| 357,908 | 5,057,233 | 12,407,934 | 122,028,595 | 10,355,146 | 156,504,371 | |||||||||||
| 18,233 | 257,175 | 849,565 | 8,328,838 | 419,045 | 6,293,031 | |||||||||||
| (122,650 | ) | (1,741,188) | (9,506,792 | ) | (94,135,666 | ) | (2,870,867 | ) | (42,857,412 | ) | ||||||
| 253,491 | 3,573,220 | 3,750,707 | 36,221,767 | 7,903,324 | 119,939,990 | |||||||||||
| — | — | 285,215 | 2,874,182 | — | — | |||||||||||
| — | — | 43,863 | 435,986 | — | — | |||||||||||
| — | — | (1,569,648 | ) | (15,306,734 | ) | — | — | |||||||||
| — | — | (1,240,570 | ) | (11,996,566 | ) | — | — | |||||||||
| 987 | 14,000 | 480,043 | 4,718,380 | 39,802 | 600,905 | |||||||||||
| 9 | 128 | 44,910 | 440,209 | 3,980 | 59,733 | |||||||||||
| — | — | (178,571 | ) | (1,746,555 | ) | (34,363 | ) | (530,678 | ) | |||||||
| 996 | 14,128 | 346,382 | 3,412,034 | 9,419 | 129,960 | |||||||||||
| (90,692 | ) | $ (1,800,321) | 5,329,212 | $ 51,774,378 | 13,704,714 | $208,330,437 | ||||||||||
| Income (loss) from
investment operations |
Distributions to shareholders |
||||||||||||||||||
|---|---|---|---|---|---|---|---|---|---|---|---|---|---|---|---|---|---|---|---|
| Net asset
value at beginning of period |
Net
investment income (c) |
Net realized
and unrealized gain (loss) |
Total from
investment operations |
From net
investment income |
In excess of
net investment income |
Total
Distributions |
|||||||||||||
| FOR THE PERIOD ENDED OCTOBER 31, | |||||||||||||||||||
| 2000 - Class A Shares (commenced
August 2, 2000) |
$10.00 | $0.11 | $0.06 | $0.17 | $(0.15 | ) | $(.02 | ) | $(0.17) | ||||||||||
| 2000 - Institutional Shares (commenced
August 2, 2000) |
10.00 | 0.16 | 0.01 | 0.17 | (0.15 | ) | (.02 | ) | (0.17) | ||||||||||
| 2000 - Administration Shares (commenced
August 2, 2000) |
10.00 | 0.15 | 0.02 | 0.17 | (0.17 | ) | — | (0.17) | |||||||||||
(a)
|
Assumes investment at the net asset value at the beginning of the period, reinvestment of all distributions, a complete redemption
of the investment at the net asset value
at the end of period and no sales charge. Total return would be reduced if a sales charge for Class A shares were taken into account. Total returns for less than one full year are not annualized. |
(b)
|
Annualized.
|
(c)
|
Calculated based on the average shares outstanding methodology.
|
| Ratios assuming no reductions |
|||||||||||||||||||||
|---|---|---|---|---|---|---|---|---|---|---|---|---|---|---|---|---|---|---|---|---|---|
| Net asset
value, end of period |
Total
return(a) |
Net assets
at end of period (in 000s) |
Ratio of
net expenses to average net assets(b) |
Ratio of
net investment income to average net assets(b) |
Ratio of
expenses to average net assets(b) |
Ratio of
net investment income to average net assets(b) |
Portfolio
turnover rate |
||||||||||||||
| $10.00 | 1.66 | % | $ 12,336 | 0.65 | % | 4.52 | % | 1.77 | % | 3.40 | % | 30.60 | % | ||||||||
| 10.00 | 1.76 | 156,525 | 0.25 | 6.49 | 1.37 | 5.37 | 30.60 | ||||||||||||||
| 10.00 | 1.68 | 2 | 0.50 | 6.13 | 1.62 | 5.01 | 30.60 | ||||||||||||||
| Income (loss) from
investment operations |
Distributions to shareholders |
|||||||||||||||||||||
|---|---|---|---|---|---|---|---|---|---|---|---|---|---|---|---|---|---|---|---|---|---|---|
| Net asset
value at beginning of period |
Net
investment income |
Net realized
and unrealized gain (loss) |
Total from
investment operations |
From net
investment income |
In excess
of net investment income |
From
capital |
Total
distributions |
|||||||||||||||
| FOR THE YEARS ENDED OCTOBER 31, | ||||||||||||||||||||||
| 2000 - Class A Shares | $9.63 | $0.54 | (c) | $(0.06) | 0.48 | $(0.54 | ) | $ (.01 | ) | $ — | $(0.55 | ) | ||||||||||
| 2000 - Institutional Shares | 9.64 | 0.58 | (c) | (0.05) | 0.53 | (0.58 | ) | (.01 | ) | — | (0.59 | ) | ||||||||||
| 2000 - Service Shares | 9.65 | 0.52 | (c) | (0.05) | 0.47 | (0.53 | ) | (.01 | ) | — | (0.54 | ) | ||||||||||
| 1999 - Class A Shares | 9.69 | 0.49 | (0.05) | 0.44 | (0.44 | ) | — | (0.06 | ) | (0.50 | ) | |||||||||||
| 1999 - Institutional Shares | 9.70 | 0.53 | (0.05) | 0.48 | (0.48 | ) | — | (0.06 | ) | (0.54 | ) | |||||||||||
| 1999 - Administration Shares (e) | 9.70 | 0.37 | (c) | 0.01 | 0.38 | (0.33 | ) | — | (0.04 | ) | (0.37 | ) | ||||||||||
| 1999 - Service Shares | 9.70 | 0.48 | (0.04) | 0.44 | (0.43 | ) | — | (0.06 | ) | (0.49 | ) | |||||||||||
| 1998 - Class A Shares | 9.88 | 0.53 | (0.17) | 0.36 | (0.53 | ) | (0.02 | ) | — | (0.55 | ) | |||||||||||
| 1998 - Institutional Shares | 9.88 | 0.55 | (0.16) | 0.39 | (0.55 | ) | (0.02 | ) | — | (0.57 | ) | |||||||||||
| 1998 - Administration Shares | 9.88 | 0.53 | (0.16) | 0.37 | (0.53 | ) | (0.02 | ) | — | (0.55 | ) | |||||||||||
| 1998 - Service Shares | 9.88 | 0.51 | (0.16) | 0.35 | (0.51 | ) | (0.02 | ) | — | (0.53 | ) | |||||||||||
| 1997 - Class A Shares | 9.83 | 0.57 | (c) | 0.05 | 0.62 | (0.57 | ) | — | — | (0.57 | ) | |||||||||||
| 1997 - Institutional Shares | 9.83 | 0.59 | (c) | 0.05 | 0.64 | (0.59 | ) | — | — | (0.59 | ) | |||||||||||
| 1997 - Administration Shares | 9.83 | 0.57 | (c) | 0.05 | 0.62 | (0.57 | ) | — | — | (0.57 | ) | |||||||||||
| 1997 - Service Shares (commenced March 27) | 9.84 | 0.33 | (c) | 0.04 | 0.37 | (0.33 | ) | — | — | (0.33 | ) | |||||||||||
| 1996 - Class A Shares | 9.77 | 0.55 | (c) | 0.08 | 0.63 | (0.55 | ) | (0.02 | ) | — | (0.57 | ) | ||||||||||
| 1996 - Institutional Shares | 9.77 | 0.57 | (c) | 0.08 | 0.65 | (0.57 | ) | (0.02 | ) | — | (0.59 | ) | ||||||||||
| 1996 - Administration Shares | 9.77 | 0.55 | (c) | 0.08 | 0.63 | (0.55 | ) | (0.02 | ) | — | (0.57 | ) | ||||||||||
(a)
|
Assumes investment at the net asset value at the beginning of the period, reinvestment of all distributions, a complete redemption
of the investment at the net asset value
at the end of period and no sales charge. Total return would be reduced if a sales charge for Class A shares were taken into account. Total returns for less than one full year are not annualized. |
(b)
|
Annualized.
|
(c)
|
Calculated based on the average shares outstanding methodology.
|
(d)
|
Includes the effect of mortgage dollar roll transactions.
|
(e)
|
Administration Class shares were liquidated on July 20, 1999. Ending net asset value shown as of July 20, 1999.
|
|
Ratios assuming no expense reductions |
||||||||||||||||||||||
|---|---|---|---|---|---|---|---|---|---|---|---|---|---|---|---|---|---|---|---|---|---|---|
| Net asset
value, end of period |
Total
return (a) |
Net assets
at end of period (in 000s) |
Ratio of
net expenses to average net assets |
Ratio of
net investment income to average net assets |
Ratio of
expenses to average net assets |
Ratio of
net investment income to average net assets |
Portfolio
turnover rate (d) |
|||||||||||||||
| $9.56 | 5.12 | % | $ 41,188 | 0.89 | % | 5.67 | % | 0.96 | % | 5.60 | % | 10.69 | % | |||||||||
| 9.58 | 5.65 | 176,881 | 0.49 | 6.01 | 0.56 | 5.94 | 10.69 | |||||||||||||||
| 9.58 | 4.95 | 71 | 0.99 | 5.33 | 1.06 | 5.26 | 10.69 | |||||||||||||||
| 9.63 | 4.65 | 22,862 | 0.89 | 5.15 | 0.93 | 5.11 | 38.86 | |||||||||||||||
| 9.64 | 5.06 | 315,024 | 0.49 | 5.49 | 0.53 | 5.45 | 38.86 | |||||||||||||||
| 9.71 | (e) | 4.02 | — | 0.74 | (b) | 5.35 | (b) | 0.78 | (b) | 5.31 | (b) | 38.86 | ||||||||||
| 9.65 | 4.65 | 797 | 0.99 | 4.99 | 1.03 | 4.95 | 38.86 | |||||||||||||||
| 9.69 | 3.71 | 60,782 | 0.80 | 5.40 | 1.02 | 5.18 | 33.64 | |||||||||||||||
| 9.70 | 4.09 | 441,228 | 0.53 | 5.63 | 0.53 | 5.63 | 33.64 | |||||||||||||||
| 9.70 | 3.83 | 5,999 | 0.78 | 5.33 | 0.78 | 5.33 | 33.64 | |||||||||||||||
| 9.70 | 3.57 | 822 | 1.03 | 5.09 | 1.03 | 5.09 | 33.64 | |||||||||||||||
| 9.88 | 6.43 | 43,393 | 0.74 | 5.60 | 1.02 | 5.32 | 46.58 | |||||||||||||||
| 9.88 | 6.70 | 463,511 | 0.49 | 5.99 | 0.52 | 5.96 | 46.58 | |||||||||||||||
| 9.88 | 6.43 | 2,793 | 0.74 | 5.73 | 0.77 | 5.70 | 46.58 | |||||||||||||||
| 9.88 | 3.81 | 346 | 1.05 | (b) | 5.64 | (b) | 1.08 | (b) | 5.61 | (b) | 46.58 | |||||||||||
| 9.83 | 6.60 | 10,728 | 0.70 | 5.59 | 1.01 | 5.28 | 52.36 | |||||||||||||||
| 9.83 | 6.86 | 613,149 | 0.45 | 5.85 | 0.51 | 5.79 | 52.36 | |||||||||||||||
| 9.83 | 6.60 | 3,792 | 0.70 | 5.59 | 0.76 | 5.53 | 52.36 | |||||||||||||||
| Income (loss) from
investment operations |
Distributions to
shareholders |
|||||||||||||
|---|---|---|---|---|---|---|---|---|---|---|---|---|---|---|
| Net asset
value at beginning of period |
Net
investment income |
Net realized
and unrealized gain (loss) |
Total from
investment operations |
From net
investment income |
||||||||||
| FOR THE YEARS ENDED OCTOBER 31, | ||||||||||||||
| 2000 - Class A Shares | $9.57 | $0.59 | (c) | $(0.07 | ) | $0.52 | $(0.60 | ) | ||||||
| 2000 - Class B Shares | 9.56 | 0.53 | (c) | (0.09 | ) | 0.44 | (0.54 | ) | ||||||
| 2000 - Class C Shares | 9.54 | 0.51 | (c) | (0.07 | ) | 0.44 | (0.53 | ) | ||||||
| 2000 - Institutional Shares | 9.57 | 0.63 | (c) | (0.09 | ) | 0.54 | (0.64 | ) | ||||||
| 2000 - Service Shares | 9.56 | 0.58 | (c) | (0.09 | ) | 0.49 | (0.59 | ) | ||||||
| 1999 - Class A Shares | 9.91 | 0.55 | (0.36 | ) | 0.19 | (0.53 | ) | |||||||
| 1999 - Class B Shares | 9.88 | 0.48 | (0.33 | ) | 0.15 | (0.47 | ) | |||||||
| 1999 - Class C Shares | 9.88 | 0.47 | (0.36 | ) | 0.11 | (0.45 | ) | |||||||
| 1999 - Institutional Shares | 9.90 | 0.59 | (0.35 | ) | 0.24 | (0.57 | ) | |||||||
| 1999 - Administration Shares (e) | 9.91 | 0.40 | (c) | (0.25 | ) | 0.15 | (0.39 | ) | ||||||
| 1999 - Service Shares | 9.89 | 0.54 | (0.35 | ) | 0.19 | (0.52 | ) | |||||||
| 1998 - Class A Shares | 9.88 | 0.57 | 0.04 | 0.61 | (0.58 | ) | ||||||||
| 1998 - Class B Shares | 9.86 | 0.51 | 0.03 | 0.54 | (0.52 | ) | ||||||||
| 1998 - Class C Shares | 9.86 | 0.49 | 0.03 | 0.52 | (0.50 | ) | ||||||||
| 1998 - Institutional Shares | 9.86 | 0.58 | 0.06 | 0.64 | (0.60 | ) | ||||||||
| 1998 - Administration Shares | 9.89 | 0.55 | 0.05 | 0.60 | (0.58 | ) | ||||||||
| 1998 - Service Shares | 9.86 | 0.55 | 0.04 | 0.59 | (0.56 | ) | ||||||||
| 1997 - Class A Shares (commenced May 1) | 9.78 | 0.31 | (c) | 0.09 | 0.40 | (0.30 | ) | |||||||
| 1997 - Class B Shares (commenced May 1) | 9.75 | 0.28 | (c) | 0.10 | 0.38 | (0.27 | ) | |||||||
| 1997 - Class C Shares (commenced August 15) | 9.83 | 0.12 | (c) | 0.02 | 0.14 | (0.11 | ) | |||||||
| 1997 - Institutional Shares | 9.83 | 0.64 | (c) | 0.03 | 0.67 | (0.64 | ) | |||||||
| 1997 - Administration Shares | 9.85 | 0.62 | (c) | 0.04 | 0.66 | (0.62 | ) | |||||||
| 1997 - Service Shares | 9.82 | 0.59 | (c) | 0.04 | 0.63 | (0.59 | ) | |||||||
| 1996 - Institutional Shares | 9.82 | 0.63 | (c) | 0.01 | 0.64 | (0.63 | ) | |||||||
| 1996 - Administration Shares (commenced February 28) | 9.86 | 0.38 | (c) | — | 0.38 | (0.39 | ) | |||||||
| 1996 - Service Shares (commenced April 10) | 9.72 | 0.31 | (c) | 0.10 | 0.41 | (0.31 | ) | |||||||
(a)
|
Assumes investment at the net asset value at the beginning of the period, reinvestment of all distributions, a complete redemption
of the investment at the net asset value at the end of the period and no sales charge. Total return would be reduced if a sales or redemption charge were taken into account. Total returns for periods less than one full year are not annualized.
|
(b)
|
Annualized.
|
(c)
|
Calculated based on the average shares outstanding methodology.
|
(d)
|
Includes the effect of mortgage dollar roll transactions.
|
(e)
|
Administration Class shares were liquidated on July 20, 1999. Ending net asset value shown as of July 20, 1999.
|
|
Ratios assuming no expense reductions |
||||||||||||||||||||||
|---|---|---|---|---|---|---|---|---|---|---|---|---|---|---|---|---|---|---|---|---|---|---|
| Net asset
value, end of period |
Total
return (a) |
Net assets
at end of period (in 000s) |
Ratio of
net expenses to average net assets |
Ratio of
net investment income to average net assets |
Ratio of
expenses to average net assets |
Ratio of
net investment income to average net assets |
Portfolio
turnover rate (d) |
|||||||||||||||
| $9.49 | 5.65 | % | $ 29,446 | 0.94 | % | 6.21 | % | 1.13 | % | 6.02 | % | 130.33 | % | |||||||||
| 9.46 | 4.80 | 5,743 | 1.54 | 5.63 | 1.88 | 5.29 | 130.33 | |||||||||||||||
| 9.45 | 4.76 | 5,128 | 1.69 | 5.45 | 1.88 | 5.26 | 130.33 | |||||||||||||||
| 9.47 | 5.85 | 131,462 | 0.54 | 6.64 | 0.73 | 6.45 | 130.33 | |||||||||||||||
| 9.46 | 5.32 | 6,134 | 1.04 | 6.14 | 1.23 | 5.95 | 130.33 | |||||||||||||||
| 9.57 | 1.97 | 52,235 | 0.94 | 5.61 | 1.07 | 5.48 | 172.61 | |||||||||||||||
| 9.56 | 1.56 | 6,937 | 1.54 | 5.04 | 1.82 | 4.76 | 172.61 | |||||||||||||||
| 9.54 | 1.21 | 7,029 | 1.69 | 4.83 | 1.82 | 4.70 | 172.61 | |||||||||||||||
| 9.57 | 2.49 | 146,062 | 0.54 | 6.03 | 0.67 | 5.90 | 172.61 | |||||||||||||||
| 9.67 | (e) | 1.57 | — | 0.79 | (b) | 5.76 | (b) | 0.92 | (b) | 5.63 | (b) | 172.61 | ||||||||||
| 9.56 | 1.97 | 6,605 | 1.04 | 5.54 | 1.17 | 5.41 | 172.61 | |||||||||||||||
| 9.91 | 6.36 | 56,725 | 0.81 | 5.68 | 1.32 | 5.17 | 119.89 | |||||||||||||||
| 9.88 | 5.62 | 5,025 | 1.41 | 5.12 | 1.87 | 4.66 | 119.89 | |||||||||||||||
| 9.88 | 5.46 | 4,527 | 1.56 | 4.64 | 1.87 | 4.33 | 119.89 | |||||||||||||||
| 9.90 | 6.75 | 145,514 | 0.53 | 6.06 | 0.84 | 5.75 | 119.89 | |||||||||||||||
| 9.91 | 6.27 | 7,357 | 0.78 | 5.76 | 1.09 | 5.45 | 119.89 | |||||||||||||||
| 9.89 | 6.12 | 6,232 | 1.03 | 5.56 | 1.34 | 5.25 | 119.89 | |||||||||||||||
| 9.88 | 4.14 | 9,491 | 0.70 | (b) | 6.05 | (b) | 1.32 | (b) | 5.43 | (b) | 102.58 | |||||||||||
| 9.86 | 3.94 | 747 | 1.30 | (b) | 5.52 | (b) | 1.82 | (b) | 5.00 | (b) | 102.58 | |||||||||||
| 9.86 | 1.44 | 190 | 1.45 | (b) | 5.52 | (b) | 1.82 | (b) | 5.15 | (b) | 102.58 | |||||||||||
| 9.86 | 7.07 | 103,729 | 0.45 | 6.43 | 0.82 | 6.06 | 102.58 | |||||||||||||||
| 9.89 | 6.91 | 1,060 | 0.70 | 6.19 | 1.07 | 5.82 | 102.58 | |||||||||||||||
| 9.86 | 6.63 | 3,337 | 0.95 | 5.92 | 1.32 | 5.55 | 102.58 | |||||||||||||||
| 9.83 | 6.75 | 99,944 | 0.45 | 6.44 | 0.71 | 6.18 | 115.45 | |||||||||||||||
| 9.85 | 4.00 | 252 | 0.70 | (b) | 5.97 | (b) | 0.96 | (b) | 5.71 | (b) | 115.45 | |||||||||||
| 9.82 | 4.35 | 1,822 | 0.95 | (b) | 6.05 | (b) | 1.21 | (b) | 5.79 | (b) | 115.45 | |||||||||||
| Income (loss) from
investment operations |
Distributions to shareholders |
|||||||||||||||||||
|---|---|---|---|---|---|---|---|---|---|---|---|---|---|---|---|---|---|---|---|---|
| Net asset
value, beginning of period |
Net
investment income |
Net realized
and unrealized gain (loss) |
Total from
investment operations |
From net
investment income |
In excess
of net investment income |
From
net realized gains |
Total
Distributions |
|||||||||||||
| FOR THE YEARS ENDED OCTOBER 31, | ||||||||||||||||||||
| 2000 - Class A Shares | $13.70 | $0.82 | $0.15 | 0.97 | $(0.83 | ) | $ — | $ — | (0.83) | |||||||||||
| 2000 - Class B Shares | 13.72 | 0.71 | 0.15 | 0.86 | (0.73 | ) | — | — | (0.73) | |||||||||||
| 2000 - Class C Shares | 13.71 | 0.71 | 0.14 | 0.85 | (0.72 | ) | — | — | (0.72) | |||||||||||
| 2000 - Institutional Shares | 13.69 | 0.87 | 0.14 | 1.01 | (0.88 | ) | — | — | (0.88) | |||||||||||
| 2000 - Service Shares | 13.63 | 0.82 | 0.18 | 1.00 | (0.81 | ) | — | — | (0.81) | |||||||||||
| 1999 - Class A Shares | 14.91 | 0.80 | (0.89 | ) | (0.09) | (0.77 | ) | — | (0.35 | ) | (1.12) | |||||||||
| 1999 - Class B Shares | 14.92 | 0.69 | (0.87 | ) | (0.18) | (0.67 | ) | — | (0.35 | ) | (1.02) | |||||||||
| 1999 - Class C Shares | 14.91 | 0.69 | (0.88 | ) | (0.19) | (0.66 | ) | — | (0.35 | ) | (1.01) | |||||||||
| 1999 - Institutional Shares | 14.90 | 0.85 | (0.88 | ) | (0.03) | (0.83 | ) | — | (0.35 | ) | (1.18) | |||||||||
| 1999 - Service Shares | 14.88 | 0.77 | (0.92 | ) | (0.15) | (0.75 | ) | — | (0.35 | ) | (1.10) | |||||||||
| 1998 - Class A Shares | 14.59 | 0.81 | 0.45 | 1.26 | (0.81 | ) | (0.07) | (0.06 | ) | (0.94) | ||||||||||
| 1998 - Class B Shares | 14.61 | 0.72 | 0.42 | 1.14 | (0.72 | ) | (0.05) | (0.06 | ) | (0.83) | ||||||||||
| 1998 - Class C Shares | 14.60 | 0.74 | 0.40 | 1.14 | (0.74 | ) | (0.03) | (0.06 | ) | (0.83) | ||||||||||
| 1998 - Institutional Shares | 14.59 | 0.87 | 0.42 | 1.29 | (0.87 | ) | (0.05) | (0.06 | ) | (0.98) | ||||||||||
| 1998 - Service Shares | 14.59 | 0.80 | 0.40 | 1.20 | (0.80 | ) | (0.05) | (0.06 | ) | (0.91) | ||||||||||
| 1997 - Class A Shares | 14.36 | 0.91 | 0.29 | 1.20 | (0.90 | ) | — | (0.07 | ) | (0.97) | ||||||||||
| 1997 - Class B Shares | 14.37 | 0.80 | 0.30 | 1.10 | (0.79 | ) | — | (0.07 | ) | (0.86) | ||||||||||
| 1997 - Class C Shares (commenced August 15) | 14.38 | 0.17 | 0.22 | 0.39 | (0.17 | ) | — | — | (0.17) | |||||||||||
| 1997 - Institutional Shares (commenced August 15) | 14.37 | 0.20 | 0.22 | 0.42 | (0.20 | ) | — | — | (0.20) | |||||||||||
| 1997 - Service Shares (commenced August 15) | 14.37 | 0.20 | 0.21 | 0.41 | (0.19 | ) | — | — | (0.19) | |||||||||||
| 1996 - Class A shares | 14.47 | 0.92 | (0.11 | ) | 0.81 | (0.92 | ) | — | — | (0.92) | ||||||||||
| 1996 - Class B shares (commenced May 1) | 14.11 | 0.41 | 0.26 | 0.67 | (0.41 | ) | — | — | (0.41) | |||||||||||
(a)
|
Assumes investment at the net asset value at the beginning of the period, reinvestment of all distributions, a complete redemption
of the investment at the net asset value at the end of the period and no sales charge. Total return would be reduced if a sales or redemption charge were taken into account. Total returns for periods less than one full year are not annualized.
|
(b)
|
Annualized.
|
(c)
|
Includes the effect of mortgage dollar roll transactions.
|
|
Ratios assuming no expense reductions |
|||||||||||||||||||||
|---|---|---|---|---|---|---|---|---|---|---|---|---|---|---|---|---|---|---|---|---|---|
| Net asset
value, end of period |
Total
return (a) |
Net assets
at end of period (in 000s) |
Ratio of
net expenses to average net assets |
Ratio of
net investment income to average net assets |
Ratio of
expenses to average net assets |
Ratio of
net investment income to average net assets |
Portfolio
turnover rate (c) |
||||||||||||||
| $13.84 | 7.33 | % | $ 88,783 | 0.98 | % | 6.01 | % | 1.39 | % | 5.60 | % | 341.28 | % | ||||||||
| 13.85 | 6.45 | 18,724 | 1.73 | 5.24 | 2.14 | 4.83 | 341.28 | ||||||||||||||
| 13.84 | 6.46 | 7,606 | 1.73 | 5.25 | 2.14 | 4.84 | 341.28 | ||||||||||||||
| 13.82 | 7.68 | 7,514 | 0.58 | 6.41 | 0.99 | 6.00 | 341.28 | ||||||||||||||
| 13.82 | 7.62 | 373 | 1.08 | 6.02 | 1.49 | 5.61 | 341.28 | ||||||||||||||
| 13.70 | (0.63 | ) | 82,102 | 0.98 | 5.63 | 1.33 | 5.28 | 277.64 | |||||||||||||
| 13.72 | (1.29 | ) | 19,684 | 1.73 | 4.88 | 2.08 | 4.53 | 277.64 | |||||||||||||
| 13.71 | (1.29 | ) | 10,053 | 1.73 | 4.89 | 2.08 | 4.54 | 277.64 | |||||||||||||
| 13.69 | (0.23 | ) | 5,899 | 0.58 | 6.07 | 0.93 | 5.72 | 277.64 | |||||||||||||
| 13.63 | (1.01 | ) | 15 | 1.08 | 5.56 | 1.43 | 5.21 | 277.64 | |||||||||||||
| 14.91 | 8.98 | 101,015 | 0.76 | 5.53 | 1.53 | 4.76 | 315.43 | ||||||||||||||
| 14.92 | 8.09 | 16,125 | 1.51 | 4.76 | 2.05 | 4.22 | 315.43 | ||||||||||||||
| 14.91 | 8.09 | 9,639 | 1.51 | 4.59 | 2.05 | 4.05 | 315.43 | ||||||||||||||
| 14.90 | 9.19 | 2,642 | 0.51 | 5.82 | 1.05 | 5.28 | 315.43 | ||||||||||||||
| 14.88 | 8.53 | 2 | 1.01 | 5.48 | 1.55 | 4.94 | 315.43 | ||||||||||||||
| 14.59 | 8.72 | 68,859 | 0.50 | 6.38 | 1.82 | 5.06 | 395.75 | ||||||||||||||
| 14.61 | 7.96 | 8,041 | 1.25 | 5.59 | 2.32 | 4.52 | 395.75 | ||||||||||||||
| 14.60 | 2.72 | 1,196 | 1.25 | (b) | 5.45 | (b) | 2.32 | (b) | 4.38 | (b) | 395.75 | ||||||||||
| 14.59 | 2.94 | 1,894 | 0.25 | (b) | 7.03 | (b) | 1.32 | (b) | 5.96 | (b) | 395.75 | ||||||||||
| 14.59 | 2.85 | 2 | 0.75 | (b) | 6.49 | (b) | 1.82 | (b) | 5.42 | (b) | 395.75 | ||||||||||
| 14.36 | 5.80 | 30,603 | 0.50 | 6.42 | 1.89 | 5.03 | 485.09 | ||||||||||||||
| 14.37 | 4.85 | 234 | 1.25 | (b) | 5.65 | (b) | 2.39 | (b) | 4.51 | (b) | 485.09 | ||||||||||
| Income (loss) from
investment operations |
Distributions to shareholders |
|||||||||||||||||||||||
|---|---|---|---|---|---|---|---|---|---|---|---|---|---|---|---|---|---|---|---|---|---|---|---|---|
| Net asset
value at beginning of period |
Net
investment income |
Net realized
and unrealized gain (loss) |
Total from
investment operations |
From net
investment income |
In excess
of net investment income |
From net
realized gains |
Total
distributions |
|||||||||||||||||
| FOR THE YEARS ENDED OCTOBER 31, | ||||||||||||||||||||||||
| 2000 - Class A Shares | $ 9.50 | $0.57 | (c) | $ 0.02 | $ 0.59 | $(0.57 | ) | — | $ — | $(0.57 | ) | |||||||||||||
| 2000 - Class B Shares | 9.52 | 0.50 | (c) | 0.02 | 0.52 | (0.50 | ) | — | — | (0.50 | ) | |||||||||||||
| 2000 - Class C Shares | 9.52 | 0.50 | (c) | 0.03 | 0.53 | (0.50 | ) | — | — | (0.50 | ) | |||||||||||||
| 2000 - Institutional Shares | 9.52 | 0.61 | (c) | 0.02 | 0.63 | (0.61 | ) | — | — | (0.61 | ) | |||||||||||||
| 2000 - Service Shares | 9.52 | 0.56 | (c) | 0.02 | 0.58 | (0.56 | ) | — | — | (0.56 | ) | |||||||||||||
| 1999 - Class A Shares | 10.25 | 0.54 | (0.61 | ) | (0.07 | ) | (0.53 | ) | — | (0.15 | ) | (0.68 | ) | |||||||||||
| 1999 - Class B Shares | 10.28 | 0.48 | (0.62 | ) | (0.14 | ) | (0.47 | ) | — | (0.15 | ) | (0.62 | ) | |||||||||||
| 1999 - Class C Shares | 10.28 | 0.47 | (0.62 | ) | (0.15 | ) | (0.46 | ) | — | (0.15 | ) | (0.61 | ) | |||||||||||
| 1999 - Institutional Shares | 10.28 | 0.58 | (0.62 | ) | (0.04 | ) | (0.57 | ) | — | (0.15 | ) | (0.72 | ) | |||||||||||
| 1999 - Administration Shares (e) | 10.27 | 0.40 | (c) | (0.41 | ) | (0.01 | ) | (0.40 | ) | — | (0.15 | ) | (0.55 | ) | ||||||||||
| 1999 - Service Shares | 10.28 | 0.54 | (0.62 | ) | (0.08 | ) | (0.53 | ) | — | (0.15 | ) | (0.68 | ) | |||||||||||
| 1998 - Class A Shares | 10.06 | 0.59 | 0.27 | 0.86 | (0.59 | ) | (0.02 | ) | (0.06 | ) | (0.67 | ) | ||||||||||||
| 1998 - Class B Shares | 10.09 | 0.52 | 0.27 | 0.79 | (0.52 | ) | (0.02 | ) | (0.06 | ) | (0.60 | ) | ||||||||||||
| 1998 - Class C Shares | 10.09 | 0.52 | 0.27 | 0.79 | (0.52 | ) | (0.02 | ) | (0.06 | ) | (0.60 | ) | ||||||||||||
| 1998 - Institutional Shares | 10.08 | 0.61 | 0.29 | 0.90 | (0.61 | ) | (0.03 | ) | (0.06 | ) | (0.70 | ) | ||||||||||||
| 1998 - Administration Shares | 10.07 | 0.57 | 0.29 | 0.86 | (0.57 | ) | (0.03 | ) | (0.06 | ) | (0.66 | ) | ||||||||||||
| 1998 - Service Shares | 10.09 | 0.56 | 0.27 | 0.83 | (0.56 | ) | (0.02 | ) | (0.06 | ) | (0.64 | ) | ||||||||||||
| 1997 - Class A Shares (commenced May 1) | 9.70 | 0.30 | 0.36 | 0.66 | (0.30 | ) | — | — | (0.30 | ) | ||||||||||||||
| 1997 - Class B Shares (commenced May 1) | 9.72 | 0.27 | 0.37 | 0.64 | (0.27 | ) | — | — | (0.27 | ) | ||||||||||||||
| 1997 - Class C Shares (commenced August 15) | 9.93 | 0.11 | 0.16 | 0.27 | (0.11 | ) | — | — | (0.11 | ) | ||||||||||||||
| 1997 - Institutional Shares | 9.85 | 0.64 | 0.23 | 0.87 | (0.64 | ) | — | — | (0.64 | ) | ||||||||||||||
| 1997 - Administration Shares | 9.84 | 0.62 | 0.23 | 0.85 | (0.62 | ) | — | — | (0.62 | ) | ||||||||||||||
| 1997 - Service Shares | 9.86 | 0.59 | 0.23 | 0.82 | (0.59 | ) | — | — | (0.59 | ) | ||||||||||||||
| 1996 - Institutional Shares | 10.00 | 0.64 | (0.07 | ) | 0.57 | (0.64 | ) | — | (0.08 | ) | (0.72 | ) | ||||||||||||
| 1996 - Administrative Shares (commenced February 28) | 9.91 | 0.41 | (0.07 | ) | 0.34 | (0.41 | ) | — | — | (0.41 | ) | |||||||||||||
| 1996 - Service Shares (commenced March 13) | 9.77 | 0.38 | 0.09 | 0.47 | (0.38 | ) | — | — | (0.38 | ) | ||||||||||||||
(a)
|
Assumes investment at the net asset value at the beginning of the period, reinvestment of all distributions, a complete redemption
of the investment at the net asset value at the end of period and no sales charge. Total return would be reduced if a sales or redemption charge were taken into account. Total returns for periods less than one full year are not annualized.
|
(b)
|
Annualized.
|
(c)
|
Calculated based on average shares outstanding methodology.
|
(d)
|
Includes the effect of mortgage dollar roll transactions.
|
(e)
|
Administration Class shares were liquidated on July 20, 1999. Ending net asset value shown as of July 20, 1999.
|
| Ratios assuming no
expense reductions |
||||||||||||||||||||||
|---|---|---|---|---|---|---|---|---|---|---|---|---|---|---|---|---|---|---|---|---|---|---|
| Net asset
value, end of period |
Total
return (a) |
Net assets
at end of period (in 000s) |
Ratio of
net expenses to average net assets |
Ratio of
net investment income to average net assets |
Ratio of
expenses to average net assets |
Ratio of
net investment income to average net assets |
Portfolio
turnover rate (d) |
|||||||||||||||
| $ 9.52 | 6.48 | % | $ 73,846 | 0.94 | % | 6.04 | % | 0.97 | % | 6.01 | % | 271.53 | % | |||||||||
| 9.54 | 5.69 | 14,002 | 1.69 | 5.29 | 1.72 | 5.26 | 271.53 | |||||||||||||||
| 9.55 | 5.80 | 6,107 | 1.69 | 5.30 | 1.72 | 5.27 | 271.53 | |||||||||||||||
| 9.54 | 6.90 | 268,465 | 0.54 | 6.46 | 0.57 | 6.43 | 271.53 | |||||||||||||||
| 9.54 | 6.37 | 9,445 | 1.04 | 5.95 | 1.07 | 5.92 | 271.53 | |||||||||||||||
| 9.50 | (0.68 | ) | 65,368 | 0.94 | 5.57 | 0.98 | 5.53 | 279.67 | ||||||||||||||
| 9.52 | (1.47 | ) | 14,654 | 1.69 | 4.83 | 1.73 | 4.79 | 279.67 | ||||||||||||||
| 9.52 | (1.51 | ) | 7,443 | 1.69 | 4.82 | 1.73 | 4.78 | 279.67 | ||||||||||||||
| 9.52 | (0.37 | ) | 216,973 | 0.54 | 5.97 | 0.58 | 5.93 | 279.67 | ||||||||||||||
| 9.71 | (e) | (0.13 | ) | — | 0.79 | (b) | 5.63 | (b) | 0.83 | (b) | 5.59 | (b) | 279.67 | |||||||||
| 9.52 | (0.87 | ) | 8,172 | 1.04 | 5.50 | 1.08 | 5.46 | 279.67 | ||||||||||||||
| 10.25 | 8.76 | 56,267 | 0.74 | 5.58 | 1.21 | 5.11 | 271.50 | |||||||||||||||
| 10.28 | 7.94 | 7,209 | 1.49 | 4.82 | 1.75 | 4.56 | 271.50 | |||||||||||||||
| 10.28 | 7.94 | 5,587 | 1.49 | 4.81 | 1.75 | 4.55 | 271.50 | |||||||||||||||
| 10.28 | 9.15 | 195,730 | 0.46 | 5.95 | 0.72 | 5.69 | 271.50 | |||||||||||||||
| 10.27 | 8.88 | 12,743 | 0.71 | 5.70 | 0.97 | 5.44 | 271.50 | |||||||||||||||
| 10.28 | 8.50 | 5,263 | 0.96 | 5.44 | 1.22 | 5.18 | 271.50 | |||||||||||||||
| 10.06 | 6.94 | 9,336 | 0.70 | (b) | 6.13 | (b) | 1.33 | (b) | 5.50 | (b) | 361.27 | |||||||||||
| 10.09 | 6.63 | 621 | 1.45 | (b) | 5.28 | (b) | 1.83 | (b) | 4.90 | (b) | 361.27 | |||||||||||
| 10.09 | 2.74 | 272 | 1.45 | (b) | 4.84 | (b) | 1.83 | (b) | 4.46 | (b) | 361.27 | |||||||||||
| 10.08 | 9.19 | 79,230 | 0.45 | 6.53 | 0.83 | 6.15 | 361.27 | |||||||||||||||
| 10.07 | 8.92 | 6,176 | 0.70 | 6.27 | 1.08 | 5.89 | 361.27 | |||||||||||||||
| 10.09 | 8.65 | 1,868 | 0.95 | 6.00 | 1.33 | 5.62 | 361.27 | |||||||||||||||
| 9.85 | 5.98 | 72,061 | 0.45 | 6.51 | 0.83 | 6.13 | 414.20 | |||||||||||||||
| 9.84 | 3.56 | 702 | 0.70 | (b) | 6.41 | (b) | 1.08 | (b) | 6.03 | (b) | 414.20 | |||||||||||
| 9.86 | 4.90 | 381 | 0.95 | (b) | 6.37 | (b) | 1.33 | (b) | 5.99 | (b) | 414.20 | |||||||||||
| Income (loss) from
investment operations |
Distributions to shareholders |
||||||||||||||||||||||||||
|---|---|---|---|---|---|---|---|---|---|---|---|---|---|---|---|---|---|---|---|---|---|---|---|---|---|---|---|
| Net asset
value, beginning of period |
Net
investment income |
Net realized
and unrealized gain (loss) |
Total from
investment operations |
From net
investment income |
From
capital |
From
net realized gains |
Total
distributions |
||||||||||||||||||||
| FOR THE YEARS ENDED OCTOBER 31, | |||||||||||||||||||||||||||
| 2000 - Class A Shares | $14.49 | $0.59 | (c) | $ 0.20 | 0.79 | $(0.60 | ) | $ — | $ — | (0.60) | |||||||||||||||||
| 2000 - Class B Shares | 14.45 | 0.51 | (c) | 0.22 | 0.73 | (0.53 | ) | — | — | (0.53) | |||||||||||||||||
| 2000 - Class C Shares | 14.43 | 0.51 | (c) | 0.22 | 0.73 | (0.53 | ) | — | — | (0.53) | |||||||||||||||||
| 2000 - Institutional Shares | 14.48 | 0.68 | (c) | 0.21 | 0.89 | (0.70 | ) | — | — | (0.70) | |||||||||||||||||
| 2000 - Service Shares | 14.47 | 0.61 | (c) | 0.20 | 0.81 | (0.62 | ) | — | — | (0.62) | |||||||||||||||||
| 1999 - Class A Shares | 15.65 | 0.62 | (c) | (0.78 | ) | (0.16 | ) | (0.61 | ) | (0.03 | ) | (0.36 | ) | (1.00) | |||||||||||||
| 1999 - Class B Shares | 15.63 | 0.53 | (0.78 | ) | (0.25 | ) | (0.55 | ) | (0.02 | ) | (0.36 | ) | (0.93) | ||||||||||||||
| 1999 - Class C Shares | 15.60 | 0.53 | (0.77 | ) | (0.24 | ) | (0.55 | ) | (0.02 | ) | (0.36 | ) | (0.93) | ||||||||||||||
| 1999 - Institutional Shares | 15.64 | 0.71 | (0.77 | ) | (0.06 | ) | (0.71 | ) | (0.03 | ) | (0.36 | ) | (1.10) | ||||||||||||||
| 1999 - Service Shares | 15.64 | 0.64 | (0.79 | ) | (0.15 | ) | (0.63 | ) | (0.03 | ) | (0.36 | ) | (1.02) | ||||||||||||||
| 1998 - Class A Shares | 15.10 | 0.72 | (c) | 0.90 | 1.62 | (1.01 | ) | — | (0.06 | ) | (1.07) | ||||||||||||||||
| 1998 - Class B Shares | 15.08 | 0.63 | (c) | 0.92 | 1.55 | (0.94 | ) | — | (0.06 | ) | (1.00) | ||||||||||||||||
| 1998 - Class C Shares | 15.06 | 0.63 | (c) | 0.91 | 1.54 | (0.94 | ) | — | (0.06 | ) | (1.00) | ||||||||||||||||
| 1998 - Institutional Shares | 15.09 | 0.82 | (c) | 0.90 | 1.72 | (1.11 | ) | — | (0.06 | ) | (1.17) | ||||||||||||||||
| 1998 - Service Shares | 15.09 | 0.74 | (c) | 0.91 | 1.65 | (1.04 | ) | — | (0.06 | ) | (1.10) | ||||||||||||||||
| 1997 - Class A shares | 14.53 | 0.59 | 0.77 | 1.36 | (0.79 | ) | — | — | (0.79) | ||||||||||||||||||
| 1997 - Class B shares | 14.53 | 0.72 | 0.56 | 1.28 | (0.73 | ) | — | — | (0.73) | ||||||||||||||||||
| 1997 - Class C shares (commenced August 15) | 14.80 | 0.16 | 0.29 | 0.45 | (0.19 | ) | — | — | (0.19) | ||||||||||||||||||
| 1997 - Institutional Shares | 14.52 | 0.88 | 0.56 | 1.44 | (0.87 | ) | — | — | (0.87) | ||||||||||||||||||
| 1997 - Service Shares (commenced March 12) | 14.69 | 0.53 | 0.39 | 0.92 | (0.52 | ) | — | — | (0.52) | ||||||||||||||||||
| 1996 - Class A shares | 14.45 | 0.71 | 0.80 | 1.51 | (1.43 | ) | — | — | (1.43) | ||||||||||||||||||
| 1996 - Class B shares (commenced May 1) | 14.03 | 0.34 | 0.52 | 0.86 | (0.36 | ) | — | — | (0.36) | ||||||||||||||||||
| 1996 - Institutional shares | 14.45 | 1.15 | 0.42 | 1.57 | (1.50 | ) | — | — | (1.50) | ||||||||||||||||||
(a)
|
Assumes investment at the net asset value at the beginning of the period, reinvestment of all distributions, a complete redemption
of the investment at the net asset value at the end of period and no sales charge. Total return would be reduced if a sales or redemption charge were taken into account. Total returns for periods less than one full year are not annualized.
|
(b)
|
Annualized.
|
(c)
|
Calculated based on the average shares outstanding methodology.
|
| Ratios assuming no expense reductions |
|||||||||||||||||||||
|---|---|---|---|---|---|---|---|---|---|---|---|---|---|---|---|---|---|---|---|---|---|
| Net asset
value, end of period |
Total
return (a) |
Net assets
at end of period (in 000s) |
Ratio of
net expenses to average net assets |
Ratio of
net investment income to average net assets |
Ratio of
expenses to average net assets |
Ratio of
net investment income to average net assets |
Portfolio
turnover rate |
||||||||||||||
| $14.68
|
5.58 | % | $294,738 | 1.34 | % | 4.03 | % | 1.70 | % | 3.67 | % | 185.10 | % | ||||||||
| 14.65
|
5.14 | 22,008 | 1.84 | 3.53 | 2.20 | 3.17 | 185.10 | ||||||||||||||
| 14.63
|
5.13 | 5,954 | 1.84 | 3.54 | 2.20 | 3.18 | 185.10 | ||||||||||||||
| 14.67
|
6.27 | 287,145 | 0.69 | 4.69 | 1.05 | 4.33 | 185.10 | ||||||||||||||
| 14.66
|
5.76 | 1,934 | 1.19 | 4.17 | 1.55 | 3.81 | 185.10 | ||||||||||||||
| |
|||||||||||||||||||||
| 14.49
|
(1.14 | ) | 271,832 | 1.34 | 4.12 | 1.72 | 3.74 | 158.27 | |||||||||||||
| 14.45
|
(1.74 | ) | 16,724 | 1.84 | 3.60 | 2.22 | 3.22 | 158.27 | |||||||||||||
| 14.43
|
(1.68 | ) | 7,786 | 1.84 | 3.60 | 2.22 | 3.22 | 158.27 | |||||||||||||
| 14.48
|
(0.49 | ) | 279,621 | 0.69 | 4.75 | 1.07 | 4.37 | 158.27 | |||||||||||||
| 14.47
|
(1.06 | ) | 1,115 | 1.19 | 4.28 | 1.57 | 3.90 | 158.27 | |||||||||||||
| |
|||||||||||||||||||||
| 15.65
|
11.21 | 217,362 | 1.31 | 4.71 | 1.75 | 4.27 | 229.91 | ||||||||||||||
| 15.63
|
10.66 | 8,135 | 1.83 | 4.19 | 2.24 | 3.78 | 229.91 | ||||||||||||||
| 15.60
|
10.65 | 4,090 | 1.83 | 4.20 | 2.24 | 3.79 | 229.91 | ||||||||||||||
| 15.64
|
11.95 | 178,532 | 0.66 | 5.40 | 1.07 | 4.99 | 229.91 | ||||||||||||||
| 15.64
|
11.43 | 1,058 | 1.16 | 4.92 | 1.57 | 4.51 | 229.91 | ||||||||||||||
| |
|||||||||||||||||||||
| 15.10
|
9.66 | 167,096 | 1.17 | 5.19 | 1.60 | 4.76 | 383.72 | ||||||||||||||
| 15.08
|
9.04 | 3,465 | 1.71 | 4.76 | 2.10 | 4.37 | 383.72 | ||||||||||||||
| 15.06
|
3.03 | 496 | 1.71 | (b) | 4.98 | (b) | 2.10 | (b) | 4.59 | (b) | 383.72 | ||||||||||
| 15.09
|
10.26 | 60,929 | 0.65 | 5.72 | 1.04 | 5.33 | 383.72 | ||||||||||||||
| 15.09
|
6.42 | 151 | 1.15 | (b) | 5.33 | (b) | 1.54 | (b) | 4.94 | (b) | 383.72 | ||||||||||
| |
|||||||||||||||||||||
| 14.53
|
11.05 | 198,665 | 1.16 | 5.81 | 1.64 | 5.33 | 232.15 | ||||||||||||||
| 14.53
|
6.24 | 256 | 1.70 | (b) | 5.16 | (b) | 2.14 | (b) | 4.72 | (b) | 232.15 | ||||||||||
| 14.52
|
11.55 | 54,254 | 0.65 | 6.35 | 1.11 | 5.89 | 232.15 | ||||||||||||||
| |
|||||||||||||||||||||
| To the Shareholders and Board of Trustees
|
| Goldman Sachs Trust
|
| We have audited the accompanying statements of assets and liabilities, including the statements of investments, of Goldman Sachs
Enhanced Income Fund, Goldman Sachs Adjustable Rate Government Fund, Goldman Sachs Short Duration Government Fund, Goldman Sachs Government Income Fund, Goldman Sachs Core Fixed Income Fund and Goldman Sachs Global Income Fund (six of the funds comprising
the Goldman Sachs Trust) ( the “Funds”) as of October 31, 2000, and the related statements of operations, the statements of changes in net assets and the financial highlights for the period then ended. These financial statements and financial
highlights are the responsibility of the Fund’s management. Our responsibility is to express an opinion on these financial statements and financial highlights based on our audits. The statement of changes in net assets for the year ended October 31,
1999 and the financial highlights for each of the four periods in the period then ended, were audited by other auditors whose report, dated December 10, 1999, expressed an unqualified opinion on those statements and financial highlights.
|
| We conducted our audits in accordance with auditing standards generally accepted in the United States. Those standards require
that we plan and perform the audit to obtain reasonable assurance about whether the financial statements and financial highlights are free of material misstatement. An audit includes examining, on a test basis, evidence supporting the amounts and
disclosures in the financial statements and financial highlights. Our procedures included confirmation of securities owned as of October 31, 2000 by correspondence with the custodian and brokers. An audit also includes assessing the accounting principles
used and significant estimates made by management, as well as evaluating the overall financial statement presentation. We believe that our audits provide a reasonable basis for our opinion.
|
| In our opinion, the financial statements and financial highlights, audited by us, referred to above present fairly, in all
material respects, the financial position of the Goldman Sachs Enhanced Income Fund, Goldman Sachs Adjustable Rate Government Fund, Goldman Sachs Short Duration Government Fund, Goldman Sachs Government Income Fund, Goldman Sachs Core Fixed Income Fund
and Goldman Sachs Global Income Fund as of October 31, 2000, the results of their operations, the changes in their net assets, and the financial highlights for the respective period ended October 31, 2000 in conformity with accounting principles generally
accepted in the United States.
|
 |
| New York, New York
|
| December 11, 2000
|
GOLDMAN SACHS FUND PROFILE
Goldman Sachs
Taxable Investment Grade Funds
Generally speaking, bond investments may help individuals mitigate overall portfolio volatility, without sacrificing attractive returns.
Goldman Sachs Taxable Investment Grade Funds offer investors access to the benefits associated with fixed income investing. The Funds seek current income from portfolios that invest in a variety of fixed income securities.
Target Your Needs
Goldman Sachs Taxable Investment Grade Funds have distinct investment objectives and defined positions on the risk/return spectrum. As your investment objectives change, you can exchange shares within Goldman Sachs Funds without any additional charge . Please note: in general, greater returns are associated with greater risk.*
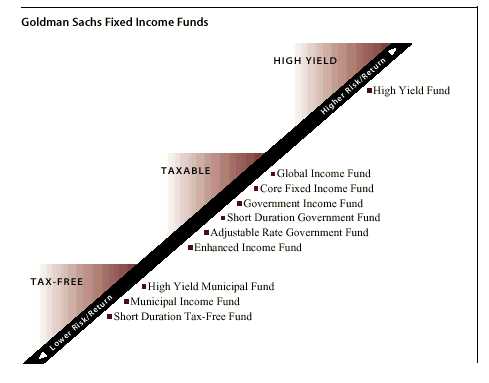
For More Information
To learn more about Goldman Sachs Taxable Investment Grade Funds and other Goldman Sachs Funds, call your investment professional today.
*The exchange privilege is subject to termination and its terms are subject to change.

|
|