
|
|
|
|
|
|
|
|
|

GOLDMAN SACHS HIGH YIELD FUND
Market Overview
Dear Shareholder:
During the period under review, U .S. bond markets generally posted solid returns. However, poor fundamentals led to lackluster results in the high yield market.
Market Review
The U.S. Bond market also continued to be affected by the U.S. Treasury Department’s repurchase of long maturity debt. The reduction in supply is aimed at reducing the average maturity and interest cost of Treasury debt. This led to a sharp increase in demand for 30-year bonds throughout the period, resulting in strong performance for longer maturity issues and an inverted yield curve.
Outlook
Given recent supportive data, we continue to believe that the U.S. is headed for a “soft landing” following a period of benign inflation. However, given strong consumer confidence, low unemployment, and continued pockets of solid economic growth, a soft landing is not assured. Conversely, in the short term, ongoing equity volatility coupled with recent negative earnings news could lead to continued credit spread widening and investor flight to the “safe haven” of U.S. Treasuries.
As always, we appreciate your support and we look forward to serving your investment needs in the years to come.
Sincerely,
 |
 |
 |
| David B. Ford | David W. Blood | Sharmin Mossavar-Rahmani |
| Co-Head, Goldman Sachs | Co-Head, Goldman Sachs | CIO, Fixed Income Investments, |
| Asset Management | Asset Management | Goldman Sachs Asset Management |
| November 9, 2000 |
GOLDMAN SACHS HIGH YIELD FUND
Fund Basics
as of October 31, 2000
| PERFORMANCE REVIEW | |||||||
| October 31, 1999– | Fund Total Return
|
30-Day
|
Lehman High
|
||||
| October 31, 2000 | (based on NAV)1
|
Standardized Yield2
|
Yield Bond Index3
|
||||
| |
|||||||
| Class A | 0.38 | % | 10.91 | % | –1.61 | % | |
| Class B | –0.48 | % | 10.67 | % | –1.61 | % | |
| Class C | –0.48 | % | 10.66 | % | –1.61 | % | |
| Institutional | 0.77 | % | 11.86 | % | –1.61 | % | |
| Service | 0.15 | % | N/A
|
–1.61 | % | ||
| |
|||||||
1 The net asset value represents the net assets of the Fund (ex- dividend) divided by the total number of net shares outstanding. The Fund’s performance reflects the reinvestment of dividends and other distributions.
2 The 30-Day Standardized Yield of the Fund is calculated by dividing the net investment income per share (as defined by securities industry regulations) earned by the Fund over a 30-day period (ending on the stated month-end date) by the maximum public offering price per share of the Fund on the last day of the period. This number is compounded semiannually and then annualized. This yield doesnot necessarily reflect income actually earned and distributed by the Fund and, therefore, may not be correlated with the dividends or other distributions paid to shareholders .
3 The Lehman Brothers High Yield Bond Index figures do not reflect any fees or expenses. Investors cannot invest directly in the Index.
| STANDARDIZED TOTAL RETURNS4 | |||||||||||
| For the period ending 9/30/00 | Class A | Class B | Class C | Institutional | Service | ||||||
| |
|||||||||||
| One Year | –0.79 | % | –1.92 | % | 2.20 | % | 4.28 | % | 3.76 | % | |
| Since Inception | 2.44 | % | 2.22 | % | 3.26 | % | 4.34 | % | 3.83 | % | |
| (8/1/97 | ) | (8/1/97 | ) | (8/15/97 | ) | (8/1/97 | ) | (8/1/97 | ) | ||
| |
|||||||||||
| 4 The Standardized Total Returns are average annual returns as of the most recent calendar quarter-end. They assume reinvestment of all distributions at net asset value. These returns reflect a maximum initial sales charge of 4.5% for Class A shares, the assumed deferred sales charge for Class B shares (5% maximum declining to 0% after six years) and the assumed deferred sales charge for Class C shares (1% if redeemed within 12 months of purchase). Because Institutional and Service shares do not involve sales charges, such charges have not been applied to their Standardized Total Returns. | |||||||||||
| TOP 10 HOLDINGS AS OF 10/31/005 | |||||||||||
| Company | Line of Business | % of Portfolio | |||||||||
| |
|||||||||||
| Nextel Communications, Inc. | Telecommunications–Cellular | 3.6 | % | ||||||||
| Telewest Communications PLC | Media–Cable | 3.0 | % | ||||||||
| Crown Castle International Corp. | Media–Non-Cable | 2.8 | % | ||||||||
| Riverwood International Corp. | Paper | 2.4 | % | ||||||||
| Allied Waste North America, Inc. | Environmental | 1.9 | % | ||||||||
| CSC Holdings, Inc. | Media–Cable | 1.8 | % | ||||||||
| Fisher Scientific International, Inc. | Consumer Cyclicals | 1.7 | % | ||||||||
| Avecia Group PLC | Chemicals | 1.2 | % | ||||||||
| Charter Communications Holdings LLC | Media–Cable | 1.4 | % | ||||||||
| NTL Communications Corp. | Telecommunications
|
1.4 | % | ||||||||
| |
|||||||||||
| Credit Allocation: AAA 4.9% A 1.1 % BBB 2.2% BB 10.2% B 75 .8% CCC/NR 5.8% | |||||||||||
| |
|||||||||||
| 5 The Fund is actively managed and, as such, its composition may differ over time. | |||||||||||
| Total return figures represent past performance and do not indicate future results, which will vary. The investment return and principal value of an investment will fluctuate and, therefore, an investor’s shares, when redeemed, may be worth more or less than their original cost. Performance reflects expense limitations in effect. | |||||||||||
| In their absence, performance would be reduced. | |||||||||||
1
GOLDMAN SACHS HIGH YIELD FUND
Performance Overview
Dear Shareholder,
We are pleased to report on the performance of the Goldman Sachs High Yield Fund for the one-year period that ended October 31, 2000.
Performance Review
Over the one-year reporting period that ended October 31, 2000, the Fund’s A, B and C Institutional and Service share classes generated cumulative total returns, at net asset value, of 0 .38%, –0.48%, –0.48%, 0.77% and 0.15%, respectively. These figures handily outperformed the –1.61% total return of the Fund’s benchmark, the Lehman Brothers High Yield Bond Index.
As the returns of the Fund and its benchmark indicate, it has been a difficult period in the high yield market. The Fund’s relative outperformance versus its benchmark was largely due to sector allocation. In addition, careful credit selection helped to minimize losses from defaults during a period when default rates were on the rise.
High Yield Market Summary
The Fund’s fiscal year began on a positive note, as investor confidence improved on the heels of a rally in the stock market. However, this was short lived, as high yield bonds faltered after the traditional New Year rally failed to materialize. February was dominated by credit-specific problems. In March, market returns were hurt by a sharp sell-off. Rising short-term interest rates, an increase in defaults and accelerating outflows from U.S. mutual funds were the main culprits. The market briefly stabilized during the second quarter, as selling pressures abated and mutual fund redemptions slowed. However, as the reporting period progressed, steadily rising interest rates led to concerns that an economic slowdown could lead to a further increase in the default rate for high yield bonds.
Then, in October, the high yield market experienced one of its worst months since 1980, as investor jitters caused a dramatic widening in risk premiums. Technicals were poor, with continuing mutual fund outflows despite a mid-month Nasdaq recovery. The telecom sector was heavily pounded amidst heightening fears that many companies would run out of cash before completing their ambitious plans. Industrials were impacted by fears of a U.S. recession, with the building products and automotive sectors particularly affected.
Investment Objective
The Fund seeks a high level of current income and may also consider the potential for capital appreciation. The Fund invests primarily in high yield, fixed income securities rated, at the time of investment, below investment grade.
2
GOLDMAN SACHS HIGH YIELD FUND
FIXED INCOME INVESTMENT PROCESS OVERVIEW
Portfolio Composition
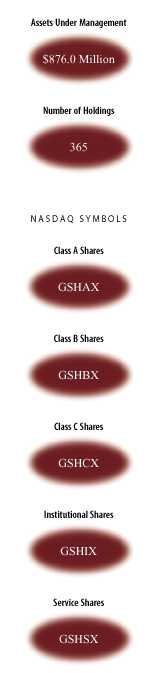
As of October 31, 2000, the Fund was diversified among 365 issues. Holdings in the top 10 companies represented 11.4% of the portfolio.
Throughout the reporting period, we remained focused on our credit-based investment philosophy which we believe offers compelling risk-adjusted returns potential. We have been actively involved in the European market and have scaled back our exposure to the emerging telecommunications sector. Both of these strategies served to enhance relative performance. In addition, corporate takeover activity bolstered the returns of several Fund holdings, which partially helped to mitigate the weakness in the overall high yield sector.
Portfolio Highlights
Portfolio Outlook
Despite the recent challenging market environment, we believe high yield bonds can play an important part of a well-diversified investment portfolio. In fact, we believe that continued market turbulence should provide further opportunities over the medium term to purchase attractive assets at historically wide levels.
We thank you for your investment and look forward to your continued confidence.
Goldman Sachs High Yield Investment Management Team
November 9, 2000
3
GOLDMAN SACHS HIGH YIELD FUND
The Goldman Sachs Advantage
Founded in 1869, Goldman, Sachs & Co. is a premier financial services firm traditionally known on Wall Street and around the world for its institutional expertise.
Today, the firm’s Investment Management Division provides individual investors the opportunity to tap the resources of a global institutional powerhouse — and put this expertise to work in their individual portfolios.
What Sets Goldman Sachs Funds Apart?

To learn more about the Goldman Sachs Funds, call your investment professional today.
4
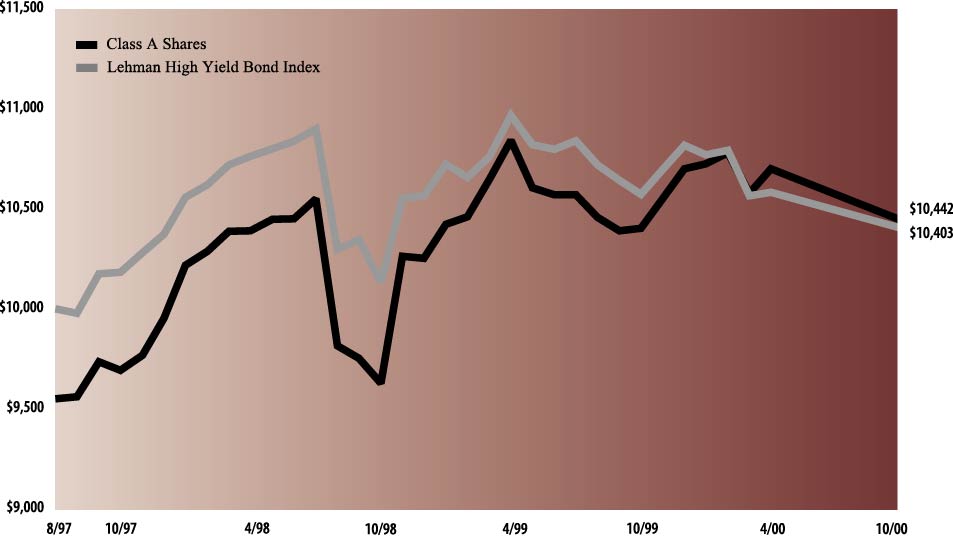
| The following graph shows the value as of October 31, 2000, of a $10,000 investment made on August 1, 1997 (commencement of
operations) in Class A shares (with the maximum sales charge of 4.5%) of the Goldman Sachs High Yield Fund. For comparative purposes, the performance of the Fund’s benchmark (the Lehman High Yield Bond Index) is shown. This performance data
represents past performance and should not be considered indicative of future performance which will fluctuate with changes in market conditions. These performance fluctuations will cause an investor’s shares, when redeemed, to be worth more or less
than their original cost. Performance of Class B, Class C, Institutional and Service shares will vary from Class A due to differences in fees and loads.
|
| High Yield Fund’s Lifetime Performance
|
| Growth of a $10,000 Investment, Distributions Reinvested August 1, 1997 to October 31, 2000.
|
 |
| Average Annual Total Return through October 31, 2000 | Since Inception | One Year | ||||||||||
|---|---|---|---|---|---|---|---|---|---|---|---|---|
| Class A (commenced August 1, 1997) | ||||||||||||
| Excluding sales charges | 2.78% | 0.38% | ||||||||||
| Including sales charges | 1.34% | -4.17% | ||||||||||
| Class B (commenced August 1, 1997) | ||||||||||||
| Excluding contingent deferred sales charges | 2.02% | -0.48% | ||||||||||
| Including contingent deferred sales charges | 1.07% | -5.45% | ||||||||||
| Class C (commenced August 15, 1997) | ||||||||||||
| Excluding contingent deferred sales charges | 2.05% | -0.48% | ||||||||||
| Including contingent deferred sales charges | 2.05% | -1.47% | ||||||||||
| Institutional Class (commenced August 1, 1997) | 3.17% | 0.77% | ||||||||||
| Service Class (commenced August 1, 1997) | 2.63% | 0.15% | ||||||||||
| Principal
Amount |
Interest
Rate |
Maturity
Date |
Value | |||||
|---|---|---|---|---|---|---|---|---|
| Corporate Bonds – 73.9% | ||||||||
| Aerospace – 2.3% | ||||||||
| Argo-Tech Corp. (B-/B3) | ||||||||
| $ 6,500,000 | 8.63 | % | 10/01/2007 | $ 5,265,000 | ||||
| Burke Industries, Inc. (B-/Caa1) | ||||||||
| 2,000,000 | 10.00 | 08/15/2007 | 640,000 | |||||
| Communications Instruments, Inc. (B-/B3) | ||||||||
| 2,500,000 | 10.00 | 09/15/2004 | 2,187,500 | |||||
| Dunlop Standard Aerospace Holdings (B-/B3) | ||||||||
| 3,000,000 | 11.88 | 05/15/2009 | 2,985,000 | |||||
| Hexcel Corp. (B/B2) | ||||||||
| 3,500,000 | 9.75 | 01/15/2009 | 3,220,000 | |||||
| K&F Industries, Inc. (B-/B3) | ||||||||
| 5,000,000 | 9.25 | 10/15/2007 | 4,775,000 | |||||
| Transdigm, Inc. (B-/B3) | ||||||||
| 1,000,000 | 10.38 | 12/01/2008 | 920,000 | |||||
| Worldwide Flight Services, Inc. (B/B3)† | ||||||||
| 750,000 | 12.25 | 08/15/2007 | 502,500 | |||||
| 20,495,000 | ||||||||
| Automotive Parts – 2.5% | ||||||||
| Accuride Corp. (B-/B2) | ||||||||
| 3,000,000 | 9.25 | 02/01/2008 | 2,100,000 | |||||
| American Axle & Manufacturing, Inc. (B+/B1) | ||||||||
| 6,000,000 | 9.75 | 03/01/2009 | 5,310,000 | |||||
| Anchor Lamina, Inc. (B-/B3) | ||||||||
| 1,500,000 | 9.88 | 02/01/2008 | 675,000 | |||||
| Federal-Mogul Corp. (B+/Ba3) | ||||||||
| 2,000,000 | 7.50 | 01/15/2009 | 480,000 | |||||
| Hayes Lemmerz International, Inc. (B/B2) | ||||||||
| 3,500,000 | 9.13 | 07/15/2007 | 2,817,500 | |||||
| Hayes Wheels International, Inc. (B/B2) | ||||||||
| 1,000,000 | 11.00 | 07/15/2006 | 890,000 | |||||
| JL French Automotive Castings (B-/B3) | ||||||||
| 1,500,000 | 11.50 | 06/01/2009 | 885,000 | |||||
| Oxford Automotive, Inc. (B/Caa1) | ||||||||
| 2,500,000 | 10.13 | 06/15/2007 | 1,975,000 | |||||
| Prestolite Electric, Inc. (B-/B3) | ||||||||
| 2,074,000 | 9.63 | 02/01/2008 | 1,285,880 | |||||
| Stanadyne Automotive Corp. (B/Caa1) | ||||||||
| 3,250,000 | 10.25 | 12/15/2007 | 2,567,500 | |||||
| Venture Holdings Trust (B/B2) | ||||||||
| 4,000,000 | 9.50 | 07/01/2005 | 2,480,000 | |||||
| 21,465,880 | ||||||||
| Building Materials – 2.7% | ||||||||
| Amatek Industries, Inc. (B/B3) | ||||||||
| 3,500,000 | 12.00 | 02/15/2008 | 2,362,500 | |||||
| Atrium Cos., Inc. (B-/B3) | ||||||||
| 2,000,000 | 10.50 | 05/01/2009 | 1,740,000 | |||||
| Better Minerals & Aggregates (B-/B3)† | ||||||||
| 2,500,000 | 13.00 | 09/15/2009 | 2,006,250 | |||||
| Principal
Amount |
Interest
Rate |
Maturity
Date |
Value | |||||
|---|---|---|---|---|---|---|---|---|
| Corporate Bonds – (continued) | ||||||||
| Building Materials – (continued) | ||||||||
| Nortek, Inc. (B+/B1) | ||||||||
| $ 3,000,000 | 9.13 | % | 09/01/2007 | $ 2,670,000 | ||||
| 2,125,000 | 8.88 | 08/01/2008 | 1,848,750 | |||||
| Nortek, Inc. (B-/B3) | ||||||||
| 3,250,000 | 9.88 | 03/01/2004 | 2,925,000 | |||||
| Republic Group, Inc. (B/B2) | ||||||||
| 3,000,000 | 9.50 | 07/15/2008 | 3,030,000 | |||||
| Werner Holdings Co., Inc. (B-/B2) | ||||||||
| 7,000,000 | 10.00 | 11/15/2007 | 6,667,500 | |||||
| 23,250,000 | ||||||||
| Capital Goods – 2.7% | ||||||||
| Axiohm Transaction Solutions, Inc.V | ||||||||
| 3,000,000 | 9.75 | 10/01/2007 | 390,000 | |||||
| Flowserve Corp. (B/B3)† | ||||||||
| 3,000,000 | 12.25 | 08/15/2010 | 3,075,000 | |||||
| International Wire Group, Inc. (B-/B3) | ||||||||
| 3,500,000 | 11.75 | 06/01/2005 | 3,482,500 | |||||
| Packard BioScience Co. (B-/B3) | ||||||||
| 9,250,000 | 9.38 | 03/01/2007 | 8,140,000 | |||||
| Simonds Industries, Inc. (B-/B3) | ||||||||
| 750,000 | 10.25 | 07/01/2008 | 525,000 | |||||
| Thermadyne Holdings Corp. (CCC+/Caa1)§ | ||||||||
| 4,000,000 | 0.00/12.50 | 06/01/2008 | 1,200,000 | |||||
| Thermadyne Manufacturing LLC (CCC+/B3) | ||||||||
| 6,750,000 | 9.88 | 06/01/2008 | 4,860,000 | |||||
| Trench Electric S.A. (CCC+/B3) | ||||||||
| 3,500,000 | 10.25 | 12/15/2007 | 2,170,000 | |||||
| 23,842,500 | ||||||||
| Chemicals – 3.5% | ||||||||
| Avecia Group PLC (B/B2) | ||||||||
| 11,000,000 | 11.00 | 07/01/2009 | 10,450,000 | |||||
| Brunner Mond PLC (CCC/Caa2) | ||||||||
| 1,000,000 | 11.00 | 07/15/2008 | 270,000 | |||||
| Equistar Chemicals LP (BBB-/Baa3) | ||||||||
| 2,000,000 | 7.55 | 02/15/2026 | 1,573,600 | |||||
| General Chemicals Industries (B+/B3) | ||||||||
| 1,500,000 | 10.63 | 05/01/2009 | 991,875 | |||||
| Huntsman ICI Holdings LLC (B+/B2)† | ||||||||
| 2,500,000 | 10.13 | 07/01/2009 | 2,375,000 | |||||
| Huntsman ICI Holdings LLC (B+/B3) @† | ||||||||
| 7,125,000 | 12.27 | 12/31/2009 | 2,137,500 | |||||
| Lyondell Chemical Co. (BB/Ba3) | ||||||||
| 6,500,000 | 9.88 | 05/01/2007 | 6,370,000 | |||||
| Lyondell Chemical Co. (B+/B2) | ||||||||
| 2,000,000 | 10.88 | 05/01/2009 | 1,920,000 | |||||
| Polymer Group, Inc. (B/B3) | ||||||||
| 2,250,000 | 9.00 | 07/01/2007 | 1,597,500 | |||||
| 3,000,000 | 8.75 | 03/01/2008 | 2,100,000 | |||||
| Principal
Amount |
Interest
Rate |
Maturity
Date |
Value | |||||
|---|---|---|---|---|---|---|---|---|
| Corporate Bonds – (continued) | ||||||||
| Chemicals – (continued) | ||||||||
| Sovereign Specialty Chemicals, Inc. (B-/B3)† | ||||||||
| $ 1,250,000 | 11.88 | % | 03/15/2010 | $ 1,212,500 | ||||
| 30,997,975 | ||||||||
| Conglomerates – 0.5% | ||||||||
| Eagle-Picher Industries, Inc. (B-/B3) | ||||||||
| 6,500,000 | 9.38 | 03/01/2008 | 4,647,500 | |||||
| Consumer Cyclicals – 5.2% | ||||||||
| APCOA, Inc. (CCC+/Caa1) | ||||||||
| 5,000,000 | 9.25 | 03/15/2008 | 1,750,000 | |||||
| Avis Group Holdings, Inc. (BB-/Ba3) | ||||||||
| 3,000,000 | 11.00 | 05/01/2009 | 3,195,000 | |||||
| Fisher Scientific International, Inc. (B-/B3) | ||||||||
| 16,000,000 | 9.00 | 02/01/2008 | 14,654,375 | |||||
| Intertek Finance PLC (B-/B2) | ||||||||
| 7,000,000 | 10.25 | 11/01/2006 | 3,150,000 | |||||
| MSX International, Inc. (B/B3) | ||||||||
| 1,000,000 | 11.38 | 01/15/2008 | 920,000 | |||||
| National Equipment Services, Inc. (B/B3) | ||||||||
| 4,000,000 | 10.00 | 11/30/2004 | 2,400,000 | |||||
| United Rentals, Inc. (BB-/B1) | ||||||||
| 4,750,000 | 9.50 | 06/01/2008 | 4,049,375 | |||||
| 4,000,000 | 8.80 | 08/15/2008 | 3,200,000 | |||||
| Volume Services America, Inc. (B-/B3) | ||||||||
| 2,750,000 | 11.25 | 03/01/2009 | 2,516,250 | |||||
| Wesco Distribution, Inc. (B/B2) | ||||||||
| 10,000,000 | 9.13 | 06/01/2008 | 9,000,000 | |||||
| Williams Scotsman, Inc. (B-/B3) | ||||||||
| 1,000,000 | 9.88 | 06/01/2007 | 850,000 | |||||
| 45,685,000 | ||||||||
| Consumer Products – 1.8% | ||||||||
| Cabot Safety Corp. (B/B3) | ||||||||
| 4,000,000 | 12.50 | 07/15/2005 | 3,980,000 | |||||
| Corning Consumer Products Co. (B/B3) | ||||||||
| 6,250,000 | 9.63 | 05/01/2008 | 2,203,125 | |||||
| Generac Portable Products LLC (CCC+/B3) | ||||||||
| 2,000,000 | 11.25 | 07/01/2006 | 760,000 | |||||
| Jostens, Inc. (B/B3)† | ||||||||
| 2,500,000 | 12.75 | 05/01/2010 | 2,412,500 | |||||
| Polaroid Corp. (BB-/Ba3) | ||||||||
| 2,000,000 | 11.50 | 02/15/2006 | 1,560,000 | |||||
| Sealy Mattress Co. (B-/B2) | ||||||||
| 1,500,000 | 0.00/10.88 | § | 12/15/2007 | 1,125,000 | ||||
| 2,500,000 | 9.88 | 12/15/2007 | 2,375,000 | |||||
| The Scotts Co. (B+/B2)† | ||||||||
| 1,000,000 | 8.63 | 01/15/2009 | 955,000 | |||||
| United Industries Corp. (B-/B3) | ||||||||
| 1,750,000 | 9.88 | 04/01/2009 | 761,250 | |||||
| 16,131,875 | ||||||||
| Principal
Amount |
Interest
Rate |
Maturity
Date |
Value | |||||
|---|---|---|---|---|---|---|---|---|
| Corporate Bonds – (continued) | ||||||||
| Defense – 0.6% | ||||||||
| Condor Systems, Inc. (B-/B3)† | ||||||||
| $ 2,000,000 | 11.88 | % | 05/01/2009 | $ 1,320,000 | ||||
| Newport News Shipbuilding, Inc. (B+/Ba3) | ||||||||
| 4,000,000 | 9.25 | 12/01/2006 | 4,040,000 | |||||
| 5,360,000 | ||||||||
| Energy – 1.7% | ||||||||
| Benton Oil & Gas Co. (B/B3) | ||||||||
| 2,250,000 | 9.38 | 11/01/2007 | 1,350,000 | |||||
| Cross Timbers Oil Co. (B/B2) | ||||||||
| 2,750,000 | 8.75 | 11/01/2009 | 2,681,250 | |||||
| P&L Coal Holdings Corp. (B/B2) | ||||||||
| 4,250,000 | 9.63 | 05/15/2008 | 4,143,750 | |||||
| R&B Falcon Corp. (B+/Ba3) | ||||||||
| 2,000,000 | 6.75 | 04/15/2005 | 1,880,000 | |||||
| 500,000 | 9.50 | 12/15/2008 | 535,000 | |||||
| RBF Finance Co. (BB-/Ba3) | ||||||||
| 1,000,000 | 11.00 | 03/15/2006 | 1,137,500 | |||||
| 1,000,000 | 11.38 | 03/15/2009 | 1,142,500 | |||||
| Vintage Petroleum, Inc. (BB-/Ba3) | ||||||||
| 2,000,000 | 9.75 | 06/30/2009 | 2,100,000 | |||||
| 14,970,000 | ||||||||
| Entertainment – 1.6% | ||||||||
| Advanstar Communications, Inc. (B-/B2) | ||||||||
| 7,250,000 | 9.25 | 05/01/2008 | 7,322,500 | |||||
| Premier Parks, Inc. (B-/B3) | ||||||||
| 3,250,000 | 9.25 | 04/01/2006 | 2,998,125 | |||||
| SFX Entertainment, Inc. (BB+/Ba3) | ||||||||
| 2,000,000 | 9.13 | 02/01/2008 | 2,180,000 | |||||
| 1,000,000 | 9.13 | 12/01/2008 | 1,090,000 | |||||
| V2 Finance S.A.† | ||||||||
| 963,000 | 6.50 | 06/30/2012 | 221,490 | |||||
| 13,812,115 | ||||||||
| Environmental – 2.0% | ||||||||
| Allied Waste North America, Inc. (BB-/Ba3) | ||||||||
| 2,500,000 | 7.63 | 01/01/2006 | 2,225,000 | |||||
| 5,750,000 | 7.88 | 01/01/2009 | 4,945,000 | |||||
| Allied Waste North America, Inc. (B+/B2) | ||||||||
| 10,000,000 | 10.00 | 08/01/2009 | 8,650,000 | |||||
| The IT Group, Inc. (B+/B3) | ||||||||
| 2,000,000 | 11.25 | 04/01/2009 | 1,720,000 | |||||
| 17,540,000 | ||||||||
| Food – 2.0% | ||||||||
| Agrilink Foods, Inc. (B-/B3) | ||||||||
| 1,500,000 | 11.88 | 11/01/2008 | 1,102,500 | |||||
| Aurora Foods, Inc. (CCC+/Caa1) | ||||||||
| 3,750,000 | 9.88 | 02/15/2007 | 2,887,500 | |||||
| 1,000,000 | 8.75 | 07/01/2008 | 730,000 | |||||
| Del Monte Foods Co. (B-/Caa1)§ | ||||||||
| 5,350,000 | 0.00/12.50 | 12/15/2007 | 4,012,500 | |||||
| Principal
Amount |
Interest
Rate |
Maturity
Date |
Value | |||||
|---|---|---|---|---|---|---|---|---|
| Corporate Bonds – (continued) | ||||||||
| Food – (continued) | ||||||||
| Domino’s, Inc. (B-/B3) | ||||||||
| $ 5,000,000 | 10.38 | % | 01/15/2009 | $ 4,562,500 | ||||
| Eagle Family Foods (CCC+/B3) | ||||||||
| 5,000,000 | 8.75 | 01/15/2008 | 2,550,000 | |||||
| New World Pasta Co. (CCC+/Caa1) | ||||||||
| 1,000,000 | 9.25 | 02/15/2009 | 490,000 | |||||
| Premier International Foods PLC (B-/B3)† | ||||||||
| 1,500,000 | 12.00 | 09/01/2009 | 1,162,500 | |||||
| 17,497,500 | ||||||||
| Gaming – 0.3% | ||||||||
| Autotote Corp. (B-/B3)† | ||||||||
| 3,000,000 | 12.50 | 08/15/2010 | 2,955,000 | |||||
| Health Care – 1.6% | ||||||||
| ALARIS Medical, Inc. (CCC+/Caa1)§ | ||||||||
| 4,000,000 | 0.00/11.13 | 08/01/2008 | 480,000 | |||||
| Genesis Health Ventures, Inc. (C)V | ||||||||
| 500,000 | 9.25 | 10/01/2006 | 60,000 | |||||
| 1,000,000 | 9.88 | 01/15/2009 | 90,000 | |||||
| HCA-The Healthcare Co. (BB+/Ba2) | ||||||||
| 1,500,000 | 8.75 | 09/01/2010 | 1,513,483 | |||||
| Hudson Respiratory Care, Inc. (B-/B3) | ||||||||
| 3,500,000 | 9.13 | 04/15/2008 | 2,104,375 | |||||
| Iasis Healthcare Corp. (B-/B3)† | ||||||||
| 3,500,000 | 13.00 | 10/15/2009 | 3,185,000 | |||||
| Kinetic Concepts, Inc. (CCC/B3) | ||||||||
| 5,000,000 | 9.63 | 11/01/2007 | 4,175,000 | |||||
| Triad Hospitals Holdings, Inc. (B-/B3) | ||||||||
| 2,000,000 | 11.00 | 05/15/2009 | 2,080,000 | |||||
| 13,687,858 | ||||||||
| Home Construction – 0.3% | ||||||||
| D.R. Horton, Inc. (BB/Ba1) | ||||||||
| 1,000,000 | 8.00 | 02/01/2009 | 890,000 | |||||
| The Ryland Group, Inc. (BB/Ba2) | ||||||||
| 1,750,000 | 9.75 | 09/01/2010 | 1,680,000 | |||||
| 2,570,000 | ||||||||
| Insurance Companies – 0.8% | ||||||||
| Willis Corroon Corp. (B+/Ba3) | ||||||||
| 7,500,000 | 9.00 | 02/01/2009 | 6,862,500 | |||||
| Media-Cable – 5.9% | ||||||||
| Adelphia Communications Corp. (B+/B2) | ||||||||
| 1,000,000 | 9.25 | 10/01/2002 | 980,000 | |||||
| 6,000,000 | 9.38 | 11/15/2009 | 5,160,000 | |||||
| 1,000,000 | 10.88 | 10/01/2010 | 935,000 | |||||
| Callahan Nordrhein Westfalen (B-/B3)† | ||||||||
| 6,000,000 | 14.00 | 07/15/2010 | 5,790,000 | |||||
| Charter Communications Holdings LLC (B+/B2) | ||||||||
| 1,000,000 | 8.25 | 04/01/2007 | 905,000 | |||||
| 2,000,000 | 8.63 | 04/01/2009 | 1,810,000 | |||||
| 3,000,000 | 0.00/11.75 | § | 01/15/2010 | 1,725,000 | ||||
| 13,250,000 | 0.00/9.92 | § | 04/01/2011 | 7,751,250 | ||||
| Principal
Amount |
Interest
Rate |
Maturity
Date |
Value | |||||
|---|---|---|---|---|---|---|---|---|
| Corporate Bonds – (continued) | ||||||||
| Media-Cable – (continued) | ||||||||
| Echostar DBS Corp. (B+/B1) | ||||||||
| $ 4,000,000 | 9.38 | % | 02/01/2009 | $ 3,940,000 | ||||
| Frontiervision Holdings LP (B+/B2)§ | ||||||||
| 5,000,000 | 0.00/11.88 | 09/15/2007 | 4,250,000 | |||||
| Ono Finance PLC (CCC+)† | ||||||||
| 1,250,000 | 13.00 | 05/01/2009 | 962,500 | |||||
| Renaissance Media Group LLC (B-/B3)§ | ||||||||
| 3,000,000 | 0.00/10.00 | 04/15/2008 | 1,995,000 | |||||
| Telewest Communications PLC (B+/B1) | ||||||||
| 9,500,000 | 0.00/11.00 | § | 10/01/2007 | 8,170,000 | ||||
| 5,000,000 | 11.25 | 11/01/2008 | 4,350,000 | |||||
| 2,000,000 | 0.00/9.78 | § | 04/15/2009 | 900,000 | ||||
| 2,000,000 | 0.00/11.38 | † | 02/01/2010 | 870,000 | ||||
| 1,000,000 | 9.88 | † | 02/01/2010 | 790,000 | ||||
| 51,283,750 | ||||||||
| Media-Non Cable – 4.4% | ||||||||
| AMFM, Inc. (BBB-/Ba1) | ||||||||
| 750,000 | 8.00 | 11/01/2008 | 751,875 | |||||
| AMFM, Inc. (BB+/Ba3) | ||||||||
| 2,000,000 | 8.13 | 12/15/2007 | 2,010,000 | |||||
| Crown Castle International Corp. (B/B3) | ||||||||
| 13,500,000 | 0.00/10.63 | § | 11/15/2007 | 10,631,250 | ||||
| 7,000,000 | 0.00/10.38 | § | 05/15/2011 | 4,410,000 | ||||
| 5,500,000 | 0.00/11.25 | § | 08/01/2011 | 3,520,000 | ||||
| 2,500,000 | 10.75 | 08/01/2011 | 2,562,500 | |||||
| Lin Holdings Corp. (B-/B3)§ | ||||||||
| 5,500,000 | 0.00/10.00 | 03/01/2008 | 3,877,500 | |||||
| Pinnacle Holdings, Inc. (B/B3)§ | ||||||||
| 5,000,000 | 0.00/10.00 | 03/15/2008 | 2,900,000 | |||||
| PX Escrow Corp. (B-/B3)§ | ||||||||
| 1,000,000 | 0.00/9.63 | 02/01/2006 | 340,000 | |||||
| Spectrasite Holdings, Inc. (B-/B3)§ | ||||||||
| 5,500,000 | 0.00/11.25 | 04/15/2009 | 2,839,375 | |||||
| Young Broadcasting, Inc. (B/B2) | ||||||||
| 5,000,000 | 8.75 | 06/15/2007 | 4,550,000 | |||||
| 38,392,500 | ||||||||
| Metals – 0.7% | ||||||||
| Earle M. Jorgensen Co. (B-/B3) | ||||||||
| 3,500,000 | 9.50 | 04/01/2005 | 2,975,000 | |||||
| Haynes International, Inc. (B-/B3) | ||||||||
| 1,500,000 | 11.63 | 09/01/2004 | 1,050,000 | |||||
| Republic Technologies International (CC/Caa3) | ||||||||
| 2,000,000 | 13.75 | 07/15/2009 | 300,000 | |||||
| WHX Corp. (B-/B3) | ||||||||
| 2,500,000 | 10.50 | 04/15/2005 | 1,550,000 | |||||
| 5,875,000 | ||||||||
| Principal
Amount |
Interest
Rate |
Maturity
Date |
Value | |||||
|---|---|---|---|---|---|---|---|---|
| Corporate Bonds – (continued) | ||||||||
| Packaging – 2.4% | ||||||||
| AEP Industries, Inc. (B/B3) | ||||||||
| $ 3,000,000 | 9.88 | % | 11/15/2007 | $ 2,460,000 | ||||
| Graham Packaging Co. (B-/B3) | ||||||||
| 4,500,000 | 8.75 | 01/15/2008 | 2,925,000 | |||||
| Graham Packaging Co. (B-/Caa1)§ | ||||||||
| 6,500,000 | 0.00/10.75 | 01/15/2009 | 2,470,000 | |||||
| Huntsman Packaging Corp. (B/B3)† | ||||||||
| 7,000,000 | 13.00 | 06/01/2010 | 5,600,000 | |||||
| Owens-Illinois, Inc. (BB/Ba1) | ||||||||
| 3,000,000 | 7.15 | 05/15/2005 | 2,160,000 | |||||
| Printpack, Inc. (B/Caa1) | ||||||||
| 3,000,000 | 10.63 | 08/15/2006 | 2,805,000 | |||||
| Printpack, Inc. (B+/B3) | ||||||||
| 3,000,000 | 9.88 | 08/15/2004 | 2,910,000 | |||||
| 21,330,000 | ||||||||
| Paper – 4.2% | ||||||||
| Ainsworth Lumber Co. Ltd. (B/B2) | ||||||||
| 6,000,000 | 12.50 | 07/15/2007 | 5,400,000 | |||||
| Packaging Corp. of America (B+/B1) | ||||||||
| 9,000,000 | 9.63 | 04/01/2009 | 9,202,500 | |||||
| Repap New Brunswick, Inc (CCC+/Caa) | ||||||||
| 1,500,000 | 10.63 | 04/15/2005 | 1,545,000 | |||||
| Riverwood International Corp. (B-/B3) | ||||||||
| 8,250,000 | 10.25 | 04/01/2006 | 8,043,750 | |||||
| 1,500,000 | 10.63 | 08/01/2007 | 1,470,000 | |||||
| Riverwood International Corp. (CCC+/Caa1) | ||||||||
| 12,000,000 | 10.88 | 04/01/2008 | 10,830,000 | |||||
| 36,491,250 | ||||||||
| Publishing – 1.5% | ||||||||
| American Lawyer Media, Inc. (B/B2) | ||||||||
| 4,000,000 | 9.75 | 12/15/2007 | 3,560,000 | |||||
| Day International Group, Inc. (B-/B3) | ||||||||
| 3,250,000 | 9.50 | 03/15/2008 | 2,860,000 | |||||
| Merrill Corp. (B/B3) | ||||||||
| 1,500,000 | 12.00 | 05/01/2009 | 1,035,000 | |||||
| Transwestern Publishing Co. (B-/B2) | ||||||||
| 3,000,000 | 9.63 | 11/15/2007 | 2,970,000 | |||||
| WRC Media Corp. (B-/B3) | ||||||||
| 2,250,000 | 12.75 | 11/15/2009 | 1,935,000 | |||||
| Ziff Davis Media, Inc. (B-/B2)† | ||||||||
| 1,000,000 | 12.00 | 07/15/2010 | 915,000 | |||||
| 13,275,000 | ||||||||
| Retailers – 0.7% | ||||||||
| Advance Holdings Corp. (B-/Caa2)§ | ||||||||
| 2,000,000 | 0.00/12.88 | 04/15/2009 | 740,000 | |||||
| Duane Reade, Inc. (B-/B3) | ||||||||
| 1,750,000 | 9.25 | 02/15/2008 | 1,487,500 | |||||
| Principal
Amount |
Interest
Rate |
Maturity
Date |
Value | |||||
|---|---|---|---|---|---|---|---|---|
| Corporate Bonds – (continued) | ||||||||
| Retailers – (continued) | ||||||||
| Mattress Discounters Corp. (B+/B2) | ||||||||
| $ 750,000 | 12.63 | % | 07/15/2007 | $ 690,000 | ||||
| Musicland Stores Corp. (B/B2) | ||||||||
| 3,250,000 | 9.00 | 06/15/2003 | 2,957,500 | |||||
| 5,875,000 | ||||||||
| Technology – 5.3% | ||||||||
| Amkor Technology, Inc. (B/B2)† | ||||||||
| 2,000,000 | 5.00 | 03/15/2007 | 1,430,000 | |||||
| Details, Inc. (B+/Caa1)§ | ||||||||
| 2,000,000 | 0.00/12.50 | 11/15/2007 | 1,600,000 | |||||
| Details, Inc. (B-/B3) | ||||||||
| 5,000,000 | 10.00 | 11/15/2005 | 4,843,750 | |||||
| Exodus Communications, Inc. (B/B3) | ||||||||
| 3,000,000 | 11.25 | 07/01/2008 | 2,790,000 | |||||
| 1,250,000 | 10.75 | 12/15/2009 | 1,112,500 | |||||
| 1,000,000 | 11.63 | 07/15/2010 | 920,000 | |||||
| Flextronics International Ltd. (B+/Ba3)† | ||||||||
| 3,000,000 | 9.88 | 07/01/2010 | 3,000,000 | |||||
| Globix Corp. (B-) | ||||||||
| 1,750,000 | 12.50 | 02/01/2010 | 962,500 | |||||
| Intersil Corp. (B/B1) | ||||||||
| 3,500,000 | 13.25 | 08/15/2009 | 4,060,000 | |||||
| Intira Corp. (CCC)§ | ||||||||
| 2,000,000 | 0.00/13.00 | 02/01/2010 | 1,000,000 | |||||
| MCMS, Inc. (CCC+/Caa3) | ||||||||
| 3,000,000 | 9.75 | 03/01/2008 | 2,040,000 | |||||
| NorthPoint Communications Group, Inc. (CCC/Caa1) | ||||||||
| 3,000,000 | 12.88 | 02/15/2010 | 2,790,000 | |||||
| SCG Holding & Semiconductor Corp. (B/B2) | ||||||||
| 7,030,000 | 12.00 | 08/01/2009 | 6,977,275 | |||||
| Unisys Corp. (BB+/Ba1) | ||||||||
| 2,000,000 | 11.75 | 10/15/2004 | 2,095,000 | |||||
| Viasystems Group, Inc. (B/B3) | ||||||||
| 12,250,000 | 9.75 | 06/01/2007 | 10,902,500 | |||||
| 46,523,525 | ||||||||
| Telecommunications – 10.8% | ||||||||
| 360networks, Inc. (B/B3) | ||||||||
| 3,000,000 | 12.50 | 12/15/2005 | 2,625,000 | |||||
| Allegiance Telecom, Inc. (B/B3) | ||||||||
| 3,000,000 | 0.00/11.75 | § | 02/15/2008 | 2,070,000 | ||||
| 1,000,000 | 12.88 | 05/15/2008 | 1,000,000 | |||||
| Birch Telecom, Inc. | ||||||||
| 1,000,000 | 14.00 | 06/15/2008 | 600,000 | |||||
| CapRock Communications Corp. (B-/B3) | ||||||||
| 750,000 | 11.50 | 05/01/2009 | 721,875 | |||||
| Carrier1 International S.A. (B-/B3)† | ||||||||
| 2,250,000 | 13.25 | 02/15/2009 | 1,732,500 | |||||
| Principal
Amount |
Interest
Rate |
Maturity
Date |
Value | |||||
|---|---|---|---|---|---|---|---|---|
| Corporate Bonds – (continued) | ||||||||
| Telecommunications – (continued) | ||||||||
| Colt Telecom Group PLC (B+/B1)§ | ||||||||
| $ 5,500,000 | 0.00/12.00 | % | 12/15/2006 | $ 5,011,875 | ||||
| Completel Europe N.V. (CCC+/Caa1)§ | ||||||||
| 2,250,000 | 0.00/14.00 | 02/15/2009 | 1,080,000 | |||||
| Econophone Inc.† | ||||||||
| 2,000,000 | 13.50 | 07/15/2007 | 1,000,000 | |||||
| Energis PLC (B+/B1)† | ||||||||
| 4,500,000 | 9.75 | 06/15/2009 | 4,320,000 | |||||
| Global Crossing Holdings Ltd. (BB/Ba2) | ||||||||
| 1,500,000 | 9.13 | 11/15/2006 | 1,428,750 | |||||
| 2,750,000 | 9.63 | 05/15/2008 | 2,633,125 | |||||
| 2,500,000 | 9.50 | 11/15/2009 | 2,387,500 | |||||
| GST Network Funding, Inc.§ | ||||||||
| 2,000,000 | 0.00/10.50 | 05/01/2008 | 900,000 | |||||
| Hermes Europe Railtel B.V. (B/B3) | ||||||||
| 2,500,000 | 11.50 | 08/15/2007 | 1,125,000 | |||||
| ICG Holdings, Inc. (CCC-/Caa1)§ | ||||||||
| 3,000,000 | 0.00/11.63 | 03/15/2007 | 420,000 | |||||
| Intermedia Communications, Inc. (B/B2) | ||||||||
| 7,250,000 | 0.00/11.25 | § | 07/15/2007 | 6,017,500 | ||||
| 1,000,000 | 9.50 | 03/01/2009 | 967,500 | |||||
| Intermedia Communications, Inc. (CCC+/B3)§ | ||||||||
| 1,000,000 | 0.00/12.25 | 03/01/2009 | 640,000 | |||||
| Jazztel PLC (CCC+/Caa1) | ||||||||
| 750,000 | 14.00 | 04/01/2009 | 525,000 | |||||
| Leap Wireless International, Inc. (CCC/Caa2) | ||||||||
| 1,000,000 | 0.00/14.50 | § | 04/15/2010 | 280,000 | ||||
| 500,000 | 12.50 | 04/15/2010 | 360,000 | |||||
| Level 3 Communications, Inc. (B/B3) | ||||||||
| 4,000,000 | 9.13 | 05/01/2008 | 3,240,000 | |||||
| McLeodUSA, Inc. (B+/B1) | ||||||||
| 2,000,000 | 0.00/10.50 | § | 03/01/2007 | 1,670,000 | ||||
| 2,000,000 | 9.50 | 11/01/2008 | 1,830,000 | |||||
| 750,000 | 8.13 | 02/15/2009 | 641,250 | |||||
| Metromedia Fiber Network, Inc. (B+/B2) | ||||||||
| 3,000,000 | 10.00 | 11/15/2008 | 2,670,000 | |||||
| 2,000,000 | 10.00 | 12/15/2009 | 1,800,000 | |||||
| Metronet Communications Corp. (BBB/Baa3) | ||||||||
| 750,000 | 10.63 | 11/01/2008 | 828,750 | |||||
| Metronet Communications Corp. (BBB/Baa3)§ | ||||||||
| 7,000,000 | 0.00/9.95 | 06/15/2008 | 5,740,000 | |||||
| Nextel Communications, Inc. (B/B1) | ||||||||
| 5,500,000 | 9.38 | 11/15/2009 | 5,335,000 | |||||
| Nextel Partners, Inc. (CCC+/B3) | ||||||||
| 650,000 | 0.00/14.00 | § | 02/01/2009 | 455,000 | ||||
| 3,500,000 | 11.00 | 03/15/2010 | 3,482,500 | |||||
| NEXTLINK Communications, Inc. (B/B2) | ||||||||
| 2,000,000 | 9.63 | 10/01/2007 | 1,710,000 | |||||
| 2,250,000 | 9.00 | 03/15/2008 | 1,845,000 | |||||
| 1,500,000 | 10.75 | 06/01/2009 | 1,316,250 | |||||
| NTL Communications Corp. (B/B2)† | ||||||||
| 2,250,000 | 11.88 | 10/01/2010 | 2,081,250 | |||||
| Principal
Amount |
Interest
Rate |
Maturity
Date |
Value | |||||
|---|---|---|---|---|---|---|---|---|
| Corporate Bonds – (continued) | ||||||||
| Telecommunications – (continued) | ||||||||
| Pathnet, Inc. | ||||||||
| $ 1,500,000 | 12.25 | % | 04/15/2008 | $ 480,000 | ||||
| Price Communications Wireless, Inc. (B+/Ba2) | ||||||||
| 2,000,000 | 9.13 | 12/15/2006 | 1,990,000 | |||||
| PSINet, Inc. (B-/B3) | ||||||||
| 3,750,000 | 10.00 | 02/15/2005 | 1,875,000 | |||||
| 1,500,000 | 11.50 | 11/01/2008 | 780,000 | |||||
| 1,000,000 | 11.00 | 08/01/2009 | 500,000 | |||||
| RSL Communications PLC (B-/B3) | ||||||||
| 1,000,000 | 12.25 | 11/15/2006 | 132,500 | |||||
| 2,000,000 | 0.00/10.13 | § | 03/01/2008 | 140,000 | ||||
| 625,000 | 9.13 | 03/01/2008 | 100,000 | |||||
| 2,000,000 | 10.50 | 11/15/2008 | 300,000 | |||||
| Tele1 Europe B.V. (B-/B3) | ||||||||
| 1,000,000 | 13.00 | 05/15/2009 | 860,000 | |||||
| TeleCorp PCS, Inc. (B3)† | ||||||||
| 2,000,000 | 10.63 | 07/15/2010 | 1,995,000 | |||||
| United Pan-Europe Communications N.V. (B/B2) | ||||||||
| 1,000,000 | 0.00/13.75 | § | 02/01/2010 | 390,000 | ||||
| 2,000,000 | 11.25 | 02/01/2010 | 1,520,000 | |||||
| Viatel, Inc. (B-/B3) | ||||||||
| 2,343,000 | 11.50 | 03/15/2009 | 1,218,360 | |||||
| WAM!Net, Inc. (CCC+)§ | ||||||||
| 1,250,000 | 0.00/13.25 | 03/01/2005 | 559,375 | |||||
| Williams Communications Group, Inc. (B+/B2) | ||||||||
| 2,000,000 | 10.70 | 10/01/2007 | 1,715,000 | |||||
| 3,500,000 | 11.70 | † | 08/01/2008 | 3,080,000 | ||||
| 2,000,000 | 10.88 | 10/01/2009 | 1,685,000 | |||||
| 2,000,000 | 11.88 | 08/01/2010 | 1,740,000 | |||||
| World Access, Inc. (B-) | ||||||||
| 2,000,000 | 13.25 | 01/15/2008 | 1,480,000 | |||||
| 95,030,860 | ||||||||
| Telecommunications-Cellular – 5.8% | ||||||||
| AirGate PCS, Inc. (CCC/Caa1)§ | ||||||||
| 1,000,000 | 0.00/13.50 | 10/01/2009 | 570,000 | |||||
| Alamosa PCS Holdings, Inc. (CCC+/Caa1)§ | ||||||||
| 2,500,000 | 0.00/12.75 | 02/15/2010 | 1,200,000 | |||||
| Centennial Cellular Corp. (B-/B3) | ||||||||
| 6,000,000 | 10.75 | 12/15/2008 | 5,640,000 | |||||
| Dobson Communications Corp. (B/B3)† | ||||||||
| 3,000,000 | 10.88 | 07/01/2010 | 2,880,000 | |||||
| Esat Telecom Group PLC (A/A2) | ||||||||
| 4,000,000 | 11.88 | 12/01/2008 | 4,720,000 | |||||
| Horizon PCS, Inc. (CCC/Caa1)§ | ||||||||
| 2,500,000 | 0.00/14.00 | 10/01/2010 | 1,187,500 | |||||
| Millicom International Cellular S.A. (B-/B3)§ | ||||||||
| 5,000,000 | 0.00/13.50 | 06/01/2006 | 4,200,000 | |||||
| Principal
Amount |
Interest
Rate |
Maturity
Date |
Value | |||||
|---|---|---|---|---|---|---|---|---|
| Corporate Bonds – (continued) | ||||||||
| Telecommunications-Cellular – (continued) | ||||||||
| Nextel Communications, Inc. (B/B1)§ | ||||||||
| $ 8,500,000 | 0.00/10.65 | % | 09/15/2007 | $ 6,842,500 | ||||
| 4,250,000 | 0.00/9.75 | 10/31/2007 | 3,251,250 | |||||
| 18,000,000 | 0.00/9.95 | 02/15/2008 | 13,635,000 | |||||
| Orange PLC (A/A1) | ||||||||
| 3,000,000 | 9.00 | 06/01/2009 | 3,090,000 | |||||
| Triton PCS Holdings, Inc. (CCC+/B3)§ | ||||||||
| 4,250,000 | 0.00/11.00 | 05/01/2008 | 3,219,375 | |||||
| 50,435,625 | ||||||||
| Textiles – 0.1% | ||||||||
| Galey & Lord, Inc. (B/Ca) | ||||||||
| 2,000,000 | 9.13 | 03/01/2008 | 1,080,000 | |||||
| Globe Manufacturing Corp. (D/Ca)V | ||||||||
| 2,000,000 | 10.00 | 08/01/2008 | 200,000 | |||||
| 1,280,000 | ||||||||
| TOTAL CORPORATE BONDS | ||||||||
| (Cost $773,272,810) | $ 647,563,213 | |||||||
| Emerging Market Debt – 3.4% | ||||||||
| APP China Group Ltd. (CCC+/B3)† | ||||||||
| $ 670,000 | 14.00 | % | 03/15/2010 | $ 281,400 | ||||
| Cellco Finance N.V. (B/B1) | ||||||||
| 4,000,000 | 12.75 | 08/01/2005 | 4,070,625 | |||||
| Federal Republic of Brazil (B+/B1) | ||||||||
| 420,000 | 12.25 | 03/06/2030 | 365,138 | |||||
| 700,000 | 11.00 | 08/17/2040 | 535,062 | |||||
| Federal Republic of Brazil C-Bonds (B+/B2) | ||||||||
| 2,303,959 | 8.00 | 04/15/2014 | 1,715,010 | |||||
| Grupo Industrial Durango S.A. (BB-/B2) | ||||||||
| 2,400,000 | 12.63 | 08/01/2003 | 2,415,142 | |||||
| Grupo Iusacell S.A. de C.V. (B+/B1) | ||||||||
| 2,000,000 | 14.25 | 12/01/2006 | 2,015,000 | |||||
| Hanvit Bank (B/B1)†# | ||||||||
| 1,990,000 | 11.75 | 03/01/2010 | 1,902,750 | |||||
| Indah Kiat Finance Mauritius (CCC+/B3) | ||||||||
| 1,240,000 | 10.00 | 07/01/2007 | 496,000 | |||||
| MRS Logistica S.A. (B)† | ||||||||
| 120,000 | 10.63 | 08/15/2005 | 100,500 | |||||
| Multicanal S.A. (BB+/B1)† | ||||||||
| 2,000,000 | 13.13 | 04/15/2009 | 1,650,000 | |||||
| National Power Corp. (BB) | ||||||||
| 500,000 | 7.63 | 11/15/2000 | 499,541 | |||||
| National Republic of Bulgaria (B2)# | ||||||||
| 4,120,000 | 3.00 | 07/28/2012 | 2,945,800 | |||||
| Partner Communications Co., Ltd. (B-/B3) ADR | ||||||||
| 3,000,000 | 13.00 | 08/15/2010 | 2,460,000 | |||||
| Principal
Amount |
Interest Rate | Maturity
Date |
Value | |||||
|---|---|---|---|---|---|---|---|---|
| Emerging Market Debt – (continued) | ||||||||
| PTC International Finance B.V. (B+/B2)§ | ||||||||
| $ 870,000 | 0.00/10.75 | % | 07/01/2007 | $ 578,550 | ||||
| Republic of Panama (BB+/Ba1)# | ||||||||
| 1,073,898 | 7.93 | 05/10/2002 | 1,057,790 | |||||
| 300,000 | 10.75 | 05/15/2020 | 290,813 | |||||
| 610,000 | 9.38 | 04/01/2029 | 584,837 | |||||
| Republic of Poland (BBB+/Baa1)# | ||||||||
| 1,050,000 | 3.50 | 10/27/2024 | 656,906 | |||||
| 1,310,000 | 4.00 | 10/27/2024 | 890,800 | |||||
| Russian Federation (B-/B3) | ||||||||
| 2,900,000 | 10.00 | 06/26/2007 | 2,165,937 | |||||
| State of Qatar (BBB/Baa2) | ||||||||
| 900,000 | 9.75 | 06/15/2030 | 868,500 | |||||
| United Mexican States (BB+/Baa3) | ||||||||
| 700,000 | 10.38 | 02/17/2009 | 741,125 | |||||
| 240,000 | 9.88 | 02/01/2010 | 249,450 | |||||
| TOTAL EMERGING MARKET DEBT | ||||||||
| (Cost $29,712,171) | $ 29,536,676 | |||||||
| Foreign Debt ObligationsE – 12.4% | ||||||||
| British Pound Sterling – 3.1% | ||||||||
| Coral Group Holdings PLC (B-/B3)† | ||||||||
| GBP 1,500,000 | 10.00 | % | 02/15/2009 | $ 2,176,424 | ||||
| 2,355,177 | 13.50 | 09/30/2009 | 3,383,070 | |||||
| Gala Group Holdings PLC (B-/B3) | ||||||||
| 1,750,000 | 12.00 | 06/01/2010 | 2,634,380 | |||||
| IPC Magazines Group PLC (B-/B3) | ||||||||
| 3,250,000 | 0.00/10.75§ | 03/15/2008 | 3,017,974 | |||||
| 4,000,000 | 9.63 | 03/15/2008 | 5,049,303 | |||||
| Telewest Communications PLC (B+/B1)§ | ||||||||
| 12,500,000 | 0.00/9.88 | 04/15/2009 | 8,161,589 | |||||
| William Hill Finance PLC (B-/B3) | ||||||||
| 1,500,000 | 10.63 | 04/30/2008 | 2,209,070 | |||||
| 26,631,810 | ||||||||
| Euro Currency – 8.1% | ||||||||
| BSN Financing Co., S.A. (B/B1) | ||||||||
| EUR 750,000 | 10.25 | 08/01/2009 | 588,716 | |||||
| Callahan Nordrhein Westfalen (B-/B3)† | ||||||||
| 500,000 | 14.00 | 07/15/2010 | 413,693 | |||||
| Clondalkin Industries PLC (B-/B3) | ||||||||
| 1,500,000 | 10.63 | 01/15/2010 | 1,241,078 | |||||
| Completel Europe N.V. (Caa1) | ||||||||
| 1,000,000 | 14.00 | 04/15/2010 | 678,880 | |||||
| CP Kelco (B/B3)† | ||||||||
| 8,750,000 | 11.88 | 09/15/2010 | 7,105,967 | |||||
| Enitel ASA (B-/B3) | ||||||||
| 2,500,000 | 12.50 | 04/15/2010 | 1,378,976 | |||||
| Esat Telecom Group PLC (B+/Aa1) | ||||||||
| 2,000,000 | 11.88 | 11/01/2009 | 2,092,750 | |||||
| Exodus Communications, Inc. (B/B3) | ||||||||
| 3,250,000 | 10.75 | 12/15/2009 | 2,385,628 | |||||
| Principal
Amount |
Interest
Rate |
Maturity
Date |
Value | |||||
|---|---|---|---|---|---|---|---|---|
| Foreign Debt ObligationsE – (continued) | ||||||||
| Euro Currency – (continued) | ||||||||
| FLAG Telecom Holdings Ltd. (B/B2) | ||||||||
| EUR 3,500,000 | 11.63 | % | 03/30/2010 | $ 2,405,782 | ||||
| Flextronics International Ltd. (B+/Ba3)† | ||||||||
| 250,000 | 9.75 | 07/01/2010 | 216,393 | |||||
| Flowserve Finance B.V. (B/B3)† | ||||||||
| 1,500,000 | 12.25 | 08/15/2010 | 1,291,994 | |||||
| Huntsman ICI Chemicals (B+/B2) | ||||||||
| 8,000,000 | 10.13 | 07/01/2009 | 6,585,139 | |||||
| Ineos PLC (B+/B3) | ||||||||
| 5,250,000 | 10.25 | 05/15/2010 | 4,165,567 | |||||
| Jazztel PLC (CCC+/Caa1) | ||||||||
| 2,000,000 | 14.00 | 04/01/2009 | 1,238,957 | |||||
| Jones Lang Lasalle Financial B.V. (BBB-/Ba2) | ||||||||
| 750,000 | 9.00 | 06/15/2007 | 657,930 | |||||
| Kappa Beheer B.V. (B/B2)†§ | ||||||||
| 6,500,000 | 0.00/12.50 | 07/15/2009 | 3,654,285 | |||||
| Kappa Beheer N.V. (B/B2) | ||||||||
| 8,000,000 | 10.63 | 07/15/2009 | 6,856,691 | |||||
| Metromedia Fiber Network, Inc. (B+/B2) | ||||||||
| 2,750,000 | 10.00 | 12/15/2009 | 2,088,618 | |||||
| Neste Chemicals International OYJ (B/B3) | ||||||||
| 2,896,000 | 12.25 | 08/15/2010 | 2,174,929 | |||||
| NTL Communications Corp. (B/B2)§ | ||||||||
| 3,800,000 | 0.00/11.50 | 11/15/2009 | 1,596,217 | |||||
| NTL Communications Corp. (B-/B3) | ||||||||
| 11,750,000 | 9.88 | 11/15/2009 | 8,375,686 | |||||
| Ono Finance PLC (CCC+/Caa1)† | ||||||||
| 5,000,000 | 13.00 | 05/01/2009 | 3,182,251 | |||||
| 2,500,000 | 14.00 | 07/15/2010 | 1,675,986 | |||||
| PTC International Finance II S.A. (B+/B2) | ||||||||
| 2,570,000 | 11.25 | 12/01/2009 | 1,941,004 | |||||
| Slovak Wireless Finance Co. (B/B2) | ||||||||
| 750,000 | 11.25 | 03/30/2007 | 572,805 | |||||
| Tele1 Europe B.V. (B-/B3)† | ||||||||
| 1,000,000 | 13.00 | 05/15/2009 | 767,984 | |||||
| 1,000,000 | 11.88 | 12/01/2009 | 721,310 | |||||
| United Pan-Europe Communications N.V. (B/B2) | ||||||||
| 1,500,000 | 11.25 | 02/01/2010 | 980,133 | |||||
| Vantico Group S.A. (B-/B3) | ||||||||
| 6,000,000 | 12.00 | 08/01/2010 | 4,149,656 | |||||
| 71,185,005 | ||||||||
| German Mark – 1.2% | ||||||||
| Colt Telecom Group PLC (B+/B1) | ||||||||
| DEM 5,000,000 | 8.88 | 11/30/2007 | 2,060,942 | |||||
| Impress Metal Pack Holdings (B/B2) | ||||||||
| 10,000,000 | 9.88 | 05/29/2007 | 3,904,942 | |||||
| Ineos PLC (B+/B3) | ||||||||
| 5,000,000 | 8.63 | 04/30/2005 | 2,060,942 | |||||
| Sirona Dental Systems (B/B2)† | ||||||||
| 6,750,000 | 9.13 | 07/15/2008 | 1,727,937 | |||||
| Texon International PLC (B3)† | ||||||||
| 2,250,000 | 10.00 | 02/01/2008 | 877,636 | |||||
| 10,632,399 | ||||||||
| Principal
Amount |
Interest
Rate |
Maturity
Date |
Value | |||||
|---|---|---|---|---|---|---|---|---|
| Foreign Debt ObligationsE – (continued) | ||||||||
| TOTAL FOREIGN DEBT OBLIGATIONS | ||||||||
| (Cost $144,756,587) | $ 108,449,214 | |||||||
| Repurchase Agreement – 2.7% | ||||||||
| Joint Repurchase Agreement Account_ | ||||||||
| $23,800,000 | 6.62 | % | 11/01/2000 | $ 23,800,000 | ||||
| TOTAL REPURCHASE AGREEMENT | ||||||||
| (Cost $23,800,000) | $ 23,800,000 | |||||||
| Shares | Value | ||||
|---|---|---|---|---|---|
| Common Stocks – 0.4% | |||||
| 59,200 | Colt Telecom Group PLC * | $ 1,889,716 | |||
| 62,500 | Completel Europe N.V. | 500,000 | |||
| 9,132 | McleodUSA, Inc. | 175,791 | |||
| 33,342 | Pathmark Stores, Inc. | 523,053 | |||
| 2,881 | RSL Communications Ltd. | 3,601 | |||
| 18,792 | Tele1 Europe Holding AB ADR | 147,987 | |||
| 7,069 | World Access, Inc. | 34,461 | |||
| 3,044 | WRC Media Corp. | 0 | |||
| TOTAL COMMON STOCKS | |||||
| (Cost $993,452) | $ 3,274,609 | ||||
| Shares | Interest
Rate |
Maturity
Date |
Value | |||||
|---|---|---|---|---|---|---|---|---|
| Preferred Stocks‡ – 3.0% | ||||||||
| Avecia Group PLC (B-/B3) | ||||||||
| 46,656 | 16.00 | % | 07/01/2010 | $ 1,259,712 | ||||
| Crown Castle International Corp. (CCC+/Caa) | ||||||||
| 2,579 | 12.75 | 12/15/2010 | 2,604,790 | |||||
| CSC Holdings, Inc. (B+/B1) | ||||||||
| 63,359 | 11.75 | 10/01/2007 | 6,874,452 | |||||
| 79,970 | 11.13 | 04/01/2008 | 8,576,782 | |||||
| Eagle-Picher Holdings, Inc. (CCC+) | ||||||||
| 200 | 11.75 | 03/01/2008 | 450,000 | |||||
| Global Crossing Holdings Ltd. (B+/B1) | ||||||||
| 12,500 | 10.50 | 12/01/2008 | 1,237,500 | |||||
| Intermedia Communications, Inc. (CCC-/Caa) | ||||||||
| 1,482 | 13.50 | 03/31/2009 | 1,333,800 | |||||
| Nextel Communications, Inc. (CCC+/B3) | ||||||||
| 1,471 | 11.13 | 02/15/2010 | 1,441,580 | |||||
| River Holding Corp. | ||||||||
| 4,971 | 11.50 | 04/15/2010 | 320,649 | |||||
| Rural Cellular Corp. (CCC+/Caa) | ||||||||
| 2,189 | 12.25 | 05/15/2011 | 1,904,472 | |||||
| TOTAL PREFERRED STOCKS | ||||||||
| (Cost $23,343,350) | $ 26,003,737 | |||||||
|
Shares |
Value | ||||
|---|---|---|---|---|---|
| Warrants* – 0.3% | |||||
| 2,000 | ASAT Finance LLC, expiring November
1, 2006 |
$160,000 | |||
| 670 | Asia Pulp & Paper Ltd., expiring March
15, 2005 |
29,480 | |||
| 80,000 | Avecia Group PLC, expiring July 1, 2010 | 900,000 | |||
| 1,000 | Birch Telecom, Inc., expiring June 15,
2008 |
55,000 | |||
| 3,000 | Cellnet Data Systems, Inc., expiring
September 15, 2007 |
0 | |||
| 2,000 | Coral Group Holdings PLC, expiring
September 30, 2009 |
406,266 | |||
| 2,500 | Enitel ASA, expiring April 15, 2010 | 0 | |||
| 7,000 | Huntsman Packaging Corp., expiring June
1, 2010 |
0 | |||
| 44,618 | Intira Corp., expiring February 2, 2025 | 0 | |||
| 10,000 | Jazztel PLC, expiring April 1, 2009 | 441,272 | |||
| 2,500 | Jostens, Inc., expiring May 1, 2010 | 0 | |||
| 1,750 | Knology, Inc., expiring October 15, 2007 | 87,500 | |||
| 1,500 | Leap Wireless International, Inc., expiring
April 15, 2010 |
0 | |||
| 750 | Mattress Discounters Holding Corp.,
expiring July 15, 2007 |
7,500 | |||
| 1,500 | Merrill Corp., expiring May 1, 2009 | 0 | |||
| 6,250 | Ono Finance PLC, expiring May 1, 2009 | 387,010 | |||
| 1,500 | Pathnet, Inc., expiring April 15, 2008 | 15,000 | |||
| 2,000 | Republic Technologies International LLC,
expiring July 15, 2009 |
37,000 | |||
| 1,750 | V2 Music Holdings PLC, expiring April
15, 2008 |
0 | |||
|
Shares |
Value | ||||
|---|---|---|---|---|---|
| Warrants* – continued | |||||
| 3,750 | WAM!Net, Inc., expiring March 1,
2005 |
$ 41,250 | |||
| 750 | Worldwide Flight Services, Inc.,
expiring August 15, 2007 |
75 | |||
| TOTAL WARRANTS | |||||
| (Cost $407,823) | $ 2,567,353 | ||||
| TOTAL INVESTMENTS | |||||
| (Cost $996,286,193) | $841,194,802 | ||||
_
|
Joint repurchase agreement was entered into on October 31, 2000.
|
†
|
Security is exempt from registration under Rule 144A of the Securities Act of 1933. Such security may be resold, normally to
qualified institutional buyers in transactions exempt from registration. The market value of 144A securities amounts to $90,316,070 as of October 31, 2000.
|
§
|
These securities are issued with a zero coupon or dividend rate which increases to the stated rate at a set date in the future.
|
E
|
The principal amount of each security is stated in the currency in which the bond is denominated. See below.
|
| DEM = German Mark.
|
| EUR = Euro currency.
|
| GBP = Great Britain Pound.
|
#
|
Variable rate security. Coupon rate disclosed is that which is in effect at October 31, 2000.
|
‡
|
Pay-in-kind securities.
|
*
|
Non-income producing security.
|
V
|
Security currently in default.
|
@
|
Security is issued with a zero coupon. The interest rate disclosed for this security represents effective yield to maturity.
|
| Security ratings are unaudited
|
| The percentage shown for each investment category reflects the value of investments in that category as a percentage of total net
assets.
|
| |
| Investment Abbreviations:
|
| ADR—American Depositary Receipt
|
| |
| Assets: | ||||
| Investment in securities, at value (identified cost $996,286,193) | $ 841,194,802 | |||
| Cash, at value | 121,096 | |||
| Receivables: | ||||
| Investment securities sold, at value | 7,626,486 | |||
| Interest, at value | 23,691,675 | |||
| Fund shares sold | 3,452,185 | |||
| Forward foreign currency exchange contracts, at value | 20,909,932 | |||
| Reimbursement from investment adviser | 116,251 | |||
| Deferred organization expenses, net | 11,246 | |||
| Total assets | 897,123,673 | |||
| Liabilities: | ||||
| Payables: | ||||
| Fund shares repurchased | 9,980,538 | |||
| Investment securities purchased, at value | 7,486,486 | |||
| Income distribution | 2,302,799 | |||
| Amounts owed to affiliates | 760,924 | |||
| Forward foreign currency exchange contracts, at value | 183,265 | |||
| Accrued expenses and other liabilities, at value | 487,629 | |||
| Total liabilities | 21,201,641 | |||
| Net Assets: | ||||
| Paid-in capital | 1,032,911,978 | |||
| Accumulated undistributed net investment income | 1,239,409 | |||
| Accumulated net realized loss on investment and foreign currency related transactions | (22,751,968 | ) | ||
| Net unrealized loss on investments and translation of assets and liabilities denominated in foreign currencies | (135,477,387 | ) | ||
| NET ASSETS | $ 875,922,032 | |||
| Net asset value, offering and redemption price per share: (a) | ||||
| Class A | $8.18 | |||
| Class B | $8.18 | |||
| Class C | $8.17 | |||
| Institutional | $8.19 | |||
| Service | $8.19 | |||
| Shares outstanding: | ||||
| Class A | 50,055,212 | |||
| Class B | 4,533,604 | |||
| Class C | 1,093,136 | |||
| Institutional | 51,345,876 | |||
| Service | 48,425 | |||
| Total shares outstanding, $.001 par value (unlimited number of shares authorized) | 107,076,253 | |||
(a)
|
Maximum public offering price per share (NAV per share multiplied by 1.0471) for Class A shares is $8.57. At redemption, Class B
and Class C shares may be subject to a contingent deferred sales charge, assessed on the amount equal to the lesser of the current net asset value or the original purchase price of the shares.
|
| Investment income: | |||||
| Interest | $90,480,134 | ||||
| Dividends | 317,367 | ||||
| Total income | 90,797,501 | ||||
| Expenses: | |||||
| Management fees | 5,927,364 | ||||
| Distribution and Service fees (a) | 1,722,828 | ||||
| Transfer Agent fees (b) | 1,149,112 | ||||
| Custodian fees | 353,564 | ||||
| Registration fees | 87,782 | ||||
| Professional fees | 48,278 | ||||
| Trustee fees | 7,879 | ||||
| Organization expenses | 6,449 | ||||
| Service share fees | 2,154 | ||||
| Other | 139,050 | ||||
| Total expenses | 9,444,460 | ||||
| Less — expense reductions | (439,778 | ) | |||
| Net expenses | 9,004,682 | ||||
| NET INVESTMENT INCOME | 81,792,819 | ||||
| Realized and unrealized gain (loss) on investment and foreign currency transactions: | |||||
| Net realized gain (loss) from: | |||||
| Investment transactions | (12,315,579 | ) | |||
| Foreign currency related transactions | 3,872,184 | ||||
| Net change in unrealized gain (loss) on: | |||||
| Investments | (91,089,320 | ) | |||
| Translation of assets and liabilities denominated in foreign currencies | 18,572,302 | ||||
| Net realized and unrealized loss on investment and foreign currency transactions: | (80,960,413 | ) | |||
| NET INCREASE IN NET ASSETS RESULTING FROM OPERATIONS | $ 832,406 | ||||
(a)
|
Class A, Class B and Class C had distribution and service fees of $1,226,618, $391,902 and $104,308, respectively.
|
(b)
|
Class A, Class B, Class C, Institutional Class and Service Class had Transfer Agent fees of $932,232, $74,461, $19,818, $122,429
and $172, respectively.
|
| From operations: | ||||
| Net investment income | $ 81,792,819 | |||
| Net realized loss on investment and foreign currency transactions | (8,443,395 | ) | ||
| Net change in unrealized gain (loss) on investments and foreign currency | (72,517,018 | ) | ||
| Net increase in net assets resulting from operations | 832,406 | |||
| Distributions to shareholders: | ||||
| From net investment income | ||||
| Class A shares | (51,619,818 | ) | ||
| Class B shares | (3,819,934 | ) | ||
| Class C shares | (1,022,081 | ) | ||
| Institutional shares | (32,870,243 | ) | ||
| Service shares | (44,000 | ) | ||
| In excess of net investment income | ||||
| Class A shares | (1,135,142 | ) | ||
| Class B shares | (84,002 | ) | ||
| Class C shares | (22,476 | ) | ||
| Institutional shares | (722,831 | ) | ||
| Service shares | (968 | ) | ||
| Total distributions to shareholders | (91,341,495 | ) | ||
| From share transactions: | ||||
| Proceeds from sales of shares | 443,991,118 | |||
| Reinvestment of dividends and distributions | 63,743,194 | |||
| Cost of shares repurchased | (373,740,054 | ) | ||
| Net increase in net assets resulting from share transactions | 133,994,258 | |||
| TOTAL INCREASE | 43,485,169 | |||
| Net assets: | ||||
| Beginning of year | 832,436,863 | |||
| End of year | $875,922,032 | |||
| Accumulated undistributed net investment income | $ 1,239,409 | |||
| From operations: | ||||
| Net investment income | $ 67,379,988 | |||
| Net realized loss on investment and foreign currency transactions | (2,720,050 | ) | ||
| Net change in unrealized loss on investments and futures | (21,099,547 | ) | ||
| Net increase in net assets resulting from operations | 43,560,391 | |||
| Distributions to shareholders: | ||||
| From net investment income | ||||
| Class A shares | (43,632,406 | ) | ||
| Class B shares | (2,990,090 | ) | ||
| Class C shares | (846,589 | ) | ||
| Institutional shares | (17,700,298 | ) | ||
| Service shares | (34,695 | ) | ||
| Total distributions to shareholders | (65,204,078 | ) | ||
| From share transactions: | ||||
| Proceeds from sales of shares | 479,200,997 | |||
| Reinvestment of dividends and distributions | 47,672,946 | |||
| Cost of shares repurchased | (210,201,224 | ) | ||
| Net increase in net assets resulting from share transactions | 316,672,719 | |||
| TOTAL INCREASE | 295,029,032 | |||
| Net assets: | ||||
| Beginning of year | 537,407,831 | |||
| End of year | $832,436,863 | |||
| Accumulated undistributed net investment income | $ 7,583,257 | |||
| 1. ORGANIZATION
|
| Goldman Sachs Trust (the “Trust”) is a Delaware business trust registered under the Investment Company Act of 1940 (as
amended) as an open-end, management investment company. The Trust includes the Goldman Sachs High Yield Fund (the “Fund”). The Fund is a diversified portfolio offering five classes of shares — Class A, Class B, Class C,
Institutional and Service.
|
| The Fund invests primarily in non-investment grade fixed-income securities which
are considered predominantly speculative by traditional investment standards. Non-investment grade fixed-income securities and unrated securities of comparable credit quality (commonly known as “junk bonds”) are subject to the increased risk of
an issuer’s inability to meet principal and interest obligations. These securities, also referred to as high yield securities, may be subject to greater price volatility due to such factors as specific corporate developments, interest rate
sensitivity, generally negative perceptions of the junk bond markets and less secondary market liquidity.
|
| 2. SIGNIFICANT ACCOUNTING POLICIES
|
| The following is a summary of significant accounting policies consistently followed by the Fund. The preparation of financial
statements in conformity with generally accepted accounting principles requires management to make estimates and assumptions that may affect the reported amounts. Actual results could differ from those estimates.
|
| A. Investment Valuation — Portfolio
securities for which accurate market quotations are readily available are valued on the basis of quotations furnished by a pricing service or provided by dealers in such securities. Portfolio securities for which accurate market quotations are not readily
available are valued based on yield equivalents, pricing matrices or other sources, under valuation procedures established by the Trust’s Board of Trustees. Short-term debt obligations maturing in sixty days or less are valued at amortized cost.
|
| B. Security Transactions and Investment Income — Security transactions are recorded as of the trade date. Realized gains and losses on sales of portfolio securities are calculated using the identified cost basis. Interest income is recorded on the basis of interest accrued, net of foreign withholding
taxes where applicable. Market discounts and market premiums on debt securities, other than mortgage backed securities, are amortized to interest income over the life of the security with a corresponding adjustment in the cost basis of that security. Net
investment income (other than class specific expenses), unrealized and realized gains or losses are allocated daily to each class of shares of the Fund based upon the relative proportion of net assets of each class.
|
| In November 2000 the American Institute of Certified Public Accountants (AICPA)
issued a revised version of the AICPA Audit and Accounting Guide for Investment Companies (the “Guide”). The revised version of the Guide is effective November 1, 2001 for the Fund and will require the Fund to amortize/accrete all premiums and
discounts on debt securities. The Fund currently does not amortize/accrete all such premiums and discounts. Upon adoption, the Fund will be required to record the cumulative effect of this change. The cumulative effect will impact net investment income
and realized and unrealized gains and losses but will not impact net assets. At this time, the Fund has not completed their analysis of the impact of this accounting change.
|
| C. Federal Taxes — It is the Fund’s
policy to comply with the requirements of the Internal Revenue Code applicable to regulated investment companies and to distribute each year substantially all of its investment company taxable income and capital gains to its shareholders. Accordingly, no
federal tax provision is required. Income distributions are declared daily and paid monthly. Capital gain distributions, if any, are declared and paid annually.
|
| The characterization of distributions to shareholders for financial reporting
purposes is determined in accordance with income tax rules. Therefore, the source of the portfolio’s distributions may be shown in the accompanying financial
2. SIGNIFICANT ACCOUNTING POLICIES – (continued)
|
| statements as either from or in excess of net investment income or net realized gain on investment transactions, or from paid-in capital,
depending on the type of book/tax differences that may exist.
|
| The Fund, at its most recent tax year-end of October 31, 2000 had approximately
$2,694,305 capital loss carryforwards expiring in 2006 and 2007 for U.S. federal tax purposes. This amount is available to be carried forward to offset future capital gains to the extent permitted by applicable laws or regulations.
|
| At October 31, 2000, the aggregate cost of portfolio securities for federal income
tax purposes is $996,559,597. Accordingly, the gross unrealized gain on investments was $11,879,423 and the gross unrealized loss on investments was $147,630,216 resulting in a net unrealized loss of $135,750,793.
|
| D. Expenses — Expenses incurred by the
Trust that do not specifically relate to an individual Fund of the Trust are allocated to the funds on a straight-line or pro rata basis depending upon the nature of the expense.
|
| Class A, Class B and Class C shareholders of the Fund bear all expenses and fees
relating to their respective Distribution and Service Plans. Shareholders of Service shares bear all expenses and fees paid to service organizations. Each class of shares separately bears its respective class-specific transfer agency fees.
|
| E. Deferred Organization Expenses —
Organization-related costs are amortized on a straight-line basis over a period of five years.
|
| F. Foreign Currency Translations — The
books and records of the Fund are maintained in U.S. dollars. Amounts denominated in foreign currencies are translated into U.S. dollars on the following basis (i) investment valuations, foreign currency and other assets and liabilities initially
expressed in foreign currencies are converted each business day into U.S. dollars based upon current exchange rates; (ii) purchases and sales of foreign investments, income and expenses are converted into U.S. dollars based upon currency exchange rates
prevailing on the respective dates of such transactions.
|
| Net realized and unrealized gain (loss) on foreign currency transactions will
represent: (i) foreign exchange gains and losses from the sale and holdings of foreign currencies and sale of investments; (ii) gains and losses between trade date and settlement date on investment securities transactions and forward exchange contracts;
and (iii) gains and losses from the difference between amounts of dividends, interest and foreign withholding taxes recorded and the amounts actually received.
|
| G. Segregation Transactions — The Fund may
enter into certain derivative transactions to seek to increase total return. Forward foreign currency exchange contracts, futures contracts, written options, mortgage dollar rolls, when-issued securities and forward commitments represent examples of such
transactions. As a result of entering into those transactions, the Fund is required to segregate liquid assets on the accounting records equal to or greater than the market value of the corresponding transactions.
|
| H. Repurchase Agreements — Repurchase
agreements involve the purchase of securities subject to the seller’s agreement to repurchase them at a mutually agreed upon date and price. During the term of a repurchase agreement, the value of the underlying securities, including accrued
interest, is required to equal or exceed the value of the repurchase agreement. The underlying securities for all repurchase agreements are held in safekeeping at the Fund’s custodian.
|
| 3. AGREEMENTS
|
| Pursuant to the Investment Management Agreement (the “Agreement”), Goldman Sachs Asset Management (“GSAM”), a
unit of the Investment Management Division of Goldman, Sachs & Co. (“Goldman Sachs”), serves as the investment adviser to the Fund. Under the Agreement, the adviser, subject to the general supervision of the Trust’s Board of Trustees,
manages the Fund’s portfolio. As compensation for the services rendered pursuant to the Agreement, the assumption of the
3. AGREEMENTS – continued
|
| expenses related thereto and administering the Fund’s business affairs, including providing facilities, the adviser is
entitled to a fee, computed daily and payable monthly, at an annual rate equal to 0.70% of the average daily net assets of the Fund.
|
| The adviser has voluntarily agreed to limit certain “Other Expenses” of
the Fund (excluding Management fees, Distribution and Service fees, Transfer Agent fees, taxes, interest, brokerage, litigation, Service Share fees, indemnification costs and other extraordinary expenses), to the extent that such expenses exceed, on an
annual basis, 0.02% of the average daily net assets of the Fund. For the year ended October 31, 2000, the adviser reimbursed approximately $395,000. In addition, the Fund has entered into certain expense offset arrangements with the custodian resulting in
a reduction of the Fund’s expenses. For the year ended October 31, 2000, custody fee reductions amounted to approximately $45,000.
|
| The Trust, on behalf of the Fund, has adopted Distribution and Service Plans.
Under the Distribution and Service Plans, Goldman Sachs and/or authorized dealers are entitled to a monthly fee from the Fund for distribution and shareholder maintenance services equal, on an annual basis, to 0.25%, 1.00%, and 1.00% of the Fund’s
average daily net assets attributable to Class A, Class B and Class C Shares, respectively.
|
| Goldman Sachs serves as the distributor of shares of the Fund pursuant to a
Distribution Agreement. Goldman Sachs may receive a portion of the Class A sales load and Class B and Class C contingent deferred sales charges and has advised the Fund that it retained approximately $496,000 during the year ended October 31, 2000.
|
| Goldman Sachs also serves as the transfer agent of the Fund for a fee. The fees
charged for such transfer agency services are calculated daily and payable monthly at an annual rate as follows: 0.19% of the average daily net assets for Class A, Class B, and Class C Shares and 0.04% of the average daily net assets for Institutional and
Services Shares.
|
| The Trust, on behalf of the Fund, has adopted a Service Plan. The Plan allows for
Service Shares to compensate service organizations for providing varying levels of account administration and shareholder liaison services to their customers who are beneficial owners of such shares. The Service Plan provides for compensation to the
service organizations in an amount up to 0.50%, on an annualized basis, of the average daily net assets of the Service Shares.
|
| As of October 31, 2000, the amounts owed to affiliates were approximately
$537,000, $132,000 and $92,000 for Management, Distribution and Service, and Transfer Agent fees, respectively.
|
| 4. PORTFOLIO SECURITIES TRANSACTIONS
|
| Cost of purchases and proceeds of sales and maturities of securities (excluding short-term investments) for the year ended October
31, 2000, were $549,217,613 and $439,793,391, respectively.
|
| Forward Foreign Currency Exchange Contracts — The
Fund may enter into forward foreign currency exchange contracts for the purchase or sale of a specific foreign currency at a fixed price on a future date as a hedge or cross-hedge against either specific transactions or portfolio positions. The Fund may
also purchase and sell forward contracts to seek to increase total return. All commitments are “marked-to-market” daily at the applicable translation rates and any resulting unrealized gains or losses are recorded in the Fund’s financial
statements. The Fund records realized gains or losses at the time the forward contract is offset by entry into a closing transaction or extinguished by delivery of the currency. Risks may arise upon entering into these contracts from the potential
inability of counterparties to meet the terms of their contracts and from unanticipated movements in the value of a foreign currency relative to the U.S. dollar.
|
| 4. PORTFOLIO SECURITIES TRANSACTIONS – continued
|
| At October 31, 2000, the Fund had outstanding forward foreign currency exchange
contracts as follows:
|
| Open Foreign Currency
Sale Contracts |
Value on
Settlement Date |
Current Value | Unrealized |
||||||
|---|---|---|---|---|---|---|---|---|---|
| Gain | Loss | ||||||||
| British Pound | |||||||||
| expiring 11/1/2000 | $ 1,476,969 | $ 1,341,500 | $ 135,469 | $ — | |||||
| expiring 11/30/2000 | 5,069,366 | 4,583,867 | 485,499 | — | |||||
| expiring 11/30/2001 | 5,539,040 | 5,313,930 | 225,110 | — | |||||
| expiring 1/30/2002 | 2,269,468 | 2,189,284 | 80,184 | — | |||||
| expiring 4/2/2002 | 17,599,705 | 17,770,040 | — | 170,335 | |||||
| Euro Currency | |||||||||
| expiring 11/1/2000 | 4,686,000 | 3,615,208 | 1,070,792 | — | |||||
| expiring 11/15/2000 | 1,793,545 | 1,397,066 | 396,479 | — | |||||
| expiring 11/29/2000 | 5,962,297 | 4,711,344 | 1,250,953 | — | |||||
| expiring 11/30/2000 | 2,905,922 | 2,268,884 | 637,038 | — | |||||
| expiring 12/1/2000 | 152,492 | 122,855 | 29,637 | — | |||||
| expiring 12/15/2000 | 3,332,239 | 2,681,949 | 650,290 | — | |||||
| expiring 12/29/2000 | 5,395,695 | 4,246,691 | 1,149,004 | — | |||||
| expiring 1/16/2001 | 10,366,413 | 8,042,464 | 2,323,949 | — | |||||
| expiring 2/1/2001 | 7,021,510 | 5,410,295 | 1,611,215 | — | |||||
| expiring 4/2/2001 | 2,007,542 | 1,930,809 | 76,733 | — | |||||
| expiring 4/30/2001 | 5,155,277 | 4,103,343 | 1,051,934 | — | |||||
| expiring 5/1/2001 | 2,804,608 | 2,271,205 | 533,403 | — | |||||
| expiring 5/15/2001 | 15,344,084 | 12,281,038 | 3,063,046 | — | |||||
| expiring 6/1/2001 | 8,834,711 | 7,220,172 | 1,614,539 | — | |||||
| expiring 7/16/2001 | 6,622,286 | 5,568,531 | 1,053,755 | — | |||||
| expiring 11/30/2001 | 17,943,973 | 16,178,779 | 1,765,194 | — | |||||
| expiring 1/30/2002 | 6,677,466 | 6,206,945 | 470,521 | — | |||||
| expiring 4/2/2002 | 7,912,834 | 7,618,851 | 293,983 | — | |||||
| TOTAL OPEN FOREIGN CURRENCY
SALE CONTRACTS |
$146,873,442 | $127,075,050 | $19,968,727 | $170,335 | |||||
| Closed but Unsettled
Forward Currency Contracts |
Purchase
Value |
Sale Value | Realized |
||||||
| Gain | Loss | ||||||||
| British Pound | |||||||||
| expiring 11/1/2000 | $ 1,447,480 | $ 1,460,185 | $ 12,705 | $ — | |||||
| Euro Currency | |||||||||
| expiring 11/1/2000 | 910,213 | 1,185,132 | 274,919 | — | |||||
| expiring 12/15/2000 | 1,976,304 | 1,995,880 | 19,576 | — | |||||
| expiring 2/1/2001 | 5,236,537 | 5,851,699 | 615,162 | — | |||||
| expiring 2/1/2001 | 873,904 | 860,974 | — | 12,930 | |||||
| expiring 6/1/2001 | 1,312,845 | 1,331,688 | 18,843 | — | |||||
| TOTAL CLOSED BUT UNSETTLED
FORWARD CURRENCY CONTRACTS |
$ 11,757,283 | $ 12,685,558 | $ 941,205 | $ 12,930 | |||||
| 4. PORTFOLIO SECURITIES TRANSACTIONS – continued
|
| The contractual amounts of forward foreign currency exchange contracts do not
necessarily represent the amounts potentially subject to risk. The measurement of the risks associated with these instruments is meaningful only when all related and offsetting transactions are considered. At October 31, 2000, the Fund had sufficient cash
and/or securities to cover any commitments under these contracts.
|
| Futures Contracts — The Fund may enter into futures
transactions to hedge against changes in interest rates, securities prices, currency exchange rates or to seek to increase total return. Upon entering into a futures contract, the Fund is required to deposit with a broker an amount of cash or securities
equal to the minimum “initial margin” requirement of the associated futures exchange. Subsequent payments for futures contracts (“variation margin”) are paid or received by the Fund daily, dependent on the daily fluctuations in the
value of the contracts, and are recorded for financial reporting purposes as unrealized gains or losses. When contracts are closed, the Fund realizes a gain or loss which is reported in the Statement of Operations.
|
| The use of futures contracts involves, to varying degrees, elements of market and
counterparty risk which may exceed the amounts recognized in the Statement of Assets and Liabilities. Changes in the value of the futures contract may not directly correlate with changes in the value of the underlying securities. This risk may decrease
the effectiveness of the Fund’s strategies and potentially result in a loss. At October 31, 2000, the Fund had no open futures contracts.
|
| 5. LINE OF CREDIT FACILITY
|
| Effective May 31, 2000, the Fund participates in a $350,000,000 committed, unsecured revolving line of credit facility. Prior
thereto, the Fund participated in a $250,000,000 uncommitted and a $250,000,000 committed, unsecured revolving line of credit facility. Under the most restrictive arrangement, the Fund must own securities having a market value in excess of 400% of the
total bank borrowings. These facilities are to be used solely for temporary or emergency purposes. The interest rate on borrowings is based on the Federal Funds rate. The committed facilities also require a fee to be paid by the Fund based on the amount
of the commitment. During the year ended October 31, 2000, the Fund did not have any borrowings under any of these facilities.
|
| 6. JOINT REPURCHASE AGREEMENT ACCOUNT
|
| The Fund, together with other registered investment companies having management agreements with GSAM or its affiliates, transfers
uninvested cash into joint accounts, the daily aggregate balance of which is invested in one or more repurchase agreements.
|
| At October 31, 2000, the Fund had an undivided interest in the repurchase
agreement in the joint account which equaled $23,800,000 in principal amount. At October 31, 2000, the following repurchase agreements held in this joint account were fully collateralized by Federal Agency obligations:
|
| Repurchase Agreements | Principal
Amounts |
Interest
Rate |
Maturity
Date |
Amortized
Cost |
Maturity
Value |
|||||||
|---|---|---|---|---|---|---|---|---|---|---|---|---|
| ABN / AMRO, Inc. | $400,000,000 | 6.63 | % | 11/01/2000 | $ 400,000,000 | $ 400,073,611 | ||||||
| ABN / AMRO, Inc. | 150,000,000 | 6.56 | 11/01/2000 | 150,000,000 | 150,027,333 | |||||||
| Banc of America Securities LLC | 900,000,000 | 6.62 | 11/01/2000 | 900,000,000 | 900,165,500 | |||||||
| Barclays Capital, Inc. | 200,000,000 | 6.62 | 11/01/2000 | 200,000,000 | 200,036,778 | |||||||
| Bear Stearns Companies, Inc. | 500,000,000 | 6.62 | 11/01/2000 | 500,000,000 | 500,091,944 | |||||||
| Chase Securities, Inc. | 300,000,000 | 6.62 | 11/01/2000 | 300,000,000 | 300,055,167 | |||||||
| Salomon Smith Barney Holdings, Inc. | 809,100,000 | 6.62 | 11/01/2000 | 809,100,000 | 809,248,785 | |||||||
| SG Cowen Securities | 100,000,000 | 6.62 | 11/01/2000 | 100,000,000 | 100,018,389 | |||||||
| TOTAL JOINT REPURCHASE AGREEMENT ACCOUNT | $3,359,100,000 | $3,359,717,507 | ||||||||||
| 7. CERTAIN RECLASSIFICATIONS
|
| In accordance with Statement of Position 93-2, the Fund has reclassified $3,198,779 and $6,049 from accumulated net realized loss
on investment and foreign currency related transactions and paid-in capital, respectively, to accumulated undistributed net investment income. These reclassifications have no impact on the net asset value of the Fund and are designed to present the
Fund’s capital accounts on a tax basis. Reclassifications result primarily from the difference in the tax treatment of net operating losses.
|
| 8. CHANGE IN INDEPENDENT AUDITOR
|
| On October 26, 1999, the Board of Trustees of the Fund, upon the recommendation of the Board’s audit committee, determined
not to retain Arthur Andersen LLP and approved a change of the Fund’s independent auditors to Ernst & Young LLP. For the fiscal year ended October 31, 1999, Arthur Andersen LLP’s audit report contained no adverse opinion or disclaimer of
opinion; nor was their report qualified or modified as to uncertainty, audit scope, or accounting principles. Further, there were no disagreements between the Fund and Arthur Andersen LLP on accounting principles or practices, financial statement
disclosure or audit scope or procedure, which if not resolved to the satisfaction of Arthur Andersen LLP would have caused them to make reference to the disagreement in their report.
|
| 9. SUMMARY OF SHARE TRANSACTIONS
|
| Share activity is as follows:
|
| For the Year Ended October 31, 2000 |
|||||||
|---|---|---|---|---|---|---|---|
| Shares | Dollars | ||||||
| Class A Shares | |||||||
| Shares sold | 19,056,447 | $169,054,727 | |||||
| Reinvestment of dividends and distributions | 4,542,703 | 40,044,057 | |||||
| Shares repurchased | (31,366,746 | ) | (276,325,256 | ) | |||
| (7,767,596 | ) | (67,226,472 | ) | ||||
| Class B Shares | |||||||
| Shares sold | 1,241,333 | 10,926,770 | |||||
| Reinvestment of dividends and distributions | 222,778 | 1,995,647 | |||||
| Shares repurchased | (1,331,046 | ) | (11,730,966 | ) | |||
| 133,065 | 1,191,451 | ||||||
| Class C Shares | |||||||
| Shares sold | 660,391 | 5,863,650 | |||||
| Reinvestment of dividends and distributions | 68,188 | 601,201 | |||||
| Shares repurchased | (746,805 | ) | (6,585,241 | ) | |||
| (18,226 | ) | (120,390 | ) | ||||
| Institutional Shares | |||||||
| Shares sold | 29,546,300 | 257,772,971 | |||||
| Reinvestment of dividends and distributions | 2,414,141 | 21,102,221 | |||||
| Shares repurchased | (8,969,936 | ) | (78,885,981 | ) | |||
| 22,990,505 | 199,989,211 | ||||||
| Service Shares | |||||||
| Shares sold | 41,484 | 373,000 | |||||
| Reinvestment of dividends and distributions | 7 | 68 | |||||
| Shares repurchased | (23,927 | ) | (212,610 | ) | |||
| 17,564 | 160,458 | ||||||
| NET INCREASE | 15,355,312 | $133,994,258 | |||||
| For the Year Ended October 31, 1999 |
|||||||
|---|---|---|---|---|---|---|---|
| Shares | Dollars | ||||||
| Class A Shares | |||||||
| Shares sold | 25,318,440 | $241,274,515 | |||||
| Reinvestment of dividends and distributions | 3,487,785 | 33,178,138 | |||||
| Shares repurchased | (14,816,674 | ) | (141,291,530 | ) | |||
| 13,989,551 | 133,161,123 | ||||||
| Class B Shares | |||||||
| Shares sold | 2,175,067 | 20,848,416 | |||||
| Reinvestment of dividends and distributions | 176,076 | 1,642,893 | |||||
| Shares repurchased | (1,143,028 | ) | (10,841,667 | ) | |||
| 1,208,115 | 11,649,642 | ||||||
| Class C Shares | |||||||
| Shares sold | 1,321,781 | 12,726,945 | |||||
| Reinvestment of dividends and distributions | 54,662 | 520,094 | |||||
| Shares repurchased | (1,196,698 | ) | (11,389,250 | ) | |||
| 179,745 | 1,857,789 | ||||||
| Institutional Shares | |||||||
| Shares sold | 21,248,263 | 204,157,121 | |||||
| Reinvestment of dividends and distributions | 1,299,004 | 12,317,045 | |||||
| Shares repurchased | (4,829,091 | ) | (46,289,669 | ) | |||
| 17,718,176 | 170,184,497 | ||||||
| Service Shares | |||||||
| Shares sold | 20,193 | 194,000 | |||||
| Reinvestment of dividends and distributions | 1,518 | 14,776 | |||||
| Shares repurchased | (39,586 | ) | (389,108 | ) | |||
| (17,875 | ) | (180,332 | ) | ||||
| NET INCREASE | 33,077,712 | $316,672,719 | |||||
| Income (loss) from
investment operations |
Distributions to shareholders |
||||||||||||||||||||
|---|---|---|---|---|---|---|---|---|---|---|---|---|---|---|---|---|---|---|---|---|---|
|
Net asset value, beginning of period |
Net
investment income |
Net realized
and unrealized gain (loss) |
Total
income (loss) from investment operations |
From
net investment income |
In excess
of net investment income |
Total
Distributions |
|||||||||||||||
| FOR THE YEARS ENDED OCTOBER 31, | |||||||||||||||||||||
| 2000 - Class A Shares | $ 9.07 | $0.84 | (c) | $(0.78 | ) | $ 0.06 | $(0.93 | ) | $(0.02 | ) | $(0.95 | ) | |||||||||
| 2000 - Class B Shares | 9.08 | 0.78 | (c) | (0.80 | ) | (0.02 | ) | (0.86 | ) | (0.02 | ) | (0.88 | ) | ||||||||
| 2000 - Class C Shares | 9.07 | 0.78 | (c) | (0.80 | ) | (0.02 | ) | (0.86 | ) | (0.02 | ) | (0.88 | ) | ||||||||
| 2000 - Institutional Shares | 9.08 | 0.88 | (c) | (0.79 | ) | 0.09 | (0.96 | ) | (0.02 | ) | (0.98 | ) | |||||||||
| 2000 - Service Shares | 9.08 | 0.83 | (c) | (0.78 | ) | 0.05 | (0.92 | ) | (0.02 | ) | (0.94 | ) | |||||||||
| 1999 - Class A Shares | 9.16 | 0.85 | (0.10 | ) | 0.75 | (0.84 | ) | — | (0.84 | ) | |||||||||||
| 1999 - Class B Shares | 9.16 | 0.77 | (0.09 | ) | 0.68 | (0.76 | ) | — | (0.76 | ) | |||||||||||
| 1999 - Class C Shares | 9.16 | 0.78 | (0.11 | ) | 0.67 | (0.76 | ) | — | (0.76 | ) | |||||||||||
| 1999 - Institutional Shares | 9.17 | 0.90 | (c) | (0.12 | ) | 0.78 | (0.87 | ) | — | (0.87 | ) | ||||||||||
| 1999 - Service Shares | 9.17 | 0.86 | (c) | (0.12 | ) | 0.74 | (0.83 | ) | — | (0.83 | ) | ||||||||||
| 1998 - Class A Shares | 9.97 | 0.82 | (0.85 | ) | (0.03 | ) | (0.78 | ) | — | (0.78 | ) | ||||||||||
| 1998 - Class B Shares | 9.97 | 0.75 | (0.86 | ) | (0.11 | ) | (0.70 | ) | — | (0.70 | ) | ||||||||||
| 1998 - Class C Shares | 9.97 | 0.75 | (0.86 | ) | (0.11 | ) | (0.70 | ) | — | (0.70 | ) | ||||||||||
| 1998 - Institutional Shares | 9.97 | 0.84 | (0.83 | ) | 0.01 | (0.81 | ) | — | (0.81 | ) | |||||||||||
| 1998 - Service Shares | 9.97 | 0.80 | (0.84 | ) | (0.04 | ) | (0.76 | ) | — | (0.76 | ) | ||||||||||
| FOR THE PERIOD ENDED OCTOBER 31, | |||||||||||||||||||||
| 1997 - Class A Shares (commenced August 1) | 10.00 | 0.17 | (0.02 | ) | 0.15 | (0.17 | ) | (0.01 | ) | (0.18 | ) | ||||||||||
| 1997 - Class B Shares (commenced August 1) | 10.00 | 0.15 | (0.02 | ) | 0.13 | (0.15 | ) | (0.01 | ) | (0.16 | ) | ||||||||||
| 1997 - Class C Shares (commenced August 15) | 9.97 | 0.14 | 0.01 | 0.15 | (0.14 | ) | (0.01 | ) | (0.15 | ) | |||||||||||
| 1997 - Institutional Shares (commenced August 1) | 10.00 | 0.18 | (0.02 | ) | 0.16 | (0.18 | ) | (0.01 | ) | (0.19 | ) | ||||||||||
| 1997 - Service Shares (commenced August 1) | 10.00 | 0.17 | (0.02 | ) | 0.15 | (0.17 | ) | (0.01 | ) | (0.18 | ) | ||||||||||
(a)
|
Assumes investment at the net asset value at the beginning of the period, reinvestment of all distributions, a complete redemption
of the investment at the net asset value at the end of period and no sales charge. Total return would be reduced if a sales or redemption charge was taken into account. Total returns for less than one full year are not annualized.
|
(b)
|
Annualized.
|
(c)
|
Calculated based on the average shares outstanding methodology.
|
| Ratios assuming
no expense reductions |
|||||||||||||||||||||
|---|---|---|---|---|---|---|---|---|---|---|---|---|---|---|---|---|---|---|---|---|---|
| Net asset
value, end of period |
Total
return (a) |
Net assets
at end of period (in 000s) |
Ratio of
net expenses to average net assets |
Ratio of
net investment income to average net assets |
Ratio of
expenses to average net assets |
Ratio of
net investment income to average net assets |
Portfolio
turnover rate |
||||||||||||||
| $8.18 | 0.38 | % | $409,224 | 1.16 | % | 9.54 | % | 1.21 | % | 9.49 | % | 55.27 | % | ||||||||
| 8.18 | (0.48 | ) | 37,085 | 1.91 | 8.79 | 1.96 | 8.74 | 55.27 | |||||||||||||
| 8.17 | (0.48 | ) | 8,933 | 1.91 | 8.78 | 1.96 | 8.73 | 55.27 | |||||||||||||
| 8.19 | 0.77 | 420,284 | 0.76 | 9.99 | 0.81 | 9.94 | 55.27 | ||||||||||||||
| 8.19 | 0.15 | 396 | 1.26 | 9.39 | 1.31 | 9.34 | 55.27 | ||||||||||||||
| 9.07 | 8.06 | 524,674 | 1.16 | 9.06 | 1.22 | 9.00 | 59.04 | ||||||||||||||
| 9.08 | 7.38 | 39,907 | 1.91 | 8.30 | 1.97 | 8.24 | 59.04 | ||||||||||||||
| 9.07 | 7.26 | 10,078 | 1.91 | 8.26 | 1.97 | 8.20 | 59.04 | ||||||||||||||
| 9.08 | 8.49 | 257,498 | 0.76 | 9.50 | 0.82 | 9.44 | 59.04 | ||||||||||||||
| 9.08 | 7.95 | 280 | 1.26 | 8.92 | 1.32 | 8.86 | 59.04 | ||||||||||||||
| 9.16 | (0.70 | ) | 401,626 | 1.09 | 8.25 | 1.36 | 7.98 | 113.44 | |||||||||||||
| 9.16 | (1.43 | ) | 29,256 | 1.84 | 7.61 | 1.88 | 7.57 | 113.44 | |||||||||||||
| 9.16 | (1.43 | ) | 8,532 | 1.84 | 7.61 | 1.88 | 7.57 | 113.44 | |||||||||||||
| 9.17 | (0.32 | ) | 97,547 | 0.84 | 9.47 | 0.88 | 9.43 | 113.44 | |||||||||||||
| 9.17 | (0.79 | ) | 447 | 1.34 | 9.17 | 1.38 | 9.13 | 113.44 | |||||||||||||
| 9.97 | 1.50 | 325,911 | 0.95 | (b) | 7.06 | (b) | 1.57 | (b) | 6.44 | (b) | 44.80 | ||||||||||
| 9.97 | 1.31 | 10,308 | 1.70 | (b) | 6.28 | (b) | 2.07 | (b) | 5.91 | (b) | 44.80 | ||||||||||
| 9.97 | 1.46 | 1,791 | 1.70 | (b) | 6.17 | (b) | 2.07 | (b) | 5.80 | (b) | 44.80 | ||||||||||
| 9.97 | 1.58 | 2 | 0.70 | (b) | 7.16 | (b) | 1.07 | (b) | 6.79 | (b) | 44.80 | ||||||||||
| 9.97 | 1.46 | 2 | 1.20 | (b) | 6.69 | (b) | 1.57 | (b) | 6.32 | (b) | 44.80 | ||||||||||
| To the Shareholders and Board of Trustees
|
| Goldman Sachs Trust
|
| We have audited the accompanying statement of assets and liabilities of Goldman Sachs High Yield Fund (one of the funds comprising
the Goldman Sachs Trust) (the “Fund”), including the statement of investments, as of October 31, 2000, and the related statement of operations, the statement of changes in net assets and the financial highlights for the year then ended. These
financial statements and financial highlights are the responsibility of the Fund’s management. Our responsibility is to express an opinion on these financial statements and financial highlights based on our audit. The statement of changes in net
assets for the year ended October 31, 1999 and the financial highlights for each of the three periods in the period then ended, were audited by other auditors whose report, dated December 10, 1999, expressed an unqualified opinion on the statement and
financial highlights.
|
| We conducted our audit in accordance with auditing standards generally accepted in the United States. Those standards require that
we plan and perform the audit to obtain reasonable assurance about whether the financial statements and financial highlights are free of material misstatement. An audit includes examining, on a test basis, evidence supporting the amounts and disclosures
in the financial statements and financial highlights. Our procedures included confirmation of securities owned as of October 31, 2000 by correspondence with the custodian and brokers. An audit also includes assessing the accounting principles used and
significant estimates made by management, as well as evaluating the overall financial statement presentation. We believe that our audit provides a reasonable basis for our opinion.
|
| In our opinion, the financial statements and financial highlights, audited by us, referred to above present fairly, in all
material respects, the financial position of the Goldman Sachs High Yield Fund as of October 31, 2000, the results of its operations, the changes in its net assets, and the financial highlights for the year ended October 31, 2000 in conformity with
accounting principles generally accepted in the United States.
|

| New York, New York
|
| December 11, 2000
|
GOLDMAN SACHS FUND PROFILE
Goldman Sachs High Yield Fund
The Goldman Sachs High Yield Fund offers investors access to a potentially attractive risk/reward profile. The Fund seeks a high level of current income and, secondarily, capital appreciation, primarily through fixed income securities rated, at the time of investment, below investment grade.
Target Your Needs
The Goldman Sachs High Yield Fund has a distinct investment objective and a defined place on the risk/return spectrum . As your investment objectives change, you can exchange shares within Goldman Sachs Funds without any additional charge.* Please note: in general, greater returns are associated with greater risk.
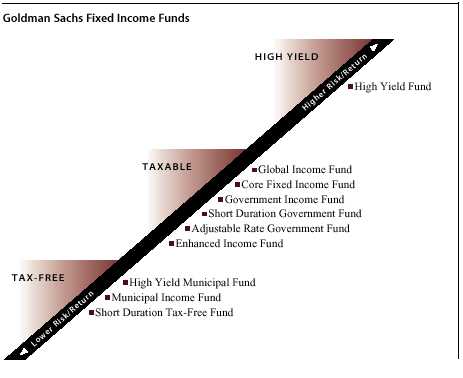
For More Information
To learn more about the Goldman Sachs High Yield Fund and other Goldman Sachs Funds, call your investment professional today.
* The exchange privilege is subject to termination and its terms are subject to change.

|
|