|
|
|
|
|
|
|
|
|

GOLDMAN SACHS TAX - FREE FUNDS
Market Overview
Dear Shareholder,
During the period under review, U.S. bond markets generally posted solid returns, particularly in comparison with some sectors of the equity market.
Market Review
The U.S. bond market also continued to be affected by the U.S. Treasury Department’s repurchase of long maturity debt. The reduction in supply is aimed at reducing the average maturity and interest cost of Treasury debt. This led to a sharp increase in demand for 30-year bonds throughout the period, resulting in strong performance for longer maturity issues and an inverted yield curve.
Outlook
Given recent supportive data, we continue to believe that the U.S. is headed for a “soft landing” following a period of benign inflation. However, given strong consumer confidence, low unemployment, and continued pockets of solid economic growth, a soft landing is not assured. Conversely, in the short term, ongoing equity volatility coupled with recent negative earnings news could lead to continued credit spread widening and investor flight to the “ safe haven” of U.S. Treasuries.
As always, we appreciate your support and we look forward to serving your investment needs in the years to come.
Sincerely,
 |
 |
 |
||
| David B. Ford | David W. Blood | Sharmin Mossavar-Rahmani | ||
| Co-Head, Goldman Sachs | Co-Head, Goldman Sachs | CIO, Fixed Income Investments, | ||
| Asset Management | Asset Management | Goldman Sachs Asset Management | ||
| November 9, 2000 |
GOLDMAN SACHS TAX - FREE FUNDS
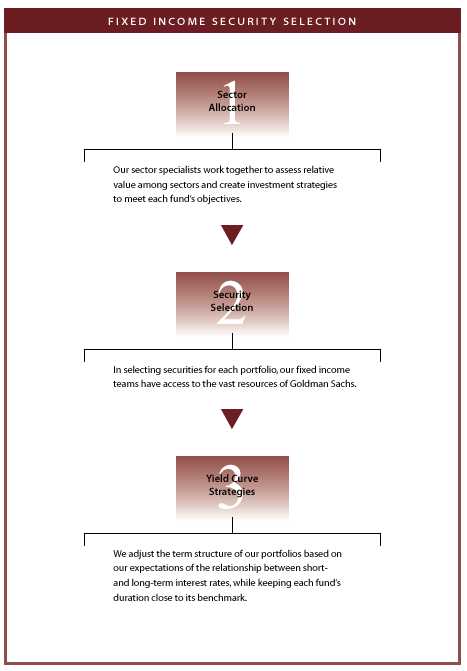
Fixed Income Investment Process
With our fixed income portfolios, we seek strong, consistent performance. We actively manage our funds within a research-intensive, risk-managed framework instead of attempting to anticipate interest rate movements.
1
FUND BASICS
Short Duration Tax-Free Fund
as of October 31, 2000
| PERFORMANCE REVIEW | ||||||||
| October 31, 1999– | Fund Total Return
|
30-Day Taxable
|
30-Day
|
Lehman 3-Year
|
||||
| October 31, 2000 | (based on NAV)1
|
Equivalent Yield2
|
Standardized Yield3
|
Muni Bond Index4
|
||||
| |
||||||||
| Class A | 3.93 | % | 7.07 | % | 4.27 | % | 4.93 | % |
| Class B | 3.31 | % | 6.21 | % | 3.75 | % | 4.93 | % |
| Class C | 3.15 | % | 5.98 | % | 3.61 | % | 4.93 | % |
| Institutional | 4.34 | % | 7.86 | % | 4.75 | % | 4.93 | % |
| Service | 3.72 | % | 7.04 | % | 4.25 | % | 4.93 | % |
| |
||||||||
| 1
The net asset value represents the net assets of the Fund (ex-dividend) divided by the total number of net shares outstanding. The Fund’s performance reflects the reinvestment of
dividends and other distributions.
|
||||||||
| 2
The Taxable Equivalent Yield of the Fund is calculated by dividing the current 30-day Standardized Yield by 1 minus the highest 1999 federal income
tax rate of 39.6%.
|
||||||||
| 3
The 30-Day Standardized Yield of the Fund is calculated by dividing the net investment income
per share (as defined by securities industry regulations) earned by the Fund over a 30-day period (ending on the stated month-end date) by
the maximum public offering price per share of the Fund on the last day of the period. This number
is compounded semiannually and then annualized. This yield does not necessarily reflect income actually earned and
distributed by the Fund and, therefore, may not be correlated with the dividends or other distributions paid to shareholders.
|
||||||||
| 4 The Lehman Brothers 3-Year Municipal Bond Index does not reflect any fees or expenses. Investors cannot invest directly in the Index. | ||||||||
| STANDARDIZED TOTAL RETURNS5 | ||||||||||
| For the period ending 9/30/00 | Class A | Class B | Class C | Institutional | Service | |||||
| |
||||||||||
| One Year | 1.25 | % | 0.51 | % | 1.38 | % | 3.58 | % | 3.07 | % |
| Five Years | N/A
|
N/A
|
N/A
|
4.14 | % | 3.58 | % | |||
| Since Inception | 3.15 | % | 3.10 | % | 2.60 | % | 4.13 | % | 3.79 | % |
| (5/1/97 | ) | (5/1/97 | ) | (8/15/97 | ) | (10/1/92 | ) | (9/20/94 | ) | |
| |
||||||||||
| 5 The Standardized Total Returns are average annual returns as of the most recent calendar quarte r-end. They assume reinvestment of all distributions at net asset value. These returns reflect a maximum initial sales charge of 2% for Class A shares, the assumed deferred sales charge for Class B shares (2% maximum declining to 0% after three years) and the assumed deferred sales charge for Class C shares (1% if redeemed within 12 months of purchase). Because Institutional and Service shares do not involve sales charges, such charges have not been applied to their Standardized Total Returns. | ||||||||||
| PORTFOLIO COMPOSITION AS OF 10/31/006 | ||||||||||
| Sector Allocation | Credit Allocation | |||||||||
| |
||||||||||
| Revenue Bonds | 41.0 | % | AAA | 37.0 | % | |||||
| General Obligations | 26.0 | % | AA | 27.0 | % | |||||
| Pre-refunded | 19.0 | % | A | 23.0 | % | |||||
| Insured Revenue Bonds | 14.0 | % | BBB | 13.0 | % | |||||
| |
||||||||||
| 6
The Fund is actively managed and, as such, its composition may differ over time. Figures represent a percentage of total portfolio investments that have settled and
include an offset to cash equivalents relating to all unsettled trades and, therefore,
may not sum to 100%.
Total return figures represent past performance and do not indicate future results, which will vary. The investment return and principal value of an investment will fluctuate and, therefore, an investor’s shares, when redeemed, may be worth more or less than their original cost. Performance reflects fee waivers and expense limitations in effect. In their absence, performance would be reduced. |
||||||||||
2
PERFORMANCE OVERVIEW
Short Duration Tax-Free Fund
Dear Shareholder,
We are pleased to report on the performance of the Goldman Sachs Short Duration Tax-Free Fund for the one-year period that ended October 31, 2000.
Performance Review
Over the one-year period that ended October 31, 2000, the Fund’s A, B, C, Institutional and Service share classes generated total cumulative returns, at net asset value, of 3.93%, 3.31%, 3.15%, 4.34% and 3.72%, respectively. Over the same time period, the Fund’s benchmark, the Lehman Brothers Three-Year Municipal Bond Index, generated a cumulative total return of 4.93%.
Municipal Market Performance
Early in the reporting period, overall municipal demand was relativelysubdued, as many investors continued to focus on the equity markets. Fortunately, municipal issuance for all of 1999 and the first quarter of 2000 was down significantly. This was largely a result of lower refunding volume which, in turn, reflected higher interest rates.In addition, credit spreads widened to five-year highs during the latter par t of 1999 and into 2000.
The fixed income markets were volatile during the second quarter — first experiencing a significant rally, then a steady decline, and finally another rally. The municipal market participated in the upswings, with the high-grade portion of the market outperforming its high yield counterparts. The reporting period ended on a strong note, as the municipal market posted very strong returns in July and August, remained fairly stable in September and generated solid results in October.
Throughout the period, supply and demand factors were the driving forces behind the municipal market. New issue volume is down approximately 20% year-to-date versus 1999. At the same time, overall demand has been mixed, as individual investor demand has been exceptionally strong in the 1-10 year range, property and casualty insurance companies have been net sellers in the 15-20 year range, and mutual funds, which dominate the 20-30 year part of the yield curve, have been net sellers most of the year. This segmented demand has created pockets of value across the curve.
Portfolio Composition
During the past year, we increased the Fund’s allocation to both uninsured revenue and general obligation bonds, while decreasing exposure to pre-refunded and insured bonds. In addition, although the overall portfolio credit quality remained in the AA range, we increased our BBB exposure in a n attempt to take advantage of the attractive credit spreads described above. The Fund’s exposure to “cushion bonds” (high coupon securities that are priced to a short call date) was reduced, as they have not performed well during periods of reduced liquidity. We have refocused the Fund’s investments on bond structures, which are likely to have lower
3
PERFORMANCE OVERVIEW
The Goldman Sachs Short Duration Tax-Free Fund seeks current income, consistent with low volatility of principal, that is exempt from regular federal income tax, primarily through investments in municipal securities.
price sensitivity in volatile interest rate environments and higher liquidity. We will also continue to seek opportunities to generate additional yield, when prudent from a research and credit perspective. As we trade bonds from the Fund, we continue to execute in a very tax-efficient manner — harvesting losses when available and avoiding unnecessary capital gains.
Portfolio Highlights
During the reporting period we were able to increase the Fund’s dividends by focusing on well-structured bonds with high yields. As mentioned above, we have worked to decrease the Fund’s volatility during times of fluctuating interest rates, while focusing on bonds that are likely to be highly desirable to individual investors.
Portfolio Outlook
The reporting period ended on a positive note, as credit spreads narrowed and the municipal market, overall, showed signs of strength. Provided these trends continue, we remain cautiously optimistic on the outlook for the municipal market. It is also important to note that the supply and demand makeup for municipal bonds has resulted in significant changes in the municipal market. We believe that these trends are likely to continue into the foreseeable future. As a result, we expect to maintain our focus on bonds that will outperform during periods of high interest rate volatility. Finally, we will look for “value” opportunities in the municipal market, and adjust the Fund’s portfolio as needed.
We thank you for your investment and look forward to your continued confidence.
Goldman Sachs U.S. Fixed Income — Municipal Investment Management Team
November 9, 2000
4
FUND BASICS
Municipal Income Fund
as of October 31, 2000
| PERFORMANCE REVIEW | ||||||||||
| October 31, 1999– | Fund Total Return
|
30-Day Taxable
|
30-Day
|
Lehman 15-Year
|
Lehman Municipal
|
|||||
| October 31, 2000 | (based on NAV)1
|
Equivalent Yield2
|
|
Standardized Yield3
|
Muni Bond Index4
|
Bond Index5
|
||||
| |
||||||||||
| Class A | 7.87%
|
7.14%
|
4.31%
|
10.07%
|
8.51%
|
|||||
| Class B | 7.07%
|
6.24%
|
3.77%
|
10.07%
|
8.51%
|
|||||
| Class C | 7.07%
|
6.24%
|
3.77%
|
10.07%
|
8.51%
|
|||||
| Institutional | 8.30%
|
8.15%
|
4.92%
|
10.07%
|
8.51%
|
|||||
| Service | 7.98%
|
N/A
|
N/A
|
10.07%
|
8.51%
|
|||||
| |
||||||||||
| 1
The net asset value represents the net assets of the Fund (ex-dividend) divided by the total number of net shares outstanding. The Fund's performance reflects the reinvestment of dividends and other distributions.
|
||||||||||
| 2
The Taxable Equivalent Yield of the Fund is calculated by dividing the current 30-day Standardized Yield by 1 minus the highest 1999 federal income tax rate of 39.6%.
|
||||||||||
| 3
The 30-Day Standardized Yield of the Fund is calculated by dividing the net investment income per share (as defined by securities industry regulations) earned by the Fund over a 30-day period (ending on the stated month-end
date) by the maximum public offering price per share of the Fund on the last day of the period. This number is compounded semiannually and then annualized. This yield does not necessarily reflect income actually earned and distributed by the Fund and,
therefore, may not be correlated with the dividends or other distributions paid to shareholders.
|
||||||||||
| 4
The Lehman Brothers 15-Year Municipal Bond Index is a total return performance benchmark for the 15-year maturity, investment-grade tax-exempt bond market. Returns and attributes for the Index are calculated semi-monthly using
approximately 5,000 municipal bonds,which are priced by Muller Data Corporation. Please note that the benchmark return reflects performance data from the Fund's first full month of operation (8/1/93), which does not directly correlate with the Fund's
performance since its inception. The Index figures do not reflect any fees or expenses. Investors cannot invest directly in the Index.
|
||||||||||
| 5 The Lehman Brothers Municipal Bond Index is unmanaged and does not reflect any fees or expenses. Investors cannot invest directly in the Index. | ||||||||||
| STANDARDIZED TOTAL RETURNS6 | |||||||
| For the period ending 9/30/00 | Class A
|
Class B
|
Class C
|
Institutional
|
Service
|
||
| |
|||||||
| One Year | 0.24%
|
–0.99%
|
3.16%
|
5.39%
|
5.01%
|
||
| Five Years | 4.31%
|
N/A
|
N/A
|
N/A
|
5.25%7
|
||
| Since Inception | 4.33%
|
4.07%
|
2.93%
|
4.06%
|
4.98%7
|
||
| (7/20/93)
|
(5/1/96)
|
(8/15/97)
|
(8/15/97)
|
(7/20/93)
|
|||
| |
|||||||
| 6
The Standardized Total Returns are average annual returns as of the most recent calendar quarter-end. They assume reinvestment of all distributions at net asset value. These returns reflect a maximum initial sales charge of 4.5%
for Class A shares, the assumed deferred sales charge for Class B shares (5% maximum declining to 0% after six years), and the assumed deferred sales charge for Class C shares (1% if redeemed within 12 months of purchase). Because Institutional and
Service shares do not involve sales charges, such charges have not been applied to their Standardized Total Returns.
|
|||||||
| 7 Performance data for Service shares prior to 8/15/97 (commencement of operations) is that of Class A shares (excluding the impact of front-end sales charges applicable to Class A shares since Service shares are not subject to any sales charges). Performance of Class A shares in the Fund reflects the expenses applicable to the Fund's Class A shares. The fees applicable to Service shares are different from those applicable to Class A shares which impact performance ratings and rankings for a class of shares. | |||||||
| PORTFOLIOCOMPOSITION AS OF 10/31/008 | |||||||
| Sector Allocation | Credit Allocation | ||||||
| |
|||||||
| Revenue Bonds | 34.0 | % | AAA | 54.0 | % | ||
| Insured Revenue Bonds | 31.0 | % | AA | 17.0 | % | ||
| General Obligations | 14.0 | % | A | 15.0 | % | ||
| Insured General Obligations | 9.0 | % | BBB | 14.0 | % | ||
| Variable Rate Demand Note | 8.0 | % | |||||
| Pre-Refunded | 4.0 | % | |||||
| |
|||||||
| 8
The Fund is actively managed and, as such, its composition may differ over time. Figures represent a percentage of total portfolio investments that
have settled and include an offset to cash equivalents relating to all unsettled trades and, therefore, may not sum to 100%.
Total return figures represent past performance and do not indicate future results, which will vary. The investment return and principal value of an investment will fluctuate and, therefore, an investor’s shares, when redeemed, may be worth more or less than their original cost. Performance reflects fee waivers and expense limitations in effect. In their absence, performance would be reduced. |
|||||||
5
PERFORMANCE OVERVIEW
Municipal Income Fund
Dear Shareholder,
We are pleased to report on the performance of the Goldman Sachs Municipal Income Fund for the one-year period that ended October 31, 2000.
Performance Review
Over the one-year reporting period that ended October 31, 2000, the Fund’s A, B, C, Institutional and Service share classes generated cumulative total returns, at net asset value, of 7.87%, 7.07%, 7.07%, 8.30% and 7.98%, respectively. These returns compared to the 8.51% return generated by the Fund’s benchmark, the Lehman Brothers Aggregate Municipal Bond Index.
Municipal Market Performance
Early in the reporting period, overall municipal demand was relatively subdued, as many investors continued to focus on the equity markets. Fortunately, municipal issuance for all of 1999 and the first quarter of 2000 was down significantly. This was largely a result of lower refunding volume which, in turn, reflected higher interest rates. In addition, credit spreads widened to five-year highs during the latter par t of 1999 and into 2000.
The fixed income markets were volatile during the second quarter — first experiencing a significant rally, then a steady decline, and finally another rally. The municipal market participated in the upswings, with the high-grade portion of the market outperforming its high yield counterparts. The reporting period ended on a strong note, as the municipal market posted very strong returns in July and August, remained fairly stable in September and generated solid results in October.
Throughout the period, supply and demand factors were the driving forces behind the municipal market. New issue volume is down approximately 20% year-to-date versus 1999. At the same time, overall demand has been mixed, as individual investor demand has been exceptionally strong in the 1-10 year range, property and casualty insurance companies have been net sellers in the 15-20 year range, and mutual funds, which dominate th e 20-30 year part of the yield curve, have been net sellers most of the year. This segmented demand has created pockets of value across the curve.
Portfolio Composition
During the period, we have worked to better align the Fund with its peer group. Specifically, we have reduced the number of high-coupon premium bonds while adding more discounts, current coupon, and slight-premium structures in order to have more diversified structures in the portfolio . At the same time, the Fund’s average maturity remained very stable during the period. In addition, although the Fund’s overall credit quality remains strong at AA–/A+, we have added more A and BBB bonds to take advantage of attractive credit spreads. We will
6
PERFORMANCE OVERVIEW
The Goldman Sachs Municipal Income Fund seeks a high level of current income exempt from regular federal income tax that is consistent with preservation of capital, primarily through investments in municipal securities.
continue to seek opportunities to generate additional yield, when prudent to do so from a research and a credit perspective. As we trade bonds from the portfolio, we continue to execute in a very tax-efficient manner — harvesting tax losses when available and avoiding unnecessary capital gains.
Portfolio Highlights
With some of the changes mentioned above, we have attempted to refocus the portfolio to be less volatile to interest rate changes, while investing in what we deemed to be “ value” opportunities in the market. As a result, we have increased the annualized distribution rate by approximately 65 basis points since January 2000, and the Fund’s performance significantly improved during the second half of the reporting period.
Portfolio Outlook
The reporting period ended on a positive note, as credit spreads narrowed and the municipal market, overall, showed signs of strength. Provided these trends continue, we remain cautiously optimistic on the outlook for the municipal market. It is also important to note that the supply and demand makeup for municipal bonds has resulted in significant changes in the municipal market. We believe that these trends are likely to continue into the foreseeable future. As a result, we expect to maintain our focus on bonds that will outperform during periods of high interest rate volatility. Finally, we will look for “value” opportunities in the municipal market, and adjust the Fund’s portfolio as needed.
We thank you for your investment and look forward to your continued confidence.
Goldman Sachs U.S. Fixed Income — Municipal Investment Management Team
November 9, 2000
7
FUND BASICS
High Yield Municipal Fund
as of October 31, 2000
| PERFORMANCE REVIEW | ||||||||||
| April 3, 2000– | Fund Total Return | 30-Day Taxable | 30-Day | Lehman High Yield | Lehman Municipal | |||||
| October 31, 2000 | (based on NAV)1 | Equivalent Yield | 2 | Standardized Yield3 | Municipal Bond Index4 | Bond Index4 | ||||
| |
||||||||||
| Class A | 5.06 | % | 8.94 | % | 5.40 | % | 4.21 | % | 5.10 | % |
| Class B | 4.60 | % | 8.10 | % | 4.89 | % | 4.21 | % | 5.10 | % |
| Class C | 4.60 | % | 8.11 | % | 4.90 | % | 4.21 | % | 5.10 | % |
| Institutional | 5.30 | % | 10.93 | % | 6.60 | % | 4.21 | % | 5.10 | % |
| |
||||||||||
| 1 The net asset value represents the net assets of the Fund (ex-dividend) divided by the total number of net shares outstanding. The Fund’s performance reflects the reinvestment of dividends and other distributions. | ||||||||||
| 2 The Taxable Equivalent Yield of the Fund is calculated by dividing the current 30-Day Standardized Yield by 1 minus the highest 1999 federal income tax rate of 39.6%. | ||||||||||
| 3 The 30-Day Standardized Yield of the Fund is calculated by dividing the net investment income per share (as defined by securities industry regulations) earned by the Fund over a 30-day period (ending on the stated month-end date) by the maximum public offering price per share of the Fund on the last day of the period. This number is compounded semiannually and then annualized. This yield does not necessarily reflect income actually earned and distributed by the Fund and, therefore, may not be correlated with the dividends or other distributions paid to shareholders. | ||||||||||
| 4 The Lehman Brothers High Yield Municipal Bond Index and the Lehman Brothers Municipal Bond Index are unmanaged and do not reflect any fees or expenses. Investors cannot invest directly in the Index. | ||||||||||
| STANDARDIZED TOTAL RETURNS5 | ||||||||||
| For the period ending 9/30/00 | Class A | Class B | Class C | Institutional | ||||||
| |
||||||||||
| Since Inception | –0.37 | % | –1.18 | % | 2.91 | % | 4.52 | % | ||
| (4/3/00) | ||||||||||
| |
||||||||||
| 5 The Standardized Total Returns are average annual returns or cumulative total returns (only if the performance period is one year or less) as of the most recent calendar quarter-end. They assume reinvestment of all distributions at net asset value. These returns reflect a maximum initial sales charge of 4.5% for Class A shares, the assumed deferred sales charge for Class B shares (5% maximum declining to 0% after six years), and the assumed deferred sales charge for Class C shares (1% if redeemed within 12 months of purchase). Because Institutional shares do not involve sales charges, such charges have not been applied to their Standardized Total Returns. | ||||||||||
| PORTFOLIO COMPOSITION ASOF 10/31/006 | ||||||||
| Sector Allocation | Credit Allocation | |||||||
| |
||||||||
| Revenue Bonds | 83.0 | % | AAA
|
5.0 | % | |||
| Variable Rate Demand Note | 11.0 | % | AA
|
13.0 | % | |||
| General Obligations | 2.0
|
% | A
|
8.0 | % | |||
| Insured Revenue Bonds | 4.0
|
% | BBB
|
19.0 | % | |||
| BB
|
46.0 | %* | ||||||
| B
|
9.0 | %* | ||||||
| |
||||||||
|
6 The Fund is actively managed and, as such, its composition may differ over time. Figures represent a percentage of total portfolio investments that have settled and include an offset to cash equivalents relating to all unsettled trade s and, therefore, may not sum to 100%. Total return figures represent past performance and do not indicate future results, which will vary. The investment return and principal value of an investment will fluctuate and, therefore, an investor’s shares, when redeemed, may be worth more or less than their original cost. Performance reflects expense limitations in effect. In their absence, performance would be reduced. *Reflects NRSRO (nationally recognized statistical rating organization) rating or internal rating if not rated. |
||||||||
8
PERFORMANCE OVERVIEW
High Yield Municipal Fund
Dear Shareholder,
We are pleased to report on the performance of the Goldman Sachs High Yield Municipal Fund from its inception through October 31, 2000.
Performance Review
During the period of time from the Fund’s inception on April 3, 2000 through October 31, 2000, the Fund’s A, B, C and Institutional share classes generated cumulative total returns, at net asset value, of 5 .06%, 4.60%, 4.60% and 5.30%, respectively. These returns compared favorably to the 4.21% return generated by the Fund’s benchmark, the Lehman Brothers High Yield Municipal Bond Index.
Municipal Market Performance
Early in the reporting period, overall municipal demand was relatively subdued, as many investors continued to focus on the equity markets. Fortunately, municipal issuance for all of 1999 and the first quarter of 2000 was down significantly. This was largely a result of lower refunding volume which, in turn, reflected higher interest rates. In addition, credit spreads widened to five-year highs during the latter part of 1999 and into 2000.
The fixed income markets were volatile during the second quarter — first experiencing a significant rally, then a steady decline, and finally another rally. The municipal market participated in the upswings, with the high-grade portion of the market outperforming its high yield counterparts. The reporting period ended on a strong note, as the municipal market posted very strong returns in July and August, remained fairly stable in September and generated solid results in October.
Throughout the period, supply and demand factors were the driving forces behind the municipal market. New issue volume is down approximately 20% year-to-date versus 1999. At the same time, overall demand has been mixed, as individual investor demand has been exceptionally strong in the 1-10 year range, property and casualty insurance companies have been net sellers in the 15-20 year range, and mutual funds, which dominate the 20-30 year part of the yield curve, have been net sellers most of the year. This segmented demand has created pockets of value across the curve.
Investment Objective
The Fund seeks a high level of current income that is exempt from regular federal income tax, and invests in securities that may also have the potential for capital appreciation.
9
PERFORMANCE OVERVIEW
Portfolio Composition
During much of the reporting period, we overweighted the Fund in both the healthcare and land-secured, or special assessment, sectors. We believe both areas offer attractive investment opportunities, while our fundamental credit research will seek t o mitigate risk. We also benefited from the purchase of several airline-backed bonds for airport improvements. In the healthcare sector, we focused on issuers that offer compelling characteristics that we feel are important to their long-term success. These include hospitals with dominant market positions, respectable balance sheets, strong management teams, and those that generally operate in a reasonable healthcare environment from both a regulatory and competitive perspective. In the land-secured area, we have purchased issues in areas exhibiting strong economic and demographic profiles, and strong developers that are in desirable locations.
Portfolio Outlook
Looking ahead, we expect the new issue calendar for the high yield municipal market to be very attractive over the next few months. From a credit perspective, the overall municipal market has continued to experience strong credit trends, with rating agency upgrades far outpacing downgrades . In addition, from a volatility standpoint, the high yield municipal market has performed exactly as one would expect in a volatile interest rate environment — underperforming in strong markets, while outperforming in down markets.
The Fund is designed to be opportunistic: unlike typical open-end mutual funds, it will open and close based on attractive market conditions, while offering daily liquidity to existing shareholders.
We thank you for your investment and look forward to your continued confidence.
Goldman Sachs U.S. Fixed Income — Municipal Investment Management Team
November 9, 2000
10
GOLDMAN SACHS TAX - FR EE FUNDS
The Goldman Sachs Advantage
Founded in 1869, Goldman, Sachs & Co. is a premier financial services firm traditionally known on Wall Street and around the world for its institutional expertise.
Today, the firm’s Investment Management Division provides individual investors the opportunity to tap the resource s of a global institutional powerhouse — and put this expertise to work in their individual portfolios.
What Sets Goldman Sachs Funds Apart?

To learn more about the Goldman Sachs Funds, call your investment professional today.
11
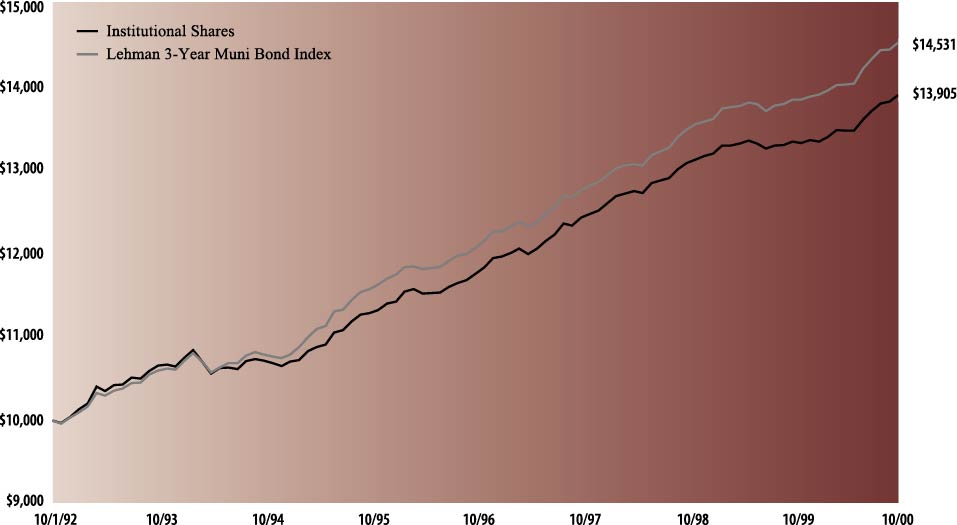
| The following graph shows the value as of October 31, 2000, of a $10,000 investment made on October 1, 1992 (commencement of
operations) in the Institutional shares of the Goldman Sachs Short Duration Tax-Free Fund. For comparative purposes, the performance of the Fund’s benchmark (the Lehman Brothers 3-Year Municipal Bond Index (“Lehman 3-Year Muni Bond Index”))
is shown. This performance data represents past performance and should not be considered indicative of future performance which will fluctuate with changes in market conditions. These performance fluctuations will cause an investor’s shares, when
redeemed, to be worth more or less than their original cost. Performance of Class A, Class B, Class C and Service shares will vary from the Institutional shares due to differences in fees and loads.
|
| Short Duration Tax-Free Fund’s Lifetime Performance
|
| Growth of a $10,000 Investment, Distributions Reinvested October 1, 1992 to October 31, 2000.
|
 |
| Average Annual Total Return through October 31, 2000 | Since Inception | Five Years | One Year | ||||
|---|---|---|---|---|---|---|---|
| Class A shares (commenced May 1, 1997) | |||||||
| Excluding sales charges | 3.79% | n/a | 3.93% | ||||
| Including sales charges | 3.20% | n/a | 1.87% | ||||
| Class B shares (commenced May 1, 1997) | |||||||
| Excluding contingent deferred sales charges | 3.16% | n/a | 3.31% | ||||
| Including contingent deferred sales charges | 3.16% | n/a | 1.24% | ||||
| Class C shares (commenced August 15, 1997) | |||||||
| Excluding contingent deferred sales charges | 2.68% | n/a | 3.15% | ||||
| Including contingent deferred sales charges | 2.68% | n/a | 2.12% | ||||
| Institutional shares (commenced October 1, 1992) | 4.16% | 4.19% | 4.34% | ||||
| Service shares (commenced September 20, 1994) | 3.81% | 3.61% | 3.72% | ||||
| Principal
Amount |
Interest
Rate |
Maturity
Date |
Value | |||||
|---|---|---|---|---|---|---|---|---|
| Debt Obligations – 99.6% | ||||||||
| Alabama – 0.9% | ||||||||
| Alabama 21st Century Authority RB for Tobacco Settlement
Revenue Series 2000 (A/Aa1) |
||||||||
| $ 600,000 | 5.25 | % | 12/01/2002 | $ 603,960 | ||||
| Arkansas – 1.5% | ||||||||
| Arkansas State Development Finance Authority Hospital RB
for Washington Regional Medical Center Series 2000 (BBB-/Baa3) |
||||||||
| $ 510,000 | 6.10 | % | 02/01/2004 | $ 510,387 | ||||
| 410,000 | 6.20 | 02/01/2005 | 410,894 | |||||
| $ 921,281 | ||||||||
| District of Columbia – 0.8% | ||||||||
| District of Columbia GO Bonds Series 1993 A (BBB/Baa3) | ||||||||
| $ 520,000 | 5.50 | % | 06/01/2001 | $ 521,732 | ||||
| Florida – 5.1% | ||||||||
| Florida State Board of Education GO Bonds for Public
Education Series 1998 B (AA+/Aa2) |
||||||||
| $ 3,000,000 | 6.00 | % | 06/01/2006 | $ 3,205,260 | ||||
| Illinois – 11.9% | ||||||||
| Chicago Illinois Tax Increment RB for Central Loop
Redevelopment Series 2000 A (ACA) (A) |
||||||||
| $ 1,000,000 | 6.50 | % | 12/01/2006 | $ 1,040,860 | ||||
| Illinois Educational Facilities Authority RB for Loyola
University Chicago Series 1991 A (AAA) |
||||||||
| 2,000,000 | 7.00 | 07/01/2007 | 2,257,880 | |||||
| Illinois Health Facilities Authority RB for Highland Park
Hospital Series A (FGIC) (AAA/Aaa)# |
||||||||
| 510,000 | 5.20 | 10/01/2001 | 513,595 | |||||
| Illinois Student Assistance Community Student Loan RB
Senior Series 2000 TT (Aaa) |
||||||||
| 2,000,000 | 4.90 | 09/01/2002 | 2,008,880 | |||||
| Metropolitan Pier and Exposition Authority Hospitality
Facilities RB for McCormick Place Series 1996 (AAA/Aaa) |
||||||||
| 1,650,000 | 5.75 | 07/01/2006 | 1,707,387 | |||||
| $ 7,528,602 | ||||||||
| Indiana – 11.1% | ||||||||
| Indiana Health Facilities Financing Authority Hospital RB for
Methodist Hospitals Series 1992 (A2) |
||||||||
| $ 2,200,000 | 6.75 | % | 09/15/2009 | $ 2,286,922 | ||||
| Logansport Multi-Purpose School Building Corp. First
Mortgages Series 1992 (A) |
||||||||
| 2,195,000 | 5.90 | 07/01/2005 | 2,279,595 | |||||
| Marion County Hospital Authority Facility RB for Methodist
Hospitals of Indiana Series 1989 (AAA/Aa3) |
||||||||
| 2,450,000 | 6.50 | 09/01/2013 | 2,484,398 | |||||
| $ 7,050,915 | ||||||||
| Principal
Amount |
Interest
Rate |
Maturity
Date |
Value | |||||
|---|---|---|---|---|---|---|---|---|
| Debt Obligations – (continued) | ||||||||
| Kentucky – 2.8% | ||||||||
| Kentucky Economic Development Finance Authority RB for
Norton Healthcare Inc. Series 2000 C (MBIA) (AAA/Aaa)§ |
||||||||
| $ 2,275,000 | 0.00/5.25 | % | 10/01/2007 | $ 1,775,592 | ||||
| Louisiana – 3.3% | ||||||||
| Louisiana State Correctional Facility Corp. Lease RB Series
1993 (FSA) (AAA/Aaa) |
||||||||
| $ 2,000,000 | 5.60 | % | 12/15/2003 | $ 2,063,200 | ||||
| Maryland – 2.5% | ||||||||
| Maryland State Health and Higher Educational Facilities
Authority RB Series 1997 (A-)#" |
||||||||
| $ 1,600,000 | 5.50 | % | 01/01/2002 | $ 1,603,248 | ||||
| Massachusetts – 4.1% | ||||||||
| Massachusetts State GO Bonds Series 1995 A (AA-/Aa2) | ||||||||
| $ 2,500,000 | 6.25 | % | 07/01/2003 | $ 2,614,775 | ||||
| Missouri – 4.9% | ||||||||
| St. Louis Missouri Airport RB Series 2000 (BBB-/Baa3) | ||||||||
| $ 1,400,000 | 6.25 | % | 01/01/2002 | $ 1,414,826 | ||||
| St. Louis Municipal Finance Leasehold RB Series 1993 A
(AMBAC) (AAA/Aaa) |
||||||||
| 1,655,000 | 5.30 | 07/15/2002 | 1,680,404 | |||||
| $ 3,095,230 | ||||||||
| Nevada – 0.9% | ||||||||
| Nevada Department of Business and Industry Capital
Appreciation RB for Las Vegas Monorail Series 2000 (AAA/Aaa)# |
||||||||
| $ 800,000 | 5.12 | % | 01/01/2007 | $ 589,488 | ||||
| New Jersey – 3.5% | ||||||||
| New Jersey Economic Development Authority RB First
Mortgage Keswick Pines Project Series 1993 (AAA/Aaa)Ù |
||||||||
| $ 1,975,000 | 8.75 | % | 01/01/2004 | $ 2,246,266 | ||||
| New York – 13.8% | ||||||||
| Nassau County GO Bonds Series 2000 F (BBB-/Baa3) | ||||||||
| $ 2,000,000 | 7.00 | % | 03/01/2002 | $ 2,048,000 | ||||
| 500,000 | 7.00 | 03/01/2003 | 520,220 | |||||
| New York GO Bonds Series 1991 B (A/A2) | ||||||||
| 2,000,000 | 7.50 | 02/01/2003 | 2,100,260 | |||||
| New York GO Bonds Series 1992 A (A/A2) | ||||||||
| 1,000,000 | 6.25 | 08/01/2003 | 1,042,150 | |||||
| New York State COPS Series 1999 (A/Baa1) | ||||||||
| 3,000,000 | 5.00 | 09/01/2001 | 3,014,520 | |||||
| $ 8,725,150 | ||||||||
| North Carolina – 0.8% | ||||||||
| North Carolina Municipal Power Agency RB for No.1
Catawba Electric Revenue Series 1992 (BBB+/Baa1) |
||||||||
| $ 480,000 | 5.90 | % | 01/01/2003 | $ 488,117 | ||||
| Principal
Amount |
Interest
Rate |
Maturity
Date |
Value | |||||
|---|---|---|---|---|---|---|---|---|
| Debt Obligations – (continued) | ||||||||
| Ohio – 8.9% | ||||||||
| Ohio Air Quality Development Authority RB for Ohio Edison
Co. Series 1999 C (BB-/Baa3)#" |
||||||||
| $ 1,000,000 | 5.80 | % | 06/01/2016 | $ 1,019,240 | ||||
| Ohio GO Bonds for Higher Educational Capital Facilities
Series 2000 A (AA+/Aa1) |
||||||||
| 3,000,000 | 5.00 | 02/01/2004 | 3,045,510 | |||||
| Ohio Water Development Authority PCRB Series 1991
(MBIA) (AAA/Aaa) |
||||||||
| 1,500,000 | 6.00 | 12/01/2011 | 1,551,780 | |||||
| $ 5,616,530 | ||||||||
| Pennsylvania – 7.7% | ||||||||
| Delaware County IDA PCRB for Peco Energy Co. Project
Series 1999 A (BBB+/Baa2)#" |
||||||||
| $ 1,250,000 | 5.20 | % | 04/01/2021 | $ 1,243,400 | ||||
| Philadelphia Water and Wastewater RB Prerefunded Series
1993 (FGIC) (AAA/Aaa)Ù |
||||||||
| 3,450,000 | 5.65 | 06/15/2003 | 3,609,011 | |||||
| $ 4,852,411 | ||||||||
| Texas – 6.5% | ||||||||
| Texas Municipal Power Agency RB Series 1991 A (AMBAC)
(AAA/Aaa) |
||||||||
| $ 1,000,000 | 6.75 | % | 09/01/2012 | $ 1,034,950 | ||||
| Titus County Fresh Water RB for Southwestern Electric Power
Co. Series 1991 A (A2) |
||||||||
| 2,945,000 | 8.20 | 08/01/2011 | 3,081,884 | |||||
| $ 4,116,834 | ||||||||
| Washington – 4.5% | ||||||||
| Washington Public Power Supply System RB for Nuclear
Project No.3 Series 1998 A (AA-/Aa1) |
||||||||
| $ 2,850,000 | 5.00 | % | 07/01/2002 | $ 2,869,209 | ||||
| Principal
Amount |
Interest
Rate |
Maturity
Date |
Value | |||||
|---|---|---|---|---|---|---|---|---|
| Debt Obligations – (continued) | ||||||||
| Wisconsin – 4.1% | ||||||||
| Wisconsin GO Bonds Series 1992 (AA/Aa2) | ||||||||
| $ 1,300,000 | 6.10 | % | 05/01/2004 | $ 1,364,844 | ||||
| Wisconsin State Health and Educational Facility RB for
Medical College of Wisconsin Series 1993 (A) |
||||||||
| 1,240,000 | 5.30 | 12/01/2003 | 1,263,176 | |||||
| $ 2,628,020 | ||||||||
| TOTAL DEBT OBLIGATIONS | ||||||||
| (Cost $62,877,745) | $ 63,115,820 | |||||||
| TOTAL INVESTMENTS | ||||||||
| (Cost $62,877,745) | $ 63,115,820 | |||||||
#
|
Variable rate security. Coupon rate disclosed is the rate in
effect at October 31, 2000. |
"
|
Securities with “Put” features with resetting interest rates. Maturity dates disclosed are the next interest reset dates.
|
Ù
|
Prerefunded security. Maturity date disclosed is prerefunding date.
|
§
|
This security is issued with a zero coupon rate which increases to the stated rate at a set date in the future.
|
| The percentage shown for each investment category reflects the value of investments in that category as a percentage of net assets.
|
| |
| Investment Abbreviations: | |||
| ACA | —Insured by American Capital Access | ||
| AMBAC | —Insured by American Municipal Bond Assurance
Corp. |
||
| COPS | —Certificates of Participation | ||
| FGIC | —Insured by Financial Guaranty Insurance Co. | ||
| FSA | —Insured by Financial Security Assurance Co. | ||
| GO | —General Obligation | ||
| IDA | —Industrial Development Authority | ||
| MBIA | —Insured by Municipal Bond Investors Assurance | ||
| PCRB | —Pollution Control Revenue Bond | ||
| RB | —Revenue Bond | ||
| Security ratings are unaudited.
|
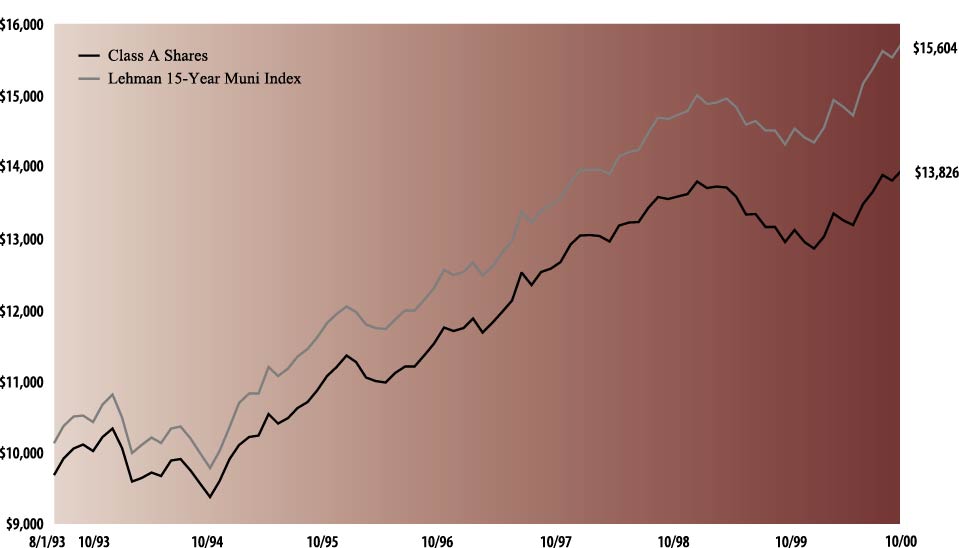
| The following graph shows the value as of October 31, 2000, of a $10,000 investment made on August 1, 1993 in Class A shares
(with the maximum sales charge of 4.5%) of the Goldman Sachs Municipal Income Fund. For comparative purposes, the performance of the Fund’s benchmark (the Lehman Brothers 15-Year Municipal Bond Index (“Lehman 15-Year Muni Index”)) is shown.
This performance data represents past performance and should not be considered indicative of future performance which will fluctuate with changes in market conditions. These performance fluctuations will cause an investor’s shares, when redeemed, to
be worth more or less than their original cost. Performance of Class B, Class C, Institutional and Service shares will vary from Class A shares due to differences in fees and loads.
|
| Municipal Income Fund’s Lifetime Performance
|
| Growth of a $10,000 Investment, Distributions Reinvested August 1, 1993 to October 31, 2000.(a)
|
 |
| Average Annual Total Return through October 31, 2000 | Since Inception | Five Years | One Year | ||||
|---|---|---|---|---|---|---|---|
| Class A shares (commenced July 20, 1993) | |||||||
| Excluding sales charges | 5.09% | 5.19% | 7.87% | ||||
| Including sales charges | 4.43% | 4.22% | 3.04% | ||||
| Class B shares (commenced May 1, 1996) | |||||||
| Excluding contingent deferred sales charges | 4.71% | n/a | 7.07% | ||||
| Including contingent deferred sales charges | 4.25% | n/a | 1.87% | ||||
| Class C shares (commenced August 15, 1997) | |||||||
| Excluding contingent deferred sales charges | 3.18% | n/a | 7.07% | ||||
| Including contingent deferred sales charges | 3.18% | n/a | 6.03% | ||||
| Institutional shares (commenced August 15, 1997) | 4.32% | n/a | 8.30% | ||||
| Service shares (commenced August 15, 1997) | 3.98% | n/a | 7.98% | ||||
(a)
|
For comparative purposes, initial investments are assumed to be made on the first day of the month following the commencement of
operations.
|
| Principal
Amount |
Interest
Rate |
Maturity
Date |
Value | |||||
|---|---|---|---|---|---|---|---|---|
| Debt Obligations – 96.2% | ||||||||
| Arizona – 3.3% | ||||||||
| Maricopa County MF Hsg. IDA RB for Place Five and
Greenery Apartments Series 1996 A (AAA) |
||||||||
| $ 1,795,000 | 5.85 | % | 01/01/2008 | $ 1,896,794 | ||||
| Maricopa County United School District RB No. 41 (FSA)
(AAA/Aaa) |
||||||||
| 2,500,000 | 6.25 | % | 07/01/2015 | 2,655,925 | ||||
| $ 4,552,719 | ||||||||
| Arkansas – 3.7% | ||||||||
| Arkansas Development Finance Authority Hospital RB for
Washington Regional Medical Center Series 2000 (BBB-/Baa3) |
||||||||
| $5,000,000 | 7.25 | % | 02/01/2020 | $ 4,996,700 | ||||
| Colorado – 2.2% | ||||||||
| Aurora Centretech Metropolitan District Series 1998 C
(LOC) (A+)#" |
||||||||
| $2,000,000 | 4.88 | % | 12/01/2028 | $ 1,965,420 | ||||
| Denver City and County Special Facilities Airport RB for
United Air Lines Project Series 1992 A (AMT) (BB+/Baa3) |
||||||||
| 1,000,000 | 6.88 | 10/01/2032 | 1,007,220 | |||||
| $ 2,972,640 | ||||||||
| Connecticut – 0.8% | ||||||||
| Mashantucket Western Pequot Tribe Prerefunded RB Series
1996 A (AAA/Aaa) |
||||||||
| $1,000,000 | 6.50 | % | 09/01/2005 | $ 1,084,940 | ||||
| Florida – 3.8% | ||||||||
| Crossings at Fleming Island Community Development District
RB for Special Assignment Series 2000 B (AAA/Aaa) |
||||||||
| $1,775,000 | 5.80 | % | 05/01/2016 | $ 1,839,166 | ||||
| Port Everglades Authority RB Series 1986 (AAA/Aaa) | ||||||||
| 2,785,000 | 7.13 | 11/01/2016 | 3,304,041 | |||||
| $ 5,143,207 | ||||||||
| Hawaii – 2.8% | ||||||||
| Hawaii State Airport Systems RB Series 2000 B (AMT)
(FGIC) (AAA/Aaa) |
||||||||
| $3,500,000 | 6.63 | % | 07/01/2017 | $ 3,805,305 | ||||
| Illinois – 6.2% | ||||||||
| Chicago Midway Airport RB Series 1996 A (MBIA)
(AAA/Aaa) |
||||||||
| $2,500,000 | 5.50 | % | 01/01/2010 | $ 2,594,200 | ||||
| Illinois Tax Increment for Central Loop Redevelopment Series
2000 A (ACA) (A) |
||||||||
| 2,000,000 | 6.50 | 12/01/2008 | 2,090,600 | |||||
| Lake County Community Consolidated School District No. 041
GO Bonds Series 1999 A (FSA) (AAA/Aaa) |
||||||||
| 2,725,000 | 9.00 | 11/01/2016 | 3,788,949 | |||||
| $ 8,473,749 | ||||||||
| Principal
Amount |
Interest
Rate |
Maturity
Date |
Value | |||||
|---|---|---|---|---|---|---|---|---|
| Debt Obligations – (continued) | ||||||||
| Kentucky – 2.6% | ||||||||
| Kentucky Economic Development Finance Authority RB for
Norton Healthcare Inc. Series 2000 C (MBIA) (AAA/Aaa)° |
||||||||
| $ 3,250,000 | 6.05 | % | 10/01/2018 | $ 2,442,408 | ||||
| Nelson County Industrial Building RB for Mabex Universal
Corp. Project Series 1995 (AMT) (LOC) (Aa3) |
||||||||
| 1,000,000 | 6.50 | 04/01/2005 | 1,030,220 | |||||
| $ 3,472,628 | ||||||||
| Louisiana – 1.4% | ||||||||
| Orleans Levee District Public Improvement RB Series 1995
(FSA) (AAA/Aaa)# |
||||||||
| $1,785,000 | 5.95 | % | 11/01/2015 | $ 1,861,701 | ||||
| Maine – 0.4% | ||||||||
| Maine Educational Loan Authority RB Series 1992 A-1
(AMT) (Aaa) |
||||||||
| $ 505,000 | 6.80 | % | 12/01/2007 | $ 526,008 | ||||
| Massachusetts – 2.0% | ||||||||
| Massachusetts State GO Bonds Series 1996 D (AMBAC)
(AAA/Aaa) |
||||||||
| $3,000,000 | 4.50 | % | 11/01/2015 | $ 2,747,190 | ||||
| Michigan – 4.6% | ||||||||
| Michigan Higher Educational Facility RB for the Thomas M.
Cooley Law School Series 1998 (LOC) (A+) |
||||||||
| $4,000,000 | 5.40 | % | 05/01/2018 | $ 3,780,920 | ||||
| Michigan Hospital Finance Authority RB for Trinity Health
Series 2000 A (AA-/Aa3) |
||||||||
| 2,500,000 | 5.50 | 12/01/2002 | 2,522,800 | |||||
| $ 6,303,720 | ||||||||
| Mississippi – 1.7% | ||||||||
| Mississippi Business Finance Corp. PCRB for Systems Energy
Resources Inc. Project Series 1998 (BBB-/Ba1) |
||||||||
| $2,500,000 | 5.88 | % | 04/01/2022 | $ 2,287,325 | ||||
| Nevada – 5.0% | ||||||||
| Las Vegas New Convention and Visitors Authority RB
Series 1999 (AMBAC) (AAA/Aaa) |
||||||||
| $2,500,000 | 6.00 | % | 07/01/2014 | $ 2,662,700 | ||||
| Nevada Department of Business and Industry RB for Las
Vegas Monorail Project 1st Tier Series 2000 (AMBAC) (AAA/Aaa) |
||||||||
| 2,500,000 | 5.63 | 01/01/2032 | 2,469,475 | |||||
| Washoe County GO Bonds for Reno Sparks Convention
Series 2000 A (FSA) (AAA/Aaa) |
||||||||
| 1,585,000 | 6.38 | 07/01/2023 | 1,683,302 | |||||
| $ 6,815,477 | ||||||||
| Principal
Amount |
Interest
Rate |
Maturity
Date |
Value | |||||
|---|---|---|---|---|---|---|---|---|
| Debt Obligations – (continued) | ||||||||
| New Hampshire – 1.2% | ||||||||
| New Hampshire IDA RB Public Service Co. New Hampshire
Project Series 1991 A (AMT) (BBB-/Ba3) |
||||||||
| $ 1,085,000 | 7.65 | % | 05/01/2021 | $ 1,111,344 | ||||
| New Hampshire IDA RB Public Service Co. New Hampshire
Project Series 1991 C (AMT) (BBB-/Ba3) |
||||||||
| 510,000 | 7.65 | 05/01/2021 | 522,383 | |||||
| $ 1,633,727 | ||||||||
| New Mexico – 4.4% | ||||||||
| Farmington PCRB Public Service Co. New Mexico San Juan
Project Series 1997 D (Baa3) |
||||||||
| $ 2,760,000 | 5.80 | % | 04/01/2022 | $ 2,546,210 | ||||
| Farmington PCRB Public Service Co. New Mexico
Series 1997 D (BBB-/Baa3) |
||||||||
| 3,530,000 | 6.38 | 04/01/2022 | 3,446,339 | |||||
| $ 5,992,549 | ||||||||
| New York – 12.1% | ||||||||
| Babylon Waste Facilities GO Bonds Series 1993
(FGIC) (AAA/Aaa) |
||||||||
| $ 3,000,000 | 9.00% | 08/01/2011 | $ 4,007,880 | |||||
| Dutchess County Resource Recovery Agency RB for Solid
Waste Systems Series 1999 A (MBIA) (AAA/Aaa) |
||||||||
| 1,000,000 | 5.00 | 01/01/2008 | 1,019,190 | |||||
| New York City Transitional Financial Authority RB Future
Tax Secured Series 2000 B (AA/Aa2) |
||||||||
| 1,910,000 | 6.00 | 11/15/2024 | 1,999,216 | |||||
| New York City Trust Cultural Resources RB for Museum of
American Folk Art Series 2000 (ACA) (A) |
||||||||
| 1,250,000 | 6.00 | 07/01/2022 | 1,243,813 | |||||
| 500,000 | 6.13 | 07/01/2030 | 498,985 | |||||
| New York GO Bonds Series 1996 G (A/A2) | ||||||||
| 3,900,000 | 5.75 | 02/01/2014 | 4,006,275 | |||||
| New York GO Bonds Series 1997 J (A/A2) | ||||||||
| 2,000,000 | 6.00 | 08/01/2017 | 2,079,500 | |||||
| New York State Dormitory Authority RB for North Shore
University Hospital Series 1998 (MBIA) (AAA/Aaa) |
||||||||
| 1,500,000 | 5.50 | 11/01/2014 | 1,551,540 | |||||
| $ 16,406,399 | ||||||||
| North Carolina – 2.2% | ||||||||
| North Carolina Medical Care Community Hospital RB for
Northeast Medical Center Project Series 2000 (AMBAC) (AAA/Aaa) |
||||||||
| $ 3,000,000 | 5.50 | % | 11/01/2025 | $ 2,924,610 | ||||
| North Dakota – 1.5% | ||||||||
| Mercer County PCRB for Basin Electric and Power
Series 1995-2 (AMBAC) (AAA/Aaa) |
||||||||
| $ 2,000,000 | 6.05 | % | 01/01/2019 | $ 2,060,460 | ||||
| Principal
Amount |
Interest
Rate |
Maturity
Date |
Value | |||||
|---|---|---|---|---|---|---|---|---|
| Debt Obligations – (continued) | ||||||||
| Ohio – 2.3% | ||||||||
| Cuyahoga County Port Authority RB for Rock and Roll Hall
of Fame Series 1997 (BBB) |
||||||||
| $ 600,000 | 5.45 | % | 12/01/2005 | $ 594,540 | ||||
| Ohio Air Quality Development Authority RB for Ohio Edison
Co. Series 1999 C (BB-/Baa3)#" |
||||||||
| 2,500,000 | 5.80 | 06/01/2016 | 2,548,100 | |||||
| $ 3,142,640 | ||||||||
| Oklahoma – 1.4% | ||||||||
| Oklahoma Industrial Authority RB for Health Systems Integris
Baptist Series 1995 D (AMBAC) (AAA/Aaa) |
||||||||
| $ 2,000,000 | 5.00 | % | 08/15/2014 | $ 1,894,180 | ||||
| Pennsylvania – 3.2% | ||||||||
| Delaware County IDA PCRB for Peco Energy Co. Project
Series 1999 A (BBB+/Baa2)#" |
||||||||
| $ 1,250,000 | 5.20 | % | 04/01/2021 | $ 1,243,400 | ||||
| Pennsylvania GO Bonds Series 2000 (AA/Aa2) | ||||||||
| 3,000,000 | 5.25 | 10/15/2003 | 3,065,580 | |||||
| $ 4,308,980 | ||||||||
| Tennessee – 6.6% | ||||||||
| Elizabethton Health and Educational Board RB First Mortgage
Series 2000 B (MBIA) (AAA/Aaa) |
||||||||
| $ 2,000,000 | 6.25 | % | 07/01/2015 | $ 2,176,480 | ||||
| Johnson City Health and Educational Facilities Board Hospital
RB First Mortgage Series 2000 A (MBIA) (AAA/Aaa) |
||||||||
| 3,000,000 | 6.25 | 07/01/2016 | 3,253,260 | |||||
| McMinnville Housing Authority RB First Mortgage for
Beersheba Heights Tower Series 1997 (A2) |
||||||||
| 1,230,000 | 6.00 | 10/01/2009 | 1,278,450 | |||||
| Tennessee Housing Development Agency for Homeownership
Program 1 Series 2000 (AMT) (AA/Aa2) |
||||||||
| 2,130,000 | 5.85 | 07/01/2011 | 2,220,780 | |||||
| $ 8,928,970 | ||||||||
| Texas – 6.6% | ||||||||
| Gregg County Health Facilities Development Corp. RB for
Good Shephard Medical Center Project Series 2000 (AA/Baa2) |
||||||||
| $ 3,000,000 | 6.38 | % | 10/01/2025 | $ 3,098,580 | ||||
| Harris County MF Hsg. RB for Windfern Apartments
Series 1999 A (A) |
||||||||
| 2,150,000 | 5.90 | 07/01/2019 | 2,049,380 | |||||
| Houston Texas Water and Sewer Systems RB for Junior Lien
Series 2000 B (FGIC) (AAA/Aaa) |
||||||||
| 3,000,000 | 5.25 | 12/01/2023 | 2,846,130 | |||||
| Waxahachie Independent School District GO Bonds
Series 2000 (PSF) (Aaa)° |
||||||||
| 1,855,000 | 5.65 | 08/15/2013 | 904,108 | |||||
| $ 8,898,198 | ||||||||
| Principal
Amount |
Interest
Rate |
Maturity
Date |
Value | |||||
|---|---|---|---|---|---|---|---|---|
| Debt Obligations – (continued) | ||||||||
| Washington – 6.9% | ||||||||
| Chelan County Public Utilities District No. 001 RB for Chelan
Hydro Project Series 1997 D (AMT) (MBIA) (AAA/Aaa) |
||||||||
| $ 2,500,000 | 6.35 | % | 07/01/2028 | $ 2,611,725 | ||||
| King County Sewer RB Series 1999-2 (FGIC) (AAA/Aaa) | ||||||||
| 3,965,000 | 6.25 | 01/01/2016 | 4,221,654 | |||||
| Washington Public Power Supply System RB for Nuclear
Project No. 2 Series 1996 A (AMBAC) (AAA/Aaa) |
||||||||
| 2,500,000 | 5.70 | 07/01/2011 | 2,606,925 | |||||
| $ 9,440,304 | ||||||||
| Wisconsin – 7.3% | ||||||||
| Appleton Waterworks BAN Series 2000 (MIG1) | ||||||||
| $ 2,100,000 | 5.00 | % | 07/01/2002 | $ 2,106,426 | ||||
| Wisconsin State GO Bonds Series 1999 C (AA/Aa2) | ||||||||
| 5,380,000 | 6.25 | 05/01/2015 | 5,809,109 | |||||
| Wisconsin State Transportation RB Series 2000 A (FGIC)
(AAA/Aaa) |
||||||||
| 2,000,000 | 5.50 | 07/01/2014 | 2,039,420 | |||||
| $ 9,954,955 | ||||||||
| TOTAL DEBT OBLIGATIONS | ||||||||
| (Cost $127,637,372) | $ 130,629,281 | |||||||
| Short-Term Obligations# – 8.1% | ||||||||
| California – 0.3% | ||||||||
| Los Angeles Regional Airports Improvement Corp. RB VRDN
for Sublease LA International—Lax 2 Corp. Series 1985 (LOC) (A-1+) |
||||||||
| $ 400,000 | 4.65 | % | 11/01/2000 | $ 400,000 | ||||
| Delaware – 0.4% | ||||||||
| Delaware Economic Development Authority RB VRDN for
Delmarva Pacer and Light Co. Series 1987 A (AMT) (A-1/VMIG1) |
||||||||
| $ 600,000 | 4.85 | % | 11/01/2000 | $ 600,000 | ||||
| New York – 0.9% | ||||||||
| Long Island Power Authority RB VRDN Series 1998-6
(A-1+/VMIG1) |
||||||||
| $ 400,000 | 4.55 | % | 11/01/2000 | $ 400,000 | ||||
| New York City Municipal Water Finance Authority RB for
Water and Sewer System Series 1995 A (SPA-FGIC) (A-1+/VMIG1) |
||||||||
| 800,000 | 4.75 | 11/01/2000 | 800,000 | |||||
| $ 1,200,000 | ||||||||
| Texas – 3.8% | ||||||||
| Harris County Health Facilities VRDN for St. Luke’s
Episcopal Hospital Series 1997 B (SPA) (A-1+) |
||||||||
| $ 4,000,000 | 4.65 | % | 11/01/2000 | $ 4,000,000 | ||||
| Principal
Amount |
Interest
Rate |
Maturity
Date |
Value | |||||
|---|---|---|---|---|---|---|---|---|
| Short-Term Obligations# – (continued) | ||||||||
| Texas – (continued) | ||||||||
| North Central Health Facilities Development Corp. RB for
Presbyterian Medical Center Series 1985 D (MBIA) (A-1+/VMIG1) |
||||||||
| $ 1,200,000 | 4.65 | % | 11/01/2000 | $ 1,200,000 | ||||
| $ 5,200,000 | ||||||||
| Washington – 2.6% | ||||||||
| Washington Health Care Facilities Authority RB VRDN for
Virginia Mason Medical Center Series 1997 B (A-1+/VMIG1) |
||||||||
| $ 3,500,000 | 4.65 | % | 11/01/2000 | $ 3,500,000 | ||||
| Wisconsin – 0.1% | ||||||||
| Wisconsin State Health and Educational Facilities Authority
RB VRDN for Ministry Health Care Series 1999 A (MBIA) (AAA/Aaa) |
||||||||
| $ 100,000 | 4.30 | % | 11/01/2000 | $ 100,000 | ||||
| TOTAL SHORT-TERM OBLIGATIONS | ||||||||
| (Cost $11,000,000) | $ 11,000,000 | |||||||
| TOTAL INVESTMENTS | ||||||||
| (Cost $138,637,372) | $ 141,629,281 | |||||||
#
|
Variable rate security. Coupon rate disclosed is that which is in
effect at October 31, 2000. |
°
|
Security is issued with a zero coupon. The interest rate disclosed for this security represents effective yield to maturity at
date of purchase.
|
"
|
Securities with “Put” features with resetting interest rates. Maturity dates disclosed are the next interest reset date.
|
| The percentage shown for each investment category reflects the value of investments in that category as a percentage of net assets.
|
| |
| Investment Abbreviations: | |||
| ACA | —Insured by American Capital Access | ||
| AMBAC | —Insured by American Municipal Bond Assurance Corp. | ||
| AMT | —Alternative Minimum Tax | ||
| BAN | —Bond Anticipation Note | ||
| FGIC | —Insured by Financial Guaranty Insurance Co. | ||
| FSA | —Insured by Financial Security Assurance Co. | ||
| GO | —General Obligation | ||
| IDA | —Industrial Development Authority | ||
| LOC | —Letter of Credit | ||
| MBIA | —Insured by Municipal Bond Investors Assurance | ||
| MF Hsg. | —Multi-Family Housing | ||
| PCRB | —Pollution Control Revenue Bond | ||
| PSF | —Guaranteed by Permanent School Fund | ||
| RB | —Revenue Bond | ||
| SPA | —Stand-by Purchase Agreement | ||
| SPA-FGIC | —Stand-by Purchase Agreement Insured by Financial
Guaranty Insurance Co. |
||
| VRDN | —Variable Rate Demand Note | ||
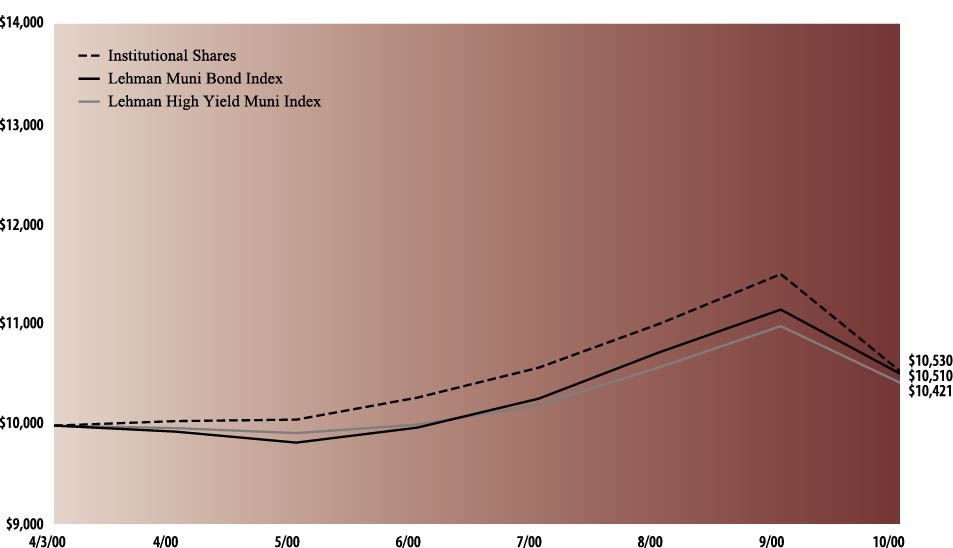
| The following graph shows the value as of October 31, 2000, of a $10,000 investment made on April 3, 2000 (commencement of
operations) in the Institutional shares of the Goldman Sachs High Yield Municipal Fund. For comparative purposes, the performance of the Fund’s benchmarks (the Lehman Brothers Municipal Bond Index and Lehman Brothers High Yield Municipal Index (“
Lehman Muni Bond Index and Lehman High Yield Muni Index”)) is shown. This performance data represents past performance and should not be considered indicative of future performance which will fluctuate with changes in market conditions. These
performance fluctuations will cause an investor’s shares, when redeemed, to be worth more or less than their original cost. Performance of Class A, Class B and Class C shares will vary from the Institutional shares due to differences in fees and loads.
|
| High Yield Municipal Fund’s Lifetime Performance
|
| Growth of a $10,000 Investment, Distributions Reinvested April 3, 2000 to October 31, 2000.
|
 |
| Aggregate Annual Total Return through October 31, 2000 | Since Inception (a) | ||
|---|---|---|---|
| Class A shares (commenced April 3, 2000) | |||
| Excluding sales charges | 5.06% | ||
| Including sales charges | 0.34% | ||
| Class B shares (commenced April 3, 2000) | |||
| Excluding contingent deferred sales charges | 4.60% | ||
| Including contingent deferred sales charges | -0.53% | ||
| Class C shares (commenced April 3, 2000) | |||
| Excluding contingent deferred sales charges | 4.60% | ||
| Including contingent deferred sales charges | 3.58% | ||
| Institutional shares (commenced April 3, 2000) | 5.30% | ||
(a)
|
not annualized.
|
| Principal
Amount |
Interest
Rate |
Maturity
Date |
Value | |||||
|---|---|---|---|---|---|---|---|---|
| Debt Obligations – 93.7% | ||||||||
| Arizona – 2.8% | ||||||||
| Maricopa County PCRB for El Paso Electric Co. Series 2000 | ||||||||
| $ 4,000,000 | 8.15 | % | 12/01/2014 | $ 4,008,880 | ||||
| Pima County IDA RB for Tuscon Electric Power Co. Project
Series 1997 B (B+/Ba3) |
||||||||
| 4,000,000 | 6.00 | 09/01/2029 | 3,701,200 | |||||
| $ 7,710,080 | ||||||||
| California – 11.8% | ||||||||
| California Educational Facilities Authority RB for Pepperdine
University Series 2000 (A1) |
||||||||
| $ 6,000,000 | 5.75 | % | 09/15/2030 | $ 6,128,040 | ||||
| California GO Bonds Series 2000 (AA/Aa2) | ||||||||
| 4,700,000 | 5.50 | 06/01/2028 | 4,711,233 | |||||
| Central California Joint Powers Health Financing Authority
COPS for Community Hospital of Central California Series 2000 (A-/Baa1) |
||||||||
| 2,500,000 | 6.00 | 02/01/2030 | 2,476,425 | |||||
| Chula Vista Community Facilities District RB No. 99-1-Otay
Series 2000 |
||||||||
| 1,225,000 | 7.63 | 09/01/2029 | 1,307,614 | |||||
| Foothill/Eastern Corridor Agency Toll Road RB for Capital
Appreciation Series 1999 (BBB-/Baa3)° |
||||||||
| 30,000,000 | 6.55 | 01/15/2030 | 4,635,900 | |||||
| Hawthorne Community Redevelopment Agency Special Tax
for Community Facilities District No. 99-1 Series 2000 A (LOC) |
||||||||
| 880,000 | 6.75 | 10/01/2020 | 892,505 | |||||
| 1,180,000 | 7.20 | 10/01/2025 | 1,216,367 | |||||
| Hawthorne Community Redevelopment Agency Special Tax
for Community Facilities District No. 99-1 Series 2000 B (LOC) |
||||||||
| 1,675,000 | 7.20 | 10/01/2025 | 1,726,624 | |||||
| Lake Elsinore Improvement Bond Act 1915 for Special
Assessment District No. 93-1 Series 2000 |
||||||||
| 2,000,000 | 7.00 | 09/02/2030 | 2,042,440 | |||||
| Los Angeles Community Redevelopment Agency RB for
Cinerama Dome Public Parking Project Series 2000 (ACA) (A) |
||||||||
| 2,000,000 | 5.75 | 07/01/2026 | 1,976,160 | |||||
| Richmond Improvement Bond Act 1915 for Special
Assessment Improvement District No. 99-1 Series 2000 |
||||||||
| 500,000 | 7.00 | 09/02/2017 | 515,640 | |||||
| San Leandro Community Facilities District No. 1 Special Tax
Series 2000 |
||||||||
| 1,690,000 | 6.40 | 09/01/2019 | 1,723,513 | |||||
| Tustin Unified School District BAN for Community Facilities
No. 97-1 Series 2000 |
||||||||
| 1,200,000 | 6.10 | 09/01/2002 | 1,201,512 | |||||
| Tustin Unified School District Special Tax for Community
Facilities District No. 97-1 Series 2000 |
||||||||
| 500,000 | 6.25 | 09/01/2021 | 502,235 | |||||
| 1,000,000 | 6.37 | 09/01/2035 | 1,006,260 | |||||
| $ 32,062,468 | ||||||||
| Principal
Amount |
Interest
Rate |
Maturity
Date |
Value | |||||
|---|---|---|---|---|---|---|---|---|
| Debt Obligations – (continued) | ||||||||
| Colorado – 2.3% | ||||||||
| Denver City and County Special Facilities Airport RB for
United Air Lines Project Series 1992 A (AMT) (BB+/Baa3) |
||||||||
| $ 1,620,000 | 6.88 | % | 10/01/2032 | $ 1,631,696 | ||||
| McKay Landing Metropolitan GO Bonds District No. 2
Series 2000 |
||||||||
| 1,500,000 | 7.50 | 12/01/2019 | 1,512,735 | |||||
| Saddle Rock South Metropolitan GO Bonds Mill Levy
Obligation Series 2000 |
||||||||
| 3,000,000 | 7.20 | 12/01/2019 | 3,041,700 | |||||
| $ 6,186,131 | ||||||||
| Connecticut – 0.2% | ||||||||
| Connecticut Health and Educational Facility Authority RB for
St. Mary’s Hospital Corp. Series 1997 E (Baa1) |
||||||||
| $ 695,000 | 5.88 | % | 07/01/2022 | $ 615,284 | ||||
| Florida – 23.5% | ||||||||
| Brooks of Bonita Springs II Community Development District
RB for Capital Improvements Series 2000 A |
||||||||
| $ 6,000,000 | 7.00 | % | 05/01/2031 | $ 6,084,660 | ||||
| Brooks of Bonita Springs II Community Development District
RB for Capital Improvements Series 2000 B |
||||||||
| 5,000,000 | 6.60 | 05/01/2007 | 5,053,150 | |||||
| Crossings at Fleming Island Community Development District
RB for Special Assessment Series 2000 C |
||||||||
| 6,250,000 | 7.05 | 05/01/2015 | 6,488,125 | |||||
| Fleming Island Plantation Community Development District
RB for Special Assessment Series 2000 B |
||||||||
| 5,915,000 | 7.30 | 05/01/2015 | 6,251,505 | |||||
| Halifax Hospital Medical Center RB Series 1999 A | ||||||||
| 955,000 | 7.25 | 10/01/2024 | 924,096 | |||||
| Maple Ridge Community Development District Special
Assessment Series 2000 A |
||||||||
| 1,615,000 | 7.15 | 05/01/2031 | 1,649,561 | |||||
| Maple Ridge Community Development District Special
Assessment Series 2000 B |
||||||||
| 3,000,000 | 6.15 | 11/01/2004 | 3,008,820 | |||||
| Marion County IDA RB for Little Sumter Utility Co. Project
Series 2000 (AMT) |
||||||||
| 1,615,000 | 7.08 | 10/01/2020 | 1,630,165 | |||||
| 435,000 | 7.15 | 10/01/2030 | 448,689 | |||||
| Meadow Pointe II Community Development District RB for
Capital Improvement Series 2000 |
||||||||
| 4,660,000 | 6.65 | 04/01/2005 | 4,699,284 | |||||
| Mediterra South Community Development District RB for
Capital Improvement Series 1999 B |
||||||||
| 5,730,000 | 6.25 | 05/01/2004 | 5,754,868 | |||||
| Mediterra South Community Development District RB for
Capital Improvement Series 1999 A |
||||||||
| 500,000 | 6.95 | 05/01/2031 | 503,585 | |||||
| Oakstead Community Development District RB for Capital
Improvement Series 2000 B |
||||||||
| 1,630,000 | 6.50 | 05/01/2007 | 1,629,332 | |||||
| Principal
Amount |
Interest
Rate |
Maturity
Date |
Value | |||||
|---|---|---|---|---|---|---|---|---|
| Debt Obligations – (continued) | ||||||||
| Florida – (continued) | ||||||||
| Parkway Center Community Development District Special
Assessment Series 2000 A |
||||||||
| $ 905,000 | 8.25 | % | 05/01/2031 | $ 940,123 | ||||
| Parkway Center Community Development District Special
Assessment Series 2000 B |
||||||||
| 5,000,000 | 8.00 | 05/01/2010 | 5,104,700 | |||||
| Poinciana Community Development District Special
Assessment Series 2000 A |
||||||||
| 7,000,000 | 7.13 | 05/01/2031 | 7,071,400 | |||||
| Village Community Development District No. 4 Special
Assessment Series 2000 |
||||||||
| 4,500,000 | 7.15 | 05/01/2018 | 4,591,350 | |||||
| Vista Lakes Community Development District RB for Capital
Improvements Series 2000 B |
||||||||
| 1,750,000 | 6.35 | 05/01/2005 | 1,752,380 | |||||
| $ 63,585,793 | ||||||||
| Hawaii – 2.0% | ||||||||
| Hawaii County Improvement District RB No. 17 Special
Assessment Kaloko Subdivision Series 1991 |
||||||||
| $ 4,285,000 | 9.50 | % | 08/01/2011 | $ 4,332,906 | ||||
| Hawaii Department of Transport Special Facilities RB for
Continental Airlines Inc. Series 2000 (BB/Ba2) (AMT) |
||||||||
| 1,000,000 | 7.00 | 06/01/2020 | 998,110 | |||||
| $ 5,331,016 | ||||||||
| Illinois – 4.4% | ||||||||
| Chicago, Illinois Tax Increment for Central Loop
Redevelopment Series 2000 A (ACA) (A) |
||||||||
| $ 6,550,000 | 6.50 | % | 12/01/2007 | $ 6,391,948 | ||||
| 2,000,000 | 6.50 | 12/01/2008 | 2,090,600 | |||||
| Chicago O’Hare International Airport Special Facilities RB for
United Air Lines Project Series 1999 A (BB+/Baa2) |
||||||||
| 4,000,000 | 5.35 | 09/01/2016 | 3,446,960 | |||||
| $ 11,929,508 | ||||||||
| Kentucky – 2.6% | ||||||||
| Kenton County Airport Board RB Special Facilities for Delta
Airlines Inc. Series 1985 (BBB-/Ba2) |
||||||||
| $ 1,000,000 | 7.80 | % | 12/01/2015 | $ 1,012,500 | ||||
| Kentucky Economic Development Finance Authority RB for
Norton Healthcare Inc. Series 2000 B (MBIA) (AAA/Aaa)° |
||||||||
| 2,000,000 | 6.16 | 10/01/2022 | 542,780 | |||||
| Kentucky Economic Development Finance Authority RB for
Norton Healthcare Inc. Series 2000 C (MBIA) (AAA/Aaa)§ |
||||||||
| 6,750,000 | 0.00/6.00 | 10/01/2018 | 5,072,693 | |||||
| Kentucky Economic Development Finance Authority RB for
Appalachian Regional Health Care Series 1997 (BB-) |
||||||||
| 500,000 | 5.70 | 10/01/2010 | 395,335 | |||||
| $ 7,023,308 | ||||||||
| Principal
Amount |
Interest
Rate |
Maturity
Date |
Value | |||||
|---|---|---|---|---|---|---|---|---|
| Debt Obligations – (continued) | ||||||||
| Louisiana – 2.4% | ||||||||
| Louisiana Health and Educational Authority RB for Lambeth
House Series 1998 A |
||||||||
| $ 5,215,000 | 5.25 | % | 01/01/2005 | $ 5,009,320 | ||||
| West Feliciana Parish PCRB for Gulf State Utilities Co.
Series 1984 (BB+/Ba1) |
||||||||
| 1,500,000 | 7.70 | 12/01/2014 | 1,565,610 | |||||
| $ 6,574,930 | ||||||||
| Maryland – 0.1% | ||||||||
| Prince Georges County RB for Dimensions Health Corp.
Project Series 1994 (Ba1) |
||||||||
| $ 560,000 | 5.30 | % | 07/01/2024 | $ 314,082 | ||||
| Massachusetts – 0.3% | ||||||||
| Massachusetts Health and Education Facilities Authority RB
for Saint Memorial Medical Center Series 1993 A (Ba2) |
||||||||
| $ 1,000,000 | 5.75 | % | 10/01/2006 | $ 905,320 | ||||
| Michigan – 1.9% | ||||||||
| Midland County Economic Development RB for Obligation-
Midland Series 2000 B (BB+/Ba3) |
||||||||
| $ 5,000,000 | 6.75 | % | 07/23/2009 | $ 5,081,250 | ||||
| Minnesota – 1.4% | ||||||||
| Maplewood Health Care Facility RB HealthEast Project
Series 1996 (BBB-/Ba1) |
||||||||
| $ 310,000 | 5.80 | % | 11/15/2003 | $ 299,981 | ||||
| St Paul Housing and Redevelopment Hospital Authority RB
for Healtheast Project Series 1993 A (BBB-/Baa3) |
||||||||
| 3,920,000 | 6.63 | 11/01/2017 | 3,427,217 | |||||
| $ 3,727,198 | ||||||||
| Mississippi – 1.9% | ||||||||
| Mississippi Business Finance Corp. PCRB for Systems Energy
Resources Inc. Project Series 1998 (BBB-/Ba1) |
||||||||
| $ 5,630,000 | 5.88 | % | 04/01/2022 | $ 5,151,056 | ||||
| Nevada – 2.6% | ||||||||
| Nevada Department of Business and Industry RB for Las
Vegas Monorail Project 1st Tier Series 2000 (AMBAC) (AAA/Aaa) |
||||||||
| $ 2,500,000 | 5.63 | % | 01/01/2032 | $ 2,469,475 | ||||
| Nevada Department of Business and Industry RB for Las
Vegas Monorail Project 2nd Tier Series 2000 |
||||||||
| 3,600,000 | 7.25 | 01/01/2023 | 3,509,136 | |||||
| 1,000,000 | 7.38 | 01/01/2030 | 976,840 | |||||
| $ 6,955,451 | ||||||||
| New Hampshire – 0.4% | ||||||||
| New Hampshire Higher Educational and Health Facility
Authority RB St. Joseph’s Hospital Series 1991 (BBB+/Baa2) |
||||||||
| $ 1,000,000 | 7.50 | % | 01/01/2016 | $ 1,019,330 | ||||
| New Jersey – 0.9% | ||||||||
| New Jersey Economic Development Authority Retirement RB
for Seabrook Village Inc. Series 2000 A |
||||||||
| $ 2,500,000 | 8.00 | % | 11/15/2015 | $ 2,452,975 | ||||
| Principal
Amount |
Interest
Rate |
Maturity
Date |
Value | |||||
|---|---|---|---|---|---|---|---|---|
| Debt Obligations – (continued) | ||||||||
| New Mexico – 1.6% | ||||||||
| Farmington PCRB Public Service Co. San Juan Series 1996 B
(BBB-/Baa3) |
||||||||
| $ 1,500,000 | 6.30 | % | 12/01/2016 | $ 1,465,035 | ||||
| Farmington PCRB Tucson Electric Power Co. San Juan
Series 1997 A (B+/Ba3) |
||||||||
| 3,000,000 | 6.95 | 10/01/2020 | 3,033,930 | |||||
| $ 4,498,965 | ||||||||
| New York – 2.8% | ||||||||
| New York City Transitional Finance Authority RB Future Tax
Secured Series 2000 C (AA+/Aa2) |
||||||||
| $ 5,000,000 | 5.50 | % | 11/01/2020 | $ 4,987,700 | ||||
| New York City Trust Cultural Resources RB for Museum of
American Folk Art Series 2000 (ACA) (A) |
||||||||
| 2,500,000 | 6.13 | 07/01/2030 | 2,494,925 | |||||
| $ 7,482,625 | ||||||||
| North Carolina – 0.7% | ||||||||
| Charlotte Special Facilities RB for Douglas International
Airport US Airways Series 2000 (AMT) |
||||||||
| $ 2,000,000 | 7.75 | % | 02/01/2028 | $ 1,920,240 | ||||
| Ohio – 1.3% | ||||||||
| Cleveland Airport Special RB for Continental Airlines Inc.
Series 1999 (AMT) (BB+/Ba2) |
||||||||
| $ 4,320,000 | 5.70 | % | 12/01/2019 | $ 3,650,270 | ||||
| Oklahoma – 3.0% | ||||||||
| Oklahoma Development Finance Authority RB for Hillcrest
Healthcare Systems Series 1999 A (BB+/Ba1) |
||||||||
| $ 5,320,000 | 5.63 | % | 08/15/2019 | $ 3,947,333 | ||||
| 5,825,000 | 5.63 | 08/15/2029 | 4,046,686 | |||||
| $ 7,994,019 | ||||||||
| Pennsylvania – 7.5% | ||||||||
| Allegheny County Hospital Development Authority RB for
Health Systems Series 2000 B (B+/B1) |
||||||||
| $ 15,000,000 | 9.25 | % | 11/15/2022 | $ 14,247,750 | ||||
| Philadelphia IDA RB for US Airways Inc. Project Series 2000
(AMT) |
||||||||
| 6,000,000 | 7.50 | 05/01/2010 | 5,980,920 | |||||
| $ 20,228,670 | ||||||||
| South Carolina – 3.3% | ||||||||
| South Carolina Jobs Economic Development Authority RB
Palmetto Health Alliance Series 2000 A (BBB/Baa1) |
||||||||
| $ 8,750,000 | 7.13 | % | 12/15/2015 | $ 8,981,263 | ||||
| Tennessee – 6.6% | ||||||||
| Elizabethton Health and Educational Facility Board RB First
Mortgage Series B (Baa2) |
||||||||
| $ 17,170,000 | 8.00 | % | 07/01/2033 | $ 17,973,899 | ||||
| Principal
Amount |
Interest
Rate |
Maturity
Date |
Value | |||||
|---|---|---|---|---|---|---|---|---|
| Debt Obligations – (continued) | ||||||||
| Wisconsin – 0.5% | ||||||||
| Wisconsin Health and Educational Facility Authority RB
Aurora Health Care Series 1999 B (BBB+) |
||||||||
| $ 1,500,000 | 5.63 | % | 02/15/2020 | $ 1,289,504 | ||||
| U. S. Virgin Islands – 1.2% | ||||||||
| Virgin Islands Public Finance Authority RB Subordinated
Lien-Fund Loan Notes Series 1998 D |
||||||||
| $ 2,000,000 | 6.00 | % | 10/01/2004 | $ 2,031,840 | ||||
| 1,100,000 | 6.00 | 10/01/2005 | 1,116,280 | |||||
| $ 3,148,120 | ||||||||
| Puerto Rico – 3.7% | ||||||||
| Childrens Trust Fund RB for Tobacco Settlement Series 2000
(A/Aa3) |
||||||||
| $ 10,000,000 | 5.75 | % | 07/01/2020 | $ 9,940,000 | ||||
| TOTAL DEBT OBLIGATIONS | ||||||||
| (Cost $250,598,831) | $ 253,732,755 | |||||||
| Short-Term Obligations# – 11.1% | ||||||||
| California – 1.1% | ||||||||
| Los Angeles Regional Airports Improvement Corp. RB VRDN
for Sublease LA International-LAX 2 Corp. Series 1985 (LOC) (A-1+) |
||||||||
| $ 3,000,000 | 4.65 | % | 11/01/2000 | $ 3,000,000 | ||||
| Florida – 1.8% | ||||||||
| Collier County Health Facilities Authority VRDN for
Cleveland Clinic Health Systems Series 1999 (SPA) (A-1/VMIG1) |
||||||||
| $ 1,000,000 | 4.60 | % | 11/01/2000 | $ 1,000,000 | ||||
| Jacksonville Electric Authority VRDN for Sub Electric
Systems Series 2000 A (SPA) (A-1+/VMIG1) |
||||||||
| 3,800,000 | 4.60 | 11/01/2000 | 3,800,000 | |||||
| $ 4,800,000 | ||||||||
| Idaho – 2.3% | ||||||||
| Idaho Health Facilities Authority RB VRDN for St. Luke’s
Regional Medical Center Series 2000 (A-1+/VMIG1) |
||||||||
| $ 6,200,000 | 4.60 | % | 11/01/2000 | $ 6,200,000 | ||||
| Illinois – 0.6% | ||||||||
| Illinois Health Facilities Authority VRDN for Elmhurst
Memorial Health Series 1998 A (LOC) (VMIG1) |
||||||||
| $ 1,700,000 | 4.65 | % | 11/01/2000 | $ 1,700,000 | ||||
| New York – 0.5% | ||||||||
| New York GO Bonds VRDN Series 1993 A (LOC)
(A-1+/VMIG1) |
||||||||
| $ 1,300,000 | 4.75 | % | 11/01/2000 | $ 1,300,000 | ||||
| Principal
Amount |
Interest
Rate |
Maturity
Date |
Value | |||||
|---|---|---|---|---|---|---|---|---|
| Short-Term Obligations# – (continued) | ||||||||
| Texas – 2.9% | ||||||||
| Harris County Health Facilities VRDN for St. Luke’s
Episcopal Hospital Series 1997 B (SPA) (A-1+) |
||||||||
| $ 6,960,000 | 4.65 | % | 11/01/2000 | $ 6,960,000 | ||||
| North Central Health Facilities Development Corp. RB for
Presbyterian Medical Center Series 1985 D (MBIA) (A-1+/VMIG1) |
||||||||
| 1,000,000 | 4.65 | 11/01/2000 | 1,000,000 | |||||
| $ 7,960,000 | ||||||||
| Wyoming – 1.9% | ||||||||
| Platte County PCRB VRDN for Tri-State Generation
Series 1984 A (LOC) (P1) |
||||||||
| $ 5,100,000 | 4.75 | % | 11/01/2000 | $ 5,100,000 | ||||
| TOTAL SHORT-TERM OBLIGATIONS | ||||||||
| (Cost $30,060,000) | $ 30,060,000 | |||||||
| TOTAL INVESTMENTS | ||||||||
| (Cost $280,658,831) | $ 283,792,755 | |||||||
#
|
Variable rate security. Coupon rate disclosed is that which is in effect at October 31, 2000.
|
°
|
Security is issued with a zero coupon. The interest rate disclosed for this security represents effective yield to maturity.
|
§
|
This security is issued with a zero coupon rate which increases to the stated rate at a set date in the future.
|
| The percentage shown for each investment category reflects the value of investments in that category as a percentage of net assets.
|
| |
| Investment Abbreviations: | |||
| ACA | —Insured by American Capital Access | ||
| AMBAC | —Insured by American Municipal Bond Assurance Corp. | ||
| AMT | —Alternative Minimum Tax | ||
| BAN | —Bond Anticipation Note | ||
| COPS | —Certificates of Participation | ||
| GO | —General Obligation | ||
| IDA | —Industrial Development Authority | ||
| LOC | —Letter of Credit | ||
| MBIA | —Insured by Municipal Bond Investors Assurance | ||
| PCRB | —Pollution Control Revenue Bond | ||
| RB | —Revenue Bond | ||
| SPA | —Stand-by Purchase Agreement | ||
| SPA-FGIC | —Stand-by Purchase Agreement Insured by Financial
Guaranty Insurance Co. |
||
| VRDN | —Variable Rate Demand Note | ||
GOLDMAN SACHS FUND PROFILE
Goldman Sachs Tax-Free Funds
In general, tax-free fixed income investments have the potential to offer more attractive after-tax yields than many taxable fixed income investments.
Goldman Sachs Tax-Free Funds offer investors access to the benefits associated with tax-free investing. The Funds seek high levels of current income exempt from regular federal income tax, primarily through investments in municipal securities.
Target Your Needs
The Goldman Sachs Tax-Free Funds have distinct investment objectives and defined positions on the risk/return spectrum. As your investment objectives change, you can exchange shares within Goldman Sachs Funds without any additional charge.* Please note: in general, greater returns are associated with greater risk.
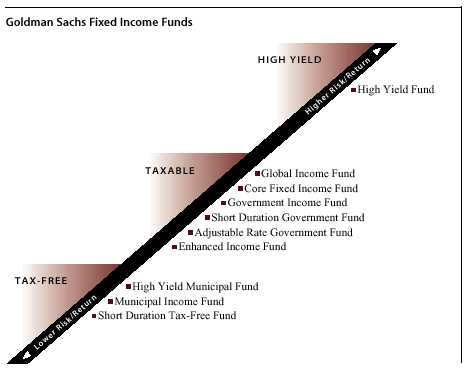
For More Information
To learn more about Goldman Sachs Tax-Free Funds and other Goldman Sachs Funds, call your investment professional today.
*The exchange privilege is subject to termination and its terms are subject to change.

|
|