
|
|
|
|
|
|
|
|
|
GOLDMAN SACHS INTERNATIONAL SMALL CAP FUND
Market Overview
Dear Shareholder:
International equities generated mixed results, as a correction in the technology sector and contrasting country-specific fundamentals impacted the market.
As always, we appreciate your support and we look forward to serving your investment needs in the years to come.
Sincerely,
 |
 |
|
| David B. Ford | David W. Blood | |
| Co-Head, Goldman Sachs Asset Management | Co-Head, Goldman Sachs Asset Management | |
| September 15, 2000 |
GOLDMAN SACHS INTERNATIONAL SMALL CAP FUND
GOLDMAN SACHS INTERNATIONAL SMALL CAP FUND
Fund Basics
as of August 31, 2000
| PERFORMANCE REVIEW | ||||
| August 31, 1999–August 31, 2000 | Fund Total Return (without sales charge)1
|
MSCI EAFE Small Cap2
|
||
| |
||||
| Class A | 26.26 | % | 3.24 | % |
| Class B | 25.66 | 3.24 | ||
| Class C | 25.58 | 3.24 | ||
| Institutional | 27.12 | 3.24 | ||
| Service | 26.57 | 3.24 | ||
| |
||||
1 The net asset value represents the net assets of the Fund (ex-dividend) divided by the total number of shares. The Fund’s performance assumes the reinvestment of dividends and other distributions.
2 The unmanaged MSCI EAFE Small Cap Index, incepted 1/15/98, includes 1,502 securities from 23 developed markets with a capitalization range of $200–$800 million and a general regional allocation of 60% Europe, 30% Japan and 10% Asia. Total returns are calculated without dividends reinvested. The Index figures do not reflect fees or expenses. In addition, investors cannot invest directly in the Index.
| STANDARDIZED TOTAL RETURNS3 | |||||||||||
| For the period ended 6/30/00 | Class A
|
Class B
|
Class C
|
Institutional
|
Service
|
||||||
| |
|||||||||||
| One Year | 28.60 | % | 30.23 | % | 34.39 | % | 37.07 | % | 36.31 | % | |
| Since inception | 23.12 | 24.83 | 25.89 | 27.21 | 26.47 | ||||||
| (5/1/98) | |||||||||||
| |
|||||||||||
3 The Standardized Total Returns are average annual total returns or cumulative total returns (only if the performance period is one year or less) as of the most recent calendar quarter-end. They assume reinvestment of all distributions at net asset value. These returns reflect a maximum initial sales charge of 5.5% for Class A shares, the assumed deferred sales charge for Class B shares (5% maximum declining to 0% after six years) and the assumed deferred sales charge for Class C shares (1% if redeemed within 12 months of purchase). Because Institutional and Service shares do not involve a sales charge, such a charge is not applied to their Standardized Total Returns.
Total return figures represent past performance and do not indicate future results, which will vary. The investment return and principal value of an investment will fluctuate and, therefore, an investor’s shares, when redeemed, may be worth more or less than their original cost. Performance reflects expense limitations in effect. In their absence, performance would be reduced.
| TOP 10 HOLDINGS AS OF 8/31/00 | |||||
| Holding | % of Total Net Assets | Line of Business
|
|||
| |
|||||
| Thiel Logistik AG | 1.7 | % | Computer Software | ||
| Vestas Wind Systems A/S | 1.7 | Energy Resources | |||
| SmartForce PLC ADR | 1.7 | Information Services | |||
| Group 4 Falck A/S | 1.6 | Electrical Equipment | |||
| Guardian IT PLC | 1.5 | Business Services | |||
| Unibail | 1.4 | Real Estate | |||
| Saipem SpA | 1.4 | Energy Resources | |||
| Altran Technologies | 1.3 | Business Services | |||
| Banca Popolare di Milano BPM | 1.2 | Banks | |||
| Matalan PLC | 1.2 | Real Estate | |||
| |
|||||
1
GOLDMAN SACHS INTERNATIONAL SMALL CAP FUND
Performance Overview
Dear Shareholder,
We are pleased to report on the performance of the Goldman Sachs International Small Cap Fund for the one year period that ended August 31, 2000.
Performance Review
Over the one-year period that ended August 31, 2000, the Fund’s Class A, B, C, Institutional and Service share classes produced cumulative total returns, without sales charges, of 26.26%, 25.66%, 25.58%, 27.12% and 26.57%, respectively. These results handily outpaced the 3.24% cumulative total return of the Fund’s benchmark, the Morgan Stanley Capital International (MSCI) Small Cap Europe, Australasia, Far East Index (EAFE).
The Fund’s outperformance during the period was primarily attributable to a significant contribution from regional stock selection.
Portfolio Composition
The Fund’s weightings in each of the three key regions of Japan, Europe and Asia were 32.1%, 53.5% and 7.2%, respectively, as of August 31, 2000. Our objective is to add value more through stock selection within each region. In recent months some of the Fund’s best performance has come from stocks in Europe.
Portfolio Highlights
Key New Acquisitions
In recent months the Fund added holdings in Thiel Logistik AG, which continues to win contracts for advanced logistics solutions, and in Bookham in the semiconductor sector. Both of these holdings have now more than doubled since their initial purchase.
2
GOLDMAN SACHS INTERNATIONAL SMALL CAP FUND

Portfolio Outlook
As we move forward, we will continue to seek fast growing companies at attractive valuations. As in the past, our strategy will aim to identify dynamic organizations either benefiting from a structural change in the market, such as outsourcing of services, or companies operating in a particularly attractive market niche. The Fund’s significant outperformance since its inception indicates the long term strength of our investment process. Looking ahead, we believe that as bond yields further stabilize, the strong growth rates for the companies within the Fund, and their attractive valuations versus other growth stocks, we’ll be well positioned for the longer term. Consequently, we feel that the Fund offers excellent value.
We thank you for your investment and look forward to your continued confidence.
Goldman Sachs International Small Cap Equity Investment Team
London
September 15, 2000
3
GOLDMAN SACHS INTERNATIONAL SMALL CAP FUND
The Goldman Sachs Advantage
Founded in 1869, Goldman, Sachs & Co. is a premier financial services firm traditionally known on Wall Street and around the world for its institutional expertise.
Today, the firm’s Investment Management Division provides individual investors the opportunity to tap the resources of a global institutional powerhouse — and put this expertise to work in their individual portfolios.
What Sets Goldman Sachs Funds Apart

Our portfolio management teams are located on-site, around the world, in New York, London, Tokyo and Singapore. Their understanding of local economies, markets, industries and cultures helps deliver what many investors want: access to global investment opportunities and consistent, risk-adjusted performance.

Our portfolio management teams make on-site visits to hundreds of companies each month, then construct selective portfolios with an emphasis on their best ideas. Our teams also have access to Goldman, Sachs & Co.’s Global Investment Research Department.

In this, our institutional heritage is clear. Institutions, as well as many individual investors, often look to us to manage the risks of global investing over time in different market environments.
To learn more about the Goldman Sachs Funds, call your investment professional today.
4
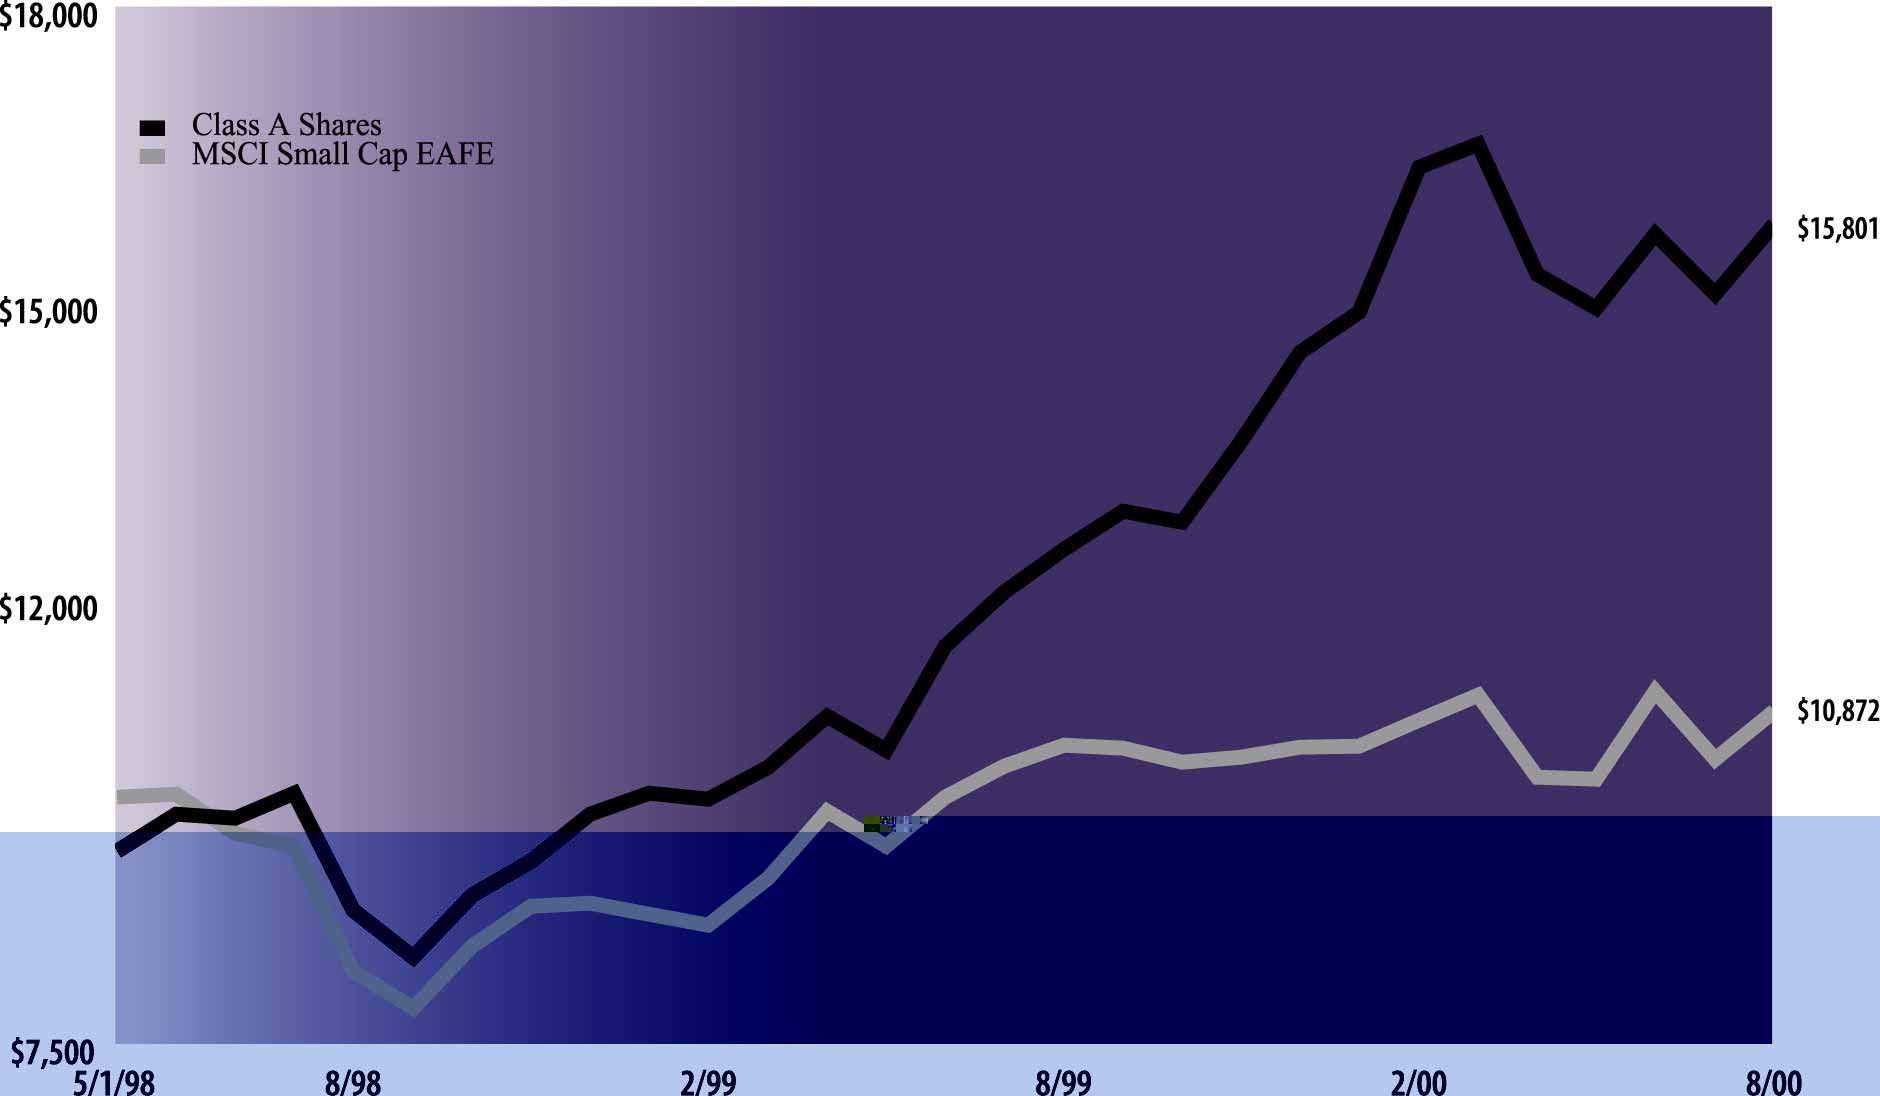
| The following graph shows the value as of August 31, 2000, of a $10,000 investment made on May 1, 1998 (commencement of
operations) in Class A Shares (maximum sales charge of 5.5%) of the Goldman Sachs International Small Cap Fund. For comparative purposes, the performance of the Fund’s benchmarks (Morgan Stanley Capital International EAFE Small Cap Index unhedged
(“MSCI Small Cap EAFE”)) is shown. This performance data represents past performance and should not be considered indicative of future performance which will fluctuate with changes in market conditions. These performance fluctuations will cause
an investor’s shares, when redeemed, to be worth more or less than their original cost. Performance of Class B, Class C, Institutional and Service shares will vary, from Class A due to difference in fees and loads.
|
| International Small Cap Fund’s Lifetime Performance
|
| Growth of a $10,000 Investment, Distributions Reinvested May 1, 1998 to August 31, 2000.
|
| Average Annual Total Return through August 31, 2000 (a) | Since Inception | One Year | |||
|---|---|---|---|---|---|
| Class A | |||||
| Excluding sales charges | 24.56% | 26.26% | |||
| Including sales charges | 21.59% | 19.32% | |||
| Class B | |||||
| Excluding contingent deferred sales charges | 24.11% | 25.66% | |||
| Including contingent deferred sales charges | 23.11% | 20.48% | |||
| Class C | |||||
| Excluding contingent deferred sales charges | 24.07% | 25.58% | |||
| Including contingent deferred sales charges | 24.07% | 24.55% | |||
| Institutional | 25.40% | 27.12% | |||
| Service | 24.69% | 26.57% | |||
(a)
|
Commencement date of operations was May 1, 1998 for all classes.
|
|
Shares |
Description | Value | |||
|---|---|---|---|---|---|
| Common Stock – 90.0% | |||||
| Australia – 1.8% | |||||
| 735,000 | APN News & Media Ltd.
(Publishing) |
$ 2,034,421 | |||
| 609,900 | Fairfax (John) Holdings Ltd.
(Publishing) |
1,790,147 | |||
| 250,000 | Primary Health Care Ltd. (Health) | 834,701 | |||
| 389,400 | QBE Insurance Group Ltd.
(Insurance) |
1,942,336 | |||
| 89,762 | Tab Corp. Holdings Ltd.
(Entertainment) |
509,849 | |||
| 282,177 | Westfield Holdings Ltd. (Real Estate) | 2,017,696 | |||
| 9,129,150 | |||||
| Austria – 0.2% | |||||
| 48,251 | Cybertron Telekom AG
(Telecomunications) |
856,697 | |||
| Denmark – 4.0% | |||||
| 146,193 | DSV, De Sammensluttede
Vognmaend af Series B* (Transportation) |
3,516,892 | |||
| 52,237 | Group 4 Falck A/S (Electrical
Equipment) |
8,180,597 | |||
| 202,104 | Vestas Wind Systems A/S (Energy
Resources) |
8,977,693 | |||
| 20,675,182 | |||||
| Finland – 2.0% | |||||
| 161,480 | Elisa Communications Oyj Series A
(Telecommunications) |
6,135,547 | |||
| 451,886 | JOT Automation Group Oyj
(Industrial Equipment) |
3,092,958 | |||
| 44,674 | Nokian Renkaat Oyj (Auto) | 1,249,270 | |||
| 1,025 | Talentum (Publishing) | 11,556 | |||
| 10,489,331 | |||||
| France – 8.2% | |||||
| 27,581 | Altran Technologies (Business
Services) |
6,527,711 | |||
| 47,017 | Coface (Insurance) | 4,424,371 | |||
| 50,100 | Compagnie Generale de Geophysique
SA* (Energy Resources) |
3,736,008 | |||
| 24,676 | Diosos* (Diversified Industrial
Manufacturing) |
920,057 | |||
| 350,275 | Elior* (Food & Beverage) | 3,793,672 | |||
| 35,585 | FI System* (Business Services) | 2,132,365 | |||
| 27,379 | IPSOS (Media) | 3,660,440 | |||
| 2,666 | Jet Multimedia (Information Services) | 148,868 | |||
| 142,291 | Kalisto Entertainment*
(Entertainment) |
2,475,850 | |||
| 47,747 | Royal Canin SA (Grocery) | 4,611,750 | |||
| 75,560 | SR Teleperformance (Multi-Industry) | 2,951,450 | |||
| 48,457 | Unibail (Real Estate) | 7,356,029 | |||
| 42,738,571 | |||||
|
Shares |
Description | Value | |||
|---|---|---|---|---|---|
| Common Stock – (continued) | |||||
| Germany – 3.3% | |||||
| 40,565 | Allbecon AG (Business Services) | $ 1,206,388 | |||
| 2,480 | Concept! AG* (Internet) | 80,359 | |||
| 40,860 | D. Logistics AG* (Business Services) | 3,888,517 | |||
| 71,075 | Dis Deutscher Industrie (Business
Services) |
2,997,100 | |||
| 37,290 | Intershop Communication AG*
(Computer Software) |
3,393,181 | |||
| 29,280 | Rhoen-Klinikum AG (Health) | 1,258,077 | |||
| 70,482 | Wedeco AG* (Business Services) | 2,408,961 | |||
| 35,667 | Zapf Creaton AG (Entertainment) | 1,899,803 | |||
| 17,132,386 | |||||
| Hong Kong – 2.2% | |||||
| 560,200 | Dah Sing Financial Holdings (Banks) | 2,614,602 | |||
| 903,000 | Dickson Concepts International Ltd.
(Specialty Retail) |
804,699 | |||
| 5,656,000 | Giordano International Ltd. (Specialty
Retail) |
3,172,842 | |||
| 1,520,000 | Hang Lung Development Co. Ltd.
(Real Estate) |
1,413,002 | |||
| 1,254,000 | Legend Holding Ltd. (Electronic
Components) |
1,334,556 | |||
| 542,000 | Li & Fung Ltd. (Wholesale) | 2,362,867 | |||
| 11,702,568 | |||||
| Ireland – 3.0% | |||||
| 1,215,800 | Independent News & Media PLC
(Publishing) |
4,145,983 | |||
| 1,036,092 | Kingspan Group PLC (Construction) | 2,759,373 | |||
| 167,900 | SmartForce PLC ADR* (Information
Services) |
8,730,800 | |||
| 15,636,156 | |||||
| Italy – 5.5% | |||||
| 258,902 | Banca Popolare Commercio e
Industria Ordinary Shares (Banks) |
6,042,502 | |||
| 922,203 | Banca Popolare di Milano BPM
(Banks) |
6,467,619 | |||
| 503,318 | Brembo SpA (Auto) | 4,736,299 | |||
| 375,191 | Gruppo Coin SpA* (Department
Store) |
4,329,986 | |||
| 1,242,041 | Saipem SpA (Energy Resources) | 7,189,096 | |||
| 28,765,502 | |||||
| Japan – 31.8% | |||||
| 67,000 | ABLE, Inc. (Real Estate) | 1,130,802 | |||
| 102,700 | Aderans Co. Ltd. (Specialty Retail) | 4,073,334 | |||
| 205,000 | Alpine Electronics Inc. (Electronics
Equipment) |
3,171,589 | |||
| 150,000 | Amatsuji Steel Ball Manufacturing
Co. Ltd. (Industrial Parts) |
1,378,340 | |||
| 44,000 | ARRK Corp. (Manufacturing) | 2,227,848 | |||
| 6,800 | Bellsystem24, Inc. (Business
Services) |
3,270,886 | |||
| Shares | Description | Value | ||
|---|---|---|---|---|
| Common Stocks – (continued) | ||||
| Japan – (continued) | ||||
| 43,000 | Citizen Electronic (Electrical
Equipment) |
$ 4,475,387 | ||
| 73,000 | Culture Convenience Club Co. Ltd.*
(Specialty Retail) |
1,218,378 | ||
| 257,000 | Daiwa Electronics (Consumer
Durables) |
869,920 | ||
| 85,000 | Eneserve Corp. (Energy Resources) | 3,984,998 | ||
| 52,500 | Enplas Corp. (Electrical Equipment) | 3,312,940 | ||
| 336,000 | Foster Electric Co. Ltd. (Electrical
Equipment) |
2,457,384 | ||
| 45,000 | Fuji Electronics Co. Ltd. (Wholesale) | 898,734 | ||
| 33,700 | Fuji Seal (Heavy Machinery) | 1,722,128 | ||
| 74,800 | Fujimi, Inc. (Diversified Industrial
Manufacturing) |
3,373,540 | ||
| 328,000 | Fujitec Co. Ltd. (Construction) | 3,013,971 | ||
| 204,000 | Fukuda Denshi Co. Ltd. (Health) | 4,016,878 | ||
| 18,000 | Funai Electric Co. Ltd. (Electrical
Equipment) |
2,236,287 | ||
| 15,000 | Funai Electric Co. Ltd. New Shares*
(Electrical Equipment) |
1,863,573 | ||
| 204,700 | Hakuto Co. (Electrical Equipment) | 6,353,090 | ||
| 435,000 | Hitachi Powdered Metals (Mining) | 4,731,364 | ||
| 55 | Intelligence Ltd. (Business Services) | 1,180,966 | ||
| 231,500 | Iuchi Seieido Co. (Electrical
Equipment) |
3,603,282 | ||
| 119,900 | Japan Business Computer Co. Ltd.
(Computer Software) |
3,822,410 | ||
| 171,100 | Japan CBM Corp. (Electrical
Equipment) |
2,406,470 | ||
| 435,000 | Kato Sangyo Co. Ltd. (Food &
Beverage) |
2,651,196 | ||
| 294,000 | Kawasumi Labs, Inc. (Chemicals) | 2,759,438 | ||
| 111,100 | Koekisha Co. Ltd. (Medical
Providers) |
4,791,936 | ||
| 196,900 | Komeri Co. Ltd. (Home Products) | 5,815,612 | ||
| 85,300 | Kuroda Electric Co. Ltd. (Electronics
Equipment) |
2,879,325 | ||
| 288 | Kyoto Kimono Yuzen Co. Ltd.
(Specialty Retail) |
1,755,274 | ||
| 81,000 | Medical Support Co. (Food &
Beverage) |
1,594,937 | ||
| 121,100 | Meitec Corp. (Business Services) | 5,597,966 | ||
| 40,800 | Milbon Co. Ltd. (Consumer Non-
Durables) |
2,677,919 | ||
| 209,500 | Ministop Co. Ltd. (Specialty Retail) | 4,655,556 | ||
| 117,000 | Mirai Industry Co. Ltd. (Multi-
Industry) |
1,481,013 | ||
| 96,000 | Mitta Co. Ltd* (Specialty Retail) | 1,989,311 | ||
| 211,000 | MKC-STAT Corp. (Business
Services) |
5,203,282 | ||
| 76,600 | Nagaileben Co. Ltd. (Apparel) | 1,537,028 | ||
| 266,000 | Nippon Kanzai Co. (Business
Services) |
4,240,038 | ||
| 284,000 | Ogura Clutch Co. Ltd. (Auto) | 2,290,108 | ||
| 30,000 | Otsuka Shokai Co. Ltd. (Computer
Software) |
2,030,942 | ||
| Shares | Description | Value | |||
|---|---|---|---|---|---|
| Common Stocks – (continued) | |||||
| Japan – (continued) | |||||
| 39,000 | OZEKI Co. Ltd. (Grocery) | $ 2,066,104 | |||
| 92,000 | PA Co. Ltd.* (Business Services) | 1,096,409 | |||
| 23,200 | People Co. Ltd. (Health) | 1,651,083 | |||
| 28 | Rakuten Inc. (Specialty Retail) | 774,496 | |||
| 47,400 | Relocation Services Corp. (Real
Estate) |
3,466,667 | |||
| 80,900 | Rock Field Co. Ltd. (Grocery) | 4,172,058 | |||
| 199,900 | Sato Corp. (Electronics Equipment) | 5,023,273 | |||
| 100 | Seikoh Giken Co. Ltd. (Electronics
Equipment) |
64,229 | |||
| 48,100 | Sogo Medical Co. Ltd. (Business
Services) |
771,224 | |||
| 140,600 | Sumitomo Real Estate Sales Co. Ltd.
(Real Estate) |
5,523,807 | |||
| 71,000 | Suruga Co. Ltd. (Consumer Durables) | 3,361,932 | |||
| 77,900 | Taiyo Ink Manufacturing Co. Ltd.
(Chemicals) |
4,557,862 | |||
| 227,700 | Trusco Nakayama (Wholesale) | 3,219,612 | |||
| 306,000 | Uchida Yoko Co. Ltd. (Wholesale) | 1,721,519 | |||
| 2,226 | Yoshinoya D&C Co. Ltd.
(Restaurants) |
3,694,346 | |||
| 165,910,001 | |||||
| Luxembourg – 1.7% | |||||
| 48,347 | Thiel Logistik AG* (Computer
Software) |
9,004,628 | |||
| Netherlands – 2.1% | |||||
| 62,505 | Beter Bed holding NV (Specialty
Retail) |
1,459,356 | |||
| 242,523 | IFCO Systems NV* (Packaging) | 5,081,076 | |||
| 98,831 | Samas Groep NV (Business Services) | 1,337,993 | |||
| 111,689 | Versatel Telecom International NV*
(Telecommunications) |
3,182,777 | |||
| 11,061,202 | |||||
| Norway – 1.2% | |||||
| 48,551 | EDB Business Partner ASA (Business
Services) |
566,498 | |||
| 186,204 | Tomra Systems ASA (Machinery) | 5,534,099 | |||
| 6,100,597 | |||||
| Portugal – 0.4% | |||||
| 469,578 | ParaRede, SGPS* (Information
Services) |
2,251,087 | |||
| Singapore – 3.1% | |||||
| 392,440 | Datacraft Asia Ltd.
(Telecommunications) |
3,296,496 | |||
| 738,000 | DBS Land Ltd. (Real Estate) | 1,192,052 | |||
| 1,506,000 | First Capital Corp. Ltd. (Real Estate) | 1,461,286 | |||
| 390,000 | Overseas Union Bank Ltd. (Banks) | 1,971,414 | |||
| 305,000 | Sembcorp Logistics Ltd.
(Transportation) |
1,913,892 | |||
| 1,375,000 | SIA Engineering Co.* (Airlines) | 1,398,089 | |||
| Shares | Description | Value | |||
|---|---|---|---|---|---|
| Common Stocks – (continued) | |||||
| Singapore – (continued) | |||||
| 84,000 | Singapore Press Holdings Ltd.
(Publishing) |
$ 1,351,926 | |||
| 297,000 | Venture Manufacturing Ltd.
(Electrical Equipment) |
3,796,409 | |||
| 16,381,564 | |||||
| Spain – 3.7% | |||||
| 67,895 | Aldeasa SA (Specialty Retail) | 1,310,955 | |||
| 453,363 | Centros Comerciales Pryca SA
(Grocery) |
6,016,973 | |||
| 153,201 | Promotora de Informaciones SA*
(Media) |
3,665,314 | |||
| 338,790 | Sociedad General de Aguas de
Barcelona SA (Multi-Industry) |
4,240,728 | |||
| 108,413 | Sogecable SA* (Broadcasting) | 3,897,868 | |||
| 19,131,838 | |||||
| Sweden – 2.5% | |||||
| 348,642 | Europolitan Holdings AB
(Telecommunications) |
3,711,786 | |||
| 220,207 | HiQ International AB (Business
Services) |
2,496,043 | |||
| 10,158 | Proffice AB Series B (Business
Services) |
362,640 | |||
| 251,803 | Sifo Group AB Series B (Business
Services) |
3,387,676 | |||
| 906,656 | Swedish Match AB (Tobacco) | 2,929,406 | |||
| 12,887,551 | |||||
| Switzerland – 3.6% | |||||
| 4,017 | Belimo Holding AG (Construction) | 1,729,478 | |||
| 20,382 | Komax Group* (Machinery) | 1,813,553 | |||
| 2,890 | Kudelski SA* (Electrical
Equipment) |
3,865,499 | |||
| 5,145 | Lindt & Spruengli AG (Food &
Beverage) |
2,495,709 | |||
| 14,820 | Logitech International SA*
(Computer Hardware) |
5,010,896 | |||
| 5,662 | Societe Generale wD’Affichage
(Media) |
2,600,230 | |||
| 2,003 | Think Tools AG* (Computer
Software) |
1,067,040 | |||
| 18,582,405 | |||||
| United Kingdom – 9.3% | |||||
| 1,098,056 | Cannons Group PLC (Leisure) | 2,309,141 | |||
| 1,909,244 | Countrywide Assured Group PLC
(Real Estate) |
2,798,211 | |||
| 479,769 | Future Network PLC* (Media) | 5,172,715 | |||
| 322,265 | Guardian IT PLC (Business
Services) |
7,665,071 | |||
| 343,889 | ITNET PLC (Business Services) | 4,588,666 | |||
| 1,113,216 | London Merchant Securities PLC
(Real Estate) |
3,255,008 | |||
| 714,949 | Matalan PLC (Real Estate) | 6,385,585 | |||
| 1,070,367 | N Brown Group PLC (Specialty
Retail) |
4,224,732 | |||
| Shares | Description | Value | |||
|---|---|---|---|---|---|
| Common Stocks – (continued) | |||||
| United Kingdom – (continued) | |||||
| 30,300 | NDS Group PLC ADR* (Internet
Software) |
$ 2,370,975 | |||
| 506,769 | Sero Group (Business Services) | 4,081,320 | |||
| 719,467 | The Berkeley Group PLC
(Construction) |
5,877,828 | |||
| 48,729,252 | |||||
| United States – 0.4% | |||||
| 55,000 | MIH Ltd.* (Media) | 2,055,625 | |||
| TOTAL COMMON STOCKS | |||||
| (Cost $435,446,947) | $ 469,221,293 | ||||
| Preferred Stocks – 1.9% | |||||
| Germany – 1.9% | |||||
| 1,643 | Porsche AG (Auto) | $ 5,659,266 | |||
| 91,260 | Rhoen-Klinikum AG Non-Voting
(Health) |
4,001,384 | |||
| 9,660,650 | |||||
| TOTAL PREFERRED STOCKS | |||||
| (Cost $7,890,480) | $ 9,660,650 | ||||
| Units | Description | Value | |||
| Rights – 0.1% | |||||
| Switzerland – 0.1% | |||||
| 578 | Kudelski SA Rights exp. 09/09/00*
(Electrical Equipment) |
$ 572,359 | |||
| TOTAL RIGHTS | |||||
| (Cost $0) | $ 572,359 | ||||
| Warrants – 0.0% | |||||
| France – 0.0% | |||||
| 3,600 | IPSOS exp. 06/21/03* (Media) | $ 51,135 | |||
| 1,054 | Jet Multimedia exp. 12/31/01*
(Information Services) |
53,334 | |||
| 104,469 | |||||
| TOTAL WARRANTS | |||||
| (Cost $0) | $ 104,469 | ||||
| Principal
Amount |
Interest
Rate |
Maturity
Date |
Value | ||||
|---|---|---|---|---|---|---|---|
| Short-Term Obligation – 6.1% | |||||||
| State Street Bank & Trust Euro – Time Deposit | |||||||
| $31,658,000 | 6.56% | 09/01/2000 | $ 31,658,000 | ||||
| TOTAL SHORT-TERM OBLIGATION | |||||||
| (Cost $31,658,000) | $ 31,658,000 | ||||||
| TOTAL INVESTMENTS | |||||||
| (Cost $474,995,427) | $511,216,771 | ||||||
*
|
Non-income producing security.
|
| The percentage shown for each investment category reflects the value of investments in that category as a percentage of total net
assets.
|
| |
| Investment Abbreviations:
|
| ADR—American Depositary Receipt
|
| |
| As a %
of total net assets |
||||
|---|---|---|---|---|
| Common and Preferred Stock Industry Classifications† | ||||
| Airlines | 0.3 | % | ||
| Apparel | 0.3 | |||
| Auto | 2.7 | |||
| Banks | 3.3 | |||
| Broadcasting | 0.7 | |||
| Business Services | 12.5 | |||
| Chemicals | 1.4 | |||
| Computer Hardware | 1.0 | |||
| Computer Software | 3.7 | |||
| Construction | 2.6 | |||
| Consumer Durables | 0.8 | |||
| Consumer Non-Durables | 0.5 | |||
| Department Store | 0.8 | |||
| Diversified Industrial Manufacturing | 0.8 | |||
| Electrical Equipment | 8.2 | |||
| Electronic Components | 0.3 | |||
| Electronics Equipment | 2.1 | |||
| Energy Resources | 4.6 | |||
| Entertainment | 0.9 | |||
| Food & Beverage | 2.0 | |||
| Grocery | 3.2 | |||
| Health | 2.3 | |||
| Heavy Machinery | 0.3 | |||
| Home Products | 1.1 | |||
| Industrial Equipment | 0.6 | |||
| Industrial Parts | 0.3 | |||
| Information Services | 2.1 | |||
| Insurance | 1.2 | |||
| Internet Software | 0.5 | |||
| Leisure | 0.4 | |||
| Machinery | 1.4 | |||
| Manufacturing | 0.4 | |||
| Media | 3.3 | |||
| Medical Providers | 0.9 | |||
| Mining | 0.9 | |||
| Multi-Industry | 1.7 | |||
| Packaging | 1.0 | |||
| Publishing | 1.8 | |||
| Real Estate | 6.9 | |||
| Restaurants | 0.7 | |||
| Specialty Retail | 4.9 | |||
| Telecommunications | 3.3 | |||
| Tobacco | 0.6 | |||
| Transportation | 1.0 | |||
| Wholesale | 1.6 | |||
| TOTAL COMMON AND PREFERRED STOCK | 91.9 | % | ||
†
|
Industry concentrations greater than one tenth of one percent are disclosed.
|
| Assets: | |||
| Investment in securities, at value (identified cost $474,995,427) | $511,216,771 | ||
| Cash, at value | 249,855 | ||
| Receivables: | |||
| Fund shares sold | 9,055,359 | ||
| Variation margin (a) | 2,212,513 | ||
| Investment securities sold, at value | 1,032,274 | ||
| Reimbursement from investment adviser | 308,889 | ||
| Dividends and interest, at value | 284,897 | ||
| Deferred organization expenses, net | 9,110 | ||
| Other assets, at value | 109,272 | ||
| Total assets | 524,478,940 | ||
| Liabilities: | |||
| Payables: | |||
| Investment securities purchased, at value | 2,336,896 | ||
| Amounts owed to affiliates | 675,138 | ||
| Accrued expenses and other liabilities, at value | 193,012 | ||
| Total liabilities | 3,205,046 | ||
| Net Assets: | |||
| Paid-in capital | 455,064,418 | ||
| Accumulated net realized gain from investment, futures and foreign currency related transactions | 29,485,884 | ||
| Net unrealized gain on investments, futures and translation of assets and liabilities denominated in foreign currencies | 36,723,592 | ||
| NET ASSETS | $521,273,894 | ||
| Net asset value, offering and redemption price per share: (b) | |||
| Class A | $16.12 | ||
| Class B | $15.98 | ||
| Class C | $15.97 | ||
| Institutional | $16.37 | ||
| Service | $16.16 | ||
| Shares outstanding: | |||
| Class A | 20,331,035 | ||
| Class B | 176,944 | ||
| Class C | 229,926 | ||
| Institutional | 11,429,500 | ||
| Service | 156 | ||
| Total shares of beneficial interest outstanding, $.001 par value (unlimited number of shares authorized) | 32,167,561 | ||
(a)
|
Includes approximately $1,013,000 relating to initial margin requirements for futures transactions.
|
(b)
|
Maximum public offering price per share (NAV per share multiplied by 1.0582) for Class A Shares is $17.06. At redemption, Class B
and Class C Shares may be subject to a contingent deferred sales charge, assessed on the amount equal to the lesser of the current net asset value or the original purchase price of the shares.
|
| Investment income: | |||||||||||
| Dividends (a) | $ 2,382,282 | ||||||||||
| Interest | 1,300,982 | ||||||||||
| Total income | 3,683,264 | ||||||||||
| Expenses: | |||||||||||
| Management fees | 3,541,196 | ||||||||||
| Distribution and Service fees (b) | 922,587 | ||||||||||
| Custodian fees | 685,097 | ||||||||||
| Transfer Agent fees (c) | 388,659 | ||||||||||
| Registration fees | 135,615 | ||||||||||
| Professional fees | 45,155 | ||||||||||
| Trustee fees | 8,900 | ||||||||||
| Amortization of deferred organization expenses | 2,284 | ||||||||||
| Other | 112,627 | ||||||||||
| Total expenses | 5,842,120 | ||||||||||
| Less — expense reductions | (505,703 | ) | |||||||||
| Net expenses | 5,336,417 | ||||||||||
| NET INVESTMENT LOSS | (1,653,153 | ) | |||||||||
| Realized and unrealized gain (loss) on investment, futures and foreign currency related transactions: | |||||||||||
| Net realized gain (loss) from: | |||||||||||
| Investment transactions | 34,584,583 | ||||||||||
| Futures transactions | (245,020 | ) | |||||||||
| Foreign currency related transactions | 337,440 | ||||||||||
| Net change in unrealized gain (loss) on: | |||||||||||
| Investments | 16,371,022 | ||||||||||
| Futures | 477,017 | ||||||||||
| Translation of assets and liabilities denominated in foreign currencies | 1,124 | ||||||||||
| Net realized and unrealized gain on investment, futures and foreign currency related transactions | 51,526,166 | ||||||||||
| NET INCREASE IN NET ASSETS RESULTING FROM OPERATIONS | $49,873,013 | ||||||||||
(a)
|
Foreign taxes withheld on dividends were $357,765.
|
(b)
|
Class A, Class B and Class C had Distribution and Service fees of $881,543, $17,389 and $23,655, respectively.
|
(c)
|
Class A, Class B, Class C, Institutional Class and Service Class had Transfer Agent fees of $334,985, $3,304, $4,495, $45,874 and
$1, respectively.
|
| For the
Year Ended August 31, 2000 |
For the
Seven Months Ended August 31, 1999 |
For the
Period Ended January 31, 1999 (a) |
||||||||
|---|---|---|---|---|---|---|---|---|---|---|
| From operations: | ||||||||||
| Net investment loss | $ (1,653,153 | ) | $ (173,328 | ) | $ (147,894 | ) | ||||
| Net realized gain from investment, futures and foreign currency related
transactions |
34,677,003 | 3,660,821 | 232,160 | |||||||
| Net change in unrealized gain on investments, futures and translation of assets and
liabilities denominated in foreign currencies |
16,849,163 | 17,316,915 | 2,557,514 | |||||||
| Net increase in net assets resulting from operations | 49,873,013 | 20,804,408 | 2,641,780 | |||||||
| Distributions to shareholders: | ||||||||||
| In excess of net investment income | ||||||||||
| Class A Shares | — | — | — | |||||||
| Class B Shares | — | — | — | |||||||
| Class C Shares | — | — | — | |||||||
| Institutional Shares | — | (3,921 | ) | (21,659 | ) | |||||
| Service Shares | — | — | — | |||||||
| From net realized gains | ||||||||||
| Class A Shares | (3,818,699 | ) | — | — | ||||||
| Class B Shares | (23,470 | ) | — | — | ||||||
| Class C Shares | (31,640 | ) | — | — | ||||||
| Institutional Shares | (3,219,751 | ) | — | — | ||||||
| Service Shares | (79 | ) | — | — | ||||||
| Total distributions to shareholders | (7,093,639 | ) | (3,921 | ) | (21,659 | ) | ||||
| From share transactions: | ||||||||||
| Proceeds from sales of shares | 421,373,628 | 58,890,454 | 81,743,079 | |||||||
| Reinvestment of dividends and distributions | 4,607,275 | 2,349 | 8,522 | |||||||
| Cost of shares repurchased | (83,439,939 | ) | (14,124,187 | ) | (13,987,269 | ) | ||||
| Net increase in net assets resulting from share transactions | 342,540,964 | 44,768,616 | 67,764,332 | |||||||
| TOTAL INCREASE | 385,320,338 | 65,569,103 | 70,384,453 | |||||||
| Net assets: | ||||||||||
| Beginning of period | 135,953,556 | 70,384,453 | — | |||||||
| End of period | $521,273,894 | $135,953,556 | $70,384,453 | |||||||
| Accumulated net investment loss | $ — | $ — | $ (106,697 | ) | ||||||
(a)
|
Commencement date of operations was May 1, 1998 for all share classes.
|
| 1. ORGANIZATION
|
| Goldman Sachs Trust (the “Trust”) is a Delaware business trust registered under the Investment Company Act of 1940 (as
amended) as an open-end, management investment company. The Trust includes the Goldman Sachs International Small Cap Fund (the “Fund”). The Fund is a diversified portfolio offering five classes of shares — Class A, Class B, Class
C, Institutional and Service.
|
| 2. SIGNIFICANT ACCOUNTING POLICIES
|
| The following is a summary of the significant accounting policies consistently followed by the Fund. The preparation of financial
statements in conformity with generally accepted accounting principles requires management to make estimates and assumptions that may affect the reported amounts. Actual results could differ from those estimates. Effective for fiscal year 1999, the Board
of Trustees approved a change in the fiscal year end of the Fund from January 31 to August 31. Accordingly, the Statements of Changes in Net Assets, Summary of Share Transactions, and Financial Highlights of the Fund are included for the seven months
ended August 31, 1999 and the year ended January 31, 1999.
|
| A. Investment Valuation — Investments in
securities traded on a U.S. or foreign securities exchange or the NASDAQ system are valued daily at their last sale price on the principal exchange on which they are traded. If no sale occurs, securities are valued at the last bid price. Debt securities
are valued at prices supplied by independent pricing services, broker/dealer-supplied valuations or matrix pricing systems. Unlisted equity and debt securities for which market quotations are available are valued at the last sale price on valuation date,
or if no sale occurs at the last bid price. Short-term debt obligations maturing in sixty days or less are valued at amortized cost, which approximates market value. Securities for which quotations are not readily available are valued at fair value using
methods approved by the Board of Trustees of the Trust.
|
| B. Security Transactions and Investment Income — Security transactions are recorded as of the trade date. Realized gains and losses on sales of portfolio securities are calculated using the identified-cost basis. Dividend income is recorded on the ex-dividend date, net of foreign withholding taxes
where applicable. Dividends for which the Fund has the choice to receive either cash or stock are recognized as investment income in an amount equal to the cash dividend. Interest income is recorded on the basis of interest accrued, premium amortized and
discount earned.
|
| Net investment income (other than class specific expenses) and unrealized and
realized gains or losses are allocated daily to each class of the Fund based upon the relative proportion of net assets.
|
| C. Federal Taxes — It is the Fund’s
policy to comply with the requirements of the Internal Revenue Code applicable to regulated investment companies and to distribute each year substantially all of its investment company taxable income and capital gains to its shareholders. Accordingly, no
federal tax provision is required. Income and capital gains distributions, if any, are declared and paid annually.
|
| The characterization of distributions to shareholders for financial reporting
purposes is determined in accordance with income tax rules. Therefore, the source of the Fund’s distributions may be shown in the accompanying financial statements as either from or in excess of net investment income or net realized gain on
investment transactions, or from paid-in capital, depending on the type of book/tax differences that may exist.
|
| At August 31, 2000, the aggregate cost of portfolio securities for federal income
tax purposes is $476,252,872. Accordingly, the gross unrealized gain on investments was $63,977,182 and the gross unrealized loss on investments was $29,013,283 resulting in a net unrealized gain of $34,963,899.
|
| D. Expenses — Expenses incurred by the
Trust which do not specifically relate to an individual Fund of the Trust are allocated to the Funds based on a straight-line or pro rata basis depending upon the nature of the expense.
|
| 2. SIGNIFICANT ACCOUNTING POLICIES (continued)
|
| Class A, Class B and Class C Shares bear all expenses and fees relating to their
respective Distribution and Service Plans. Shareholders of Service Shares bear all expenses and fees paid to service organizations. Each class of shares separately bears its respective class-specific Transfer Agency fees.
|
| E. Deferred Organization Expenses —
Organization-related costs are amortized on a straight-line basis over a period of five years.
|
| F. Foreign Currency Translations — The
books and records of the Fund are maintained in U.S. dollars. Amounts denominated in foreign currencies are translated into U.S. dollars on the following basis: (i) investment valuations, foreign currency and other assets and liabilities initially
expressed in foreign currencies are converted each business day into U.S. dollars based on current exchange rates; (ii) purchases and sales of foreign investments, income and expenses are converted into U.S. dollars based on currency exchange rates
prevailing on the respective dates of such transactions.
|
| Net realized and unrealized gain (loss) on foreign currency transactions will
represent: (i) foreign exchange gains and losses from the sale and holdings of foreign currencies; (ii) currency gains and losses between trade date and settlement date on investment securities transactions and forward exchange contracts; and (iii) gains
and losses from the difference between amounts of dividends, interest and foreign withholding taxes recorded and the amounts actually received.
|
| G. Segregation Transactions — The Fund may
enter into certain derivative transactions to seek to increase total return. Forward foreign currency exchange contracts, futures contracts, written options, when-issued securities and forward commitments represent examples of such transactions. As a
result of entering into those transactions, the Fund is required to segregate liquid assets on the accounting records equal to or greater than the market value of the corresponding transactions.
|
| 3. AGREEMENTS
|
| Pursuant to the Investment Management Agreement (the “Agreement”), Goldman Sachs Asset Management International (“
GSAMI”), an affiliate of Goldman, Sachs & Co. (“Goldman Sachs”), serves as the investment adviser to the Fund. Under the Agreement, GSAMI, subject to the general supervision of the Trust’s Board of Trustees, manages the Fund’s
portfolio. As compensation for the services rendered under the Agreement, the assumption of the expenses related thereto and administering the Fund’s business affairs, including providing facilities, GSAMI is entitled to a fee, computed daily and
payable monthly, at an annual rate equal to 1.20% of the average daily net assets of the Fund.
|
| The investment adviser has voluntarily agreed to limit certain “Other
Expenses” (excluding Management fees, Distribution and Service fees, Transfer Agent fees, taxes, interest, brokerage, litigation, Service Share fees, indemnification costs and other extraordinary expenses) to the extent such expenses exceed, on an
annual basis, 0.16% of the average daily net assets of the Fund. For the year ended August 31, 2000, the adviser reimbursed approximately $501,000. In addition, the Fund has entered into certain offset arrangements with the custodian resulting in a
reduction in the Fund’s expenses. For the year ended August 31, 2000, Custody fees were reduced by approximately $5,000.
|
| The Trust, on behalf of the Fund, has adopted Distribution and Service Plans.
Under the Distribution and Service Plans, Goldman Sachs and/or authorized dealers are entitled to a monthly fee from the Fund for distribution and shareholder maintenance services equal, on an annual basis, to 0.50%, 1.00% and 1.00% of the Fund’s
average daily net assets attributable to Class A, Class B and Class C Shares, respectively.
|
| Goldman Sachs serves as the distributor of shares of the Fund pursuant to a
Distribution Agreement. Goldman Sachs may receive a portion of the Class A sales load and Class B and Class C contingent deferred sales charges and has advised the Fund that it retained approximately $2,168,000 for the year ended August 31, 2000.
|
| 3. AGREEMENTS (continued)
|
| Goldman Sachs also serves as the transfer agent of the Fund for a fee. The fees
charged for such transfer agency services are calculated daily and payable monthly at an annual rate as follows: 0.19% of average daily net assets for Class A, Class B and Class C Shares and 0.04% of average daily net assets for Institutional and Service
Shares.
|
| The Trust, on behalf of the Fund, has adopted a Service Plan. This Plan allows for
Service Shares to compensate service organizations for providing varying levels of account administration and shareholder liaison services to their customers who are beneficial owners of such shares. The Service Plan provides for compensation to the
service organizations in an amount up to 0.50% (on an annualized basis), of the average daily net asset value of the Service Shares.
|
| As of August 31, 2000, the amounts owed to affiliates were approximately $487,000,
$133,000 and $55,000 for Management, Distribution and Service, and Transfer Agent fees, respectively.
|
| 4. PORTFOLIO SECURITIES TRANSACTIONS
|
| Purchases and proceeds of sales or maturities of securities (excluding short-term
investments and futures) for the year ended August 31, 2000, were $513,837,934 and $202,918,134, respectively. For the year ended August 31, 2000, Goldman Sachs earned approximately $3,000 of brokerage commissions from portfolio transactions, including
futures transactions executed on behalf of the Fund.
|
| Forward Foreign Currency Exchange Contracts — The
Fund may enter into forward foreign currency exchange contracts for the purchase or sale of a specific foreign currency at a fixed price on a future date as a hedge or cross-hedge against either specific transactions or portfolio positions. The Fund may
also purchase and sell such contracts to seek to increase total return. All commitments are “marked-to-market” daily at the applicable translation rates and any resulting unrealized gains or losses are recorded in the Fund’s financial
statements. The Fund realizes gains or losses at the time a forward contract is offset by entry into a closing transaction or extinguished by delivery of the currency. Risks may arise upon entering these contracts from the potential inability of
counterparties to meet the terms of their contracts and from unanticipated movements in the value of a foreign currency relative to the U.S. dollar. At August 31, 2000, the Fund had no open forward foreign exchange contracts.
|
| Futures Contracts — The Fund may enter into futures
transactions to hedge against changes in interest rates, securities prices, currency exchange rates or to seek to increase total return. Upon entering into a futures contract, the Fund is required to deposit with a broker or the Fund’s custodian
bank, an amount of cash or securities equal to the minimum “initial margin” requirement of the associated futures exchange. Subsequent payments for futures contracts (“variation margin”) are paid or received by the Fund, depending on
the fluctuations in the value of the contracts, and are recorded for financial reporting purposes as unrealized gains or losses. When contracts are closed, the Fund realizes a gain or loss which is reported in the Statement of Operations.
|
| The use of futures contracts involve, to varying degrees, elements of market risk
which may exceed the amounts recognized in the Statement of Assets and Liabilities. Changes in the value of the futures contract may not directly correlate with changes in the value of the underlying securities. This risk may decrease the effectiveness of
the Fund’s hedging strategies and potentially result in a loss.
|
| At August 31, 2000 the following futures contracts were open as follows:
|
| Type | Number of
Contracts Long |
Settlement
Month |
Market
Value |
Unrealized
Gain |
|||||
|---|---|---|---|---|---|---|---|---|---|
| FTSE 100 | 199 | Sep-00 | $19,312,875 | $504,809 | |||||
| $504,809 | |||||||||
| 5. LINE OF CREDIT FACILITY
|
| Effective May 31, 2000, the Fund participates in a $350,000,000 committed, unsecured revolving line of credit facility. Prior
thereto, the Fund participated in a $250,000,000 uncommitted and a $250,000,000 committed, unsecured revolving line of credit facility. Under the most restrictive arrangement, the Fund must own securities having a market value in excess of 400% of the
total bank borrowings. This facility is to be used solely for temporary or emergency purposes. The interest rate on borrowings is based on the Federal Funds rate. The committed facility also requires a fee to be paid by the Fund based on the amount of the
commitment which has not been utilized. During the year ended August 31, 2000, the Fund did not have any borrowings under any of these facilities.
|
| 6. CHANGE IN INDEPENDENT ACCOUNTANTS
|
| On October 26, 1999 the Board of Trustees of the Fund, upon the recommendation of the Board’s audit committee, determined not
to retain Arthur Andersen LLP and approved a change of the Fund’s independent accountants to PricewaterhouseCoopers LLP. For the period ended August 31, 1999 and the fiscal year ended January 31, 1999, Arthur Andersen LLP’s audit reports
contained no adverse opinion or disclaimer of opinion; nor were their reports qualified or modified as to uncertainty, audit scope, or accounting principles. Further, there were no disagreements between the Fund and Arthur Andersen LLP on accounting
principles or practices, financial statement disclosure or audit scope or procedure, which if not resolved to the satisfaction of Arthur Andersen LLP would have caused them to make reference to the disagreement in their report.
|
| 7. CERTAIN RECLASSIFICATIONS
|
| In accordance with statement of position 93-2, the Fund has reclassified $1,650,869 and $2,284 from accumulated net investment
gain and paid-in capital, respectively to accumulated net investment loss. This reclassification has no impact on the net asset value of the Fund and is designed to present the Fund’s capital accounts on a tax basis. Reclassifications result
primarily from the difference in the tax treatment of foreign currency, net operating losses and organization costs.
|
| 8. SUMMARY OF SHARE TRANSACTIONS
|
| Share activity for the:
|
| For the
Year Ended August 31, 2000 |
For the
Seven Months Ended August 31, 1999 |
For the
Period Ended January 31, 1999 (a) |
|||||||||||||||||
|---|---|---|---|---|---|---|---|---|---|---|---|---|---|---|---|---|---|---|---|
| Shares | Dollars | Shares | Dollars | Shares | Dollars | ||||||||||||||
| Class A Shares | |||||||||||||||||||
| Shares sold | 19,003,047 | $297,708,611 | 2,607,810 | $32,403,673 | 3,789,828 | $39,461,070 | |||||||||||||
| Reinvestment of dividends and
distributions |
157,580 | 2,229,751 | — | — | — | — | |||||||||||||
| Shares repurchased | (4,075,523 | ) | (64,277,773 | ) | (470,755 | ) | (5,480,465 | ) | (680,952 | ) | (6,496,553 | ) | |||||||
| 15,085,104 | 235,660,589 | 2,137,055 | 26,923,208 | 3,108,876 | 32,964,517 | ||||||||||||||
| Class B Shares | |||||||||||||||||||
| Shares sold | 204,200 | 3,281,798 | 6,837 | 79,235 | 24,738 | 250,752 | |||||||||||||
| Reinvestment of dividends and
distributions |
1,259 | 17,723 | — | — | — | — | |||||||||||||
| Shares repurchased | (51,476 | ) | (813,483 | ) | (3,975 | ) | (41,451 | ) | (4,639 | ) | (43,306 | ) | |||||||
| 153,983 | 2,486,038 | 2,862 | 37,784 | 20,099 | 207,446 | ||||||||||||||
| Class C Shares | |||||||||||||||||||
| Shares sold | 654,778 | 10,258,693 | 21,336 | 268,279 | 19,740 | 196,453 | |||||||||||||
| Reinvestment of dividends and
distributions |
2,170 | 30,550 | — | — | — | — | |||||||||||||
| Shares repurchased | (458,758 | ) | (7,319,550 | ) | (6,059 | ) | (68,915 | ) | (3,281 | ) | (32,610 | ) | |||||||
| 198,190 | 2,969,693 | 15,277 | 199,364 | 16,459 | 163,843 | ||||||||||||||
| Institutional Shares | |||||||||||||||||||
| Shares sold | 7,042,187 | 110,124,526 | 2,231,140 | 26,139,267 | 4,172,165 | 41,833,210 | |||||||||||||
| Reinvestment of dividends and
distributions |
162,879 | 2,329,172 | 183 | 2,349 | 851 | 8,522 | |||||||||||||
| Shares repurchased | (703,368 | ) | (11,028,965 | ) | (773,017 | ) | (8,533,356 | ) | (703,520 | ) | (7,414,800 | ) | |||||||
| 6,501,698 | 101,424,733 | 1,458,306 | 17,608,260 | 3,469,496 | 34,426,932 | ||||||||||||||
| Service Shares | |||||||||||||||||||
| Shares sold | — | — | — | — | 161 | 1,594 | |||||||||||||
| Reinvestment of dividends and
distributions |
6 | 79 | — | — | — | — | |||||||||||||
| Shares repurchased | (11 | ) | (168 | ) | — | — | — | — | |||||||||||
| (5 | ) | (89 | ) | — | — | 161 | 1,594 | ||||||||||||
| NET INCREASE | 21,938,970 | $342,540,964 | 3,613,500 | $44,768,616 | 6,615,091 | $67,764,332 | |||||||||||||
(a)
|
The Fund commenced operations on May 1, 1998 for all share classes.
|
| Goldman Sachs International Small Cap Fund — Tax Information (unaudited)
|
| For the distribution paid during the year ended August 31, 2000, the total amount of
income received by the International Small Cap Equity Fund from sources within foreign countries and possessions of the United States was $0.0403 per share all of which is attributable to qualified passive income. The total amount of taxes paid by the
Fund to such countries was $0.0060 per share. A separate notice containing the country by country components of these totals has been previously mailed to the shareholders.
|
| Income from
investment operations |
Distributions to shareholders |
|||||||||||||||||||
|---|---|---|---|---|---|---|---|---|---|---|---|---|---|---|---|---|---|---|---|---|
| Net asset
value, beginning of period |
Net
investment loss |
Net realized
and unrealized gain |
Total
income from investment operations |
In excess
of net investment income |
From net
realized gains |
Total
distributions |
||||||||||||||
| FOR THE YEAR ENDED AUGUST 31, | ||||||||||||||||||||
| 2000 - Class A Shares | $13.24 | $(0.12 | ) (c) | $3.52 | $3.40 | $ — | $(0.52 | ) | $(0.52 | ) | ||||||||||
| 2000 - Class B Shares | 13.19 | (0.18 | ) (c) | 3.49 | 3.31 | — | (0.52 | ) | (0.52 | ) | ||||||||||
| 2000 - Class C Shares | 13.19 | (0.19 | ) (c) | 3.49 | 3.30 | — | (0.52 | ) | (0.52 | ) | ||||||||||
| 2000 - Institutional Shares | 13.35 | (0.03 | ) (c) | 3.57 | 3.54 | — | (0.52 | ) | (0.52 | ) | ||||||||||
| 2000 - Service Shares | 13.24 | (0.10 | ) (c) | 3.54 | 3.44 | — | (0.52 | ) | (0.52 | ) | ||||||||||
| FOR THE SEVEN-MONTH PERIOD ENDED AUGUST 31, | ||||||||||||||||||||
| 1999 - Class A Shares | 10.62 | (0.03 | ) | 2.65 | 2.62 | — | — | — | ||||||||||||
| 1999 - Class B Shares | 10.61 | (0.08 | ) (c) | 2.66 | 2.58 | — | — | — | ||||||||||||
| 1999 - Class C Shares | 10.61 | (0.08 | ) (c) | 2.66 | 2.58 | — | — | — | ||||||||||||
| 1999 - Institutional Shares | 10.66 | — | 2.69 | 2.69 | — | — | — | |||||||||||||
| 1999 - Service Shares | 10.61 | (0.02 | ) | 2.65 | 2.63 | — | — | — | ||||||||||||
| FOR THE PERIOD ENDED JANUARY 31, | ||||||||||||||||||||
| 1999 - Class A Shares (commenced May 1, 1998) | 10.00 | (0.04 | ) | 0.66 | 0.62 | — | — | — | ||||||||||||
| 1999 - Class B Shares (commenced May 1, 1998) | 10.00 | (0.10 | ) | 0.71 | 0.61 | — | — | — | ||||||||||||
| 1999 - Class C Shares (commenced May 1, 1998) | 10.00 | (0.06 | ) | 0.67 | 0.61 | — | — | — | ||||||||||||
| 1999 - Institutional Shares (commenced May 1, 1998) | 10.00 | — | 0.67 | 0.67 | (0.01 | ) | — | (0.01 | ) | |||||||||||
| 1999 - Service Shares (commenced May 1, 1998) | 10.00 | (0.02 | ) | 0.63 | 0.61 | — | — | — | ||||||||||||
(a)
|
Assumes investment at the net asset value at the beginning of the period, reinvestment of all dividends and distributions, a
complete redemption of the investment at the net asset value at the end of the period and no sales or redemption charges. Total return would be reduced if a sales or redemption charge were taken into account. Total returns for periods less than one full
year are not annualized.
|
(b)
|
Annualized.
|
(c)
|
Calculated based on the average shares outstanding methodology.
|
|
Ratios assuming no expense reductions |
|||||||||||||||||||||
|---|---|---|---|---|---|---|---|---|---|---|---|---|---|---|---|---|---|---|---|---|---|
| Net asset
value, end of period |
Total
return (a) |
Net assets
at end of period (in 000s) |
Ratio of net expenses to
average net assets |
Ratio of
net investment loss to average net assets |
Ratio of
expenses to average net assets |
Ratio of
net investment loss to average net assets |
Portfolio
turnover rate |
||||||||||||||
| $16.12 | 26.26 | % | $327,697 | 2.05 | % | (0.79 | )% | 2.22 | % | (0.96 | )% | 73.43 | % | ||||||||
| 15.98 | 25.66 | 2,827 | 2.55 | (1.16 | ) | 2.72 | (1.33 | ) | 73.43 | ||||||||||||
| 15.97 | 25.58 | 3,672 | 2.55 | (1.23 | ) | 2.72 | (1.40 | ) | 73.43 | ||||||||||||
| 16.37 | 27.12 | 187,075 | 1.40 | (0.19 | ) | 1.57 | (0.36 | ) | 73.43 | ||||||||||||
| 16.16 | 26.57 | 3 | 1.90 | (0.63 | ) | 2.07 | (0.80 | ) | 73.43 | ||||||||||||
| 13.24 | 24.67 | 69,458 | 2.05 | (b) | (0.68 | ) (b) | 2.42 | (b) | (1.05 | ) (b) | 58.81 | ||||||||||
| 13.19 | 24.32 | 303 | 2.55 | (b) | (1.16 | ) (b) | 2.92 | (b) | (1.53 | ) (b) | 58.81 | ||||||||||
| 13.19 | 24.32 | 419 | 2.55 | (b) | (1.21 | ) (b) | 2.92 | (b) | (1.58 | ) (b) | 58.81 | ||||||||||
| 13.35 | 25.24 | 65,772 | 1.40 | (b) | (0.05 | ) (b) | 1.77 | (b) | (0.42 | ) (b) | 58.81 | ||||||||||
| 13.24 | 24.79 | 2 | 1.90 | (b) | (0.35 | ) (b) | 2.27 | (b) | (0.72 | ) (b) | 58.81 | ||||||||||
| 10.62 | 6.20 | 33,002 | 2.02 | (b) | (1.03 | ) (b) | 3.60 | (b) | (2.61 | ) (b) | 96.11 | ||||||||||
| 10.61 | 6.10 | 213 | 2.51 | (b) | (1.30 | ) (b) | 4.09 | (b) | (2.88 | ) (b) | 96.11 | ||||||||||
| 10.61 | 6.10 | 175 | 2.51 | (b) | (1.45 | ) (b) | 4.09 | (b) | (3.03 | ) (b) | 96.11 | ||||||||||
| 10.66 | 6.67 | 36,992 | 1.40 | (b) | (0.19 | ) (b) | 2.98 | (b) | (1.77 | ) (b) | 96.11 | ||||||||||
| 10.61 | 6.10 | 2 | 1.90 | (b) | (0.26 | ) (b) | 3.48 | (b) | (1.84 | ) (b) | 96.11 | ||||||||||
| To the Shareholders and Board of Trustees of
Goldman Sachs Trust — International Small Cap Fund: |
| In our opinion, the accompanying statement of assets and liabilities, including the statement of investments, and the related
statements of operations and of changes in net assets and the financial highlights present fairly, in all material respects, the financial position of Goldman Sachs International Small Cap Fund (“the Fund”), one of the portfolios constituting
Goldman Sachs Trust, at August 31, 2000, the results of its operations, the changes in its net assets and the financial highlights for the year then ended, in conformity with accounting principles generally accepted in the United States of America. These
financial statements and financial highlights (hereafter referred to as “financial statements”) are the responsibility of the Fund’s management; our responsibility is to express an opinion on these financial statements based on our audit.
We conducted our audit of these financial statements in accordance with auditing standards generally accepted in the United States of America, which require that we plan and perform the audit to obtain reasonable assurance about whether the financial
statements are free of material misstatement. An audit includes examining, on a test basis, evidence supporting the amounts and disclosures in the financial statements, assessing the accounting principles used and significant estimates made by management,
and evaluating the overall financial statement presentation. We believe that our audit, which included confirmation of securities at August 31, 2000 by correspondence with the custodian and brokers, provides a reasonable basis for our opinion. The
statements of changes in net assets and financial highlights of the Fund for the periods ended August 31, 1999 and January 31, 1999 were audited by other independent accountants whose report dated October 8, 1999 expressed an unqualified opinion thereon.
|
| PricewaterhouseCoopers LLP
|
| Boston, Massachusetts
|
| October 23, 2000
|
GOLDMAN SACHS FUND PROFILE
Goldman Sachs
International Small Cap Fund
An Investment Idea for the Long Term
History has shown that a long-term plan that includes international stocks can help provide greater protection against market volatility over time than a portfolio that invests only in U.S. stocks.
Goldman Sachs International Small Cap Fund provides investors access to the benefits associated with international investing. The Fund seeks long-term capital growth, primarily through equity securities of smaller capitalization companies located outside of the United States.
Target Your Needs
The Goldman Sachs International Small Cap Fund has a distinct investment objective and a defined place on the risk/return spectrum. As your investment objectives change, you can exchange shares within Goldman Sachs Funds without any additional charge.* (Please note: in general, greater returns are associated with greater risk.)
For More Information
To learn more about the Goldman Sachs International Small Cap Fund and other Goldman Sachs Funds, call your investment professional today.
*The exchange privilege is subject to termination and its terms are subject to change.
|
|